Valuation of Johnson Adhesives: A Simulation - bizvalblog · PDF file28.07.2012 ·...
52
RUNNING HEAD: ACG 6935 Semester Project – Pearl & Pierce 1 SEMESTER PROJECT: BUSINESS VALUATION OF JOHNSON ADHESIVES, INC. RACHEL PEARL KYLE PIERCE ACG 6935 PROFESSOR MICHAEL CRAIN SUMMER 2012
Transcript of Valuation of Johnson Adhesives: A Simulation - bizvalblog · PDF file28.07.2012 ·...
RUNNINGHEAD:ACG6935SemesterProject–Pearl&Pierce
1
SEMESTERPROJECT:
BUSINESSVALUATIONOFJOHNSONADHESIVES,INC.
RACHELPEARLKYLEPIERCE
ACG6935
PROFESSORMICHAELCRAINSUMMER2012
RUNNINGHEAD:ACG6935SemesterProject–Pearl&Pierce
2
BizVals,Inc.11ApolloLandingDrive
Orlando,FloridaJuly28,2012
LawyersofMs.SusanJohnsonUnitedLawGroup,Inc.1492OceanBlueBoulevardBocaRaton,Florida
ToTheLawyersofMs.SusanJohnson:
Asrequested,wehavecompletedavaluationengagement,asdefinedintheStatementonStandardsforValuationServices(SSVS)bytheAmericanInstituteofCertifiedPublicAccountants(AICPA),ofthecommonstockofJohnsonAdhesives,Inc.(JAorthe“Company”)asofDecember31,2011.ThepurposeofthisvaluationissolelytoassistintheequitabledistributionofassetsforthematterofJohnsonv.Johnson.Allotherpartiesareforbiddenuseoftheinformationprovidedinthisvaluationengagement,forallotherpurposeswithoutourwrittenconsent.Theresultingestimateofvaluedeterminedbythisvaluationengagementwillbeconveyedasaconclusionofvalue.
Enclosed,isaconclusionofvalueandsummaryreport,titledSemesterProject:BusinessValuationofJohnsonAdhesives,Inc.,whichwillapplyrelevantdataandbusinessvaluationapproachesandmethodstodeterminethefairmarketvalueofMr.FrankJohnson’s55%ownershipinterestofJA,asofDecember31,2011.UsingdataprovidedtousbythelawyersofMs.SusanJohnsonaswellasinformationderivedfromvariouspubliclyavailablesources,thefollowingtopicswillbeanalyzedwithprofessionaljudgment,competenceandskepticism:
Economy, Industry, FinancialStatements,and ApproachestoValue.
OurfindingshavedeterminedtheestimatedvalueofMr.FrankJohnson’s55%ownershipinterestinJAtobe$16,500,000,whichequatesto$30,000.00pershare.ThisvaluationengagementwasconductedinaccordancewithSSVS,U.S.TreasuryRevenueRulings,aswellasothervariousgenerallyacceptedaccountingprinciplesandstandardsforbusinessvaluations.Inaddition,thisvaluationandreportistobeusedonlyasofthisvaluationdate,December31,2011,andisnotvalidforanyotherdate.Lastly,wepossessnoobligationtoupdatethisreportorourconclusionofvalueforanyinformationthatcomestoourattentionfollowingthisdate.

RUNNINGHEAD:ACG6935SemesterProject–Pearl&Pierce
3
Ifthereareanyquestionsorconcernspleasedonothesitatetocontactanyofourassociates.Thankyou.
Sincerely,
BizVals, Inc. BizVals,Inc.
RUNNINGHEAD:ACG6935SemesterProject–Pearl&Pierce
4
TABLEOFCONTENTS
Introduction................................................................................................................................................................6 OverviewofJohnsonAdhesives,Inc............................................................................................................6 AssignmentDescription....................................................................................................................................7 ScopeofWork........................................................................................................................................................8 SourcesofInformationUtilized.....................................................................................................................8 RevenueRuling59‐60........................................................................................................................................9 AssumptionsandLimitingConditions.....................................................................................................10
EconomicAnalysis................................................................................................................................................11 GlobalEconomy.................................................................................................................................................12 NationalEconomy.............................................................................................................................................12 IndustryEconomy............................................................................................................................................13 RisktotheCompany........................................................................................................................................14 SlowedDemand............................................................................................................................................14 CapacityUtilization.....................................................................................................................................15 RawMaterial&SupplyShortage...........................................................................................................15
Conclusion............................................................................................................................................................15
IndustryAnalysis...................................................................................................................................................16 ThreatofNewEntrants–Moderate(2Rating)...................................................................................17 BargainingPowerofBuyers–High(3Rating)....................................................................................17 BargainingPowerofSuppliers–High(3Rating)...............................................................................18 AvailabilityofSubstitutes–Low(1rating)...........................................................................................18 CompetitiveRivalry–High(3rating)......................................................................................................19 Conclusion............................................................................................................................................................19
FinancialStatementAnalysis...........................................................................................................................20 IncomeStatementAnalysis..........................................................................................................................21 Revenues..........................................................................................................................................................21 GrossProfit.....................................................................................................................................................22 OperatingExpenses.....................................................................................................................................22 Officers’Compensation..............................................................................................................................22 Pre‐TaxIncome.............................................................................................................................................23 NetIncome......................................................................................................................................................23
BalanceSheetAnalysis...................................................................................................................................23 CurrentAssets................................................................................................................................................24 TotalAssets.....................................................................................................................................................24 CurrentLiabilities........................................................................................................................................24 TotalLiabilities..............................................................................................................................................25 Stockholders’Equity...................................................................................................................................25
RatioAnalysis.....................................................................................................................................................25 LiquidityRatios.............................................................................................................................................25 ProfitabilityRatios.......................................................................................................................................26 LeverageRatios.............................................................................................................................................26
RUNNINGHEAD:ACG6935SemesterProject–Pearl&Pierce
5
ApproachestoValue............................................................................................................................................26 IncomeApproach..............................................................................................................................................27 MarketApproach...............................................................................................................................................27 AssetApproach..................................................................................................................................................27 SummaryoftheValuationApproachesandMethodsUsed...........................................................28
IncomeApproach..................................................................................................................................................28 CapitalizationofBenefitsMethod..............................................................................................................28 ConclusionofValue–IncomeApproach............................................................................................30
MarketApproach...................................................................................................................................................31 GuidelinePublicCompanyAnalysis..........................................................................................................31 SECEDGARSearch.......................................................................................................................................31 CrainValDatabaseSearch.........................................................................................................................31
ConclusionofValue–MarketApproach.................................................................................................32
DiscountforLackofMarketability................................................................................................................33
ReconciliationofValuationMethods............................................................................................................33
ReasonablenessTest............................................................................................................................................34
FinalConclusionofValue...................................................................................................................................34
Bibliography............................................................................................................................................................36
Appendix1–ValuationAnalysts’Representation..................................................................................39
Appendix2–SelectFinancialData................................................................................................................40
Appendix3–CalculationofValue..................................................................................................................50
RUNNINGHEAD:ACG6935SemesterProject–Pearl&Pierce
6
INTRODUCTION
OverviewofJohnsonAdhesives,Inc.
JohnsonAdhesives,Inc.(JAorthe“Company”)isaprivatelyownedmanufacturerofadhesivesandsealantsthatsellsmainlytohomeimprovementstorechainsandsmallerbusinesscustomersinNorthAmerica.Brothers,FrankandJohnJohnson,foundedtheCompanytwentyyearsagoin1987andsinceitsinception,JAhasstayedinthehandsoffamily.BothbrotherscontinuallyandactivelymanagetheCompany’soperationswithFrankJohnsonactingasmajorityshareholderpossessing55%ofJAcommonstock.Meanwhile,hisbrotherJohnowns35%ofthecommonstockandacousin,whoalsoworksforthecompany,ownstheremaining10%.Currently,JAhassixmanufacturinglocationsthroughouttheUnitedStatesandannualrevenuesofapproximately$50million.EightypercentofsalesaretocustomersintheU.S.whereastheremainingtwentypercentofsalesareexportedandsoldtocustomersinCanada,MexicoandtheCaribbeanIslands.
JAoperatesintheadhesiveandsealantsindustryandmanufacturesadhesiveandsealantproducts.TheStandardIndustrialClassificationSystemclassifiestheadhesivesandsealantsindustry(SIC#2891),asbusinessesprimarilyengagedin“manufacturingindustrialandhouseholdadhesives,glues,caulkingcompounds,sealants,andlinoleum,tile,andrubbercementsfromvegetable,animal,orsyntheticplasticsmaterials,purchasedorproducedinthesameestablishment”(IntegraReports,2011).Ontheotherhand,adhesiveandsealantproductsaretwotypesofcompoundsthathavecountlessusesandcomparablechemicalmake‐ups;yet,possessinherentlydifferentfunctions(GlobalAdhesives,2011).Unlikeadhesivesthatareusedtosecureabondbetweentwotypesofsimilarordissimilarmaterials,sealantproductsareusedtocreateaninescapablebarrierforgasorliquids(GlobalAdhesives,2011).
Classificationofadhesivesandsealantsarebyproducttype,basisoftechnologyemployedinproductionand/orend‐uses(GlobalAdhesives,2011).Producttypesinclude,butarenotlimitedto:vinyl,acrylic,rubber,polyurethane,blockcopolymers,epoxy,naturalproductsandsilicone.Technologiesemployedinproductioninclude,butisnotlimitedto:water‐borne,solvent‐borne,reactive,andhotmelt.Endusesinclude,butarenotlimitedto:packaging,residentialandcommercialconstruction,woodworking,assemblyandmanufacturingofconsumergoods,transportation,industrial,medical,footwearanddo‐it‐yourselfprojects(Pierce,2011).Figure1belowpresentsabreakdownofthestrategicmarketsectorsinwhichadhesiveandsealantproductsparticipate(Murad,2011).

RUNNINGHEAD:ACG6935SemesterProject–Pearl&Pierce
7
Figure1:Adhesives&SealantsStrategicMarketSectors
AssignmentDescription
BizVals,Inc.wascommissionedbythelawyersofMs.SusanJohnsontodeterminethefairmarketvalueofMr.FrankJohnson’s55%ownershipinterestinJAasofthevaluationdate,December31,2011.ThepurposeofthisreportistoaidtheequitabledistributionofMr.FrankJohnson’stotalnetworthforthemaritaldissolutionmatterofJohnsonv.Johnson.Mr.FrankJohnson’s55%equityinterestrepresents550sharesofcommonstockinJAandcontainselementsofcontrol.Thepremiseofvalueisgoingconcern.Allrelevantdataandmethodologieswereconsideredinthisappraisal,whichisdeemedtobecomplete.ThisreportmeetstherequirementssetforthintheStatementonStandardsforValuationServicesNo.1(SSVS)issuedbytheAmericanInstituteofCertifiedPublicAccountantswhichdefinesavaluationengagementas:
“Anengagementtoestimatevalueinwhichavaluationanalystdeterminesanestimateofthevalueofasubjectinterestbyperformingappropriateprocedures,asoutlinedintheAICPAStatementonStandardsforValuationServices,andisfreetoapplythevaluationapproachesandmethodsheorshe
RUNNINGHEAD:ACG6935SemesterProject–Pearl&Pierce
8
deemsappropriateinthecircumstances.Thevaluationanalystexpressestheresultsofthevaluationengagementasaconclusionofvalue,whichmaybeeitherasingleamountorarange.”
Theinformationoutlinedinthispaper,representsasummaryreportwhichisoutlinedbytheSSVS“toprovideanabridgedversionoftheinformationthatwouldbeprovidedinadetailedreport,andtherefore,neednotcontainthesamelevelofdetailasadetailedreport”.Lastly,thissummaryreportmeetstheminimumrequirementspresentedinparagraphs71‐72ofSSVS.
ScopeofWork
Thisreportcomprisesacompleteappraisal,andallrelevantdataandmethodologieshavebeenconsidered.Inperformingourwork,wewereprovidedwithinformationbythelawyersofMs.SusanJohnsonaswellasrelyinguponinformationderivedfromvariouspubliclyavailablesources.InsightontheCompanyanditsoperationalenvironmentwasattainedthroughacomprehensiveexaminationoftheindustry,economyandavailablefinancialstatementsofJA.Aftercarefulconsiderationofallrelevantdataandbusinessvaluationmethodsandapproachestoapply,itwasdeterminedthatboththeIncomeApproachandMarketApproachwerethemostappropriatemethodsinderivingaconclusionofvalue.Usingprofessionaljudgment,competenceandskepticism,wehavedeterminedourconclusionofvaluetorepresentourfindings,knowledgeofthemarketplaceandvaluationexpertise.StaffmembersofBizVals,Inc.,underthedirectsupervisionoftheleadappraiseronthisengagement,assistedinperformingresearch,datamodeling,andprovidingotherareasofgeneralassistance.
SourcesofInformationUtilized
Inconductingthisvaluationengagement,BizVals,Inc.wasprovidedwithand/orrelieduponseveralsourcesofinformationwhichinclude:
1. ReviewedfinancialstatementsfortheyearendingDecember31,2007,aspreparedbytheCompany;
2. ReviewedfinancialstatementsfortheyearendingDecember31,2008,aspreparedbytheCompany;
3. ReviewedfinancialstatementsfortheyearendingDecember31,2009,aspreparedbytheCompany
4. ReviewedfinancialstatementsfortheyearendingDecember31,2010,aspreparedbytheCompany

RUNNINGHEAD:ACG6935SemesterProject–Pearl&Pierce
9
5. ReviewedfinancialstatementsfortheyearendingDecember31,2011,aspreparedbytheCompany;
6. ValuationRUs,Inc.’svaluationreportforJAasofDecember31,2011;
7. DatafromStocks,Bonds,Bills,andInflation–2011Yearbook,ValuationEditionpublishedbyMorningstar/Ibbotson;and
8. Otheritemsreferencedthroughoutthisreport.
Inadditiontothewrittendocumentationprovidedtous,informationwasalsoattainedfrominterviewswithMs.SusanJohnsonandherlawyers,whichwerevitaltothisreport.Lastly,BizVals,Inc.didnotaudit,review,compileorattestundertheStatementsonStandardsforAttestationEngagements(SSAEs)tothefinancialinformationprovidedtousbythesubjectcompanyandassumesnoresponsibilityforthisinformation.
RevenueRuling59‐60
Thestandardofvalueusedinthisengagementisfairmarketvalue,whichassumesthatthepriceistransactedincashorcashequivalents.U.S.TreasuryRevenueRuling(Rev.Rul.)59‐60,whichisusedinbothtaxandnontaxvaluations,definesfairmarketvalueas:
“Thepriceatwhichthepropertywouldchangehandsbetweenawillingbuyerandawillingsellerwhentheformerisnotunderanycompulsiontobuyandthelatterisnotunderanycompulsiontosell,bothpartieshavingreasonableknowledgeofrelevantfacts.Courtdecisionsfrequentlystateinadditionthatthehypotheticalbuyerandsellerareassumedtobeable,aswellaswilling,totradeandtobewellinformedaboutthepropertyandconcerningthemarketforsuchproperty.”
Furthermore,themeasurementoffairmarketvalueisdependentoncircumstancesofeachvaluationandthatthereisnosetformulaforderivingaconclusionofvalue.Rev.Rul.59‐60statesthefollowing:
“Adeterminationoffairmarketvalue,beingaquestionoffact,willdependuponthecircumstancesineachcase.Noformulacanbedevisedthatwillgenerallybeapplicabletothemultitudeofdifferentvaluationissues[whicharise]…Often,anappraiserwillfindwidedifferencesofopinionstothefairmarketvalueofaparticularstock.Inresolvingsuchdifferences,heshouldmaintainareasonableattitudeinrecognitionofthefactthatvaluationisnotanexactscience.Asoundvaluationwillbebaseduponalltherelevantfacts,buttheelementsofcommonsense,informedjudgmentandreasonablenessmustenterintotheprocessweighingthosefactsanddeterminingtheiraggregatesignificance…Theappraisermustexercisehisjudgmentastothe
RUNNINGHEAD:ACG6935SemesterProject–Pearl&Pierce
10
degreeofriskattachingtothebusinessofthecorporation,whichissuedthestock,butthatjudgmentmustberelatedtoalloftheotherfactorsaffectingvalue.Valuationofsecuritiesisinessence,aprophecyastothefutureandmustbebasedonfactsavailableattherequireddateofappraisal”.
Althoughthereisnogeneralformulafordeterminingfairmarketvalue,itisimportantfortheanalysttoconsiderallrelevantdataandinformation.Rev.Rul.59‐60offersthefollowingguidelinesandfactorstoconsiderforbusinessvaluations,whichwillbeincorporatedintothisvaluationengagement:
a. Thenatureofthebusinessandthehistoryoftheenterprisefromitsinception.
b. Theeconomicoutlookingeneralandtheconditionandoutlookofthespecificindustryinparticular
c. Thebookvalueofthestockandfinancialconditionofthebusiness.
d. Theearningcapacityofthecompany.
e. Thedividendpayingcapacityofthecompany.
f. Whetherornottheenterprisehasgoodwillorotherintangiblevalue.
g. Salesofthestockandthesizeoftheblockofstockbeingvalued.
h. Themarketpriceofstocksofcorporationsengagedinthesameorsimilarlineofbusinesshavingtheirstocksactivelytradedinafreeandopenmarketeitheronanexchangeoroverthecounter.
Thisreportisbrokenintofourmainsections:
1. EconomicAnalysis;
2. IndustryAnalysis;
3. FinancialStatementAnalysis;and
4. ValuationMethods.
AssumptionsandLimitingConditions
Providedaretheprimaryassumptionsandlimitingconditionsrelevanttotheestimateofvalueprovidedinthisreport:
1. TheresultingestimateofvalueexpressedastheconclusionofvaluestatedwithinthisreportisonlyvalidforthesolepurposeofaidingintheequitabledistributioninthematterofJohnsonv.JohnsonasofthevaluationdateDecember31,2011.
2. ThefinancialstatementsandotherrelatedinformationprovidedtousbyJAoritsrepresentativeshavebeenacceptedwithoutsubstantiationofitscompletenessor
RUNNINGHEAD:ACG6935SemesterProject–Pearl&Pierce
11
correctness.BizVals,Inc.assumesnoresponsibilityforthefinancialinformationprovidedtousandexpressesnoauditopinionoranyotherformofassurance.
3. Allfacts,data,statisticsandpublicinformationwhichwereobtainedforuseinthisreportarebelievedtobeaccurateandtrue;however,BizVals,Inc.hasnotindependentlyverifiedsuchinformationandisnotliableforthesesources.
4. Theinformationsetforthinthisreportistrueandaccuratetothebestofourknowledge.Wehavenotknowinglywithheldoromittedanythingfromourreport,whichwouldaffectthevaluationofJA.
5. Ownershipofthisreportoritscopydoesnotgrantanyarighttopublishanypartofit.Nopartyisalloweduseofthisreportforanypurposewithoutourwrittenconsent.
6. TheconclusionofvalueforJAcommonstockisbasedonfairmarketvalueasdefinedbyRev.Rul.59‐60.Nonetheless,anactualsaleofJA’scommonsharesmayresultinahigherorlowervaluethanestimated.BizVals,Inc.assumesnoresponsibilityforwhatvaluesindividualbuyersandsellersmayarrivetointheeventofanactualtransaction.
7. Thisvaluationreportcontainsfinancialinformation,estimatesandopinionsthatrepresenttheviewsBizVals,Inc.;however,theseviewsdonotrepresentpredictionsorassurancethatacertainlevelofprofitorincomewillbeattainedorthatcertaineventswilloccur.
8. Incertaincircumstancesinthisreport,estimateswereusedwhendocumentationwasmissingand/orcouldnotbeprovided.WedonotbelievethiswillresultinamaterialchangeinourestimateofvalueforJA;however,somereadersofthisreportmaybelievedifferently.
9. Futureservicesregardingthematerialinthisreport,willnotberequiredofBizVals,Inc.unlessotherwisestatedpriorinwriting.
10. NochangesoftheinformationinthisreportwillbemadebyanyoneelsebutthoseatBizVals,Inc.Weassumenoliabilityforanyunauthorizedchanges.
ECONOMICANALYSIS
Theperformanceofmanybusinessesandindustriesaretiedtostateoftheeconomy.Priortotheeconomicglobalrecessionin2008,theadhesiveandsealantindustryexperiencedanextendedperiodofuninterruptedgrowth;howeveroncetheglobaldownturnemerged,demandandoutputwoulddecreasedramatically.By2010,aneconomicreboundwouldseemattainable,butaftervariousunexpectedandexpectedeventsin2011,recoveryremainsuncertain.ThefollowingsectionswilldiscusstheglobalandnationaleconomyanditseffectsontheadhesiveandsealantindustryaswellastherisksitimposesontheCompany.

RUNNINGHEAD:ACG6935SemesterProject–Pearl&Pierce
12
GlobalEconomy
Witheconomicrecoveryinsight,2011wasayearofdisappointmentsbroughtaboutbynumerousfactorsthatupsetandstalledgrowth,suchas:theearthquakeandtsunamithathiteasternJapan;theconflictintheMiddleEastandNorthAfricanoilproducingregions;thedelicatebankingandfinancialinstitutionsofEuropeancountries;theslowdownofprogressionintheU.S.handoverofpublictoprivatedemand;aswellasglobalmarketssufferingfrommajorsell‐offsofriskyinvestments(IMF,2011).Thesefactorshaveaffectedunemploymentandoutputlevels,aswellasconsumerspending.AccordingtotheupdateontheWorldEconomicOutlook2011:SlowingGrowth,RisingRisksdevelopedbytheInternationalMonetaryFund(IMF),thetotalworldoutputfrombothadvancedanddevelopingeconomieswas4%in2011.Thiswasa1.1%decreaseintotalworldoutputfrom2010,yetanoverallincreaseof3.3%from2009(2011).ThemaindrivingforcebehindthesenumberswasfromemerginganddevelopingeconomiesaswellasChina.Growthratesfordevelopedandmatureeconomiesin2011andwere2.1%.Thiswasadecreaseof.4%from2010andanoverallincreaseof5.6%from2009(IMF,2011).Emerginganddevelopingeconomiesontheotherhand,hadgrowthratesof4.6%in2011,whichwasa.3%increasefrom2010andanoverallincreasefrom2009of2.8%(IMF2011).
Growthandrecoveryhasbeenslowingdownin2011comparedtothejumpin2010anditseemsthatwitheverystepforward,theglobaleconomyistakingonestepback.VariousestimatesstatethatindustrialoutputindevelopednationswasloweredbyhalfapercentagepointinthemonthsthatfollowedtheunanticipatedearthquakeandtsunamithatdevastatedJapan(IMF,2011).Furthermore,sourcesindicatethatduetothedisorderandinterruptioninthesupplychain,thenumberofcarsmanufacturedworldwidedroppedby30%(IMF,2011).RegulatoryuncertaintyintheU.S.aswellastheabilityofmanyEuropeancountriestostabilizetheirsovereigndebtalsohaditseffectonconsumerspendingandoutputlevels.Theeuro‐crisis,whichfirstemergedinGreece,thenspreadtoPortugal,Ireland,Spain,ItalyandthenFranceimmobilizedcashflowswithinbanks,createdfallingbondyieldsandtightenedlendingpolicies,astranslatedinskepticismofthemarketplace(IMF,2011).Additionally,globalunemploymentandtheaveragepriceofoilperbarrelalsocontinuedtoincrease.Globalunemploymentreached9.1%in2011(CIA,2011),whereasaveragepriceofoilperbarrelwas$103.20(IMF,2011).
NationalEconomy
TheU.S.stillstrugglestoregainitspre‐2007growthinthefaceofbearmarketsandmanufacturingslowdowns.Inaddition,theburstofthehousingbubblein2008stillposesseriouschallengestohomeowners,ofwhichabout68%carriedmortgages(EconomicReportofthePresident,2011).Inadditiontothenation’shousingmarketstillremaining
RUNNINGHEAD:ACG6935SemesterProject–Pearl&Pierce
13
weak,unemploymentlevelsbytheendof2011werealmost9%(Riley,2011).Furthermore,U.S.outputlevelsaswellasGDPdecreasedconsiderablyin2011,despiteincreasingoverallfrom2009.Outputlevelswereonly1.6%in2011,comparedto3.1%in2010;however,thisanoverallincreaseof5.3%from2009.RealGDPfigureswere1.5%in2011comparedto3.0%in2010;anoverallincreaseof5%from2009(IMF,2011).Additionally,realtotaldomesticdemandwas1.3%in2011comparedto3.4in2010,anoverallincreaseof5.7%from2009(IMF,2011).For2011,thesefiguresmayexhibitslowgrowthandsignsofrecovery,howeverthenation’seconomystillhasalongroadahead.
IndustryEconomy
Bothglobalandnationaleconomyhashaditseffectontheadhesiveandsealantindustry.In2009,globalconsumptionofadhesivesandsealantswasonly16.6billionpounds(Kusumgar,2011).Theadhesivemarketwasworth$20.6billionandthesealantmarketwasworth$8.5billion(Walsh,2010).Atthistime,theAsian‐Pacificregionwasthelargestconsumerofadhesiveandsealantsachieving40%ofvolumeandapproximately34%ofthesalesdollars(Kusumgar,2011).Europeontheotherhandwasthesecond‐largestregionalconsumerwith30%ofvolumeandapproximately32%ofsales(Kusumgar,2011).NorthAmericafollowedinthirdwith24%ofvolumeandapproximately27%ofsalesdollars.
ThesefigurestranslatedintoavolumedecreasesforNorthAmericaof8%(Walsh,2010).“Adecreaseofconsumptionandindustrialproductioninadhesiveandsealantsby5%and3%,respectively(Kusumgar,2011).NorthAmericanconsumptionlevelsofadhesiveshaddecreasedsixbillionpoundsin2009,“adeclineof7%compoundannualgrowthratesinceitspeakin2007”whereasthe“sealantsindustrysimultaneouslybottomedatslightlybelowonebillionpounds,amorepronounceddeclineof16%compoundannualgrowthratesinceitspeakin2006”(Murad,2010).DemandinEuropealsodecreased8%,whereasdemandinChina,actuallyincreased6%inthefaceofweakenedexportdemandsformanufacturingoutputlevels(Kusumgar,2011).
By2010,globaladhesivesandsealantsmarketwasupabout3%fromtheyearbefore,valuedatapproximately$30‐31billion(Walsh,2010).However,thesefigureswerestillbelowits“pre‐crisispeak”(Walsh,2010).Demandisstillbehindthatofpre‐2007figures,duetoissuesthathavesloweddowntheindustry(Nick,2010).Theseissuesinclude:
1. Formulatorsandrawmaterialsuppliersstretchingexistinginventory;
2. Reduceddemandandsupplyworldwide;
3. Reductioninvalueofthedollar,butnomarketforexports;
RUNNINGHEAD:ACG6935SemesterProject–Pearl&Pierce
14
4. Severelyrestrictedcredit,makingitdifficulttoobtainloansforexpansionofdailyoperations;
5. Highunemployment,risingsocialcosts;
6. Reducedtaxrevenues,leadingtoreducedgovernmentservices;
7. Rapidincreasesintaxestocovershortfalls;anda
8. Severelydepressedbuildingmarket(Nick,2010).
Nonetheless,adhesivesandsealantshaveexperienced“growthinbothvolumeanddollarsalesduringthe[current]year”duetoinnovativenewtechnologiesandmarketpenetrationsintonewenduserapplicationareasandexpectscontinuedgrowth”(GlobalMarketfor,2011).“Mostmarketsareforecastedtogrow,withemphasisonend‐usecategoriesincludingpackaging,building,construction,andfootwear,whiletransportationwillhaveslowergrowth”(Pierce,2011).AdhesiveandSealantCouncil’sNorthAmericanMarketReportestimatesthatbytheendof2013,totalglobaladhesiveandsealantsaleswillreach$40.5billioninsaleswitha3.3%growthrate,whereastheNorthAmericanadhesiveandsealantsmarketwillcomprisesof$11.1billionwitha2.2%growthrate(Pierce,2011).
RisktotheCompany
JA’smaincustomerbaseisintheNorthAmericanregionsofU.S.,Canada,MexicoandtheCaribbeanIslandsandtheimplicationsoftheeconomyshiftingtowardsChinesecompetitorsisanincreasedriskthatmustbetakenintoconsiderationofthisvaluation.WitheconomicrecoveryintheU.S.remaininguncertain,thenextthreesectionsofthisreport,willdiscussfactorsthatcouldalsoimposethreatstoJAprofits:
Sloweddemand,
Capacityutilization,and
Rawmaterialsandsupplies.
SlowedDemand
Consumerbehaviordictatesdemandandcurrentmarketconditionshavecausedconsumerstobehavemorecautiouslythaneverbefore.“Consumersaccountfor70%ofeconomicactivityintheU.S.”andwiththeriseinunemploymentrates,financialmarketconcerns,andtheeffectsofthesubprimeandrealestatecrisisstillloomingintheheartsofindividuals,demandhasstalledasconsumerconfidencedampens(Murad,2010).Furthermore,theFederalReserveestimatesthat“unemploymentwillnotmovelowerthan8.0%through2013”(Murad,2011).
RUNNINGHEAD:ACG6935SemesterProject–Pearl&Pierce
15
CapacityUtilization
Capacityutilizationcanbedefinedastherelationshipbetweenactualoutputandpotentialoutputwhencompanyassetsarefullyutilized.Whenthereisadeclineinmanufacturingoutputsthiscansignificantlyhurtanindustry.“Duringthedownturn,theFederalReserveestimatedcapacityutilizationdroppedtohistoricallylowlevelsof65%,causingstructuralchangestocapacitiesinmanyindustries.Currentcapacityutilization[oftheadhesiveandsealantindustry]isoperatingnear75%,yetthisisstillwellbelowthepre‐recessionlevelsof83‐85%”(Murad,2011).Additionally,withotherend‐userindustriessuchasautomotivemanufacturing,thatsignificantlyinfluenceadhesiveandsealantsatcapacityutilizationratesofapproximately50%,thisdisplaysdownbeatinthesupplychain(Murad,2010).
RawMaterial&SupplyShortage
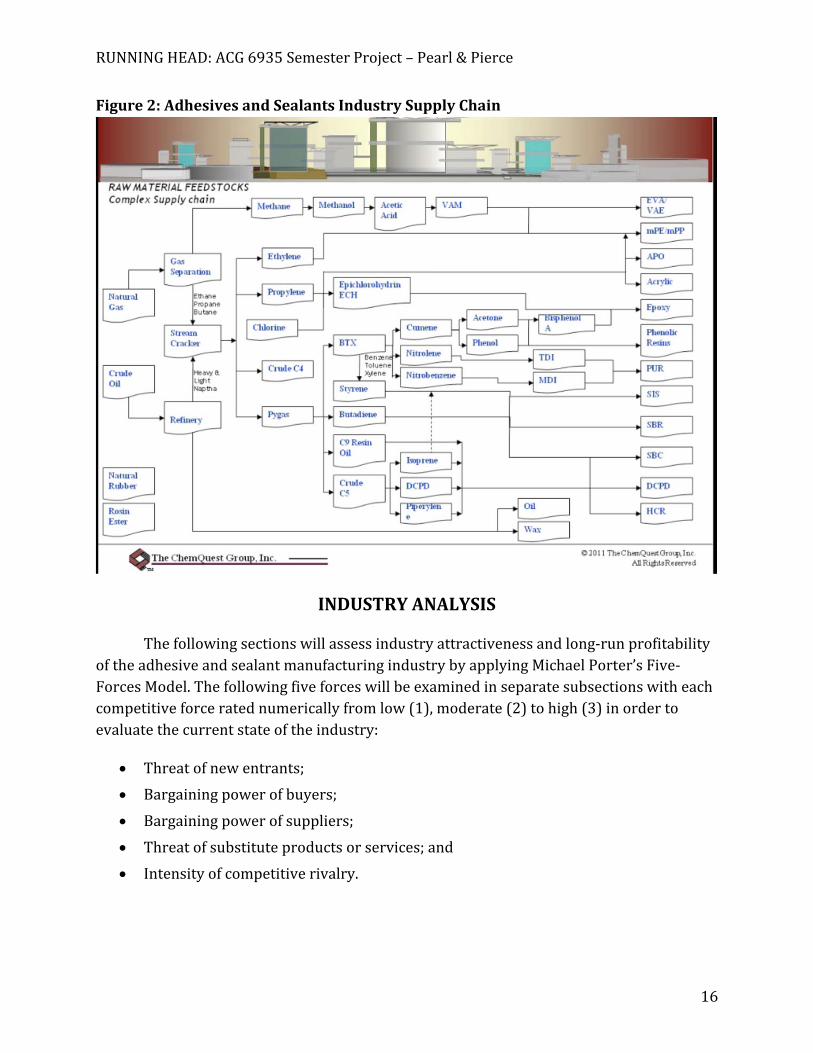
Pricesofadhesiveandsealantrawmaterialinputshaverisendrasticallyaswellasfacedastringofsupplyoutages.Beginninginlate2009,tightsuppliesandspikesinrawmaterialpriceshaveincreasedcostsformanufacturerswithsomerawmaterialandsupplypricesskyrocketingupto90%in2010andothersincreasing5%eachquarterin2011(Extance,2011).Additionally,“withmostadhesiverawmaterialsnowrelativelyscarceandmanyrawmaterialelementsonallocation,it'ssupplythat'sdrivingpricesmorethanunderlyingfeedstockcost”(Extance,2011).Figure2onpage16depictsaflowchartofthecomplexsupplychainfeedstockthatisrequiredinordertocreatethecompoundsnecessaryformakingadhesiveandsealantsformanufacturersintheindustry(ChemQuest,2011).
Conclusion
JA’smaincustomerbaseisintheNorthAmericanregion.EightypercentoftheCompany’ssalesareconductedintheU.S.withtheremainingtwentypercentfromCanada,Mexico,andtheCaribbeanIslands.TheslowgrowthanddecreasesindemandandoutputlevelsintheNorthAmericaneconomyplustheshifttowardsChinesecompetitorsisasignificantriskfortheCompany.Additionally,increasedcostsofrawmaterialsandthetighteningofsuppliesmustalsobetakenintoconsiderationinthisvaluation
RUNNINGHEAD:ACG6935SemesterProject–Pearl&Pierce
16
Figure2:AdhesivesandSealantsIndustrySupplyChain
INDUSTRYANALYSIS
Thefollowingsectionswillassessindustryattractivenessandlong‐runprofitabilityoftheadhesiveandsealantmanufacturingindustrybyapplyingMichaelPorter’sFive‐ForcesModel.Thefollowingfiveforceswillbeexaminedinseparatesubsectionswitheachcompetitiveforceratednumericallyfromlow(1),moderate(2)tohigh(3)inordertoevaluatethecurrentstateoftheindustry:
Threatofnewentrants;
Bargainingpowerofbuyers;
Bargainingpowerofsuppliers;
Threatofsubstituteproductsorservices;and
Intensityofcompetitiverivalry.

RUNNINGHEAD:ACG6935SemesterProject–Pearl&Pierce
17
ThreatofNewEntrants–Moderate(2Rating)
Profitableindustrieswillalwaysattractnewcompetitorsthatareinterestedtakinginashareofprofits.Thistypeofcompetitionposesapotentialthreattoexistingcompaniesalreadyoperatingwithintheindustry.Currently,theeconomyisataslowdownandoperatingatdecreasedoutputandconsumptionlevels.NewentrantsintotheadhesiveandsealantindustrycansignificantlydetractfromJA’sprofits.Thisisbecausewhencompaniesenterintoamarketofexistingcompetitionwhereoutputisnotatoptimallevels,fewerprofitscanbecollected.Additionallyanothermajorbarriertoentryisincreasedinternationalenvironmentalandgovernmentalregulatoryrequirementswithinanindustry.
Regulatoryrequirementscanbecostlyandoccasionallyifbusinessesdonotabidebythem,itcanmeanfinesortheendofoperations.ForJA’sNorthAmericancompetitorsthisisalargebarriertoentryduetoincreasedregulationsintheU.S.tomeetemissionandcleanairrequirementssetbytheEnvironmentalProtectionAgency(EPA).In2009,theEPAcalledforlowVolatileOrganicCompounds(VOC)inadhesiveandsealantproductsinthethirteenNortheastandMid‐AtlanticstatesknownastheOTCorOzoneTransportCommission(VOCRegulations,2009).Thephase‐inperiodallowedcompaniestoadjusttotheserequirementsfrom2009through2011.Manufacturersandimportersthatdonotabidebytheseenvironmentalandgovernmentregulationsusuallycannotoperatewithintheindustryandthiscreatesabarriertoentry.
ForJA,thethreatofnewentrantsis“moderate”andwillberatedas2.0.Thisratingisbasedonthehighbarriertoentryexpectedfromincreasedregulationaswellastheadhesiveandsealantindustrycurrentlynotoperatingatfullcapacityutilizationandthenegativeeffectsnewcompetitionwouldhaveonprofitsiftheyweretoenterthemarketplace.
BargainingPowerofBuyers–High(3Rating)
Thebargainingpowerofbuyersinfluencesthecompetitivenessandprofitsofbusinesseswithinanindustry.Buyergroupsincludeestablishmentsintheautomotive,packaging,aircraft,electronics,durableconsumergoodsandmetalsectors;aswellasformaintenance,repair,andoverhaul,home,schoolandofficeapplicationsbycraftsmen,tradeprofessionalsandindividualconsumers.End‐usesinclude,butarenotlimitedto:packaging,residentialandcommercialconstruction,woodworking,assemblyandmanufacturingofconsumergoods,transportation,industrial,medical,footwearanddo‐it‐yourselfprojects(Pierce,2011).Thisprovidesahighconcentrationofbuyerstoahighconcentrationofsellers,whichinturnincreasesthebuyer’sbargainingpower.Consumerdemandsisalsoanimportantaspectofbuyerbargainingpowerandwithdecreased
RUNNINGHEAD:ACG6935SemesterProject–Pearl&Pierce
18
demand,thiscanincreasethestrengthofbuyersinthemarket.Additionally,manufacturersofadhesivesandsealantsalsohaveextensiveknowledgeontheformulationofcompoundsandabilitytodoso.Thisaspectofformulationknowledgecreatesacompetitiveadvantageforcompaniesintheadhesiveandsealantmanufacturingindustryandthusalsodrivesdownthepowerofbuyers.
ForJA,thebargainingpowerofbuyerswillberated“high”as3.0.Thereasonforthisratingisduetothelackofconsumerdemandatthemomentaswellastheloweringofprofitpotentialfromtotheimmenseconcentrationofbuyerstoalargenumberofsellerseventhoughsellerspossessextensiveadhesiveandsealantformulationknowledgeforcontributetocompetitiveadvantage.
BargainingPowerofSuppliers–High(3Rating)
Themajorityofcompaniesoperatingwithintheadhesiveandsealantindustrygenerallyavoidsolesourcesupplierarrangementsforrawmaterials.Thisisbecauseitleavesthemanufacturerstheabilitytoattainthebestsupplyarrangements.However,despitethenumerousamountsofsuppliers,theshortagesanddemandinrawmaterialsfromthesesuppliershasincreasedthecompetitionofbusinesseswithintheadhesiveandsealantindustry.Additionally,theserawmaterialcostsdriveupthecostsforthesupplierwhichinturnthemanufacturershavetotakeonthemselves;thus,drivingupthecostofadhesiveandsealantproducts.
ForJA,thebargainingpowerofsuppliersis“high”andwillberated3.0.ThisisduetotherelativelyscarceandmanyrawmaterialelementsthatdrivesuppricesandcostsfortheCompany.
AvailabilityofSubstitutes–Low(1rating)
Substituteproductsincludescrews,nailsandfastenersaswellassealingmethodssuchassoldering.Thoughtheavailabilityoftheseadhesiveandsealantalternativesareabundant,thebenefitsofadhesiveandsealantproductsareevenmoreplentiful.Forinstance,withtheemerging“green”sectorsandnationspushingforcleanerandmoresustainabletechnologies,thesesubstituteproductshavenotbeenhavingthesamecapabilitiesofthenewandinnovativeadhesivesandsealantsonthemarket.Inaddition,thetechnologyappliedbyanadhesiveandsealantcomparedtoasimplescrewornaildoesnothavethesametypesofbondingandadheringqualityofanadhesiveorsealant.Furthermore,theapplicationofuseintheconstructionmarkethasincreasedastheseconsumersarelookingformoresustainableusesforcreatingbondsandsealingtoovercomeproblemsofcorrosion,weight,instability,increasedstresscreatedbytravellingspeedsandweather.
RUNNINGHEAD:ACG6935SemesterProject–Pearl&Pierce
19
ForJA,thethreatofsubstituteproductsis“low”andwillberatedas2.0.Thereasonforthisratingisbecauseeventhoughthecostsofswitchingfromanadhesiveandsealanttofasteners,suchasnailsandscrewsareverylowthesealternativesareinferiortotheproductsprovidedbytheadhesiveandsealantindustry.
CompetitiveRivalry–High(3rating)
Onlyahandfulofcompaniesdominatetheadhesiveandsealantsmarketyetthemarketissaturatedwithmanysmallercompetitors.Thismakestheadhesiveandsealantindustryveryfragmentedandintense.Intheadhesiveandsealantindustry,thetoptenplayersholda48%shareinthemarket(Murad,2011).Also,accordingtoindustrydatasuppliedbyIntegraReport,theadhesiveandsealantindustrycompriseofapproximately250establishments(2011).Duetotheamountofcompetitorsandweakeneddemand,companiesarenotexperiencingtheprofitlevelsofpre‐2007levels.Highrawmaterialcostsandtheslowdownindemandhavecausedcompaniestoregresstooldcompetitivestrategiesofpricecuttingaswellasconsolidation,nichemarketingandglobalexpansion.Howevernewandinnovativeusesforthesealantandadhesivemarketgivecompaniescompetitiveadvantages.Forinstance,declininginfrastructuremayleadtoimprovementfortheadhesivesandsealantsindustry.Cheapermoresustainablebondingmethodshavebeensoughtoutdueits“greener”properties.
ForJA,competitiverivalryishighandwillberated3.0.Thisisduetonumerouscompetitors,slowgrowthintheindustryaswellasbrandloyaltyandlowswitchingbuyerswitchingcostsduetoprice‐cuttingstrategies.
Conclusion
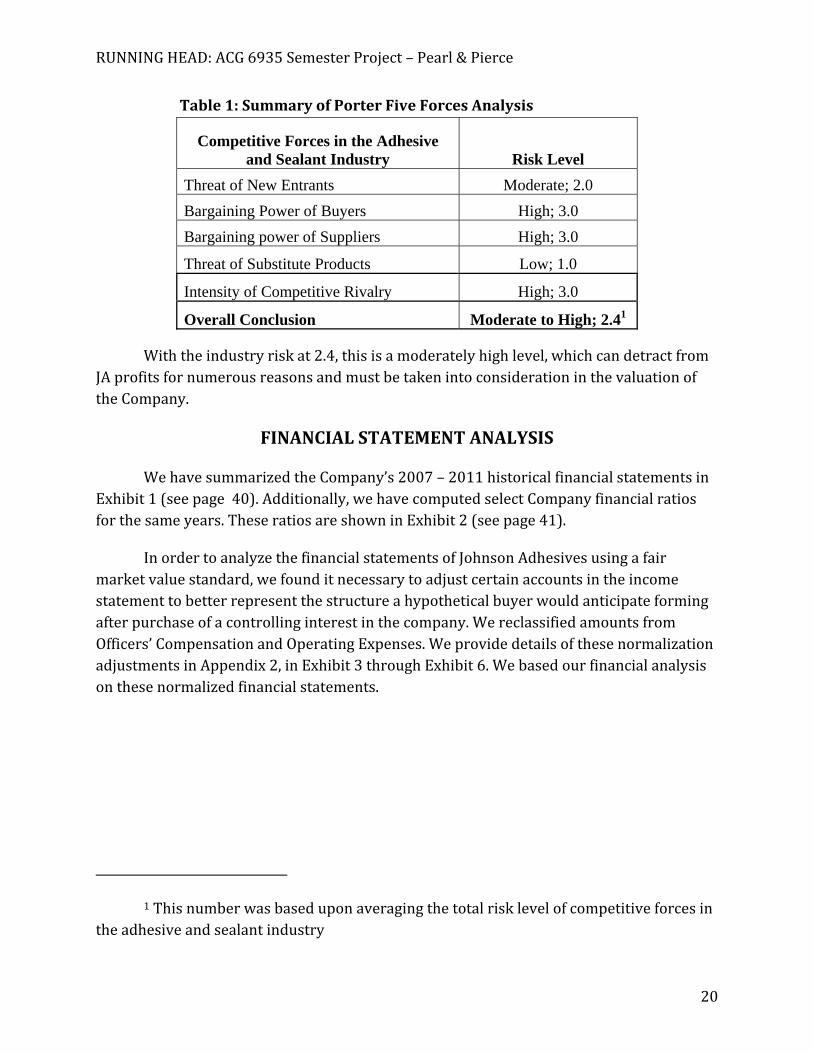
UsingMichaelPorter’sFive‐ForcesModeltoassesstheadhesiveindustriesattractivenessandlong‐runprofitabilitythefollowingfiveforcesreceivedthefollowingratings:
RUNNINGHEAD:ACG6935SemesterProject–Pearl&Pierce
20
Table1:SummaryofPorterFiveForcesAnalysis
Competitive Forces in the Adhesive and Sealant Industry Risk Level
Threat of New Entrants Moderate; 2.0
Bargaining Power of Buyers High; 3.0
Bargaining power of Suppliers High; 3.0
Threat of Substitute Products Low; 1.0
Intensity of Competitive Rivalry High; 3.0
Overall Conclusion Moderate to High; 2.41
Withtheindustryriskat2.4,thisisamoderatelyhighlevel,whichcandetractfromJAprofitsfornumerousreasonsandmustbetakenintoconsiderationinthevaluationoftheCompany.
FINANCIALSTATEMENTANALYSIS
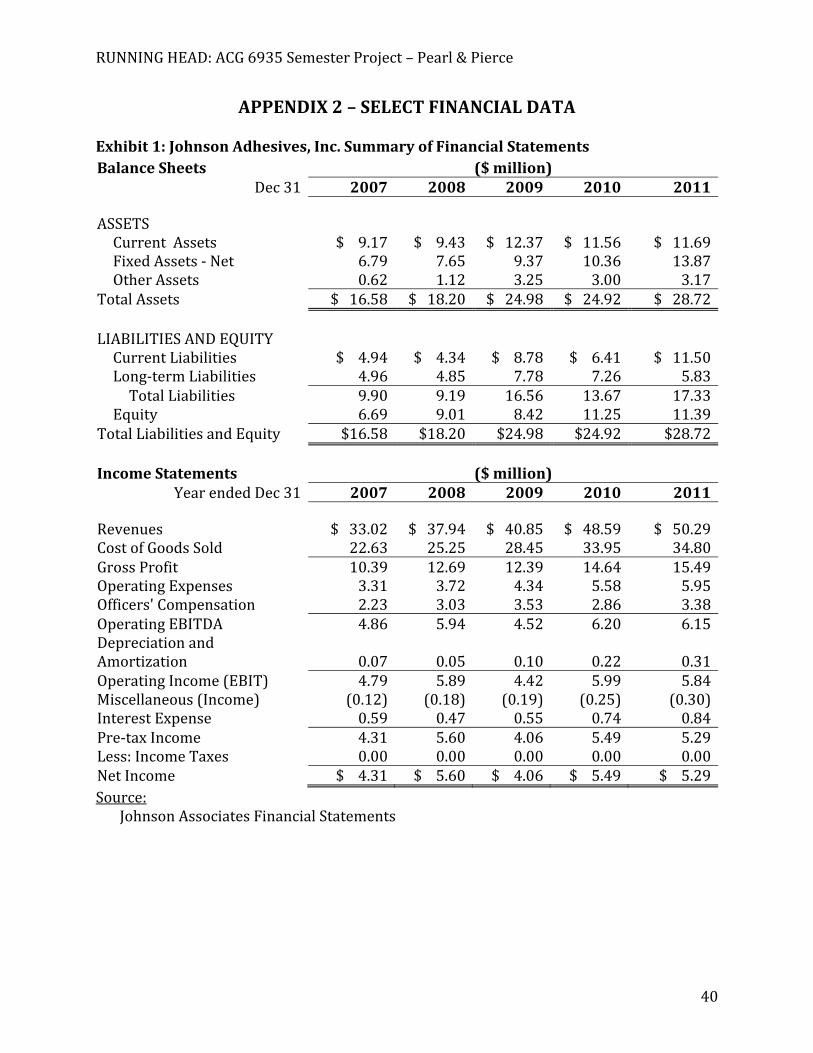
WehavesummarizedtheCompany’s2007–2011historicalfinancialstatementsinExhibit1(seepage40).Additionally,wehavecomputedselectCompanyfinancialratiosforthesameyears.TheseratiosareshowninExhibit2(seepage41).
InordertoanalyzethefinancialstatementsofJohnsonAdhesivesusingafairmarketvaluestandard,wefounditnecessarytoadjustcertainaccountsintheincomestatementtobetterrepresentthestructureahypotheticalbuyerwouldanticipateformingafterpurchaseofacontrollinginterestinthecompany.WereclassifiedamountsfromOfficers’CompensationandOperatingExpenses.WeprovidedetailsofthesenormalizationadjustmentsinAppendix2,inExhibit3throughExhibit6.Webasedourfinancialanalysisonthesenormalizedfinancialstatements.
1Thisnumberwasbaseduponaveragingthetotalrisklevelofcompetitiveforcesintheadhesiveandsealantindustry
RUNNINGHEAD:ACG6935SemesterProject–Pearl&Pierce
21
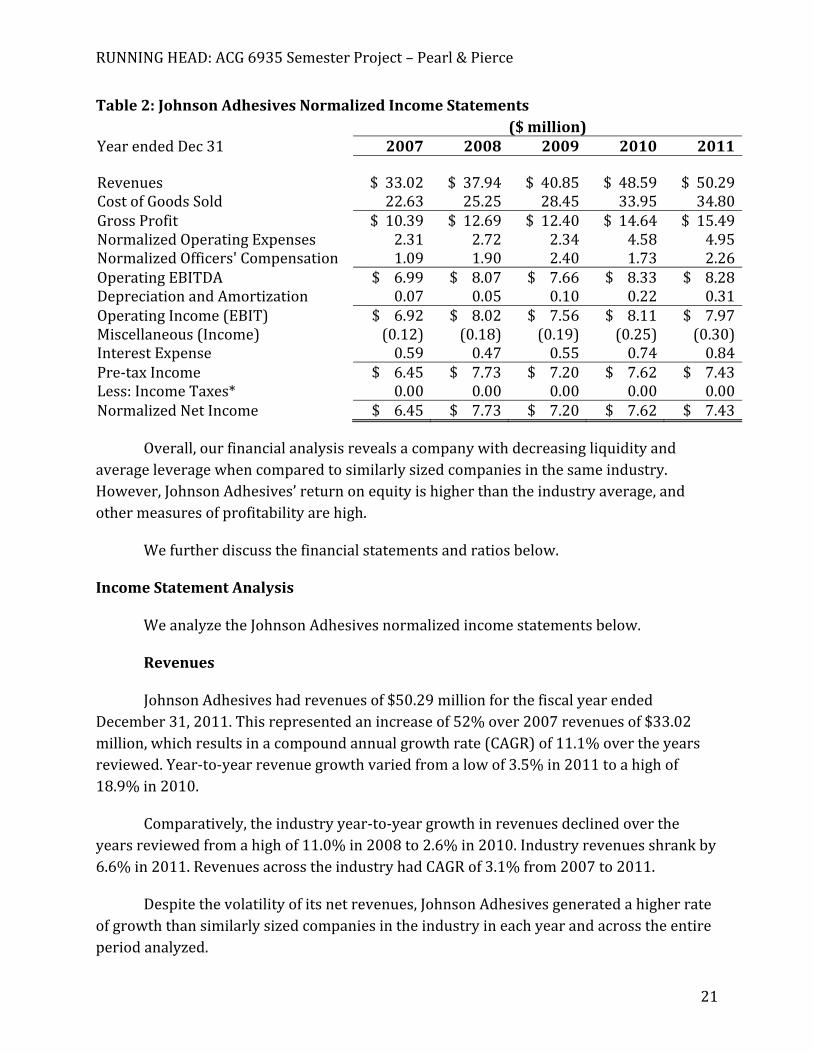
Table2:JohnsonAdhesivesNormalizedIncomeStatements($million)
YearendedDec31 2007 2008 2009 2010 2011
Revenues $33.02 $37.94 $40.85 $48.59 $50.29CostofGoodsSold 22.63 25.25 28.45 33.95 34.80GrossProfit $10.39 $12.69 $12.40 $14.64 $15.49NormalizedOperatingExpenses 2.31 2.72 2.34 4.58 4.95NormalizedOfficers'Compensation 1.09 1.90 2.40 1.73 2.26OperatingEBITDA $6.99 $8.07 $7.66 $8.33 $8.28DepreciationandAmortization 0.07 0.05 0.10 0.22 0.31OperatingIncome(EBIT) $6.92 $8.02 $7.56 $8.11 $7.97Miscellaneous(Income) (0.12) (0.18) (0.19) (0.25) (0.30)InterestExpense 0.59 0.47 0.55 0.74 0.84Pre‐taxIncome $6.45 $7.73 $7.20 $7.62 $7.43Less:IncomeTaxes* 0.00 0.00 0.00 0.00 0.00NormalizedNetIncome $6.45 $7.73 $7.20 $7.62 $7.43
Overall,ourfinancialanalysisrevealsacompanywithdecreasingliquidityandaverageleveragewhencomparedtosimilarlysizedcompaniesinthesameindustry.However,JohnsonAdhesives’returnonequityishigherthantheindustryaverage,andothermeasuresofprofitabilityarehigh.
Wefurtherdiscussthefinancialstatementsandratiosbelow.
IncomeStatementAnalysis
WeanalyzetheJohnsonAdhesivesnormalizedincomestatementsbelow.
Revenues
JohnsonAdhesiveshadrevenuesof$50.29millionforthefiscalyearendedDecember31,2011.Thisrepresentedanincreaseof52%over2007revenuesof$33.02million,whichresultsinacompoundannualgrowthrate(CAGR)of11.1%overtheyearsreviewed.Year‐to‐yearrevenuegrowthvariedfromalowof3.5%in2011toahighof18.9%in2010.
Comparatively,theindustryyear‐to‐yeargrowthinrevenuesdeclinedovertheyearsreviewedfromahighof11.0%in2008to2.6%in2010.Industryrevenuesshrankby6.6%in2011.RevenuesacrosstheindustryhadCAGRof3.1%from2007to2011.
Despitethevolatilityofitsnetrevenues,JohnsonAdhesivesgeneratedahigherrateofgrowththansimilarlysizedcompaniesintheindustryineachyearandacrosstheentireperiodanalyzed.
RUNNINGHEAD:ACG6935SemesterProject–Pearl&Pierce
22
GrossProfit
Whilethetotaldollaramountofthecompany’sgrossmargingenerallyincreasedfromyear‐to‐year,thegrossprofitannualgrowthratevarieddramaticallyacrosstheyearsreviewed.Thehighestannualincreaseof22.1%occurredin2008,whilethenextyearsawa2.3%reductioningrossprofits.Overall,JohnsonAdhesives’CAGRforgrossprofitof10.5%wassmallerthanthatofthecompany’snetrevenues.
Theaveragechangeingrossmarginforsimilarlysizedcompaniesintheindustrymirroredthechangesinthosecompany’snetrevenues.Growthofgrossmarginslowedacrossallyearsandgrossprofitsshrankin2011.TheindustryhadaCAGRof3.1%.
RegardlessofJohnsonAdhesivesvolatilityinitsgrossprofit,itsCAGRwasoverthreetimeshigherthanthatofothersimilarlysizedcompaniesintheindustry.
OperatingExpenses
Inordertomeetthestandardoffairmarketvalue,weadjustedoperatingexpensestoremovecertainexpensesthatahypotheticalbuyerlikelywouldnotchooseincurintheoperationofthebusiness.Wealsoadjustedthisaccountin2009inordertoremoveaone‐timechargeforalegalsettlementthecompanypaidinthatyear.
Afterournormalizationadjustments,ouranalysisofJohnsonAdhesives’operatingexpensesrevealedlargeswingsinyear‐to‐yeargrowth.Annualoperatingexpensesnearlydoubledin2010afterfalling14.0%in2009.TheCompany’sCAGRforoperatingexpenseswas21.0%.
Overtheyearsreviewed,operatingexpensesforsimilarcompaniesintheindustryhadaCAGRof3.4%.Year‐to‐yearchangesinoperatingexpensesmirroredthechangesinrevenuesandgrossprofitsforthesecompanies,endingwithlowerexpensesin2011than2010.
OperatingexpenseswasanotherareawhereJohnsonAdhesivesshowedsteadilyincreasingspecificamountsbuthadlargeswingsintheyear‐to‐yearchanges.Theseexpensesgrewataratethatwasoversixtimesfasterthansimilarcompaniesintheindustry.
Officers’Compensation
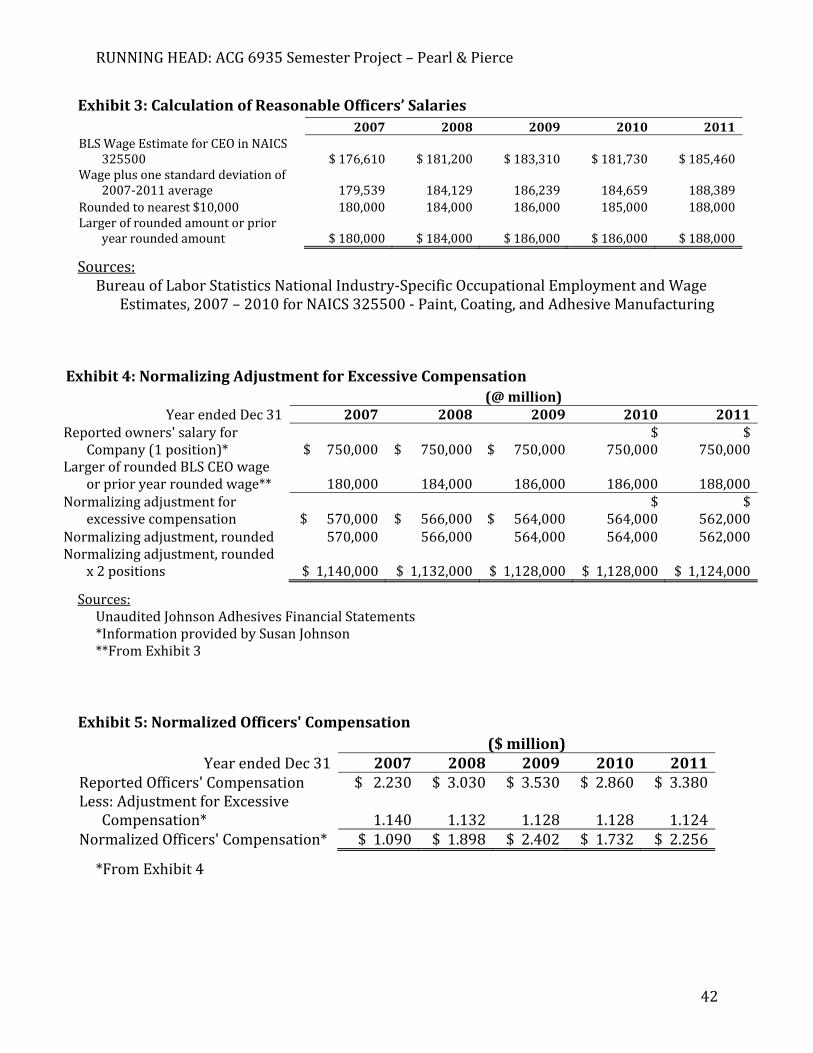
Wejudgedthereportedlevelofficers’compensationtobeinexcessofwhatahypotheticalwillingbuyer,undertheInternalRevenueServiceRevenueRuling59‐60’sdefinitionoffairmarket,wouldofferascompensation.Wereviewedwageand
RUNNINGHEAD:ACG6935SemesterProject–Pearl&Pierce
23
compensationreportsfromtheUnitedStatesBureauofLaborStatistics(BLS).WefocusedonCEOlevelwagesforbusinesseswithNorthAmericanIndustryClassificationSystem(NAICS)code325500‐Paint,Coating,andAdhesiveManufacturingfortheyearsunderreview.
Tocalculateareasonablesalaryfortheofficers’positions,westartedwiththemeansalaryreportedintheBLSwagereportforagivenyearthenaddedonestandarddeviationofthe2007‐2011amountstomakethesalarycompetitivebutreasonablebybringingthesalaryabovethemeanfortheindustry.Thisamountwasroundedtothenearest$10,000.Weusedthehigherofeitherthisroundedamountortheamountthatweusedfortheprioryear’ssalary.Wedidthistopreventadeclineinsalaryovertheprioryearwhichwouldhaveoccurredin2010duetotheindustryaverageCEOsalarydroppinginthatyear’sBLSreport.UsingthesevaluesandinformationprovidedbySusanJohnson,wereclassifiedofficers’salariesinexcessofthecalculatedwagefortheyearbyreducingtheexpensechargedintheofficers’compensationaccount.WedemonstratethesecalculationsinExhibit3throughExhibit6onpages42‐44.
Pre‐TaxIncome
JohnsonAdhesivesincomebeforetaxesgrewatacompoundannualrateof3.6%overtheyearswereviewed.ThisgrowthrateissmallerthantheCompany’sgrowthinnetrevenues.Actualdollarvaluesfluctuatedfromyear‐to‐yearwithtwoyearsofincreasingpre‐taxincomeeachfollowedbyayearofsmallerincomebeforetaxes.TheCompany’s2011incomebeforetaxeswas$7.43million.
Thecompoundannualgrowthrateforincomebeforetaxeswasamodest3.1%fortheindustryovertheyearsanalyzed.Weagainfoundthatthetrendwasaslowinggrowthrateuntil2011,whentheindustry’spre‐taxincomeshrankincomparisonto2010.
JAshowedahigherCAGRforpre‐taxincomethandidtheindustryfortheperiodreviewed.However,theannualgrowthforJohnsonAdhesiveswasvolatilewithperiodsofgrowingincomebeforetaxesandyearsofshrinkingpre‐taxincome.
NetIncome
JohnsonAdhesiveswasorganizedasapass‐throughentity,specificallyanScorporation,duringtheyearsreviewed.Assuch,pre‐taxincomeandnetincomewereequalineachyear.
BalanceSheetAnalysis
WeanalyzetheJohnsonAdhesivesnormalizedbalancesheetsbelow.

RUNNINGHEAD:ACG6935SemesterProject–Pearl&Pierce
24
CurrentAssets
TheCompany’scurrentassetstotaled$11.69millionattheendoffiscalyear2011.Currentassetsgrewatacompoundannualrateof6.3%sincethe2007balancesheetdate.However,thegrowthwasunsteadywithalargepeakin2009,followedbyareductionandendingessentiallyflatin2011.Currentassetsasapercentageoftotalassetsdeclinedfrom55.3%to40.7%overtheyearsreviewed.
Incontrast,theindustrytrendincurrentassetswasslowinggrowththrough2010andareductioninendingcurrentassetsin2011.IndustryCAGRforcurrentassetswas2.3%overthistimeframe.Currentassetsasapercentageoftotalassetsremainedessentiallyunchangednear70%throughoutthetimeperiodexamined.
Whilesteadilyincreasinginvalue,JohnsonAdhesives’ratioofcurrenttototalassetsdeclinedfrom2007–2011whiletheindustryshowednosuchchangeinstructuringassets.Furthermore,JA’scurrenttototalassetsratiowassignificantlylowerthantheindustry’sratioineachyear.
TotalAssets
TotalassetsforJohnsonAdhesivesgrewatacompoundannualrateof14.7%overtheyearsreviewed.Muchofthisgrowthoccurredin2009withsignificantincreasesincurrent,fixed,andotherassets,andasecond,butsmaller,increasein2011.JAended2011withtotalassetsvaluedat$28.72million.
Theindustrysawslowergrowthinassetsacrossthesameperiod,withaCAGRof3.2%.Growthinindustrytotalassetsslowedacrosstheyearsweanalyzed,ending20117.2%lowerthanattheendof2010.
JohnsonAdhesivesexperiencedstrongergrowthintotalassetsthandiditsindustrypeers.Whiletheindustryexperiencedatimeofslowingandeventuallynegativegrowth,theCompany’sgrowthintotalassetswaspredominantlypositivewithoneyearofessentiallynochange.
CurrentLiabilities
JohnsonAdhesivesended2011with$11.50millionincurrentliabilities.Thisrepresenteda23.5%CAGRincurrentliabilitiessinceDecember31,2007.AswithotherJAaccountsweanalyzed,currentliabilitiesfluctuatedthroughouttheperiodreviewedinapatternofoneyearofreductionfollowedbyayearwithalargeincreaseincurrentliabilities.Currentliabilitiesasapercentageoftotalassetsrangedfromalowof23.9%toahighof40.1%duringthefiveyearsweexamined.Theratiofluctuatedeachyear.
RUNNINGHEAD:ACG6935SemesterProject–Pearl&Pierce
25
Overthesameperiod,theindustrysawaCAGRincurrentliabilitiesof5.8%.Again,thetrendwasoneofslowinggrowththrough2010andshrinkagein2011.Theindustryratioofcurrentliabilitiestototalassetsgrewslightlyeachyearfrom34.4%in2007to38.1%in2011.
TotalLiabilities
JohnsonAdhesives’totalliabilitiesgrewfrom$9.90milliononDecember31,2007to$17.33milliononDecember31,2011.ThisisaCAGRof15.0%acrosstheseyears;however,thechangeintotalliabilitieswasuneventhroughouttheperiod.Afteraslightdeclinein2008,liabilitiesjumpedby80%in2009.JAheldtotalliabilitiesbetweenone‐halftotwo‐thirdsoftotalassetsacrosstheperiod.
IndustryCAGRfortotalliabilitieswas5.3%acrossthefiveyearswereviewed.Thegrowthintotalliabilitiesshowedadownwardtrendbeforebecomingnegativein2011.Thevalueoftheindustry’stotalliabilitiesremainednear50%ofthevalueofitstotalassets.
Stockholders’Equity
JohnsonAdhesives’bookvalueofstockholders’equitygrewfrom$6.69millionin2007to$11.39millionin2011.Thisrepresents40%ofthevalueoftotalassetsineachyear.However,thevalueasapercentageoftotalassetsfluctuatedduringtheinterveningyearswithalowof33.7%andahighof49.5%.
Industryequityasapercentageofitstotalassetsdeclinedslightlyfrom51%in2007to47%in2011.
RatioAnalysis
WeconductedananalysisofvariousfinancialratiostoexaminethefinancialpositionofJohnsonAdhesives.Thevariousratiosareclassifiedanddescribedbelow.
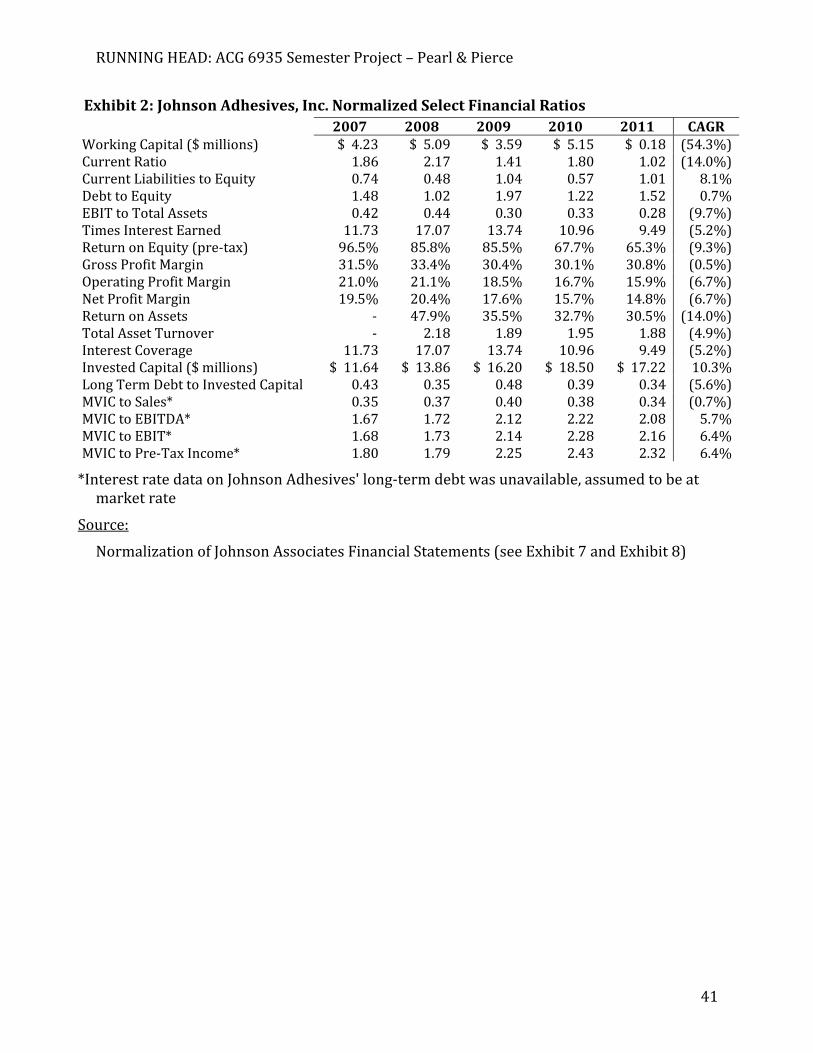
LiquidityRatios
JohnsonAdhesives’workingcapitalhasfallensubstantiallysince2007witha2011balanceof$0.18million.Thecurrentratioreflectsthiswithadeclineto1.02fromahighof2.17in2008.
Thecurrentratiofortheindustryhasfallenoverthesametimeperiod,butnotasdramatically.The2011industrycurrentratiowas1.81,downfromahighof2.07in2007.
ThedecliningtrendinJohnsonAdhesives’currentratiocausesconcernsaboutadecreasingliquiditylevelforthecompany.Someofthisdeclinemaybearesultofan
RUNNINGHEAD:ACG6935SemesterProject–Pearl&Pierce
26
increaseinfixedassetsin2011whichcouldindicateasubstantialcashcapitalexpenditurethatmaynotbearecurringitem.Wewerenotprovidedspecificdetailstoinvestigatethisfurther.
ProfitabilityRatios
JohnsonAdhesivesgrossprofitmarginwassteadyacrossthefiveyearsanalyzed,remainingslightlyabove30%.Thegrossprofitmarginwas30.8%in2011.TheCompany’soperatingprofitmarginhastrendeddownwardslightlyfrom21%to16%whileitsnetprofitmarginhasdeclinedfrom19.5%in2007to14.8%in2011.Thereturnonassetsdeclinedfrom48%in2008to30%in2011.
Similarcompaniesintheindustryhaveshownstableprofitabilityratios.Thegrossprofitmarginfortheindustryhasremainedat28.5%,whileitsoperatingprofitmargindeclinedslightlyfrom3.5%to3.1%.However,theindustryhasshownaconsistentnetprofitmarginof1.4%acrossthefiveyearsweanalyzed.Thereturnonassetsfortheindustryheldstableat4%.
Despitedeclinesinitsoperatingandnetprofitmargins,JohnsonAdhesivesshowsconsistentlyhigherprofitabilityratiosthansimilarlysizedcompaniesintheindustry.
LeverageRatios
JohnsonAdhesives’currentliabilitiestoequityratiofluctuatedacrosstheyearswereviewedwithahighof1.04andalowof0.48.The2011ratiowas1.01,andthemeanvaluewas0.74.ThedebttoequityratiofortheCompanyvariedfromahighof1.97toalowof1.02.Thisratioended2011at1.52,slightlyabovethemeanof1.44over2007–2011.Finally,JA’sinterestcoveragedeclinedfromahighof17.07in2008to9.49in2011.
Industryleverageratiosremainedstablefrom2007–2011.For2011,itscurrentliabilitiestoequityratiowas0.81,itsdebttoequityratiowas1.12,itstimesinterestearnedwas2.47,anditsinterestcoveragewas2.47.
JohnsonAdhesivesleverageratiosindicatedacompanythathadcurrentandtotaldebtlevelsthatwereclosetoindustryaverageswhileitsinterestcoverageratiosweremuchhigherthansimilarcompaniesintheindustry.
APPROACHESTOVALUE
Thethreebasicapproachestovaluationthatmustbeconsideredare:
1. TheIncomeApproach,

RUNNINGHEAD:ACG6935SemesterProject–Pearl&Pierce
27
2. TheMarketApproach,and
3. TheAssetBasedApproach.
Withineachoftheseapproachesexistanumberofacceptablevaluationmethodsthatanappraisermayuse.Appraisalstandardssuggestthatthevaluationanalysttestasmanymethodsasmaybeapplicabletothefactsandcircumstancesoftheengagement.Theappraiserthenusesprofessionaljudgmentindetermininghowthesevaluesarereconciledtodeliverafinalestimateofvalue.
IncomeApproach
Theincomeapproachisorientedontheincomestreamsofthebusinessratherthanthebusinessassetsorthemarketforsimilarenterprises.Thisapproachassumesthataninvestorcouldinvestinasimilarpropertyasthatofthesubjectbusiness.
Usingtheincomeapproach,estimatesthevalueofabusinessasthepresentvalueofthefuturebenefitstreamsavailabletotheowners.Thisisdonebycapitalizingasingleperiodincomestreamordiscountingaseriesofprojectedfutureincomestreams.
Asprojectingfutureincomestreamsisaspeculativeprocess,generallyananalystwillusehistoricdatatoderiveastartingpointinmanyoftheincomeapproachmethods.Thisconceptispremisedontheconventionthathistoricaldatacanbeusedtoaccuratelypredictfutureinformation.
MarketApproach
Themarketapproachisconsideredafundamentalapproachtovaluationasfairmarketvalueisdeterminedbythemarket.Usingthemarketapproach,thevaluationanalystlocatesguidelinecompaniestradedonapublicstockexchange.Theguidelinecompaniesshouldbeinthesameorsimilarindustryastheappraisalsubject.Theappraiserassessesthepricingmultiplesoftheguidelinecompaniesandappliesthesemultiplestoappropriatefinancialinformationinthesubjectcompanytoderiveanestimateofvalue.
AssetApproach
Theassetapproachisbasedonvaluingthesubjectcompany’sassets.Assuch,itisnotamarket‐orientedapproach.Eachcomponentofabusinessisvaluedseparately,andtheindividualvaluesaresummedtoarriveatthetotalvalueofthecompany.Theappraiserderivesthevalueofanitembyestimatingthecostofduplicatingorreplacingtheindividualelementsofthebusinessproperty.

RUNNINGHEAD:ACG6935SemesterProject–Pearl&Pierce
28
SummaryoftheValuationApproachesandMethodsUsed
Inapproachingthisengagement,wereviewedthedata,bothhistoriccompanydataandprojectedeconomicdata,inourconsiderationofeachofthethreebasicapproachestovaluationdiscussedabove.Basedontheavailableinformation,wefeelthatthecapitalizationofbenefitsmethodisanappropriateincomeapproachtothevaluationofJohnsonAdhesives,andamarketapproachutilizingfourpricingmultiplesfromfivesimilarcompaniesisreasonableinthisengagement.Wedidnotfeelthatenoughinformationwasavailabletoaccuratelyapplytheassetapproach.Wedescribeouranalysisusingtheseselectedapproachesbelow.
INCOMEAPPROACH
CapitalizationofBenefitsMethod
Acapitalizationrateisarequiredrateofreturnonanincomegeneratingassetafterremovinganticipatedgrowth(Trugman,p.384).Thisrateismarketbasedandincorporatessystematicandunsystematicriskforthebenefitstreamgeneratedbytheasset.
Underthecapitalizationofbenefitsmethod,thevalueofacompanyisderivedbyapplyinganappropriatecapitalizationratetoabenefitstreamgeneratedbythecompany.Thiscapitalizationrateincorporatestherisktotheinvestoroftheparticularbenefitstream.Onceacapitalizationrateisdetermined,astraightforwardmathematicalformulaisappliedtothebenefitstream.Ifthebenefitstreamhasastabilizedgrowthrate,theformulausedisasfollows:
PV=PresentvalueE=Benefitstreamexpectedinnextperiodk=Discountrateg=Growthratefromtimet=0totimet=infinity
Acapitalizationrateisdefinedasadiscountratelessagrowthrate.Giventhisdefinition,thedenominatorintheabovepresentvalueequationequalsthecapitalizationratefortheselectedbenefitstream.Withthisinmind,wecanrearrangetheequationtothefollowing:

RUNNINGHEAD:ACG6935SemesterProject–Pearl&Pierce
29
Inordertodetermineanappropriatebenefitstreamtouseinourcalculations,weanalyzedJohnsonAdhesives’grossprofits,EBITDA,EBIT,andpre‐taxincomeasreportedinthehistoricalfinancialstatementsafterweappliednormalizingadjustments.TheresultsareprovidedinTable3below.
Table3:ComparisonofJohnsonAdhesives'BenefitStreams($millions)YearendedDec.31 Revenues GrossProfit EBITDA EBIT Pre‐tax
Income2007 33.02 10.39 6.99 6.92 6.452008 37.94 12.69 8.07 8.02 7.732009 40.85 12.40 7.66 7.56 7.202010 48.59 14.64 8.33 8.11 7.622011 50.29 15.49 8.28 7.97 7.43Mean 40.10 12.53 7.76 7.65 7.25
Std.Dev. 6.49 1.79 0.50 0.44 0.46COV 0.15 0.14 0.06 0.06 0.06
EBITandpre‐taxincomeappeartobethemoststableofthebenefitstreamsweanalyzed.Bothincomestreamshaveacoefficientofvarianceof0.06andastandarddeviationnear0.45.Thisindicatesalowlevelofvariationandamountsthataretightlyclusteredaroundthemeanofthefiveyearsofinformation.
Theriskassociatedwithabenefitstreamdecreasesasmoreinformationaboutthebenefitbecomesavailable.Aspre‐taxincomeincorporatesmoreinformationabouttheincomeoftheCompany,wehaveselectedpre‐taxincometouseforthevaluecalculation.
AnanalysisofJohnsonAdhesives’historicalincomestatementsshowsarepeatingpatternofanincreaseinoneyearfollowedbyadeclineinthenext.Thispatterntrendsupwardsatacompoundgrowthrateof3.6%overthiscycleandovertheentirefiveyears.Forthisreason,webelievethatanaverageofthe2010and2011pre‐taxincomeisanappropriatevaluetouseasourproxyforfuturebenefits.Thisvalueis$7,526,000.
Usingthefiveyearcompoundgrowthrateof3.6%,wenextcalculatetheexpectedcashflowfromthisbenefitstreambyincreasingthe2010–2011averagepre‐taxincomebythegrowthrate.Thiscalculationyieldsanexpectedpre‐taxincomefor2012of$7,797,941.
Nextwemustcalculatetheappropriatediscountratetoapplytotheselectedbenefitstream.Forthis,wehaveselectedthemodifiedcapitalassetpricingmodel(MCAPM)thatisbasedonthecapitalassetpricingmodel(CAPM)developedbyWilliamSharpe.TheCAPMestimatesadiscountrateforahighlydiversifiedportfoliousingfactorsbasedonstockpricesforpubliccompanies.Asmostcloselyheldbusinessesarenotbroadlydiversified,
RUNNINGHEAD:ACG6935SemesterProject–Pearl&Pierce
30
investorsinsuchabusinessareexposedtoanunsystematicriskthatisspecifictotheindividualcompany.TheformulafortheMCAPMaddsthisrisktothediscountratederivedbyCAPM.TheequationfortheMACPMisshownbelow.
ke=Expectedrateofreturn(discountrateforequity)Rf=Riskfreerateofreturnβ=Systematicrisk(marketrisk)Rm–Rf=Equityriskpremiumα=Companyspecificunsystematicrisk
TheriskfreerateofreturninthismodelisusuallytakenfromU.S.Treasuryissuesonthedateofvaluation.ThespecificTreasuryissuethatananalystselectsisbasedontheexpectedtimehorizonforthevaluationtarget.Inthecaseofavaluationofacloselyheldcompanythatwillcontinuetoberunasagoingconcern,mostvaluationanalystsusetherateofreturnona20‐yearTreasurybondonthedateofvaluation.Inthiscase,therateforsuchabondonDecember31,2011was2.67%asreportedintheFederalReserveH.15report.
Theβ(beta)inthisfunctionisameasureofsystematicriskinherentinadiversifiedportfolio.Itisusedtoaccountforhowasubsetofinvestmentswillchangeinvalueasthewiderportfolio(e.g.theentiremarket)changesinvalue.SinceBigCorecentlysubmittedanoffertopurchaseJohnsonAdhesives,wehaveusedthebetacalculatedforBigCoinourcalculation.
Theequityriskpremium(ERP)isameasureoftherateofreturninexcessoftheriskfreeratethatinvestorsrequireinordertoinvestinanythingotherthanariskfreeasset.TheERPisbasedonlong‐termhistoricaldataonratesofreturninamarket.SeveralsourcesprovideanERPforaparticularperiod.Inthiscase,weselectedthesupplysideERPof6.0%aspublishedintheIbbotsonSBBI2011ValuationYearbook.
Theα(alpha)intheequationrepresentsunsystematic,meaningcompanyspecific,riskinaninvestment.Thisrateisbasedonananalyst’sassessmentofmanyfactorsthataffecttheriskinherentinaspecificcompanyascomparedtoaguidelinecompany.Inthiscase,basedonourexperienceandjudgment,wehaveappliedacompanyspecificriskof20%.
ConclusionofValue–IncomeApproach
Applyingtheaboveinformation,wecalculateadiscountrateof35.63%.Removingtherateoflong‐termgrowthresultsinacapitalizationrateof32%whichweappliedtothe
RUNNINGHEAD:ACG6935SemesterProject–Pearl&Pierce
31
expected2012pre‐taxincome.Thisresultsinavalueof$24.4millionfor100%oftheJohnsonAdhesivesstock.
MARKETAPPROACH
GuidelinePublicCompanyAnalysis
SECEDGARSearch
FollowingRevenueruling59‐60,wereviewedthemarketpriceofstocksforactivelytradedcompaniesinthesameorsimilarindustryasJohnsonAdhesives.WesearchedtheEDGARdatabase(http://www.sec.gov/edgar/searchedgar/companysearch.html)maintainedbytheSecuritiesandExchangeCommissiontofindothercompaniesinthesameSICcodeasJA(SIC2891).Thissearchyieldedalistof15companies.
WenextreviewedthesecompaniesforsimilaritytoJohnsonAdhesivesbyreviewingeachcompany’s10‐KformfortheyearendedDecember31,2011tocomparethecompany’sbusinesslineandgeneralsizeofoperationstoJohnsonAdhesives.Thisnarrowedthelistofguidelinepubliccompaniestoasingleconsideration:H.B.FullerCompany,tradingasFULontheNewYorkStockExchange.
Wefurtherreviewedthiscompanyforappropriateness.Aswouldbeexpectedforapublicallytradedcompany,FULismuchlargerinitsoperationsthanJA.WhileJAhassalespredominantlyintheUnitedStateswithsomeextensionintotheothertwoNAFTAcountriesandtheCaribbeanIslands,FULhasglobaloperationsspanning40countriesinNorthAmerica,Europe,LatinAmerica,theAsiaPacificregion,India,theMiddleEast,andAfrica.IndustrialadhesivesdominatetheproductlineatFUL,whereasJApredominantlytargetsitsproductlinetoconsumerhomeimprovementretailoutlets.Wefeelthatrationalinvestorswouldnotpricethetwocompaniesinasimilarmannerbecauseofthesignificantdifferencesinsalesregions,products,andcustomers.Thesedifferencesresultindissimilarriskstoeachcompany’sbusiness.Therefore,FULisnotanappropriateguidelinecompanytouse.
CrainValDatabaseSearch
Next,searchingtheCrainValdatabase,wefoundfivepubliccompanieswebelievedweresimilarenoughtoJohnsonAdhesivestouseasguidelinecompanies.Wecalculatedfourpricemultiplesforthesecompaniesasseeninthetablebelow.
RUNNINGHEAD:ACG6935SemesterProject–Pearl&Pierce
32
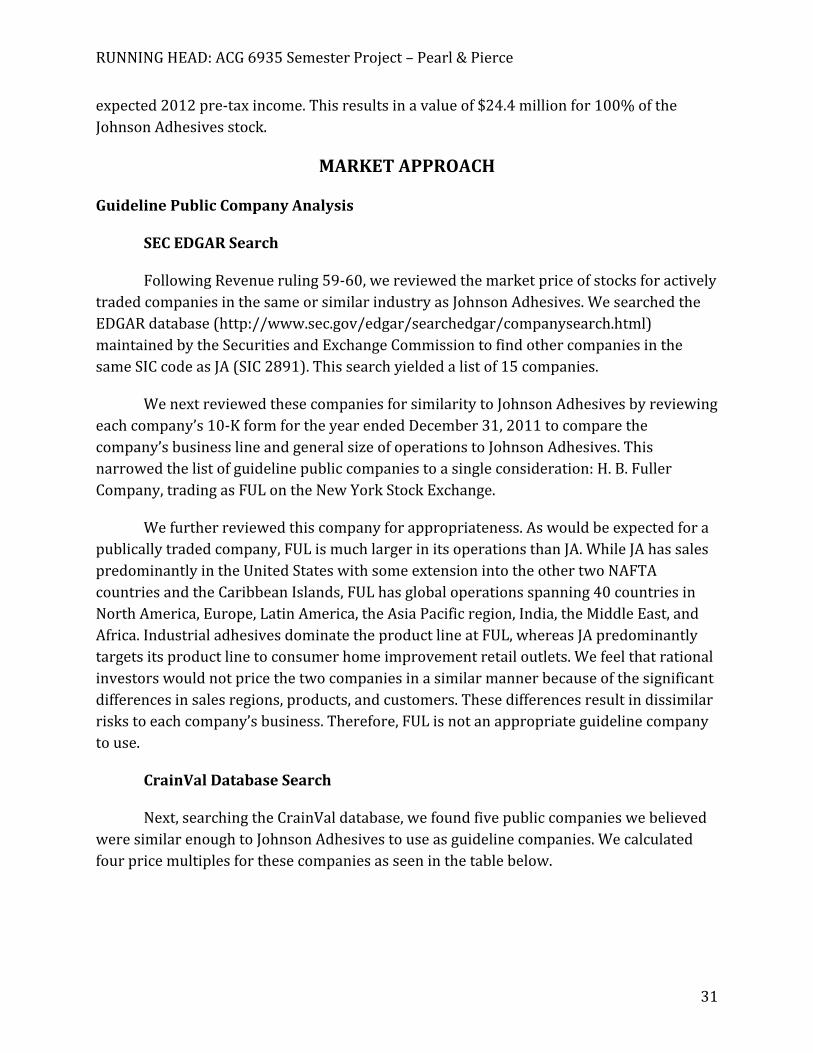
Table4:GuidelineCompanyMedianPriceMultiplesMarketValueofInvestedCapitaltosales 0.54MarketValueofInvestedCapitaltoEBITDA 5.80MarketValueofInvestedCapitaltoEBIT 7.26MarketValueofEquitytoPre‐TaxIncome 6.72
WeappliedtheseratiostotheequivalentbenefitstreamsintheJohnsonAdhesivesnormalizedincomestatementfor2011.WeplacedtheseindividualcalculationsinExhibit20(seepage51).Usingthesepricingmultiples,thevaluationrangeforJohnsonAdhesivesis$27.2million‐$57.9millionasshownbelowinTable5.
Table5:IndustryPricingRatiosAppliedtoJAIncomePricingMultiple IndustryRatio JAAmount Value(100%)MVICtosales 0.54 $50,290,000 $27,156,600MVICtoEBITDA 5.80 8,284,000 48,047,200MVICtoEBIT 7.26 7,974,000 57,891,240MVICtopre‐taxincome 6.72 7,434,000 49,956,480
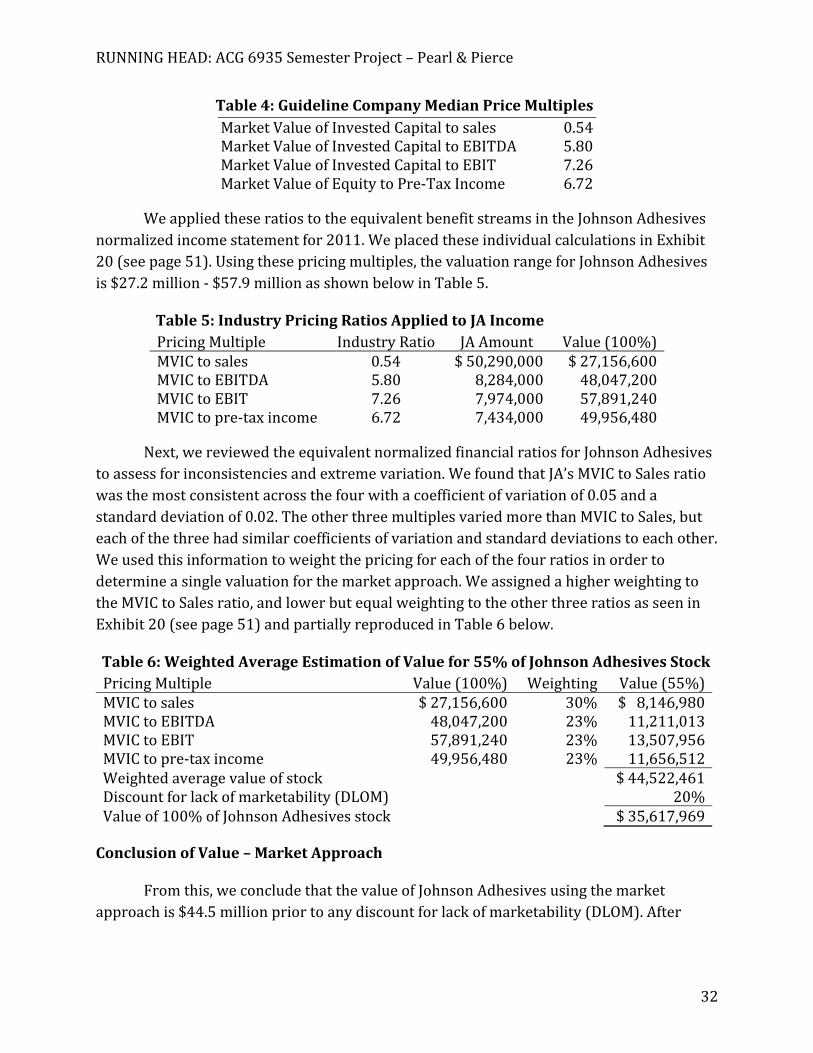
Next,wereviewedtheequivalentnormalizedfinancialratiosforJohnsonAdhesivestoassessforinconsistenciesandextremevariation.WefoundthatJA’sMVICtoSalesratiowasthemostconsistentacrossthefourwithacoefficientofvariationof0.05andastandarddeviationof0.02.TheotherthreemultiplesvariedmorethanMVICtoSales,buteachofthethreehadsimilarcoefficientsofvariationandstandarddeviationstoeachother.Weusedthisinformationtoweightthepricingforeachofthefourratiosinordertodetermineasinglevaluationforthemarketapproach.WeassignedahigherweightingtotheMVICtoSalesratio,andlowerbutequalweightingtotheotherthreeratiosasseeninExhibit20(seepage51)andpartiallyreproducedinTable6below.
Table6:WeightedAverageEstimationofValuefor55%ofJohnsonAdhesivesStockPricingMultiple Value(100%) Weighting Value(55%)MVICtosales $27,156,600 30% $8,146,980MVICtoEBITDA 48,047,200 23% 11,211,013MVICtoEBIT 57,891,240 23% 13,507,956MVICtopre‐taxincome 49,956,480 23% 11,656,512Weightedaveragevalueofstock $44,522,461Discountforlackofmarketability(DLOM) 20%Valueof100%ofJohnsonAdhesivesstock $35,617,969
ConclusionofValue–MarketApproach
Fromthis,weconcludethatthevalueofJohnsonAdhesivesusingthemarketapproachis$44.5millionpriortoanydiscountforlackofmarketability(DLOM).After

RUNNINGHEAD:ACG6935SemesterProject–Pearl&Pierce
33
applyingtheDLOM(discussedbelow),ourfinalvaluationof100%oftheJohnsonAdhesivesstockusingthemarketapproachis$36.6million.
DISCOUNTFORLACKOFMARKETABILITY
BigCosubmittedanoffertobuyJohnsonAdhesivesoneyearpriortothewritingofthisreport.WefeelthatthisdemonstratesthatJAislargeenoughtobeconsideredaninvestmentbyapubliccompanyorprivateequityfirmifitcouldbepurchasedinitsentirety.However,afractionalinterestinthecompanyislessmarketable.
“Adiscountforlackofmarketability(DLOM)isusedtocompensateforthedifficultyofsellingsharesofstockthatarenottradedonastockexchangecomparedwiththosethatcanbetradedpublicly”(Trugman,2008,p.412).JohnsonAdhesivesisacloselyheldcompanythatisnottradedonanyexchange.Themarketpriceforsharesinapubliclytradedcompanyarepremisedinpartontheliquidityoftheinvestment.Sharesinsuchacompanyareeasilydisposedofbytheinvestor;however,thatisnotthecasewithownershipinterestinacloselyheldbusiness.Assuch,theapplicationofaDLOMisappropriateinthevaluationoftheCompany.
TheInternalRevenueServiceinRevenueRuling77‐287recognizedtheeffectivenessofrestrictedstockstudiesindetermininganappropriateDLOM.TheaverageDLOMfromthesestudiesrangesfrom25%‐40%.
Wefeelthatthesizepremiumforcompaniesintheinthe10thdecileoftheMorningstar/Ibbotsonreportreflectameasureofthelackofmarketabilityofthesesmallercompaniesduetoalowerlevelofdemandforthestocks.Assuch,wefeelthatanythepricederivedintheincomemethodvaluationreflectsthisbuilt‐inDLOM.Assuch,wehaveappliedadiscountforlackofmarketabilityof20%onlytothevaluederivedfromthemarketapproach.
RECONCILIATIONOFVALUATIONMETHODS
TodetermineouroverallvaluationofthefractionalownershipoftheJohnsonAdhesivesstock,wefirstaveragedthevaluesderivedfromtheincomeandmarketapproaches.Thisresultedinavalueof$30.4millionfor100%ofthecompanystock.
Afterderivingavalueof100%ofthecompany’sstock,wethenreducedthisoverallcompanyvaluetothe55%ownershipbeingappraised.Ouranalysisrevealsafairmarketvalueof$16.8millionforMr.Johnson’ssharesonDecember31,2011.
RUNNINGHEAD:ACG6935SemesterProject–Pearl&Pierce
34
REASONABLENESSTEST
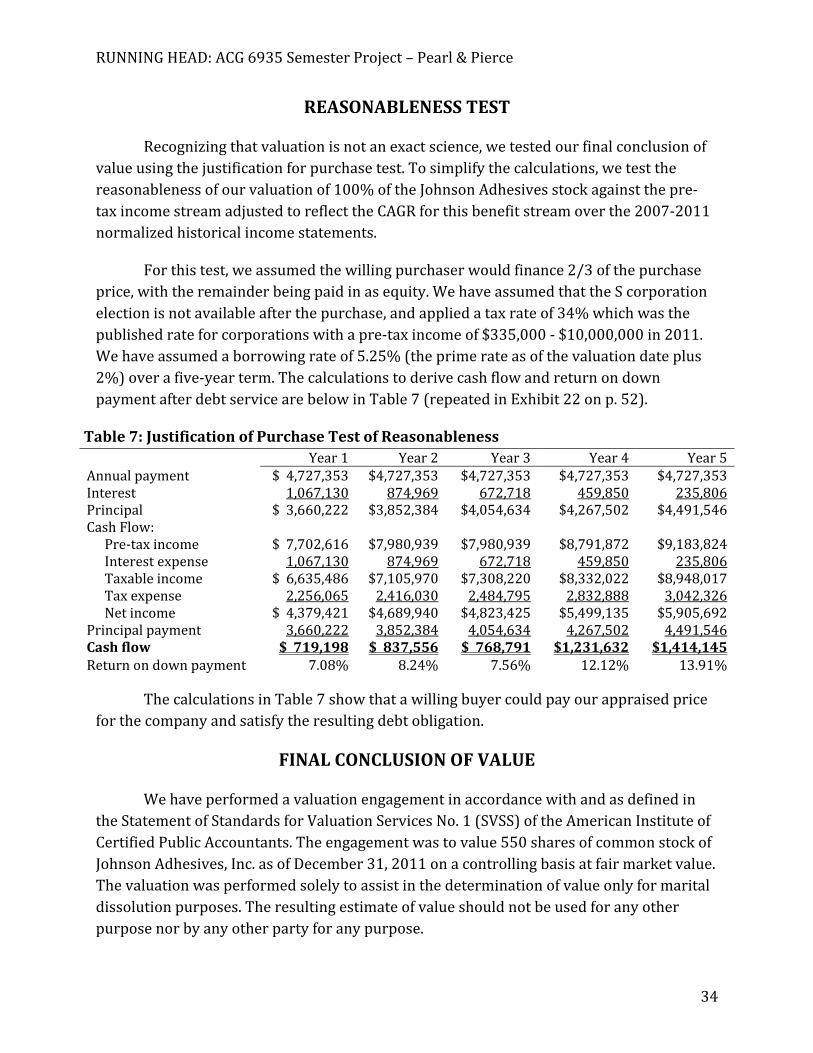
Recognizingthatvaluationisnotanexactscience,wetestedourfinalconclusionofvalueusingthejustificationforpurchasetest.Tosimplifythecalculations,wetestthereasonablenessofourvaluationof100%oftheJohnsonAdhesivesstockagainstthepre‐taxincomestreamadjustedtoreflecttheCAGRforthisbenefitstreamoverthe2007‐2011normalizedhistoricalincomestatements.
Forthistest,weassumedthewillingpurchaserwouldfinance2/3ofthepurchaseprice,withtheremainderbeingpaidinasequity.WehaveassumedthattheScorporationelectionisnotavailableafterthepurchase,andappliedataxrateof34%whichwasthepublishedrateforcorporationswithapre‐taxincomeof$335,000‐$10,000,000in2011.Wehaveassumedaborrowingrateof5.25%(theprimerateasofthevaluationdateplus2%)overafive‐yearterm.ThecalculationstoderivecashflowandreturnondownpaymentafterdebtservicearebelowinTable7(repeatedinExhibit22onp.52).
Table7:JustificationofPurchaseTestofReasonableness Year1 Year2 Year3 Year4 Year5
Annualpayment $4,727,353 $4,727,353 $4,727,353 $4,727,353 $4,727,353Interest 1,067,130 874,969 672,718 459,850 235,806Principal $3,660,222 $3,852,384 $4,054,634 $4,267,502 $4,491,546CashFlow: Pre‐taxincome $7,702,616 $7,980,939 $7,980,939 $8,791,872 $9,183,824Interestexpense 1,067,130 874,969 672,718 459,850 235,806Taxableincome $6,635,486 $7,105,970 $7,308,220 $8,332,022 $8,948,017Taxexpense 2,256,065 2,416,030 2,484,795 2,832,888 3,042,326Netincome $4,379,421 $4,689,940 $4,823,425 $5,499,135 $5,905,692
Principalpayment 3,660,222 3,852,384 4,054,634 4,267,502 4,491,546Cashflow $719,198 $837,556 $768,791 $1,231,632 $1,414,145Returnondownpayment 7.08% 8.24% 7.56% 12.12% 13.91%
ThecalculationsinTable7showthatawillingbuyercouldpayourappraisedpriceforthecompanyandsatisfytheresultingdebtobligation.
FINALCONCLUSIONOFVALUE
WehaveperformedavaluationengagementinaccordancewithandasdefinedintheStatementofStandardsforValuationServicesNo.1(SVSS)oftheAmericanInstituteofCertifiedPublicAccountants.Theengagementwastovalue550sharesofcommonstockofJohnsonAdhesives,Inc.asofDecember31,2011onacontrollingbasisatfairmarketvalue.Thevaluationwasperformedsolelytoassistinthedeterminationofvalueonlyformaritaldissolutionpurposes.Theresultingestimateofvalueshouldnotbeusedforanyotherpurposenorbyanyotherpartyforanypurpose.
RUNNINGHEAD:ACG6935SemesterProject–Pearl&Pierce
35
TheonlylimitationonourvaluationengagementwasaninabilitytointerviewJohnsonAssociatesmanagement.
Basedonouranalysisdescribedinthisreport,thefactsandcircumstancesasofthevaluationdate,ourestimateofthefairmarketvalueof550sharesofthecommonstockofJohnsonAdhesives,Inc.asofDecember31,2011,onacontrollingbasisis$16,500,000.Thisequatesto$30,000.00pershare.ThisconclusionissubjecttotheStatementofAssumptionsandLimitingConditionsfoundearlierinthisreportandtotheValuationAnalysts’RepresentationinAppendix1.Wehavenoobligationtoupdatethisreportorourconclusionofvalueforinformationthatcomestoourattentionafterthedateofthereport.
RUNNINGHEAD:ACG6935SemesterProject–Pearl&Pierce
36
BIBLIOGRAPHY
Coons,R.andWalsh,K.AdhesivesandSealants.ChemicalWeek,173.9(Apr.4,2011):p21.
D’Amico,E.andPhillips,K.AdhesivesandSealants,ToughEconomyUngluessomePlayers.ChemicalWeek,170.31(Oct6,2008):19,21‐22.
Dewan,Shaila.(2011,October).U.S.EconomyPicksUpPace,AvertingaStall.NewYorkTimes.Retrievedfromhttp://www.nytimes.com/2011/10/28/business/economy/us‐economy‐shows‐modest‐growth.html?pagewanted=all
EconomicReportofthePresident,(2011).AnnualReportoftheCouncilofEconomicAdvisors.Retrievedfromwebsite:http://www.gpo.gov/fdsys/pkg/ERP‐2011/pdf/ERP‐2011.pdf
EuropeanParliamentandoftheCouncil,EuropeanCommitteeforStandardization.(2011).CouncilRegulationno.1907/2006ofwithAmendments&Appeals(CONSLEG:2006R1907:20111210).Retrievedfromwebsite:http://eur‐lex.europa.eu/LexUriServ/LexUriServ.do?uri=CONSLEG:2006R1907:20111210:EN:PDF
Extance,A.WillAdhesiveRawMaterialPricesEverComeBackDown?SpecialChem.(Apr1,2011).
GlobalAdhesives&SealantMarketbyType,Applications,Trends,&Forecasts(2011‐2016).(2011,December21).PRNewswire.
GlobalMarketforAdhesivestoReachUS$38BillionandSealantstoReachUS$6.5Billionby2017.In(2011).AdhesivesandSealants:AGlobalStrategicBusinessReport.Retrievedfromhttp://www.prweb.com/releases/adhesives/sealants/prweb8957272.htm
Kusumgar,M.(2011,January).Theglobalformulatedadhesivesmarket.AdhesivesMagazine,Retrievedfromhttp://www.adhesivesmag.com/articles/the‐global‐formulated‐adhesives‐market
Murad,D.(2010,February1).StrategicSolutions:2010OutlookfortheAdhesivesandSealantsIndustry.AdhesivesMagazine,17(2),13.Retrievedfromhttp://www.adhesivesmag.com/articles/strategic‐solutions‐2010‐outlook‐for‐the‐adhesives‐and‐sealants‐industry

RUNNINGHEAD:ACG6935SemesterProject–Pearl&Pierce
37
Murad,D.(November,12011).StrategicSolutions:2011IndustryOutlook.AdhesivesMagazine,Retrievedfromhttp://www.adhesivesmag.com/articles/90807‐strategic‐solutions‐‐2011‐industry‐outlook
ChemQuest,Inc.(Performer:Murad,D)(2011,January12).Webcast:AdhesiveandSealantsMarket‐WillDemandReboundin2011?.GersonLehrmanGroupResearch.[Videopodcast].Retrievedfromhttp://www.glgresearch.com/Council‐Events/Webcast‐‐Adhesives‐and‐Sealants‐Market‐‐‐Will‐Demand‐Rebound‐in‐2011‐‐(11‐00‐AM‐EST)‐9213967.html
Nick,D.(2010,November).IstheRecessionOver?.www.adhesivesmag.com,Retrievedfromhttp://www.adhesivesmag.com/articles/is‐the‐recession‐over
Pierce,L.M.(2011,June10).ASCReportDefinesAdhesive/SealantMarketSizeandGrowthExpectations.PackagingDigest,Retrievedfromhttp://www.packagingdigest.com/article/518484‐ASC_report_defines_adhesive_sealant_market_size_and_growth_expectations.php
Riley,G.(2011,December27).2011InReview‐theUSEconomy.tutr2u.Retrievedfromhttp://tutor2u.net/blog/index.php/economics/comments/2011‐in‐review‐the‐us‐economy
Schmitt,B.(2003,April9).Adhesives&Sealants;MarginsonaSlipperySlope.ChemicalWeek,21.
Trugman,G.R.(2008).Understandingbusinessvaluation:Apracticalguidetovaluingsmalltomediumsizedbusinesses.(3rded.).NewYork,NY:AmericanInstituteofCertifiedPublicAccountants,Inc.
VOCRegulationsforAdhesivesandSealants.In(2009).CommonQuestionsandAnswersRetrievedfromhttp://www.greensafecertified.com/PDFs/VOC_Q_&_A[1].pdf
Walsh,K.(2010,October).Adhesivesandsealants.ChemicalWeek,172(24),29‐31.Retrievedfromhttp://search.proquest.com.ezproxy.fau.edu/docview/760104001/abstract?accountid=10902
WorldEconomicOutlook:UPDATE,SlowingGrowth,RisingCosts.(September,2011).InternationalMonetaryFund.Retrievedfromhttp://www.imf.org
RUNNINGHEAD:ACG6935SemesterProject–Pearl&Pierce
38
U.S.EconomyonFirmerGround?(2011).EconomicWeekInReview,VangaurdGroup,Inc.https://personal.vanguard.com/us/insights/article/economic‐week‐review‐12022011
RUNNINGHEAD:ACG6935SemesterProject–Pearl&Pierce
39
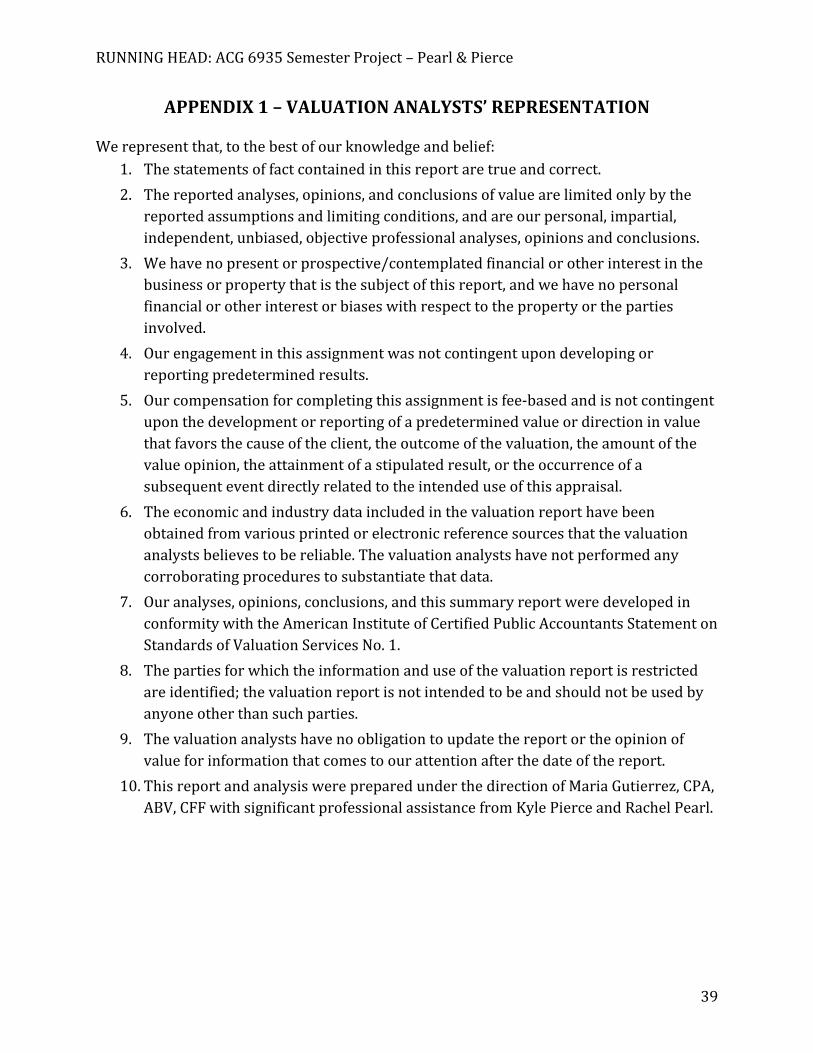
APPENDIX1–VALUATIONANALYSTS’REPRESENTATION
Werepresentthat,tothebestofourknowledgeandbelief:1. Thestatementsoffactcontainedinthisreportaretrueandcorrect.
2. Thereportedanalyses,opinions,andconclusionsofvaluearelimitedonlybythereportedassumptionsandlimitingconditions,andareourpersonal,impartial,independent,unbiased,objectiveprofessionalanalyses,opinionsandconclusions.
3. Wehavenopresentorprospective/contemplatedfinancialorotherinterestinthebusinessorpropertythatisthesubjectofthisreport,andwehavenopersonalfinancialorotherinterestorbiaseswithrespecttothepropertyorthepartiesinvolved.
4. Ourengagementinthisassignmentwasnotcontingentupondevelopingorreportingpredeterminedresults.
5. Ourcompensationforcompletingthisassignmentisfee‐basedandisnotcontingentuponthedevelopmentorreportingofapredeterminedvalueordirectioninvaluethatfavorsthecauseoftheclient,theoutcomeofthevaluation,theamountofthevalueopinion,theattainmentofastipulatedresult,ortheoccurrenceofasubsequenteventdirectlyrelatedtotheintendeduseofthisappraisal.
6. Theeconomicandindustrydataincludedinthevaluationreporthavebeenobtainedfromvariousprintedorelectronicreferencesourcesthatthevaluationanalystsbelievestobereliable.Thevaluationanalystshavenotperformedanycorroboratingprocedurestosubstantiatethatdata.
7. Ouranalyses,opinions,conclusions,andthissummaryreportweredevelopedinconformitywiththeAmericanInstituteofCertifiedPublicAccountantsStatementonStandardsofValuationServicesNo.1.
8. Thepartiesforwhichtheinformationanduseofthevaluationreportisrestrictedareidentified;thevaluationreportisnotintendedtobeandshouldnotbeusedbyanyoneotherthansuchparties.
9. Thevaluationanalystshavenoobligationtoupdatethereportortheopinionofvalueforinformationthatcomestoourattentionafterthedateofthereport.
10. ThisreportandanalysiswerepreparedunderthedirectionofMariaGutierrez,CPA,ABV,CFFwithsignificantprofessionalassistancefromKylePierceandRachelPearl.
RUNNINGHEAD:ACG6935SemesterProject–Pearl&Pierce
40
APPENDIX2–SELECTFINANCIALDATA
Exhibit1:JohnsonAdhesives,Inc.SummaryofFinancialStatementsBalanceSheets ($million)
Dec31 2007 2008 2009 2010 2011
ASSETSCurrentAssets $9.17 $9.43 $12.37 $11.56 $11.69FixedAssets‐Net 6.79 7.65 9.37 10.36 13.87OtherAssets 0.62 1.12 3.25 3.00 3.17
TotalAssets $16.58 $18.20 $24.98 $24.92 $28.72
LIABILITIESANDEQUITYCurrentLiabilities $4.94 $4.34 $8.78 $6.41 $11.50Long‐termLiabilities 4.96 4.85 7.78 7.26 5.83TotalLiabilities 9.90 9.19 16.56 13.67 17.33
Equity 6.69 9.01 8.42 11.25 11.39TotalLiabilitiesandEquity $16.58 $18.20 $24.98 $24.92 $28.72
IncomeStatements ($million)YearendedDec31 2007 2008 2009 2010 2011
Revenues $33.02 $37.94 $40.85 $48.59 $50.29CostofGoodsSold 22.63 25.25 28.45 33.95 34.80GrossProfit 10.39 12.69 12.39 14.64 15.49OperatingExpenses 3.31 3.72 4.34 5.58 5.95Officers'Compensation 2.23 3.03 3.53 2.86 3.38OperatingEBITDA 4.86 5.94 4.52 6.20 6.15DepreciationandAmortization 0.07 0.05 0.10 0.22 0.31OperatingIncome(EBIT) 4.79 5.89 4.42 5.99 5.84Miscellaneous(Income) (0.12) (0.18) (0.19) (0.25) (0.30)InterestExpense 0.59 0.47 0.55 0.74 0.84Pre‐taxIncome 4.31 5.60 4.06 5.49 5.29Less:IncomeTaxes 0.00 0.00 0.00 0.00 0.00NetIncome $4.31 $5.60 $4.06 $5.49 $5.29Source:
JohnsonAssociatesFinancialStatements
RUNNINGHEAD:ACG6935SemesterProject–Pearl&Pierce
41
Exhibit2:JohnsonAdhesives,Inc.NormalizedSelectFinancialRatios2007 2008 2009 2010 2011 CAGR
WorkingCapital($millions) $4.23 $5.09 $3.59 $5.15 $0.18 (54.3%)CurrentRatio 1.86 2.17 1.41 1.80 1.02 (14.0%)CurrentLiabilitiestoEquity 0.74 0.48 1.04 0.57 1.01 8.1%DebttoEquity 1.48 1.02 1.97 1.22 1.52 0.7%EBITtoTotalAssets 0.42 0.44 0.30 0.33 0.28 (9.7%)TimesInterestEarned 11.73 17.07 13.74 10.96 9.49 (5.2%)ReturnonEquity(pre‐tax) 96.5% 85.8% 85.5% 67.7% 65.3% (9.3%)GrossProfitMargin 31.5% 33.4% 30.4% 30.1% 30.8% (0.5%)OperatingProfitMargin 21.0% 21.1% 18.5% 16.7% 15.9% (6.7%)NetProfitMargin 19.5% 20.4% 17.6% 15.7% 14.8% (6.7%)ReturnonAssets ‐ 47.9% 35.5% 32.7% 30.5% (14.0%)TotalAssetTurnover ‐ 2.18 1.89 1.95 1.88 (4.9%)InterestCoverage 11.73 17.07 13.74 10.96 9.49 (5.2%)InvestedCapital($millions) $11.64 $13.86 $16.20 $18.50 $17.22 10.3%LongTermDebttoInvestedCapital 0.43 0.35 0.48 0.39 0.34 (5.6%)MVICtoSales* 0.35 0.37 0.40 0.38 0.34 (0.7%)MVICtoEBITDA* 1.67 1.72 2.12 2.22 2.08 5.7%MVICtoEBIT* 1.68 1.73 2.14 2.28 2.16 6.4%MVICtoPre‐TaxIncome* 1.80 1.79 2.25 2.43 2.32 6.4%
*InterestratedataonJohnsonAdhesives'long‐termdebtwasunavailable,assumedtobeatmarketrate
Source:
NormalizationofJohnsonAssociatesFinancialStatements(seeExhibit7andExhibit8)
RUNNINGHEAD:ACG6935SemesterProject–Pearl&Pierce
42
Exhibit3:CalculationofReasonableOfficers’Salaries 2007 2008 2009 2010 2011BLSWageEstimateforCEOinNAICS
325500 $176,610 $181,200 $183,310 $181,730 $185,460Wageplusonestandarddeviationof
2007‐2011average 179,539 184,129 186,239 184,659 188,389Roundedtonearest$10,000 180,000 184,000 186,000 185,000 188,000Largerofroundedamountorprior
yearroundedamount $180,000 $184,000 $186,000 $186,000 $188,000
Sources:BureauofLaborStatisticsNationalIndustry‐SpecificOccupationalEmploymentandWage
Estimates,2007–2010forNAICS325500‐Paint,Coating,andAdhesiveManufacturing
Exhibit4:NormalizingAdjustmentforExcessiveCompensation(@million)
YearendedDec31 2007 2008 2009 2010 2011Reportedowners'salaryfor
Company(1position)* $750,000 $750,000 $750,000$
750,000$
750,000LargerofroundedBLSCEOwage
orprioryearroundedwage** 180,000 184,000 186,000 186,000 188,000Normalizingadjustmentfor
excessivecompensation $570,000 $566,000 $564,000$
564,000$
562,000Normalizingadjustment,rounded 570,000 566,000 564,000 564,000 562,000Normalizingadjustment,rounded
x2positions $1,140,000 $1,132,000 $1,128,000 $1,128,000 $1,124,000
Sources:UnauditedJohnsonAdhesivesFinancialStatements*InformationprovidedbySusanJohnson**FromExhibit3
Exhibit5:NormalizedOfficers'Compensation($million)
YearendedDec31 2007 2008 2009 2010 2011ReportedOfficers'Compensation $2.230 $3.030 $3.530 $2.860 $3.380Less:AdjustmentforExcessive
Compensation* 1.140 1.132 1.128 1.128 1.124NormalizedOfficers'Compensation* $1.090 $1.898 $2.402 $1.732 $2.256
*FromExhibit4
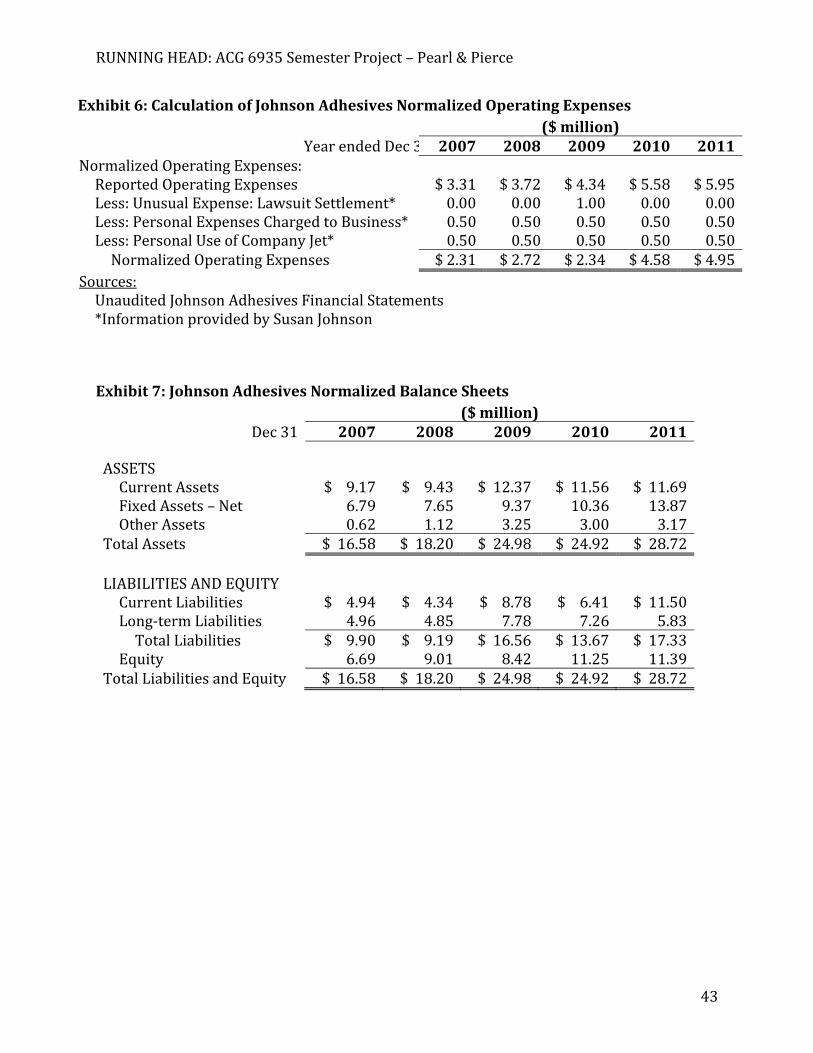
RUNNINGHEAD:ACG6935SemesterProject–Pearl&Pierce
43
Exhibit6:CalculationofJohnsonAdhesivesNormalizedOperatingExpenses($million)
YearendedDec3 2007 2008 2009 2010 2011NormalizedOperatingExpenses:ReportedOperatingExpenses $3.31 $3.72 $4.34 $5.58 $5.95Less:UnusualExpense:LawsuitSettlement* 0.00 0.00 1.00 0.00 0.00Less:PersonalExpensesChargedtoBusiness* 0.50 0.50 0.50 0.50 0.50Less:PersonalUseofCompanyJet* 0.50 0.50 0.50 0.50 0.50NormalizedOperatingExpenses $2.31 $2.72 $2.34 $4.58 $4.95
Sources:UnauditedJohnsonAdhesivesFinancialStatements*InformationprovidedbySusanJohnson
Exhibit7:JohnsonAdhesivesNormalizedBalanceSheets ($million)
Dec31 2007 2008 2009 2010 2011
ASSETSCurrentAssets $9.17 $9.43 $12.37 $11.56 $11.69FixedAssets–Net 6.79 7.65 9.37 10.36 13.87OtherAssets 0.62 1.12 3.25 3.00 3.17
TotalAssets $16.58 $18.20 $24.98 $24.92 $28.72
LIABILITIESANDEQUITYCurrentLiabilities $4.94 $4.34 $8.78 $6.41 $11.50Long‐termLiabilities 4.96 4.85 7.78 7.26 5.83TotalLiabilities $9.90 $9.19 $16.56 $13.67 $17.33
Equity 6.69 9.01 8.42 11.25 11.39TotalLiabilitiesandEquity $16.58 $18.20 $24.98 $24.92 $28.72

RUNNINGHEAD:ACG6935SemesterProject–Pearl&Pierce
44
Exhibit8:JohnsonAdhesivesNormalizedIncomeStatements($million)
YearendedDec31 2007 2008 2009 2010 2011
Revenues $33.02 $37.94 $40.85 $48.59 $50.29CostofGoodsSold 22.63 25.25 28.45 33.95 34.80GrossProfit $10.39 $12.69 $12.40 $14.64 $15.49NormalizedOperatingExpenses 2.31 2.72 2.34 4.58 4.95NormalizedOfficers'Compensation 1.09 1.90 2.40 1.73 2.26OperatingEBITDA $6.99 $8.07 $7.66 $8.33 $8.28DepreciationandAmortization 0.07 0.05 0.10 0.22 0.31OperatingIncome(EBIT) $6.92 $8.02 $7.56 $8.11 $7.97Miscellaneous(Income) (0.12) (0.18) (0.19) (0.25) (0.30)InterestExpense 0.59 0.47 0.55 0.74 0.84Pre‐taxIncome $6.45 $7.73 $7.20 $7.62 $7.43Less:IncomeTaxes* 0.00 0.00 0.00 0.00 0.00NormalizedNetIncome $6.45 $7.73 $7.20 $7.62 $7.43
Exhibit9:JohnsonAdhesivesNormalizedBalanceSheetHorizontalAnalysis %of2007Amount
Dec31 2007 2008 2009 2010 2011
ASSETSCurrentAssets 100.0% 102.9% 134.9% 126.1% 127.5%FixedAssets–Net 100.0% 112.6% 137.9% 152.5% 204.2%OtherAssets 100.0% 180.8% 524.2% 484.5% 511.3%
TotalAssets 100.0% 109.7% 150.7% 150.3% 173.2%
LIABILITIESANDEQUITYCurrentLiabilities 100.0% 87.9% 177.7% 129.8% 232.9%Long‐termLiabilities 100.0% 97.8% 157.1% 146.4% 117.6%TotalLiabilities 100.0% 92.8% 167.4% 138.2% 175.2%
Equity 100.0% 134.8% 126.0% 168.2% 170.4%TotalLiabilitiesandEquity 100.0% 109.7% 150.7% 150.3% 173.2%
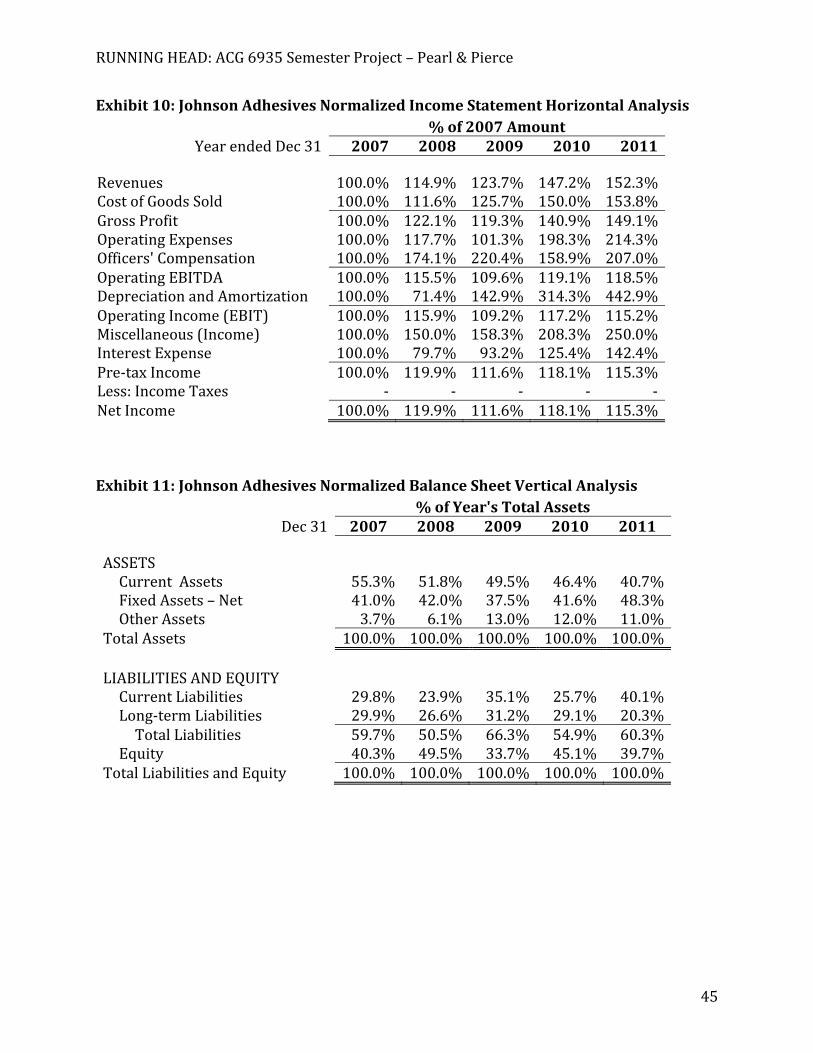
RUNNINGHEAD:ACG6935SemesterProject–Pearl&Pierce
45
Exhibit10:JohnsonAdhesivesNormalizedIncomeStatementHorizontalAnalysis %of2007Amount
YearendedDec31 2007 2008 2009 2010 2011
Revenues 100.0% 114.9% 123.7% 147.2% 152.3%CostofGoodsSold 100.0% 111.6% 125.7% 150.0% 153.8%GrossProfit 100.0% 122.1% 119.3% 140.9% 149.1%OperatingExpenses 100.0% 117.7% 101.3% 198.3% 214.3%Officers'Compensation 100.0% 174.1% 220.4% 158.9% 207.0%OperatingEBITDA 100.0% 115.5% 109.6% 119.1% 118.5%DepreciationandAmortization 100.0% 71.4% 142.9% 314.3% 442.9%OperatingIncome(EBIT) 100.0% 115.9% 109.2% 117.2% 115.2%Miscellaneous(Income) 100.0% 150.0% 158.3% 208.3% 250.0%InterestExpense 100.0% 79.7% 93.2% 125.4% 142.4%Pre‐taxIncome 100.0% 119.9% 111.6% 118.1% 115.3%Less:IncomeTaxes ‐ ‐ ‐ ‐ ‐NetIncome 100.0% 119.9% 111.6% 118.1% 115.3%
Exhibit11:JohnsonAdhesivesNormalizedBalanceSheetVerticalAnalysis %ofYear'sTotalAssets
Dec31 2007 2008 2009 2010 2011
ASSETSCurrentAssets 55.3% 51.8% 49.5% 46.4% 40.7%FixedAssets–Net 41.0% 42.0% 37.5% 41.6% 48.3%OtherAssets 3.7% 6.1% 13.0% 12.0% 11.0%
TotalAssets 100.0% 100.0% 100.0% 100.0% 100.0%
LIABILITIESANDEQUITYCurrentLiabilities 29.8% 23.9% 35.1% 25.7% 40.1%Long‐termLiabilities 29.9% 26.6% 31.2% 29.1% 20.3%TotalLiabilities 59.7% 50.5% 66.3% 54.9% 60.3%
Equity 40.3% 49.5% 33.7% 45.1% 39.7%TotalLiabilitiesandEquity 100.0% 100.0% 100.0% 100.0% 100.0%

RUNNINGHEAD:ACG6935SemesterProject–Pearl&Pierce
46
Exhibit12:JohnsonAdhesivesNormalizedIncomeStatementsVerticalAnalysis %ofYear'sTotalRevenues
YearendedDec31 2007 2008 2009 2010 2011
Revenues 100.0% 100.0% 100.0% 100.0% 100.0%CostofGoodsSold 68.5% 66.6% 69.6% 69.9% 69.2%GrossProfit 31.5% 33.4% 30.4% 30.1% 30.8%OperatingExpenses 7.0% 7.2% 5.7% 9.4% 9.8%Officers'Compensation 3.3% 5.0% 5.9% 3.6% 4.5%OperatingEBITDA 21.2% 21.3% 18.7% 17.1% 16.5%DepreciationandAmortization 0.2% 0.1% 0.2% 0.5% 0.6%OperatingIncome(EBIT) 21.0% 21.1% 18.5% 16.7% 15.9%Miscellaneous(Income) (0.4%) (0.5%) (0.5%) (0.5%) (0.6%)InterestExpense 1.8% 1.2% 1.3% 1.5% 1.7%Pre‐taxIncome 19.5% 20.4% 17.6% 15.7% 14.8%Less:IncomeTaxes 0.0% 0.0% 0.0% 0.0% 0.0%NetIncome 19.5% 20.4% 17.6% 15.7% 14.8%
Exhibit13:JohnsonAdhesivesNormalizedBalanceSheetGrowthYeartoYearGrowth CAGR
Dec31 2008 2009 2010 2011 Mean SD COV 07‐11
ASSETS CurrentAssets 2.9% 31.1% (6.5%) 1.1% 7.1% 0.14 2.00 6.3%FixedAssets‐Net 12.6% 22.5% 10.6% 33.9% 19.9% 0.09 0.47 19.5%OtherAssets 80.8% 190.0% (7.6%) 5.5% 67.2% 0.79 1.17 50.4%TotalAssets 9.7% 37.3% (0.3%) 15.3% 15.5% 0.14 0.89 14.7%
LIABILITIESANDEQUITYCurrentLiabilities (12.1%) 102.1% (26.9%) 79.3% 35.6% 0.56 1.57 23.5%Long‐termLiabilities (2.2%) 60.7% (6.8%) (19.7%) 8.0% 0.31 3.88 4.1%TotalLiabilities (7.2%) 80.3% (17.5%) 26.8% 20.6% 0.38 1.85 15.0%Equity 34.8% (6.5%) 33.6% 1.3% 15.8% 0.19 1.18 14.2%TotalLiabilitiesandEquity 9.7% 37.3% (0.3%) 15.3% 15.5% 0.14 0.89 14.7%
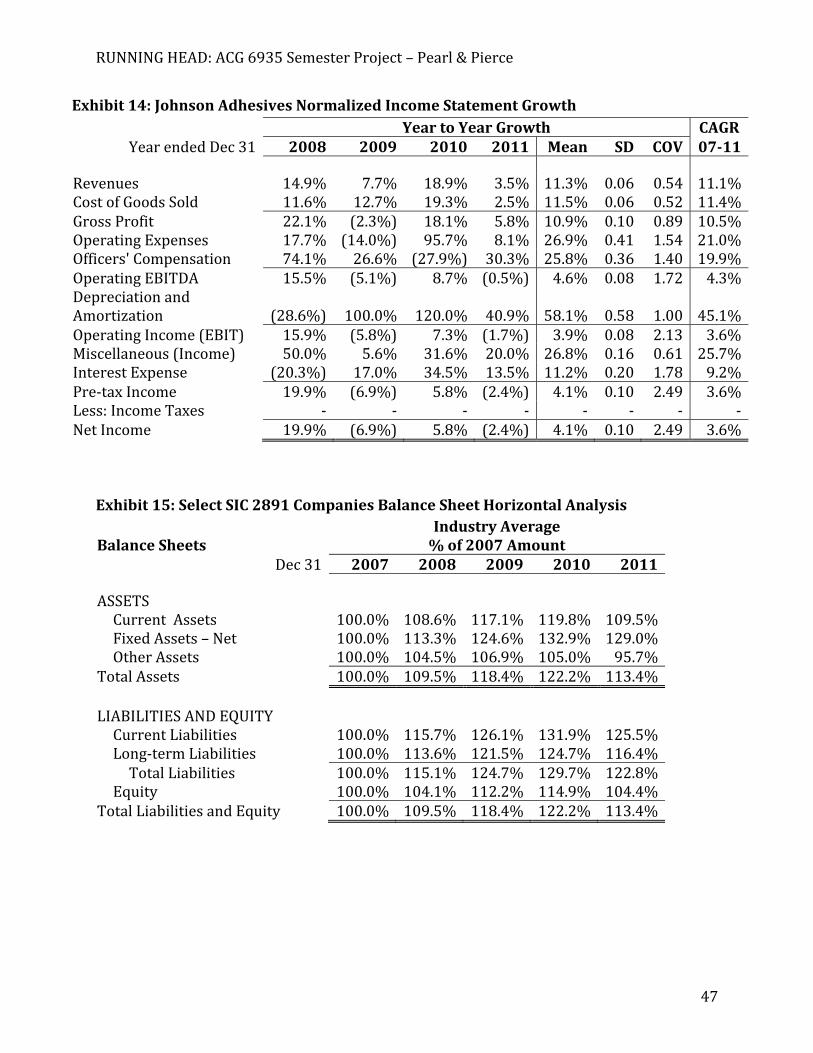
RUNNINGHEAD:ACG6935SemesterProject–Pearl&Pierce
47
Exhibit14:JohnsonAdhesivesNormalizedIncomeStatementGrowth YeartoYearGrowth CAGR
YearendedDec31 2008 2009 2010 2011 Mean SD COV 07‐11
Revenues 14.9% 7.7% 18.9% 3.5% 11.3% 0.06 0.54 11.1%CostofGoodsSold 11.6% 12.7% 19.3% 2.5% 11.5% 0.06 0.52 11.4%GrossProfit 22.1% (2.3%) 18.1% 5.8% 10.9% 0.10 0.89 10.5%OperatingExpenses 17.7% (14.0%) 95.7% 8.1% 26.9% 0.41 1.54 21.0%Officers'Compensation 74.1% 26.6% (27.9%) 30.3% 25.8% 0.36 1.40 19.9%OperatingEBITDA 15.5% (5.1%) 8.7% (0.5%) 4.6% 0.08 1.72 4.3%DepreciationandAmortization (28.6%) 100.0% 120.0% 40.9% 58.1% 0.58 1.00 45.1%OperatingIncome(EBIT) 15.9% (5.8%) 7.3% (1.7%) 3.9% 0.08 2.13 3.6%Miscellaneous(Income) 50.0% 5.6% 31.6% 20.0% 26.8% 0.16 0.61 25.7%InterestExpense (20.3%) 17.0% 34.5% 13.5% 11.2% 0.20 1.78 9.2%Pre‐taxIncome 19.9% (6.9%) 5.8% (2.4%) 4.1% 0.10 2.49 3.6%Less:IncomeTaxes ‐ ‐ ‐ ‐ ‐ ‐ ‐ ‐NetIncome 19.9% (6.9%) 5.8% (2.4%) 4.1% 0.10 2.49 3.6%
Exhibit15:SelectSIC2891CompaniesBalanceSheetHorizontalAnalysisIndustryAverage
BalanceSheets %of2007AmountDec31 2007 2008 2009 2010 2011
ASSETSCurrentAssets 100.0% 108.6% 117.1% 119.8% 109.5%FixedAssets–Net 100.0% 113.3% 124.6% 132.9% 129.0%OtherAssets 100.0% 104.5% 106.9% 105.0% 95.7%
TotalAssets 100.0% 109.5% 118.4% 122.2% 113.4%
LIABILITIESANDEQUITYCurrentLiabilities 100.0% 115.7% 126.1% 131.9% 125.5%Long‐termLiabilities 100.0% 113.6% 121.5% 124.7% 116.4%TotalLiabilities 100.0% 115.1% 124.7% 129.7% 122.8%
Equity 100.0% 104.1% 112.2% 114.9% 104.4%TotalLiabilitiesandEquity 100.0% 109.5% 118.4% 122.2% 113.4%

RUNNINGHEAD:ACG6935SemesterProject–Pearl&Pierce
48
Exhibit16:SelectSIC2891CompaniesIncomeStatementHorizontalAnalysisIndustryAverage
%of2007AmountYearendedDec31 2007 2008 2009 2010 2011
Revenues 100.0% 111.0% 118.0% 121.1% 113.1%CostofGoodsSold 100.0% 111.1% 118.1% 121.2% 113.2%GrossProfit 100.0% 111.0% 117.9% 120.9% 112.8%OperatingExpenses 100.0% 111.3% 118.7% 122.2% 114.5%Officers'Compensation 100.0% 110.2% 116.2% 118.3% 109.6%OperatingEBITDA 100.0% 110.1% 115.7% 117.3% 108.4%DepreciationandAmortization 100.0% 112.2% 120.4% 124.7% 117.6%OperatingIncome(EBIT) 100.0% 108.8% 112.9% 113.0% 103.0%Miscellaneous(Income) 100.0% 111.5% 118.5% 125.5% 117.2%InterestExpense 100.0% 107.2% 110.6% 109.2% 98.1%Pre‐taxIncome 100.0% 110.2% 115.1% 117.0% 107.9%Less:IncomeTaxes 100.0% 110.0% 114.9% 116.9% 107.8%NetIncome 100.0% 110.2% 115.2% 117.1% 107.9%
Exhibit17::SelectSIC2891CompaniesBalanceSheetVerticalAnalysisBalanceSheets %ofYear'sTotalAssets
Dec31 2007 2008 2009 2010 2011
ASSETSCurrentAssets 71.4% 70.8% 70.6% 70.0% 68.9%FixedAssets–Net 23.6% 24.4% 24.8% 25.7% 26.8%OtherAssets 5.1% 4.8% 4.6% 4.3% 4.3%
TotalAssets 100.0% 100.0% 100.0% 100.0% 100.0%
LIABILITIESANDEQUITYCurrentLiabilities 34.4% 36.4% 36.7% 37.1% 38.1%Long‐termLiabilities 14.5% 15.0% 14.8% 14.8% 14.8%TotalLiabilities 48.9% 51.4% 51.5% 51.9% 52.9%
Equity 51.1% 48.6% 48.5% 48.1% 47.1%TotalLiabilitiesandEquity 100.0% 100.0% 100.0% 100.0% 100.0%
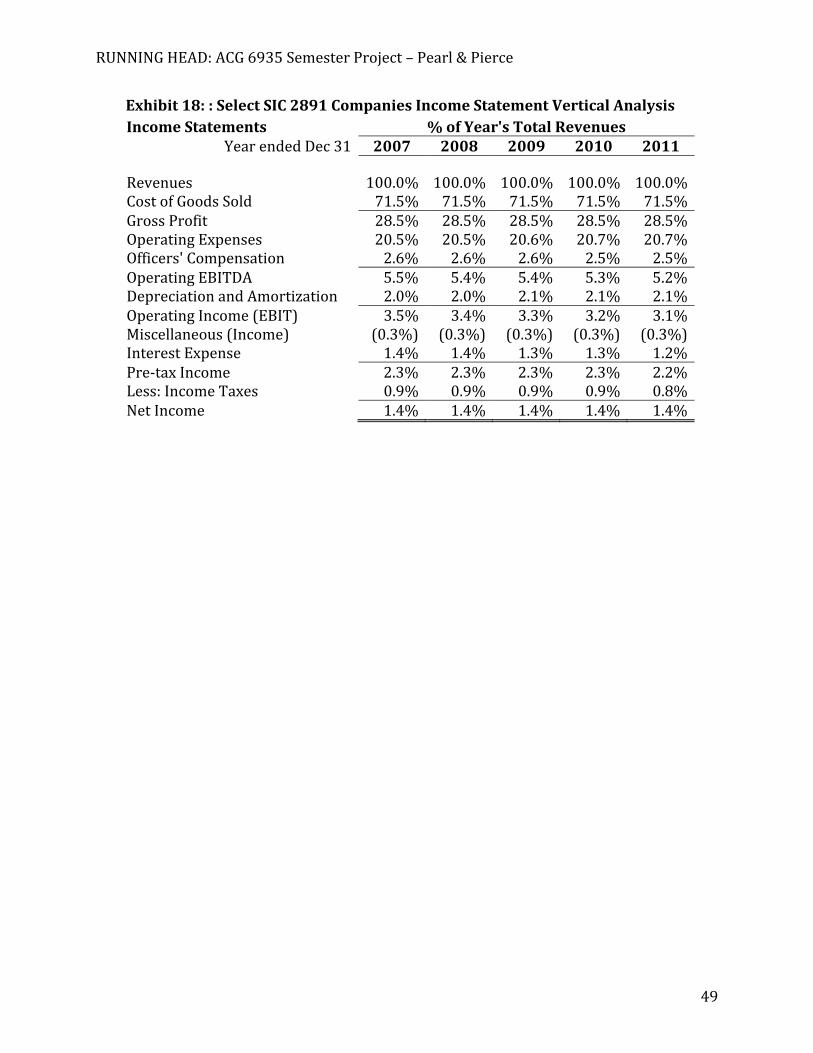
RUNNINGHEAD:ACG6935SemesterProject–Pearl&Pierce
49
Exhibit18::SelectSIC2891CompaniesIncomeStatementVerticalAnalysisIncomeStatements %ofYear'sTotalRevenues
YearendedDec31 2007 2008 2009 2010 2011
Revenues 100.0% 100.0% 100.0% 100.0% 100.0%CostofGoodsSold 71.5% 71.5% 71.5% 71.5% 71.5%GrossProfit 28.5% 28.5% 28.5% 28.5% 28.5%OperatingExpenses 20.5% 20.5% 20.6% 20.7% 20.7%Officers'Compensation 2.6% 2.6% 2.6% 2.5% 2.5%OperatingEBITDA 5.5% 5.4% 5.4% 5.3% 5.2%DepreciationandAmortization 2.0% 2.0% 2.1% 2.1% 2.1%OperatingIncome(EBIT) 3.5% 3.4% 3.3% 3.2% 3.1%Miscellaneous(Income) (0.3%) (0.3%) (0.3%) (0.3%) (0.3%)InterestExpense 1.4% 1.4% 1.3% 1.3% 1.2%Pre‐taxIncome 2.3% 2.3% 2.3% 2.3% 2.2%Less:IncomeTaxes 0.9% 0.9% 0.9% 0.9% 0.8%NetIncome 1.4% 1.4% 1.4% 1.4% 1.4%

RUNNINGHEAD:ACG6935SemesterProject–Pearl&Pierce
50
APPENDIX3–CALCULATIONOFVALUE
Exhibit19:IncomeApproachtoValueEstimation
Calculationof2012ExpectedPre‐taxIncomeNormalizedpre‐taxincome,2010 $7,618,000Normalizedpre‐taxincome,2011 7,434,000Average(mean) $7,526,000Compoundgrowthrate(2007‐2011) 3.6%Expectedbenefitstream,2012 $7,797,941
CalculationofJohnsonAdhesivesDiscountRateRiskfreerate 2.67%Equityriskpremium(ERP) 6.00%Beta(BigCo) 1.10BetaxERP 6.60%
Riskfreerate+(BetaxERP) 9.27%Companyspecificriskpremium(alpha) 20.0%Sizepremium 6.36%Companydiscountrate 35.63%Less:Long‐termgrowthrate 3.61%Companycapitalizationrate 32.02%Capitalizationrate,rounded 32%
Valuationof100%ofJohnsonAdhesivesStockExpectedpre‐taxincomebenefitstream,2012 $7,797,941Capitalizationrate,rounded 32%Valueof100%ofcompanystock* $24,368,564
*Value=Benefit/Capitalizationrate

RUNNINGHEAD:ACG6935SemesterProject–Pearl&Pierce
51
Exhibit20:MarketApproachtoValueEstimationNormalizedAmount
RelativeWeighting*
ContributiontoValue
UsingpubliccompaniesIndustryMVICtosalesmultiple 0.54Company'ssalesfor2011 $50,290,000Valueof100%ofcompanystock $27,156,600 x 30% = $8,146,980
UsingpubliccompaniesIndustryMVICtoEBITDAmultiple 5.80Company'snormalizedEBITDAfor2011 $8,284,000Valueof100%ofcompanystock $48,047,200 x 23% = $11,211,013
UsingpubliccompaniesIndustryMVICtoEBITmultiple 7.26Company'snormalizedEBITfor2011 $7,974,000Valueof100%ofcompanystock $57,891,240 x 23% = $13,507,956
UsingpubliccompaniesIndustryMVICtopre‐taxincomemultiple 6.72Company'snormalizedpre‐taxincomefor2011 $7,434,000Valueof100%ofcompanystock $49,956,480 x 23% = $11,656,512
Weightedaveragevalueofstock $44,522,461Discountforlackofmarketability 20%Valueof100%ofJAstock $35,617,969
*Amountsmaynottotalto100%duetorounding.
Exhibit21:ReconciliationofValueEstimationsValueof100%ofstockIncomeApproach $24,368,564MarketApproach 35,617,969Averagevalueof100%ofstock $29,993,267
ValueofMr.Johnson'sshareofstockValueof100%ofstock $29,993,267Percentofstocktovalue 55%ValueofFrank'sshareofstock $16,496,297RoundedvalueofMr.Johnson'sstock $16,500,000
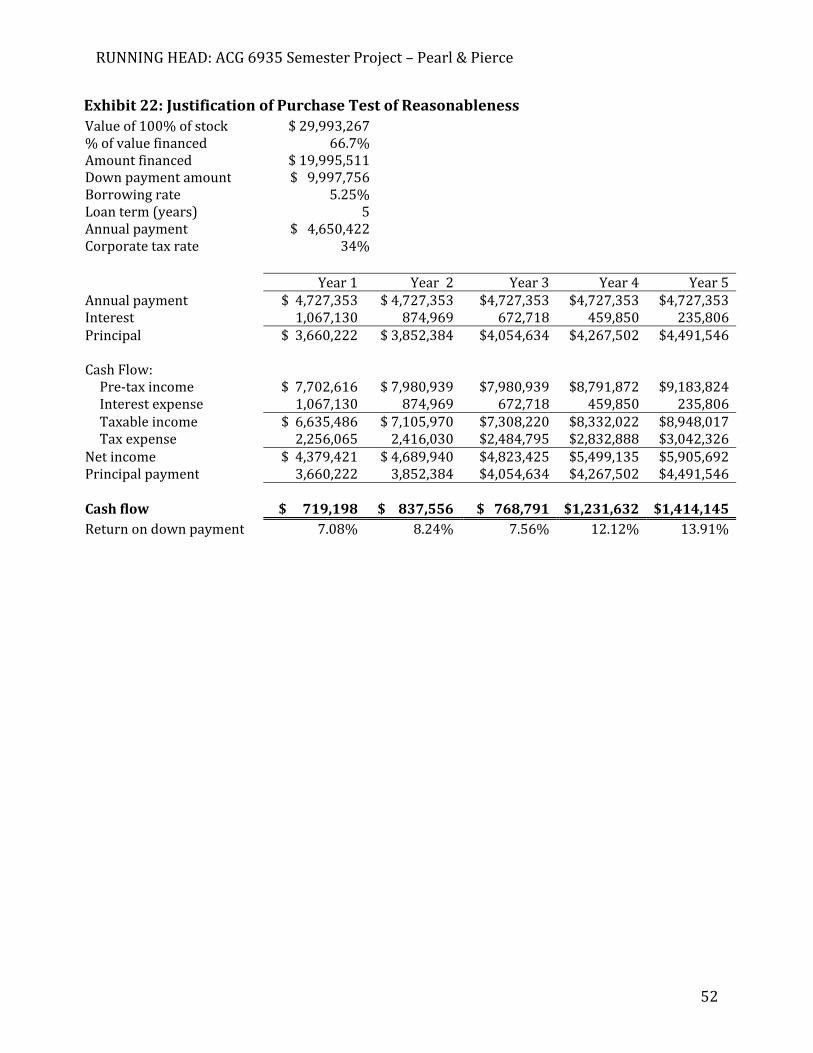
RUNNINGHEAD:ACG6935SemesterProject–Pearl&Pierce
52
Exhibit22:JustificationofPurchaseTestofReasonablenessValueof100%ofstock $29,993,267%ofvaluefinanced 66.7%Amountfinanced $19,995,511Downpaymentamount $9,997,756Borrowingrate 5.25%Loanterm(years) 5Annualpayment $4,650,422Corporatetaxrate 34%
Year1 Year2 Year3 Year4 Year5Annualpayment $4,727,353 $4,727,353 $4,727,353 $4,727,353 $4,727,353Interest 1,067,130 874,969 672,718 459,850 235,806Principal $3,660,222 $3,852,384 $4,054,634 $4,267,502 $4,491,546 CashFlow:Pre‐taxincome $7,702,616 $7,980,939 $7,980,939 $8,791,872 $9,183,824Interestexpense 1,067,130 874,969 672,718 459,850 235,806Taxableincome $6,635,486 $7,105,970 $7,308,220 $8,332,022 $8,948,017Taxexpense 2,256,065 2,416,030 $2,484,795 $2,832,888 $3,042,326
Netincome $4,379,421 $4,689,940 $4,823,425 $5,499,135 $5,905,692Principalpayment 3,660,222 3,852,384 $4,054,634 $4,267,502 $4,491,546
Cashflow $719,198 $837,556 $768,791
$1,231,632 $1,414,145Returnondownpayment 7.08% 8.24% 7.56% 12.12% 13.91%