The valuation of agricultural land for ratings purposes in Australia
[Vol. 100
VALUATION OF CLOSELY-HEL D STOCK FORFEDERAL TAX PURPOSES: APPROACH
TO AN OBJECTIVE METHOD
By LYLE R. JOHNSON, * ELI SHAPIRO ** AND
JOSEPH O'MEARA, JR. ***
PROBLEM AND PROPOSAL
The present double-standard approach to the valuation problemdiscriminates against owners of closely-held stock, that is, corporateshares which have no public market.' The disparity of treatment istraceable to the unfortunate fact that, whereas actual sales or bona fidebid and asked prices govern the valuation for federal tax purposes oflisted stocks and of unlisted stocks which "are dealt in through brokersor have a market," 2 the criteria employed in valuing closely-held stockare predominantly subjective. This makes a paradise for "experts"but they seldom agree and few, if any, of their assumptions and con-clusions are anything more than unverified, and not always wholly
* Research Assistant in Statistics, The School of Business, The University ofChicago.
**Associate Professor of Finance, The School of Business, The University ofChicago.
*** Member of the Ohio Bar.1. This excludes unlisted stock which is traded over-the-counter.2. U.S. Treas. Reg. 105, §81.10(c) (1944); U.S. Treas. Reg. 108, §86.19(c)
(1943).There is no assurance the market would have absorbed additional shares on a
given date at then prevailing prices; the market might have been broken under theweight of further offerings. The judge-made blockage rule is a response to thisdifficulty. This rule, applicable only in respect of large blocks of stock, Mott v. Com-missioner, 139 F.2d 317 (6th Cir. 1943), permits the stock to be valued at the lower-than-market figure which could have been realized, according tb the testimony ofexperts, by means of a special offering or secondary distribution, that is, off-the-exchange merchandising by specialists over a period of time. Havemeyer v. UnitedStates, 59 F. Supp. 537 (Ct. Cl. 1949), cert. denied, 326 U.S. 759 (1945) ; Groff v.Munford, 150 F.2d 825 (2d Cir. 1945); Thomas A. Standish, 8 T.C. 1204 (1947),Acq. 1947-2 Cum. BULt. 4. Thus blockage substitutes unverifiable estimates for theobjective criterion of actual sales or bona fide bid and asked prices. But, in contrastwith the procedure followed in valuing closely-held stocks, the issue is sharply de-fined (What could have been realized by means of a special offering or secondarydistribution?) and relevant considerations are correspondingly delimited.
The regulations themselves leave the door open for escape in hard cases fromthe objective market-price-equals-value rule:
"In cases in which it is established that the value per bond or share of anysecurity determined on the basis of selling or bic and asked prices as hereinprovided does not reflect the fair market value thereof, then some reasonablemodification of such basis or other relevant facts and elements of value shall beconsidered in determining fair market value." U.S. Treas. Reg. 105, § 81.10(c)(1944) ; U.S. Treas. Reg. 108, §86.19(c) (1943).
MONTGOMERY, FEDERAL TAXES-EsTATEs, TRUSTS AND GIFTs 626 (1949-1950), lists16 cases in which the value of stock was determined to be less than the quoted marketprice. Such cases, however, may fairly be considered exceptions and, aside from casesinvolving very large blocks of stock, the courts are not easily persuaded to departfrom market quotations. E.g., Estate of Caroline McCulloch Spencer, 5 T.C. 904,Acq. 1946-1 Cum. BuLL. 4.
(166)

VALUATION OF CLOSELY-HELD STOCK
disinterested, hunches. As a consequence, disagreement between tax-payer and revenue agent is frequent and the process of resolving dis-agreement is long and costly and the event uncertain.3 In short, the
3. See Rice, The Valuation of Close Held Stocks: A Lottery in Federal Taxa-lion, 98 U. OF PA. L. REv. 367 (1950).
The predicament of the taxpayer is illustrated by the following reply from an"expert" to a businessman seeking enlightenment:
"This memorandum is limited to an outline of factors involved 'to determinea fair value for a security which has no market quotations.'
"The factors involved in any such valuation, in the experience of the writer,are so numerous and each of such importance in individual cases that any attemptat establishing a set formula inevitably raises controversial problems and pro-duces valuation results, even in securities of comparable companies, which are indirect conflict.
"It follows, therefore, that any valuation, of a security which has nw inarketquotation becomes an individual problein. (Emphasis supplied) Some type offormula may be applied, such as mentioned hereafter in this memorandum, butthe final result must reflect the consideration given to the factors of greatestimportance not represented by cold figures but exercising the greatest influenceon any stock valuation. Some of these factors follow:1-Purpose of Valuation
Unfortunately even experts differ and such differences may be based onhonest opinions and extensive experience. To list a few purposes wherevaluations may differ, we have
For sale purposesFor purchase purposesFor tax purposesAccounting purposesLitigation purposes
etc., etc.2-Tax problens
Increasing complexity of these problems as applied to stock valuation forany of the foregoing purposes becomes the major issue which definitely affectsthe final value to the owner of any security and this is not reflected in anyformula but must be decided on its individual implications. A security soldat public sale at nominal price may conceivably produce more real value toan estate than by establishing an unlisted security value by formula whereno real market exists or where it is severely limited.
3-Continuity of BusinessThis has an important bearing on value. It involves
Ownership controlManagement controlSecurities distribution
So-called closely-held corporations or other business entities may dependalmost entirely on continuity of management for success and this remains animportant factor in valuation problems.
4-Competitive ConditionsAny value arrived at, after consideration of all individual aspects, must
still reflect some reasonable comparative value to any existing comparable andcompetitive company, securities of which may have an established market.
5-Market PossibilitiesThe amount of outstanding stock involved in any valuation may have
some controlling influence on value, such as100% interestMajority interestLarge minoritySmall block
6-GoodwillTheoretically the value of goodwill is reflected in earnings. Formulae
do take care of any stock value due to earnings, but it has been a part of the
1951]

168 UNIVERSITY OF PENNSYLVANIA LAW REVIEW [Vol. 100
whole merry-go-round of valuing closely-held stock is wasteful andunfair.
This paper and the study it reports are addressed to the possibilityof improving the situation by making a fresh approach to the valuationof closely-held stock.
Mr. Justice Holmes once said that "value . . . as the word isused by the law . . . depends largely on more or less certain proph-esies of the future . . . ." " In federal tax law that isn't necessarilyso; for the most part, indeed, value depends not so much on peering intothe future as on doing over the past. What was the value of such-and-such "expressed in the money that it would bring in the market" on acertain date in the past? ' Specifically, what was its value on March 1,1913 or when a gift was made or when a man died? That is, whatcould you have got for it in money if you had sold it at that time? 6
writer's experience to find a corporation with fifteen prosperous years fol-lowed by fifteen very lean years, and in spite of this the current value of thename could not be questioned although by no method of direct figuringcould a goodwill value be established. This again becomes an individual anddistinct problem.
7-GeneralThe difficulty in applying a formula lies in finding two identical corpora-
tion twins, so to speak, to apply it on. One company may operate throughmortgage loans and another by bank loans, and the result would differ.
"In the opinion of the writer, the foregoing are the important factors tobe considered in determining a value and although he has seen formulaeboth simple and of great complexity, it still reinainsr a problem of good judg-ment applied to individual cases each on its own nwrits. (Emphasis supplied)
"However, in order to avoid too abstract an approach to this problemof stock valuation, the basic formula generally used by the writer as a pre-liminary approach follows, subject, of course, to variations imposed by con-ditions.
Invested capital, 5-year averageNet income, 5-year averageAllow, say 6% on average invested capital as normal earningsExcess of 5-year average earnings over 6 0o on 5-year average
capital a credit to good-will5-year or 3-year expectancy, five or three times such excess equiva-
lent to goodwill valueAdd to adjusted book values of net assetsResult-an approximate value
"The writer believes there is a practical method of determining the fairvalue of a stock in the absence of market quotations, and over a long periodof years has been able to do so without undue difficulties arising, but suchvaluation can only be based on a full and complete knowledge of all factorssurrounding the ownership, management, tangible assets and general condi-tions surrounding the subject and is based only in part on any fixed formula.Good judgment based on experience is a most important element in any com-putation of this nature."
4. Ithaca Trust Co. v. United States, 279 U.S. 151, 155 (1929).
5. Ibid.6. Andrews v. Commissioner, 135 F.2d 314 (2d Cir. 1943), cert. denied, 320 U.S.
748 (1943). This is in accord with Ithaca Trust Co. v. United States, 279 U.S. 151,155 (1929) (". . . the value of property at a given time depends upon the relativeintensity of the social desire for it at that time, expressed in the money that it wouldbring in-the market.") and with United States v. Petty Motor Co., 327 U.S. 372, 377

VALUATION OF CLOSELY-HELD STOCK
This calls for prophesy in reverse, prediction backward, a forecast to therear. Orthodox prophesy is subject to verification: sooner or later iteither turns out or it doesn't. But this business of predicting whatmight have been in circumstances which never occurred must remainforever in the realm of pure speculation. How many children wouldMaude Muller have had if she had married the Judge?
In federal tax law value is not a fact to be ascertained; value isan expedient, a means to an end, a tool, and its function (along withother devices such as exemptions and rates) is to determine tax lia-bility in terms of dollars-to measure the tax-take. It cannot performthis office fairly so long as predominantly subjective criteria are em-ployed in respect of closely-held stocks, that is, those which have nopublic market, while objective criteria (sales, bid and asked prices) arerecognized as controlling in respect of stocks which do have a publicmarket.7 Hence the problem is to evolve objective criteria which willfunction with substantial uniformity, as well in the case of stocksthat are not traded publicly as in the case of those that are, and thusto relieve the disproportionate pressure presently exerted on the former.
The study reported in part II of this paper is a step in that direc-tion. The study set out to ascertain whether and to what extentquantitative relationships exist which account for and thus can be usedto estimate or predict the price of listed stocks in terms of reportedearnings, dividends or book value. Back of the objective was thishypothesis: if in the case of listed stocks a statistical pattern can be
(1946) (". . . 'market value' does not fluctuate with the needs of [particular in-dividuals] but with the general demand for the property . . ."). Decisions apply-ing the blockage rule, note 2, supra, and cases involving the valuation of foreigncurrencies, e.g., Morris Marks Landau, 7 T.C. 12 (1946), Acq. 1946-2 Cum. Bui.3; Ceska Cooper, 15 T.C. 757 (1950), Acq. 1951 INT. REv. Bum. No. 8 at 1 (1950) ;Estate of Ambrose Fry, 9 T.C. 503, Acq. 1948-2 Cum. Butm. 2 (1947) exemplifythe third-party approach enunciated in the Ithaca Trust Co., Petty Motor Co. andAndrews cases. The most recent instance of this approach is Estate of Blanchard v.Comm'r. 184 F.2d 438 (3d Cir. 1950), affirming 8 T.C.M. 1088.
In contrast with these cases (which equate market value with the price buyersare willing to pay) the regulations go on repeating the old mumbo-jumbo about a will-ing buyer and a willing seller:
"The fair market value is the price at which the property would changehands between a willing buyer and a willing seller, neither being under any com-pulsion to buy or to sell." U.S. Treas. Reg. 105, § 81.10(a) (1944) ; U.S. Treas.Reg. 108, §86.19(a) (1943).
The trouble with this is that it is indeterminate-it tells nothing, leads nowhere. Inreal life people generally try to buy as low as possible and sell as high as they can.By what objective test can we determine the point at which the mythical buyer andthe mythical seller will reach common ground-the point at which what one is will-ing to give will meet what the other is willing to take? The regulations are silent;they contain no clue to the answer. The willing-buyer-willing-seller jargon should berelegated to the Happy Hunting Ground of words without meaning.
7. As pointed out in note 2 supra, the regulations contain an escape clause whichpermits deviation from selling or bid and asked prices if they do not reflect "fairmarket value." But this is the exception, not the rule.
1951]
170 UNIVERSITY OF PENNSYLVANIA LAW REVIEW [Vol. 100
traced between price on the one hand and reported earnings, dividendsor book value on the other, application of the pattern to closely-heldstocks will yield comparable and thus equitable valuations.'
That is the background from which the study emerged. Havingemerged, it proceeded, quite independently of the problem of closely-held stock, simply as a project to discover, in the case of listed stocks,what if any statistical relationship exists between earnings and price,between dividends and price, between book value and price. Hencethe study may have wider implications than any suggested here.
The findings may be summarized as follows:'
Of the three factors examined (earnings, dividends, bookvalue) book value is the least dependable, and annual dividends the
-most reliable, index to the price of industrial common stocks listedon the New York Stock Exchange. 10
There is no such thing, however, as a stable relationship be-tween earnings and price, between dividends and price, betweenbook value and price. On the contrary, the study highlights theshifting character of stock-market relationships. Thus there is noprice-earnings ratio or dividend yield or price-book value ratiowhich can be used from year to year as a convenient rule of thumb.
At any given time, moreover, the ratio of price to each of thefactors examined (earnings, dividends, book value) tends todecrease as earnings go up. Specifically, if two corporations earn,respectively $1 and $5 per share, the price of the latter will be some-thing less, on the average, than five times as much as the former.And the pattern is the same for dividends and book value. Thatis to say, the yield of a stock paying, say, $5 per share tends tobe higher than that of a stock paying 500 per share. Similarly thepercentage of book value represented by price is lower, on theaverage, in the case of a stock with a book value of $100 pershare, for example, than in the case of a stock with a book valueof $5 per share.
The fact that market relationships are not stable and that, at anygiven time, the statistical relationship between price and each of the
8. This assumes that the market-price-equals-value formula, applied in the caseof stocks which have a public market (see notes 2 and 6 supra), is generally satis-factory in practice, as it is believed to be.
An interesting example of establishing the value of an unlisted security throughcomparison with the mean of the price-earnings ratios and of the dividend yields ofseveral listed securities is found in Estate of Wilson v. Comm'r. C.C.H. Dec. 18487(M) August 7, 1951. The Tax Court was convinced by this approach.
9. Presumably the findings can be applied only to minority interests since ordi-narily that is what is traded on the New York Stock Exchange.
10. This is in sharp contrast with the Commissioner's customary emphasis onbook value and disregard of dividends in valuing closely-held stock.

VALUATION OF CLOSELY-HELD STOCK
factors examined tends to be dependent upon the size of the latter-these facts emphasize the desirability of annual studies of prices on theprincipal exchanges. The pertinent data should be gathered system-atically and published yearly by the Securities and Exchange Com-mission.
Two courses would then be open as a matter of administrative orlegislative policy. The first is to accept the formula (to be determinedannually by the proposed studies) which reflects most accurately theprice of listed stocks in each occupational group (call it the optimumprice formula) " as the exclusive index of value of closely-held stocks
11. Cf. the provision in the Excess Profits Tax Act of 1950, INT. Rv. CoDa,§ 447 for publication of industry rates of return:
"(b) Base Period Rate of Return.-The Secretary shall determine and pro-claim for each industry classification in subsection (c) a rate of return (computedto the nearest thousandth) for the four year period 1946 through 1949. Suchbase period rate of return for each industry classification shall be obtained byaggregating the net income and interest deduction (such amounts being determinedas provided under subsection (a)) for such four years and dividing the aggregateby the sum of the total assets (determined as provided under subsection (a)) forsuch four years.
"(c) Industry Classification.-For purposes of this subchapter the classifica-tion of taxpayers by industry shall be as provided in the table below. Eachsuch industry classification is defined in accordance with the specifications shownin the Standard Industrial Classification Manual (prepared by the Division ofStatistical Standards, Bureau of the Budget) for the major industry group orgroups the numbers of which appear opposite such classification. .. "Preference for an objective approach was expressed by the Senate Committee
on Finance in Senate Report No. 2679 on the Excess Profits Tax Act of 1950, atpp. 17 and 18:
"Section 722, the general relief provision of the World War II law, wasdesigned to aid hardship cases by providing such corporations with a substitute,or constructive average, base period net income. Section 722 dealt with threeprincipal classes of cases-(1) corporations which had suffered some adversityduring their base period, (2) corporations which had made changes during thebase period resulting in an increase in their profit potentials, and (3) corpora-tions which were not in existence during the base period and, therefore, had nobase period net income at all.
"In each instance the section provided that a hypothetical base period earn-ings credit be 'tailor made' for the particular taxpayer and that certain assump-tions be made in connection with the case. Each case was a problem in research,and the legal or tax result generally was intertwined with complicated account-ing and economic problems. Almost every factor which had any influence on theparticular business was pertinent to the case and the time and expense involvedin reconstructing the average base period earnings credit were tremendous.
. "These complex relief provisions of the World War II law have resultedin extended delay in the settlement of relief claims which discriminated againsttaxpayers who had neither the time nor the financial resources necessary for theestablishment of their cases. Moreover, the determination of what the taxpayer'sbase period income would have been in the absence of the claimed abnormalitywas largely a matter of subjective judgment, and great deal of complaint hasarisen on this account. Hence this bill reduces to a minimum the amount ofadministrative discretion involved in the adjustment of the hardship cases whichmay be expected to arise under an excess profits tax. . ..
"The bill provides automatic formulas for each of the most important typesof cases which arose under section 722 of the World War II law. These formulaspermit an objective computation of the amount of relief granted in each case, thus
1951]

172 UNIVERSITY OF PENNSYLVANIA LAW REVIEW [Vol. 100
of the same occupational classification. 2 Statistical averages, drawnfrom the action of prices on the principal exchanges, would thus becomethe sole criterion in the valuation of closely-held stock. Weighty con-siderations can be marshalled in support of a purely statistical approach,such as ease and economy of administration and consequent removal ofthe delays and uncertainties which characterize the present system. Buta purely statistical approach would have serious disadvantages. Forexample, it might result in precisely the same value for the stock of twoclose corporations even though one was enjoying a healthy and con-tinuing growth while the other was over the hill.
The alternative course is to adopt a modified statistical approachsomewhat as follows. Application of the optimum price formula will,of course, yield the same estimated price for all listed stocks in a givenoccupational group which correspond statistically in those particularswhich are significant for purposes of the formula. In contrast, theprices actually paid for these stocks (notwithstanding the identity ofdividends or earnings or book value, as the case may be) will vary'considerably. However, a substantial majority of the actual priceswill be confined within a certain range. 3 This price-spread could beaccepted as establishing a floor under and ceiling over permissible valua-tions.14 This would tend to reduce the inordinate discrepancies fre-quently encountered between the valuation contended for by the Com-missioner and that urged by the taxpayer, 5 narrow the issue and focusattention on those considerations tending to make the, stock in questionmore or less attractive to investors by comparison with others in thesame occupational category. To be sure, there would still be the ele-
avoiding the practice of making the extent of the relief dependent upon an at-tempted analysis of all the varying factors in the individual case with the resultinguncertainty, delays, and disparity of treatment among taxpayers which character-ized the application of the general relief provisions of the World War II law."
12. The study tends to support the practice of taking account of the marketperformance of those stocks only which belong to the same occupational group. SeeINT. REv. CODE §811(k). Difficulties presently encountered in making comparativevaluations are elaborated in Rice, supra note 3, at 391-92.
13. See Fig. 5 infra.
14. No doubt it will be objected that to tie the valuation of closely-held stock todividends (as would be done if the optimum price formula should be based on divi-dends at the critical date) would be to turn over to close corporations a large measureof control over the value of their shares. It would seem a workable hypothesis, how-ever, that no manipulative withholding of dividends had occurred in any case un-less Sec. 102 of the Code (Surtax on Corporations Improperly Accumulating Sur-plus) had been invoked in the period reflected in the formula. If Sec. 102 had beenapplied in that period it would evidently be inappropriate to utilize any price formulabased on .dividends. In this situation recourse could be had to whatever formula notbased on dividends most accurately reflected price at the critical date in the appropriateoccupational classification.
15. See Rice, supra note 3, at 396 n.92.
VALUATION OF CLOSELY-HELD STOCK
ment of star-gazing but it would be circumscribed and held in checkby being tied to a specific inquiry, namely, whether investors would havepaid more or less within the limits fixed by the formula.:6
This latter course would recognize that stock prices manifesthuman deiisions conditioned by an intricate and changing set of cir-cumstances, many of which defy quantitative expression. It would,accordingly, result in considerably less certainty than is attainable by apurely statistical approach; but it would avoid the inequities to whicha purely statistical approach might lead, while at the same time confiningthe area of discretion (at present all but unlimited) within what seemto be reasonable bounds.
Something of this sort seems worth a try. The present study ispublished in the hope that it will lead to other and continuing factualinquiries which will refine and extend the usefulness of the experimentaltechniques, and amplify the data, which are respectfully presented inthe balance of this article.
THE: STATISTICAL INQUIRY
Rules for Estimating Stock Prices. In this article any algebraicequation proposed to describe or account for price in terms of one ormore known quantities-such as annual earnings, annual dividends,book value, five-year average earnings, etc.,-is called a "rule" forestimating stock prices. The relationship "price equals 10 times annualearnings" is a rule as are "price equals 18 times annual dividends" and"price equals book value."
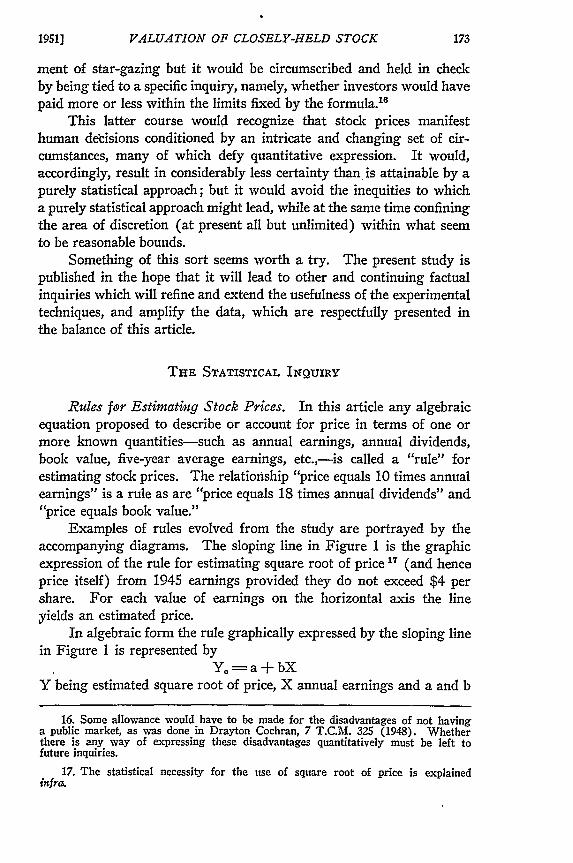
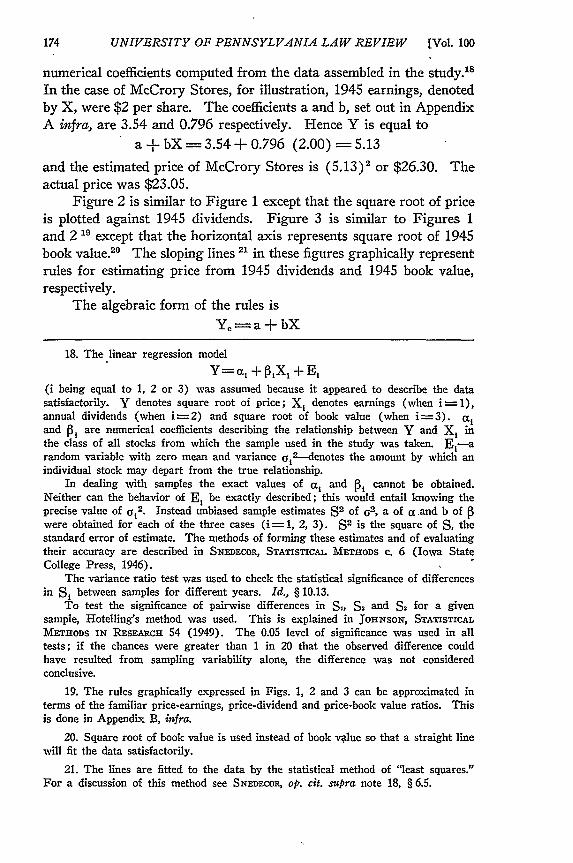
Examples of rules evolved from the study are portrayed by theaccompanying diagrams. The sloping line in Figure 1 is the graphicexpression of the rule for estimating square root of price 17 (and henceprice itself) from 1945 earnings provided they do not exceed $4 pershare. For each value of earnings on the horizontal axis the lineyields an estimated price.
In algebraic form the rule graphically expressed by the sloping linein Figure 1 is represented by
Ye a- ±bXY being estimated square root of price, X annual earnings and a and b
16. Some allowance would have to be made for the disadvantages of not havinga public market, as was done in Drayton Cochran, 7 T.C.M. 325 (1948). Whetherthere is any way of expressing these disadvantages quantitatively must be left tofuture inquiries.
17. The statistical necessity for the use of square root of price is explainedinfra.
1951]
174 UNIVERSITY OF PENNSYLVANIA LAW REVIEW [Vol. 100
numerical coefficients computed from the data assembled in the study.""In the case of McCrory Stores, for illustration, 1945 earnings, denotedby X, were $2 per share. The coefficients a and b, set out in AppendixA infra, are 3.54 and 0.796 respectively. Hence Y is equal to
a + bX == 3.54 + 0.796 (2.00) = 5.13
and the estimated price of McCrory Stores is (5.13)2 or $26.30. Theactual price was $23.05.
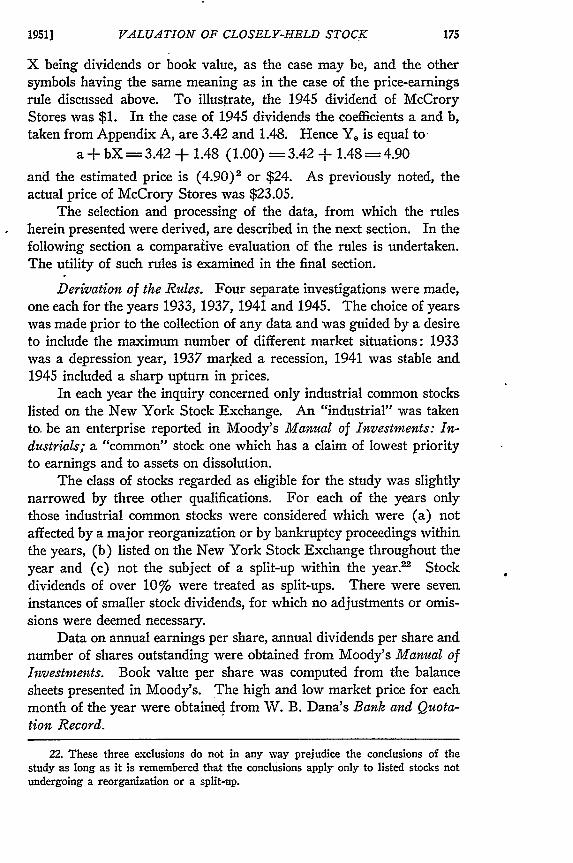
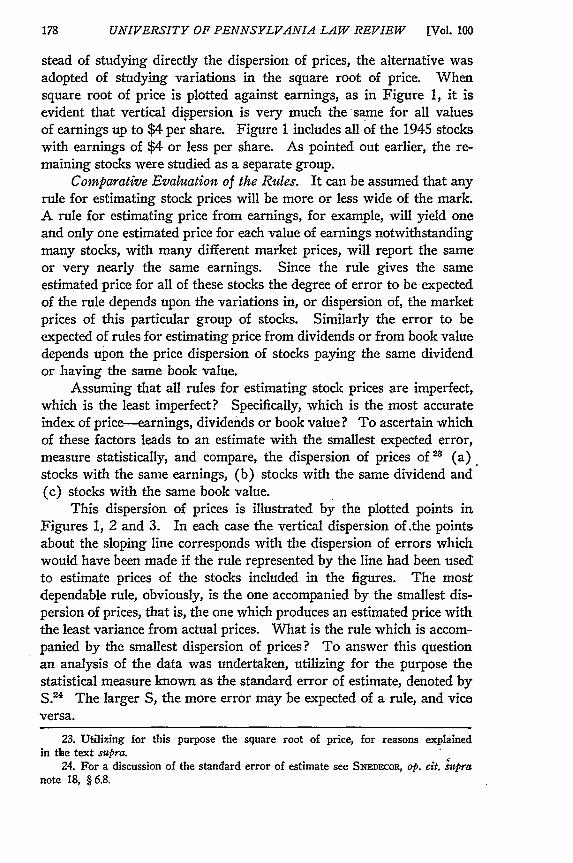
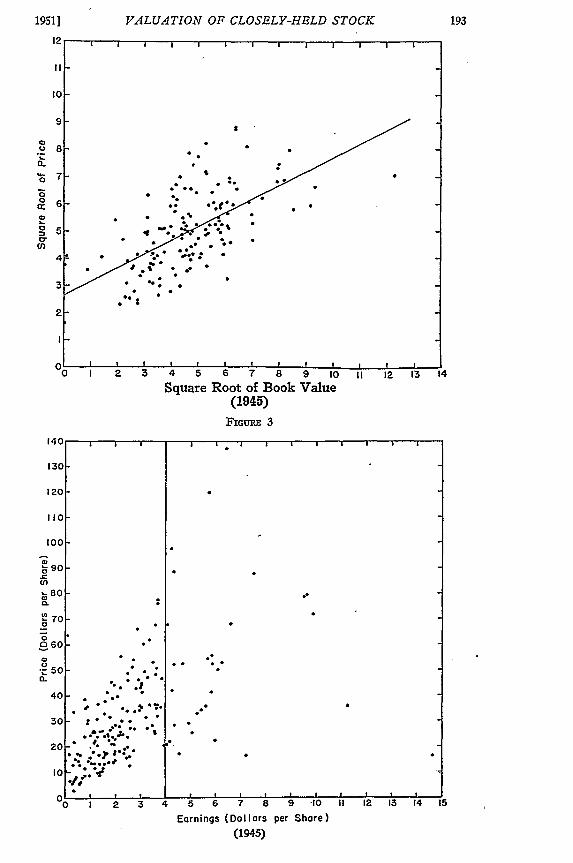
Figure 2 is similar to Figure 1 except that the square root of priceis plotted against 1945 dividends. Figure 3 is similar to Figures 1and 2 19 except that the horizontal axis represents square root of 1945book value.2" The sloping lines 21 in these figures graphically representrules for estimating price from 1945 dividends and 1945 book value,respectively.
The algebraic form of the rules is
Y= a + bX
18. The linear regression model
Y=a, + P3X, + E,(i being equal to 1, 2 or 3) was assumed because it appeared to describe the datasatisfactorily. Y denotes square root of price; X, denotes earnings (when i = 1),annual dividends (when i=2) and square root of book value (when i=3). a,and P, are numerical coefficients describing the relationship between Y and X, inthe class of all stocks from which the sample used in the study was taken. E 1-arandom variable with zero mean and variance o1
2-- denotes the amount by which anindividual stock may depart from the true relationship.
In dealing with samples the exact values of a and P, cannot be obtained.Neither can the behavior of E, be exactly described; this would entail knowing theprecise value of U,2. Instead unbiased sample estimates S2 of 02, a of a .and b ofwere obtained for each of the three cases (i = 1, 2, 3). S2 is the square of S, thestandard error of estimate. The methods of forming these estimates and of evaluatingtheir accuracy are described in SNED~coR, STATISTICAL METHODS c. 6 (Iowa StateCollege Press, 1946).
The variance ratio test was used to check the statistical significance of differencesin S, between samples for different years. Id., § 10.13.
To test the significance of pairwise differences in S,, 2 and S. for a givensample, Hotelling's method was used. This is explained in JoHrNsox, STATISTICALMETHODS IN RESEARCHi 54 (1949). The 0.05 level of significance was used in alltests; if the chances were greater than 1 in 20 that the observed difference couldhave resulted from sampling variability alone, the difference was not consideredconclusive.
19. The rules graphically expressed in Figs. 1, 2 and 3 can be approximated interms of the familiar price-earnings, price-dividend and price-book value ratios. Thisis done in Appendix B, infra.
20. Square root of book value is used instead of book value so that a straight line
will fit the data satisfactorily.
21. The lines are fitted to the data by the statistical method of "least squares."For a discussion of this method see SNEDECOR, op. cit. supra note 18, § 6.5.
VALUATION OF CLOSELY-HELD STOCK
X being dividends or book value, as the case may be, and the othersymbols having the same meaning as in the case of the price-earningsrule discussed above. To illustrate, the 1945 dividend of McCroryStores was $1. In the case of 1945 dividends the coefficients a and b,taken from Appendix A, are 3.42 and 1.48. Hence Y. is equal to
a + bX = 3.42 + 1.48 (1.00) = 3.42 + 1.48 = 4.90
and the estimated price is (4.90)2 or $24. As previously noted, theactual price of McCrory Stores was $23.05.
The selection and processing of the data, from which the rulesherein presented were derived, are described in the next section. In thefollowing section a comparative evaluation of the rules is undertaken.The utility of such rules is examined in the final section.
Derivation of the Rules. Four separate investigations were made,one each for the years 1933, 1937, 1941 and 1945. The choice of yearswas made prior to the collection of any data and was guided by a desireto include the maximum number of different market situations: 1933was a depression year, 1937 marked a recession, 1941 was stable and1945 included a sharp upturn in prices.
In each year the inquiry concerned only industrial common stockslisted on the New York Stock Exchange. An "industrial" was takento. be an enterprise reported in Moody's Manual of Investments: In-dustrials; a "common" stock one which has a claim of lowest priorityto earnings and to assets on dissolution.
The class of stocks regarded as eligible for the study was slightlynarrowed by three other qualifications. For each of the years onlythose industrial common stocks were considered which were (a) notaffected by a major reorganization or by bankruptcy proceedings withinthe years, (b) listed on the New York Stock Exchange throughout theyear and (c) not the subject of a split-up within the year.22 Stockdividends of over 10% were treated as split-ups. There were seven.instances of smaller stock dividends, for which no adjustments or omis-sions were deemed necessary.
Data on annual earnings per share, annual dividends per share andnumber of shares outstanding were obtained from Moody's Manual ofInvestments. Book value per share was computed from the balancesheets presented in Moody's. The high and low market price for eachmonth of the year were obtained from W. B. Dana's Bank and Quota-tion Record.
22. These three exclusions do not in any way prejudice the conclusions of thestudy as long as it is remembered that the conclusions apply only to listed stocks notundergoing a reorganization or a split-up.
1951]

176 UNIVERSITY OF PENNSYLVANIA LAW REVIEW [Vol. 100
Book value per share was obtained by dividing net assets by thenumber of common shares outstanding. Net assets were obtained bysubtracting from total assets the following items: current liabilities;long-term liabilities; tax reserves; depreciation and depletion reserves(where these reserves were included in total assets); preferred divi-dends in arrears; involuntary liquidation value of preferred or higherranking stock; and reported value of treasury stock (where this itemis carried in assets).
To arrive at a price for a given share in a given year 12 monthlyprices were found by taking the average (arithmetic mean) of the highand the low price for each month. The average (arithmetic mean) ofthese 12 monthly prices was then defined as the "price" to be used inthe initial inquiry. This method was employed in the thought that thebusiness conditions reflected in an end-of-the-year earnings statementare sensed by investors during the year and that an annual measure ofprice would be most closely related to annual earnings.
Because fiscal years do not always coincide with calendar years itwas necessary to adjust some of the data on earnings and book value.Suppose that M1 months of a first fiscal year and M2 months of a secondfiscal year fall within the calendar year under consideration. If E andE2 are the annual earnings per share reported by a company for the firstand second fiscal years and B1 and B2 the respective book values, thenweighted averages E and B were used as the earnings per share andbook value per share of the calendar year.
Mi M2
E =-E 1 +- -E 212 12Mi M2
B -Bi + -B2.12 12
In each of the years selected for investigation many more stockswere eligible than it was practicable to study. As is commonly done insuch circumstances, a sample was obtained by accepted statisticalmethods. All of the industrial common stocks listed on the New YorkStock Exchange at the end of the year (in each case less than 1000)were numbered consecutively 001, 002, 003, etc. Numbers were thenread from a three-digit column in the Interstate Commerce Commis-sion's Table of Random Decimal Digits and stocks with correspondingnumbers were selected for the sample. Once a stock was selected itsnumber was thenceforth disregarded. Although 190 stocks wereselected in each of the four years, some were subsequently disqualifiedas data were collected. The sample sizes finally obtained were as fol-lows: 1933, 175; 1937, 172; 1941, 185; 1945, 176.

VALUATION OF CLOSELY-HELD STOCK
Analysis of the sample data dealing with prices and earningsrevealed that the price-earnings relationship differed markedly betweencertain earnings classes. It was obvious, for example, that the 1933 and1937 samples should be divided into (a) stocks reporting earnings equalto or greater than zero and (b) stocks with reported losses (negativeearnings). A definite relationship between price and earnings wasdiscerned in the first class of stocks; none could be discovered in thesecond. In other words, information on the amount of loss per sharewas not appreciably helpful in estimating price.
A more perplexing situation was encountered in the 1941 and1945 samplesi. Very few of these stocks reported losses and none re-ported substantial losses. But it was apparent that the relationshipbetween price and earnings broke down as regards the stocks with earn-ings above about $4 per share. This tendency may be observed inFigure 4, a scatter diagram of the 1945 sample. The vertical axisrepresents price per share, the horizontal represents earnings per shareand each dot is located by the price and earnings of an individual stockin the sample.
In the case of the stocks with earnings of $4 or less per sharethere was a noticeable tendency for prices to rise as earnings increase.In the case of stocks with earnings above this point prices were veryerratic-some high, others low. One might suspect that chance hadselected an unusual or peculiar sample. Such doubts are removed byinspection of the 1941 sample. The latter, obtained independently ofthe 1945 sample exhibits the same peculiarities.
To make the analysis more meaningful, therefore, the 1941 and1945 samples were each divided into two classes: (a) stocks with earn-ings of $4 or less per share and (b) stocks with earnings in excess of$4 per share. By far the larger proportion of stocks fell in the firstgroup.
Even within these classifications, however, the variations in, ordispersion of, the prices of a group of stocks with, say, identical earn-ings depends upon the earnings group chosen. This is evident fromFigure 4 which contains all of the stocks in the 1945 sample. Pricedispersion (dispersion in the vertical direction) among stocks with $2earnings is greater than among stocks with $1 earnings, and in generaldispersion increases from lower to higher values of earnings. Thepractical implication of this is that there is no relationship between priceand earnings which can be summed up in a single descriptive statisticalmeasure: dispersion will differ with different values of earnings.
This difficulty was overcome for purposes of statistical analysisby substituting for price the square root of price. That is to say, in-
19511
178 UNIVERSITY OF PENNSYLVANIA LAW REVIEW [Vol. 100
stead of studying directly the dispersion of prices, the alternative wasadopted of studying variations in the square root of price. Whensquare root of price is plotted against earnings, as in Figure 1, it isevident that vertical dispersion is very much the same for all valuesof earnings up to $4 per share. Figure 1 includes all of the 1945 stockswith earnings of $4 or less per share. As pointed out earlier, the re-maining stocks were studied as a separate group.
Comparative Evaluation of the Rules. It can be assumed that anyrule for estimating stock prices will be more or less wide of the mark.A rule for estimating price from earnings, for example, will yield oneand only one estimated price for each value of earnings notwithstandingmany stocks, with many different market prices, will report the sameor very nearly the same earnings. Since the rule gives the sameestimated price for all of these stocks the degree of error to be expectedof the rule depends upon the variations in, or dispersion of, the marketprices of this particular group of stocks. Similarly the error to beexpected of rules for estimating price from dividends or from book valuedepends upon the price dispersion of stocks paying the same dividendor having the same book value.
Assuming that all rules for estimating stock prices are imperfect,which is the least imperfect? Specifically, which is the most accurateindex of price--earnings, dividends or book value? To ascertain whichof these factors leads to an estimate with the smallest expected error,measure statistically, and compare, the dispersion of prices of I (a)stocks with the same earnings, (b) stocks with the same dividend and(c) stocks with the same book value.
This dispersion of prices is illustrated by the plotted points inFigures 1, 2 and 3. In each case the vertical dispersion of.the pointsabout the sloping line corresponds with the dispersion of errors whichwould have been made if the rule represented by the line had been usedto estimate prices of the stocks included in the figures. The mostdependable rule, obviously, is the one accompanied by the smallest dis-persion of prices, that is, the one which produces an estimated price withthe least variance from actual prices. What is the rule which is accom-panied by the smallest dispersion of prices? To answer this questionan analysis of the data was undertaken, utilizing for the purpose thestatistical measure known as the standard error of estimate, denoted byS.24 The larger S, the more error may be expected of a rule, and viceversa.
23. Utilizing for this purpose the square root of price, for reasons explainedin the text supra.
24. For a discussion of the standard error of estimate see SxEFcOR, op. cit. supranote 18, § 6.8.

VALUATION OF CLOSELY-HELD STOCK
The samples were divided into two parts for each of the fouryears, making essentially eight different sample groups. As to eachof these three separate questions were asked: (a) Is information onearnings useful in estimating price, and if so what is the value of S?(b) Is information on dividends useful in estimating price, and if sowhat is the value of S? (c) Is information on book value useful inestimating price, and if so what is the value of S ? These questions areanswered in Table 1. Remember that the smaller S the more helpfulis the corresponding variable in estimating prices.
Table 1
SAMPLE VALUES OF THE STANDARD ERROR OF ESTIMATE
Sample BookSample Size Earnings Dividends Value
1933:Negative Earnings 81 ... ... 1.12Earnings zero or positive 94 1.03 1.02 1.43
1937:Negative Earnings 28 ... ... 1.21Earnings zero or positive 144 1.15 1.18 1.53
1941:Earnings $4 or less 137 0.923 0.673 1.30Earnings greater than $4 48 2.05 1.12 1.99
1945:Earnings $4 or less 144 1.14 0.869 1.14Earnings greater than $4 32 ... 1.43 1.85
S is omitted where the evidence fails to show that a variable isuseful in estimating price. Thus in 1933 and 1937 earnings and divi-dends do not appreciably assist in estimating prices of the stocks whichreported losses. Since price bears little relationship to amount of lossand such stocks rarely pay dividends, book value is the only informa-tion found to be helpful in estimating prices in this situation. Again,in 1945, for stocks reporting earnings per share above $4 the price-earnings relationship is so weak that earnings cannot be consideredhelpful in estimating price.
Analysis of the sample data leads, as Table 1 shows, to the follow-ing conclusions:
Both in 1933 and 1937, in the case of stocks suffering a loss,book value is the only variable helpful in estimating price.
1951]
180 UNIVERSITY OF PENNSYLVANIA LAW REVIEW [Vol. 100
The pattern changes in 1941 and 1945. In both of theseyears dividends are superior to either earnings or book value asan index to price. This is a valid inference for all stocks regard-less of the earnings level.
In 1941 and 1945 earnings are not uniformly superior to bookvalues for estimating price. In the case of stocks earning $4,pershare or less, earnings excel book value in 1941 but no differencecan be asserted in 1945. In the case of stocks with higher earn-ings there is little difference in 1941 but book value excels earningsin 1945.
To summarize, except where earnings are negative, dividends areconsistently as useful as any other single variable for estimation pur-poses. It is true that in 1933 and 1937 dividends are not appreciablybetter or worse than earnings, but in 1941 and 1945 dividends emergeas definitely superior to both earnings and book value. It is also note-worthy that dividends yield greater accuracy in estimating price in 1941than in 1945.'
The conclusions just summarized concern the relationship betweenprice 26 on the one hand and, on the other, earnings, dividends and bookvalue--each considered separately. In fact, however, earnings, divi-dends and book value are not independent of one another; these vari-ables do not exist in isolation; to a greater or less extent, presumably,they interact upon each other. Hence the question arose as to therelationship between price on the one hand and, on the other, earnings,dividends and book value collectively. This relationship can be ex-pressed satisfactorily as follows:
Yo--Co + C1 X1 + C2 + C3 X3
where Ye is the estimated square root of price, X1 is annual earnings,X 2 is annual dividends, X3 is square root of book value and C, C1 , C2
and C3 are numerical constants determined by the sample data.27 Again
25. It will be recalled that 1941 falls within a comparatively quiet and uneventfulperiod for the stock -market. The same cannot be said of 1945, a year marked bysharp and irregular upturns in stock prices.
26. See note 24 supra.
27. The regression model Y- y. + y ,X1 + y -X + yX3 + E was assumedfor each year. Y denotes square root of price and E is assumed to be normallydistributed with expected value zero and variance y
2 . CQ,C,,GQ and C, are sample
estimates of y, y,, y. and y,. As before S 2 is the sample estimate of Y2. The methodof obtaining these estimates and of testing their significance is discussed in SNmECOR,op. cit. supra note 18, c. 13.
VALUATION OF CLOSELY-HELD STOCK
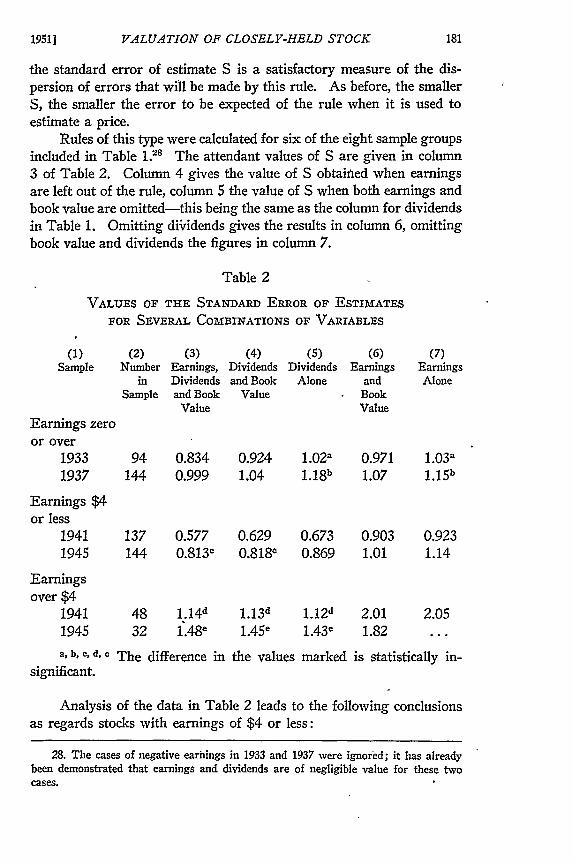
the standard error of estimate S is a satisfactory measure of the dis-persion of errors that will be made by this rule. As before, the smallerS, the smaller the error to be expected of the rule when it is used toestimate a price.
Rules of this type were calculated for six of the eight sample groupsincluded in Table 1.2 The attendant values of S are given in column3 of Table 2. Column 4 gives the value of S obtained when earningsare left out of the rule, column 5 the value of S when both earnings andbook value are omitted-this being the same as the column for dividendsin Table 1. Omitting diiridends gives the results in column 6, omittingbook value and dividends the figures in column 7.
Table 2
VALUES OF THE STANDARD ERROR OF ESTIMATES
FOR SEVERAL COMBINATIONS OF VARIABLES
(1) (2)Sample Number
inSample
Earnings zeroor over
19331937
Earnings $4or less
19411945
(3)Earnings,Dividendsand Book
Value
(4)Dividendsand Book
Value
(5)Dividends
Alone
(6)Earnings
andBookValue
(7)EarningsAlone
94 0.834 0.924 1.02a 0.971 1.03a144 0.999 1.04 1.18b 1.07 1.15 b
137 0.577 0.629 0.673 0.903 0.923144 0.813c 0.818c 0.869 1.01 1.14
1.14d 1 .1 3d
1.48e 1.45e1.12d 2.011.43e 1.82
a, b, c, d, e
significant.The difference in the values marked is statistically in-
Analysis of the data in Table 2 leads to the following conclusionsas regards stocks with earnings of $4 or less:
28. The cases of negative earhings in 1933 and 1937 were ignored; it has alreadybeen demonstrated that earnings and dividends are of negligible value for these twocases.
Earningsover $4
19411945
2.05

182 UNIVERSITY OF PENNSYLVANIA LAW REVIEW [Vol. 100
In 1933 and 1937 all three variables contribute some in-dependent information regarding price. There is no definite in-dication that earnings and dividends differ much in the influencethey exert.
In 1941 all three variables likewise contain some independentinformation for, when earnings are omitted S rises from 0.577 to0.629, a rise that cannot reasonably be considered negligible al-though it has minor significance so far as actual price estimationgoes. On the other hand, when dividends are'disregarded S jumpsfrom 0.577 to 0.903, a rise that is definitely important for pur-poses of estimating stock prices. It is such a large rise, in fact, asto indicate that in 1941 dividends alone (S = 0.673) had moreinfluence on price than earnings and book value jointly(S = 0.903). A similar statement for 1933 or 1937 would bewrong: it is clear that dividends were more important in 1941 thanin 1933 or 1937.
In 1945 there is no evidence that earnings had any independ-ent influence on price. For all three-variables taken jointly, Sequals 0.813; when earnings are omitted S shows a negligibleincrease to 0.818; but when dividends are omitted S shows animportant rise from 0.813 to 1.01. Apparently, therefore, sup-pression of information about earnings would have had no effect,assuming that other factors remained unchanged.
As regards stocks earning more than $4 per share, the followingconclusions may be drawn:
The 1941 and 1945 samples furnish no evidence that eitherearnings or book value is helpful in judging price. Although it ispossible that larger samples might show book value to be of someslight use, it seems fair to conclude that the practical importance ofbook value is very small.
Dividends are subject to less year-to-year fluctuation than earn-ings. The fact that dividends excelled annual earnings as an indicatorof price in 1941 and 1945 suggested that earnings might be more usefulif smoothed out by some averaging process. To test this, enough addi-tional data were collected so that five-year average earnings and five-year average dividends could be computed for the 1945 sample. Be-cause book value varies little from year to year the labor of gatheringdata for five-year average book values did not seem justified. The
VALUATION OF CLOSELY-HELD STOCK
expedient of dividing the sample into two parts was found to be asdesirable as before, and again $4 appeared to be a satisfactory dividingline.29
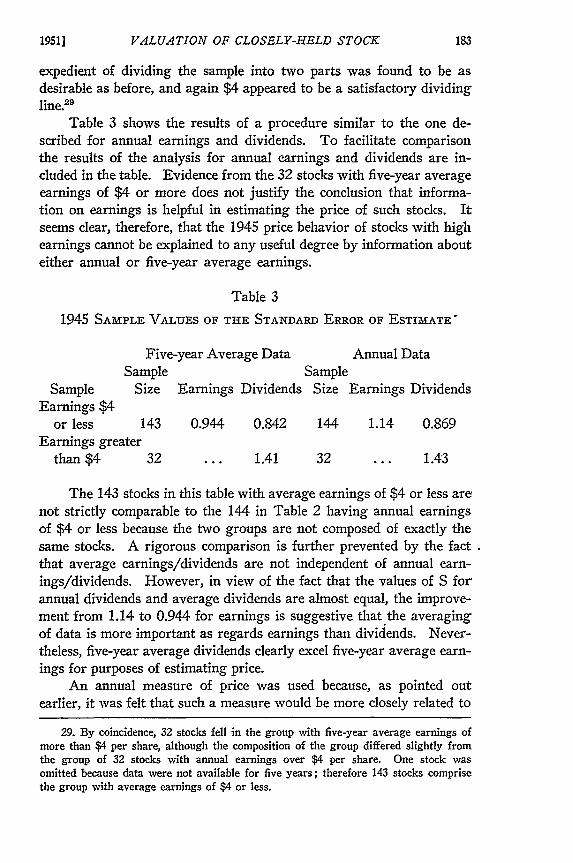
Table 3 shows the results of a procedure similar to the one de-scribed for annual earnings and dividends. To facilitate comparisonthe results of the analysis for annual earnings and dividends are in-cluded in the table. Evidence from the 32 stocks with five-year averageearnings of $4 or more does not justify the conclusion that informa-tion on earnings is helpful in estimating the price of such stocks. Itseems clear, therefore, that the 1945 price behavior of stocks with highearnings cannot be explained to any useful degree by information abouteither annual or five-year average earnings.
Table 3
1945 SAMPLE VALUES OF THE STANDARD ERROR OF ESTIMATE-
Five-year Average Data Annual DataSample Sample
Sample Size Earnings Dividends Size Earnings DividendsEarnings $4
or less 143 0.944 0.842 144 1.14 0.869Earnings greater
than $4 32 ... 1.41 32 ... 1.43
The 143 stocks in this table with average earnings of $4 or less arenot strictly comparable to the 144 in Table 2 having annual earningsof $4 or less because the two groups are not composed of exactly thesame stocks. A rigorous comparison is further prevented by the factthat average earnings/dividends are not independent of annual earn-ings/dividends. However, in view of the fact that the values of S forannual dividends and average dividends are almost equal, the improve-ment from 1.14 to 0.944 for earnings is suggestive that the averagingof data is more important as regards earnings than dividends. Never-theless, five-year average dividends clearly excel five-year average earn-ings for purposes of estimating price.
An annual measure of price was used because, as pointed outearlier, it was felt that such a measure would be more closely related to
29. By coincidence, 32 stocks fell in the group with five-year average earnings ofmore than $4 per share, although the composition of the group differed slightly fromthe group of 32 stocks with annual earnings over $4 per share. One stock wasomitted because data were not available for five years; therefore 143 stocks comprisethe group with average earnings of $4 or less.
1951]

184 UNIVERSITY OF PENNSYLVANIA LAW REVIEW [Vol. 100
annual earnings and annual dividends than a daily or monthly measureof price. On the other hand, in assigning value to a common stock oneis ordinarily concerned with a short time period, e.g., a month or aspecific day of a month. If stock prices are fairly even throughout ayear conclusions applicable to the average yearly price will likely applyquite well to prices computed for a shorter period; but if the marketexperiences sharp changes, as it did in the latter half of 1945, it may bedangerous to assume that the relative positions of earnings, dividendsand book value with respect to price have not changed during a year.To examine the relationship of earnings, dividends and book value toprice in respect of a shorter interval of time, additional computationswere carried out for the 1945 sample. A single day would have beenchosen but for the fact that not all shares have a market transactioneach day. A month seemed to be the convenient short period for in-vestigation.
Price was redefined as the arithmetic mean of the December(1945) high and low. Other variables have their previous meaningsand variations in price were measured exactly as before. Results aregiven in Table 4.
Table 4
VALUES OF THE STANDARD ERROR OF ESTIMATE
FOR DECEMBER 1945, PRICES
Number inSample Sample Earnings Dividends Book Value
Earnings $4 or less 144 1.18 0.977 1.22Earnings greater than $4 32 ... 1.53 1.88
The values for S are all larger than before, indicating that slightlyless accuracy should be expected in estimating the December averageprice than in estimating the average yearly price. The relative standingsof the three variables in respect ofprice did not change, however. Sofar as concerns stocks with annual earnings of less than $4 per share,analysis leads to the conclusion that dividends are superior to earningsand to book value, but fails to show any significant difference betweenearnings and book value. As regards stocks with earnings over $4 pershare dividends excel book value and book value excels earnings. Therelationship between price and earnings is so weak that it was notdetected from the sample of 32 stocks.

]VALUATION OF CLOSELY-HELD STOCK
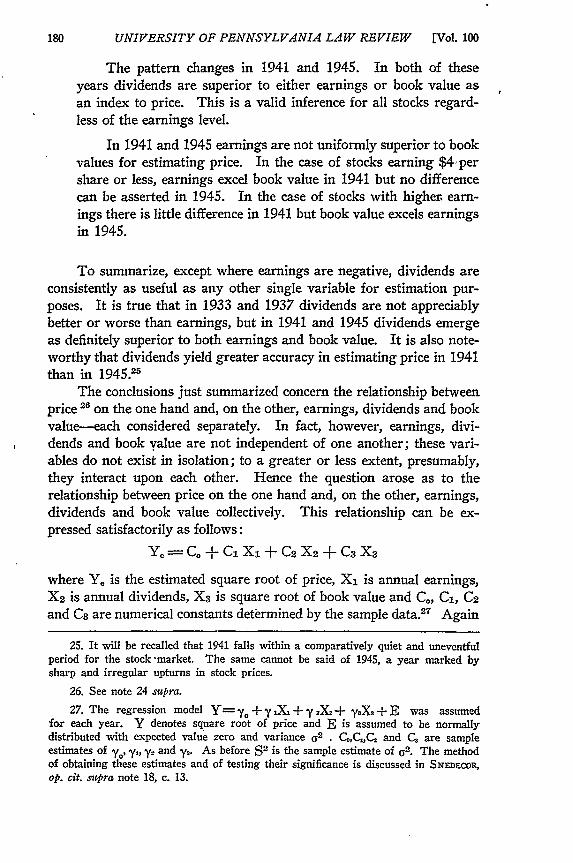
Utility of the Rules for Estimating Stock Prices. The success ofa rule for estimating stock prices depends upon two things: (a) theextent to which the rule faithfully represents the market relationship itpurports to express (for example, the relationship between price andearnings), and (b) the extent to which individual stock prices divergefrom the statistical expression of this relationship. As to the first point,the rules resulting from the study are based on enough observations sothat they may be expected to describe average market relationshipsrather closely. Therefore, to get an adequate idea of the success to beexpected of the different rules attention may be confined to the secondpoint. The standard error of estimate does not measure this deviation;it measures the deviation of the square roots of individual prices. Butvariations in square root of price can easily be expressed graphically asvariations in price and this is done in Figure 5. This figure showsgraphically what a given value of the standard error of estimate Smeans in terms of price estimation. Given an estimated price and thevalue of S which accompanies the rule used in the estimate, Figure 5yields an interval or spread which may be expected to include the marketprices of about two-thirds of all stocks with the same estimated price."
For example, suppose that a stock has an estimated price of $40.Even though this is the best estimate of the stock's price, only by chancewould it coincide with actual market price. To what extent is it apt tobe wrong? This is answered by Figure 5. In this figure the horizontalaxis represents the estimated price; the sloping lines represent differentvalues of S. From these two quantities it is possible to obtain an in-terval or spread on the vertical axis which reflects actual market prices.With an estimated price of $40, suppose that S is 1.0. Enter Figureat 40 on the horizontal axis and follow the vertical lines. This willintersect two S lines labeled 1.0 at heights equivalent to about 28 and54. Although $40 may be the most reasonable estimate of price, actualprices vary so greatly that the interval $28 to $54 can be expected toinclude only two-thirds of the stocks whose estimated price is $40 pershare. As was seen in Table 1, S was seldom less than 1.0 in any ofthe rules of this investigation. On the other hand this does not meanthat rules are useless. In the absence of better techniques for estimatingprices, it is rational to use the rule with the smallest S, i.e., the smallestprobability of error.
30. Three assumptions underlie this statement. They are (1) that Y, the squareroot of price, is normally distributed about the true market relationship a + OX withvariance 62; (2) that the sample rule a + bX is a perfect estimate of a + PX; and(3) that the standard error of estimate S, when squared is a perfect estimate of 02.
It is unlikely that any of these assumptions are perfectly true, but they should ap-proximate the truth closely enough to make Figure 5 very useful.
1951]

186 UNIVERSITY OF PENNSYLVANIA LAW REVIEW [Vol. 100
In Figure 5 the area enclosed by the two S lines labeled 0.5 hasbeen shaded. This permits one to visualize the intervals that wouldattend a rule for which S is equal to 0.5. None of the rules treated inthis study yields an interval so narrow, although the special one men-tioned in the following paragraph closely approaches it.
The wide variations portrayed by Figure 5 indicate that prices areinfluenced to a great extent by factors other than reported earnings,dividends and book value. As this inquiry is concerned with the effectof these three variables, no special effort has been made to isolate otherforces, some of which, no doubt, cannot be measured statistically. Theevidence does suggest, however, that price is associated with industrialclassifications. Figure 6 is a scatter diagram of the 143 stocks in the1945 sample that have five-year average earnings of $4 per share orless. The vertical axis represents square root of price, the horizontalaxis five-year average dividends. Roman numerals designate the fourairline stocks in the sample and Arabic numbers the seven copper andiron mining companies.31 The airlines are priced high relative to theirdividends; the mining companies, on the other hand, tend to be pricedlow relative to dividends. When these 11 stocks are omitted from thesample the value of S for the five-year average-dividend rule drops from0.842 to 0.605. The conclusion may fairly be drawn that further im-provements in accuracy could be obtained by dividing the sample ac-cording to occupational categories and studying each group of stocksseparately.
31. (1) Calumet and Hecla Consolidated Copper, (2) Miami Copper, (3) GreatNorthern Iron Ore, (4) Phelps Dodge, (5) International Nickel, (6) Chile Copper,(7) Cerro de Paseo Copper; (I) National Airline, (II) Penn Central Airlines(Capital Airlines), (III) Northwest Airlines, (IV) American Airlines.

VALUATION OF CLOSELY-HELD STOCK
APPENDIX A
Let Ye2 be an estimate of a security price, averaged over somegiven time period. Let the estimating equation be
Ye- a +bX
Where Y0 denotes the estimated square root of the average price, theaverage taken over twelve monthly prices as in. our main study, X maydenote (1) annual earnings, (2) annual dividends, or (3) square rootof book value. Sample values of a and b for these three cases, in ourfour selected years, are given in Table I.
TABLE I
REGRESSION COEFFICIENT FOR ANNUAL DATA
Sample
Annual earningsless than zero:
19331937
Annual earningszero or over:
19331937
Annual earnings$4 or less:
19411945
Annual earningsover $4:
19411945
AnnualEarningsa b
2.77 0.9983.41 0.804
1.65 0.8983.54 0.796
3.77 0.345
AnnualDividendsa b
3.57 1.183.59 1.07
1.99 1.343.42 1.48
2.87 1.074.44 1.17
Now distinguish five other possibilities for 1945.
BookValue
a b
1.23 0.3472.14 0.310
0.798 0.8292.52 0.672
1.892.69
0.3530.499
3.41 0.3853.46 0.504
With Y un-changed, let X represent (a) five-year average earnings and then (b)five-year average dividends. Finally let Y denote the square root ofDecember 1945 price while X denotes (c) 1945 earnings, (d) 1945dividends, and (e) square root of 1945 book value. Table II containssample values of a and b for these cases.
1951]
188 UNIVERSITY OF PENNSYLVANIA LAW REVIEW [Vol. 100
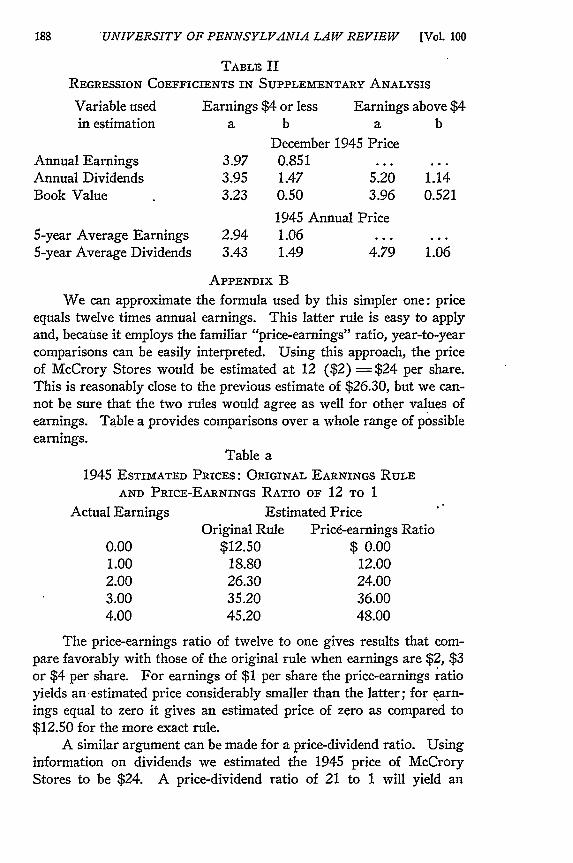
TABLE IIREGRESSION COEFFICIENTS IN SUPPLEMENTARY ANALYSIS
Variable usedin estimation
Earnings $4 or lessa b
Earnings above $4a b
Annual EarningsAnnual DividendsBook Value
3.973.953.23
5-year Average Earnings5-year Average Dividends
December 1945 Price0.851 ...1.47 5.200.50 3.96
1945 Annual Price2.94 1.06 ...3.43 1.49 4.79
APPENDIX B
We can approximate the formula used by this simpler one: priceequals twelve times annual earnings. This latter rule is easy to applyand, because it employs the familiar "price-earnings" ratio, year-to-yearcomparisons can be easily interpreted. Using this approach, the priceof McCrory Stores would be estimated at 12 ($2) =$24 per share.This is reasonably close to the previous estimate of $26.30, but we can-not be sure that the two rules would agree as well for other values ofearnings. Table a provides comparisons over a whole range of possibleearnings.
Table a1945 ESTIMATED PRICES: ORIGINAL EARNINGS RULE
AND PRICE-EARNINGS RATIO OF 12 TO 1
Actual Earnings Estimated PriceOriginal Rule Pricd-earnings Ratio
0.00 $12.50 $ 0.001.00 18.80 12.002.00 26.30 24.003.00 35.20 36.004.00 45.20 48.00
The price-earnings ratio of twelve to one gives results that com-pare favorably with those of the original rule when earnings are $2, $3or $4 per share. For earnings of $1 per share the price-earnings ratioyields an estimated price considerably smaller than the latter; for earn-ings equal to zero it gives an estimated price of zero as compared to$12.50 for the more exact rule.
A similar argument can be made for a price-dividend ratio. Usinginformation on dividends we estimated the 1945 price of McCroryStores to be $24. A price-dividend ratio of 21 to 1 will yield an
1.14
0.521
1.06

VALUATION OF CLOSELY-HELD STOCK
estimated price of 21 ($1) or $21. Here there is fairly close agree-ment between the prices given by the rule and by the price-dividendratio, but as shown by Table b, this is not true for all values of divi-dends. For dividends smaller than $1 the price-dividend ratio stronglytends to under-estimate price.
Table bESTIMATED PRICES: ORIGINAL DIVIDEND RULE *
AND PRICE-DIVIDEND RATIO
(1945 DATA)
Actual Dividends Estimated PriceOriginal Rule Price-dividend Ratio I
0.00 $11.70 $ 0.000.50 17.30 10.501.00 24.00 21.001.50 31.80 31.502.00 40.70 42.002.50 50.70 52.503.00 61.80 63.003.50 74.00 73.50
* For stocks with earnings of $4 or less.
To generalize from the comparisons in Tables a and b, it can besaid that a price-earnings (price-dividend) ratio gives a highly un-realistic estimate when earnings (dividends) are zero. The price-earnings ratio improves as one considers larger earnings.
For earnings of $2 or more per share it leads to satisfactory esti-mates. A similar tendency is observed with the price-dividend ratio,which does not come to close agreement with the carefully-fitted ruleuntil dividends are about $1 or larger.
These caveats should be kept in mind when reading Table c. Herethe price-earnings and price-dividend ratios are submitted that bestapproximate several of the rules actually fitted to the data.
Table cPRICE-EARNINGS AND PRICE-DIVIDEND RATIOS
Year and Classification Ratio of Price to annualEarnings Dividends
1933: Earnings zero or over 12 to 1 20 to 11937: Earnings zero or over 12 to 1 21 to 11941: Earnings $4 or less 7 to 1 12 to I
Earnings over $4 6 to 1 13 to 11945: Earnings $4 or less 12 to 1 21 to 1
Earnings over $4 .... 21 to 1
19511

190 UNIVERSITY OF PENNSYLVANIA LAW REVIEW [Vol. 100
No price-earnings ratio is exhibited for the 1945 stocks with earn-ings over $4 per share. As explained for Table 1, the sample fails todemonstrate a relationship between the prices and earnings of suchstocks. For a similar reason, no ratios are given for the 1933 and 1937stocks suffering losses.
Table c clearly demonstrates that price-earnings and price-dividendratios can undergo enormous year to year variations. A price-earningratio of 12 to 1 in 1933, 1937, and 1945 drops to the neighborhood of6 or 7 to 1 in 1941, while a price-dividend ratio of 21 to 1 is depressedto about 12 or 13 to 1.
No attempt has been made to express the price-book value rulesderived from the samples by approximate price-book value ratios. Ingeneral, such ratios seriously misrepresent the empirically-fitted rulesprovided by the actual samples. This is apparent from Table d, whichcompares prices given by the price-equals-book-value rule with pricesgiven by the statistical rules. In the case of 1941 and 1945, table dapplies only to shares with annual earnings of $4 or less, but neverthe-less it provides enough evidence to, seriously damage the price-equals-book-value rule.
Table dESTIMATES OF PRICE FROM BooK VALUE
Book A priori Rule Statistical RulesValue Price equals book value 1933 1937 1941 1945
$ 0 $ 0 $ 0.50 $ 6.32 $ 3.66 $ 7.214 4 6.05 14.90 6.70 13.609 9 10.80 20.50 8.70 17.50
16 16 16.90 28.10 10.90 23.0025 25 24.50 34.50 13.20 27.0036 36 33.20 43.00 16.00 32.3049 49 43.50 52.00 19.00 38.20
It is apparent from Table d that the relationship between price andbook value can vary tremendously. In 1941 price tended to be verylow compared to book value, a tendency that concurs with results ob-tained from earnings and dividends. In all years there is a noticeabletendency for price to exceed book value for book values of $9 per shareor less. The evidence certainly does not point to close agreement be-tween market price and book value in any consistent or general way.

1951] VALUATION OF CLOSELY-HELD STOCK 191
00
0 0
0 0 00 *0
7r00 0 09
00=3 0
010
6 5 o 0• " • - °
0,
o o0
0 0 0 0
Earnings (Dollars per Share)
(1945)
FIGURE I

192 UNIVERSITY OF PENNSYLVANIA LAW REVIEW [Vol. 100
ividend(1945)
FIGURE 2
1951] VALUATION OF CLOSELY-HELD STOCK
'- £ I i I I I I I- I
II
10-
9-
8
7-
6-*
Square Root of Book Value(1945)
liGuRE 3
140 =
'0
0 e
. .1•0 °•"*
* . *?.
0
0 ° " "" 4° 1 I 2 1 4 1
..... J':."~
01 * * I I I I I I t I t0 3 2 35 4 5 6 7 8 9 '10 II 12 13 14 15
Earnings (Dollars per Share)
(1945)

194 UNIVERSITY OF PENNSYLVANIA LAW REVIEW [Vol. 100
140 2.0
130 - 1.5
100 0.0
70 / .' ..-..... .. 1.52.0
0S
30
a5o A _ _ _ _ _
20 j,/ -
/1 II0,
80 90 10040 50 60Estimated Price
FIGURE 5
0 0 20

1951] & VALUATION OF CLOSELY-HELD STOCK 195
0 0
00
00
00
01 1/ ;
• • / 0
0 ~ 1 0
"00
0 0 -
0 0
Average DividendFiouRE 6