Valuation of Sample Company, Inc. -...
62
Valuation of Sample Company, Inc. April 30, 2010 Jay R. Hill, CPA, P.C. Jay R. Hill, CPA ABV
Transcript of Valuation of Sample Company, Inc. -...

Valuation of Sample Company, Inc. April 30, 2010
Jay R. Hill, CPA, P.C. Jay R. Hill, CPA ABV
Jay R. Hill, CPA, P.C. A Professional Corporation Phone (816) 505‐2038 6124 S. National Dr. Fax (816) 505‐2038 Cell (816) 674‐3141 Parkville, Missouri 64152 Email [email protected]
www.jrhillco.com John Sample, President Sample Company, Inc. We have been engaged to establish a reasonable estimate of the fair market value of a minority interest in the common stock of Sample Company, Inc. (herein referred to as either “Sample Company” or “the Company”), a Florida Corporation, as of April 30, 2010. It is our understanding that this valuation is solely for gift and estate tax purposes. The subject interest is expected to be between 1% to 49% of voting common stock. It is our understanding that you and other Company representatives agree to restrict the use of this report for the stated purposes and that no distribution of this report to outside parties to obtain credit or for any other purpose will occur. We conduct this valuation engagement and present our detailed report in conformity with the “Statement of Standards for Valuation Services No. 1” (SSVS) of the American Institute of Certified Public Accountants.1 Our analysis and report are also performed with reference to the Uniform Standards of Professional Appraisal Practice (“USPAP”) promulgated by the Appraisal Foundation and with IRS business valuation development and reporting guidelines including Revenue Ruling 59‐60 (C.B. 1959‐1, 237), as modified and amplified, which provides guidelines for the valuation of closely‐held corporate stock for federal income, estate and gift tax purposes. Revenue Ruling 59‐60, while used in tax valuations, is also used in many nontax valuations. The standard of value for this valuation is fair market value. A common definition reference is Revenue Ruling 59‐60, which defines fair market value as “the price at which the property would change hands between a willing buyer and a willing seller when the former is not under any compulsion to buy and the latter is not under any compulsion to sell, both parties having reasonable knowledge of relevant facts.” In performing our valuation, we rely on the accuracy and reliability of historical financial statements along with other financial data and oral representations of Company representatives. We will not audit or review such financial statements or other data, and we do not express an opinion or any other form of assurance on them. Based on our valuation study of Sample Company as described in the body of this report, it is our opinion that the fair market value of a minority interest in Sample Company’s common stock as of April 30, 2010 is
1 SSVS defines a valuation engagement as “an engagement to estimate value in which a valuation analyst determines an estimate of the value of a subject interest by performing appropriate procedures, as outlined in the AICPA Statement on Standards for Valuation Services, and is free to apply the valuation approaches and methods he or she deems appropriate in the circumstances. The valuation analyst expresses the results of the valuation engagement as a conclusion of value, which may be either a single amount or a range.”

$370 per share
We base our conclusion on the documents and information in Exhibit A and our opinion is subject to the assumptions and limiting conditions listed in the last section of this report. No one should rely on this engagement to disclose errors, irregularities, or illegal acts, including fraud or defalcations, that may exist in the financial information and/or operations of the subject entity. July 2, 2010 Kansas City, Missouri
© Jay R. Hill, CPA, P.C. 1
Table of Contents
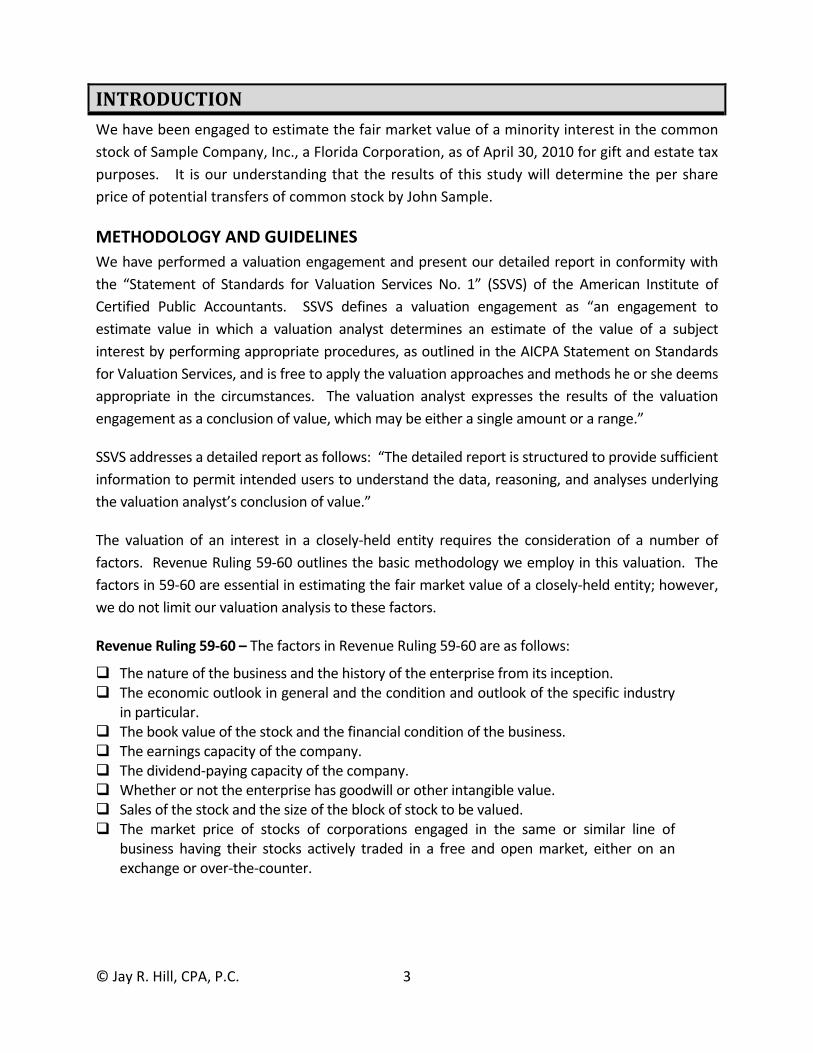
CERTIFICATION STATEMENT .............................................................................................. 2 INTRODUCTION .................................................................................................................... 3 METHODOLOGY AND GUIDELINES ............................................................................................. 3 STANDARD AND PREMISE OF VALUE .......................................................................................... 4 PROCEDURES AND DOCUMENTATION ....................................................................................... 4
OVERVIEW ............................................................................................................................. 5 NATURE AND HISTORY OF THE COMPANY ................................................................................. 5 PRODUCTS, PRODUCT QUALIFICATIONS AND CERTIFICATIONS ................................................. 5 DISTRIBUTION AND COMPETITION ............................................................................................. 6 MANAGEMENT AND EMPLOYEES ............................................................................................... 6 FACILITIES .................................................................................................................................... 7 FINANCIAL OVERVIEW ................................................................................................................ 7 STOCK OWNERSHIP AND TRANSFERS OF STOCK ........................................................................ 8
ECONOMIC AND INDUSTRY OUTLOOK ............................................................................... 9 NATIONAL ECONOMY OVERVIEW .............................................................................................. 9 ECONOMIC OUTLOOK ............................................................................................................... 13 REGIONAL AND LOCAL ECONOMIC OVERVIEW AND OUTLOOK .............................................. 14 INDUSTRY OVERVIEW AND OUTLOOK – AEROSPACE AND DEFENSE ....................................... 15 IMPACT ON COMPANY ............................................................................................................. 19
FINANCIAL STATEMENT ANALYSIS .................................................................................. 20 FINANCIAL POSITION OF COMPANY AND TRENDS ................................................................... 20 OPERATING RESULTS AND TRENDS .......................................................................................... 21 RATIO ANALYSIS ........................................................................................................................ 23 DETAILED FINANCIAL STATEMENTS .......................................................................................... 24
VALUATION ANALYSIS AND CONCLUSION OF VALUE ..................................................... 28 SUMMARY OF PERTINENT FACTORS ......................................................................................... 28 VALUATION ANALYSIS ............................................................................................................... 28 VALUATION METHODS CONSIDERED BUT NOT UTILIZED ........................................................ 29 DISCOUNTED CASH FLOW METHOD ......................................................................................... 30 PROJECTION ASSUMPTIONS ..................................................................................................... 34 RECONCILIATION OF VALUE ESTIMATES – DCF METHOD ........................................................ 39 PUBLIC GUIDELINE COMPANY METHOD .................................................................................. 40 DEVELOPMENT OF VALUE FACTORS – GUIDELINE COMPANIES .............................................. 40 RECONCILIATION OF VALUE ESTIMATES – ALL METHODS ....................................................... 49 ADJUSTMENT FOR LACK OF MARKETABILITY ........................................................................... 49 VALUATION SUMMARY AND CONCLUSION OF VALUE ............................................................. 53
ASSUMPTIONS AND LIMITING CONDITIONS .................................................................... 54 DOCUMENTS ANALYZED AND UTILIZED .......................................................................... 57 QUALIFICATIONS OF VALUATOR ...................................................................................... 58 INDEPENDENCE OF VALUATOR......................................................................................... 58 EXHIBIT C ‐ OMITTED

© Jay R. Hill, CPA, P.C. 2
CERTIFICATION STATEMENT Except as otherwise noted in this appraisal report, I certify that to the best of my knowledge and
belief: 1) The statements of fact contained in this report are true and correct. 2) The reported analyses, opinions and conclusions are limited only by the reported
assumptions and limiting conditions, and are my personal, impartial and unbiased professional analyses, opinions, and conclusions.
3) I have no present or prospective interest in the property that was the subject of this report,
and I have no personal interest or bias with respect to the parties involved. 4) I have no bias with respect to the property that was the subject of this report or to the
parties involved with this assignment. 5) My engagement in this assignment was not contingent upon developing or reporting
predetermined results. 6) My compensation for completing this assignment was not contingent upon the
development or reporting of a predetermined value or direction in value that favors the cause of the client, the amount of the value opinion, the attainment of a stipulated result or the occurrence of a subsequent event directly related to the intended use of this appraisal.
7) My analyses, opinions and conclusions are developed, and this report was prepared, in
conformity with the Uniform Standards of Professional Appraisal Practice. 8) No one provided significant business appraisal assistance to the person signing this certification. Jay R. Hill, CPA∙ABV
© Jay R. Hill, CPA, P.C. 3
INTRODUCTION We have been engaged to estimate the fair market value of a minority interest in the common
stock of Sample Company, Inc., a Florida Corporation, as of April 30, 2010 for gift and estate tax
purposes. It is our understanding that the results of this study will determine the per share
price of potential transfers of common stock by John Sample.
METHODOLOGY AND GUIDELINES
We have performed a valuation engagement and present our detailed report in conformity with
the “Statement of Standards for Valuation Services No. 1” (SSVS) of the American Institute of
Certified Public Accountants. SSVS defines a valuation engagement as “an engagement to
estimate value in which a valuation analyst determines an estimate of the value of a subject
interest by performing appropriate procedures, as outlined in the AICPA Statement on Standards
for Valuation Services, and is free to apply the valuation approaches and methods he or she deems
appropriate in the circumstances. The valuation analyst expresses the results of the valuation
engagement as a conclusion of value, which may be either a single amount or a range.”
SSVS addresses a detailed report as follows: “The detailed report is structured to provide sufficient
information to permit intended users to understand the data, reasoning, and analyses underlying
the valuation analyst’s conclusion of value.”
The valuation of an interest in a closely‐held entity requires the consideration of a number of
factors. Revenue Ruling 59‐60 outlines the basic methodology we employ in this valuation. The
factors in 59‐60 are essential in estimating the fair market value of a closely‐held entity; however,
we do not limit our valuation analysis to these factors.
Revenue Ruling 59‐60 – The factors in Revenue Ruling 59‐60 are as follows:
The nature of the business and the history of the enterprise from its inception. The economic outlook in general and the condition and outlook of the specific industry
in particular. The book value of the stock and the financial condition of the business. The earnings capacity of the company. The dividend‐paying capacity of the company. Whether or not the enterprise has goodwill or other intangible value. Sales of the stock and the size of the block of stock to be valued. The market price of stocks of corporations engaged in the same or similar line of
business having their stocks actively traded in a free and open market, either on an exchange or over‐the‐counter.
© Jay R. Hill, CPA, P.C. 4
STANDARD AND PREMISE OF VALUE
The standard of value that we are determining in this study is fair market value. Revenue
Ruling 59‐60 defines fair market value as:
The price at which the property would change hands between a willing buyer and a willing seller when the former is not under any compulsion to buy and the latter is not under any compulsion to sell, both parties having reasonable knowledge of relevant facts.
Fair market value is also defined in a similar way in the International Glossary of Business
Valuation Terms as:
The price, expressed in terms of cash equivalents, at which property would change hands between a hypothetical willing and able buyer and a hypothetical willing and able seller, acting at arm’s length in an open and unrestricted market, when neither is under compulsion to buy or sell and when both have reasonable knowledge of the relevant facts.
The premise of value is going concern. The liquidation premise of value was considered and
rejected as not applicable, as the going‐concern value results in a higher value for the interest
than the liquidation value, whether orderly or fixed.
PROCEDURES AND DOCUMENTATION
In reaching our valuation conclusion, we perform certain procedures including the following:
Review and analyze the Company’s financial information from 2005 through 2009. Review and analyze other pertinent documents provided by management and the
Company’s outside accountant. Review and analyze economic, industry and equity market data. Interview management and make a site visit to the Company’s headquarters and
manufacturing facility.
Descriptions of the documents we use in this valuation are in Exhibit A. The
qualifications and independence of the valuator are set forth in Exhibit B.
© Jay R. Hill, CPA, P.C. 5
OVERVIEW
NATURE AND HISTORY OF THE COMPANY
Sample Company is a manufacturer of aerospace fasteners, specifically hex head bolts and
machine screws compliant with industry standards and certifications. Founded in 1995 by John
Sample, the Company’s products are sold to distributors who resell to original equipment
manufacturers, aftermarket repair companies and military users on a worldwide basis. The
Company’s primary manufacturing facility is located in Ft. Lauderdale, Florida.
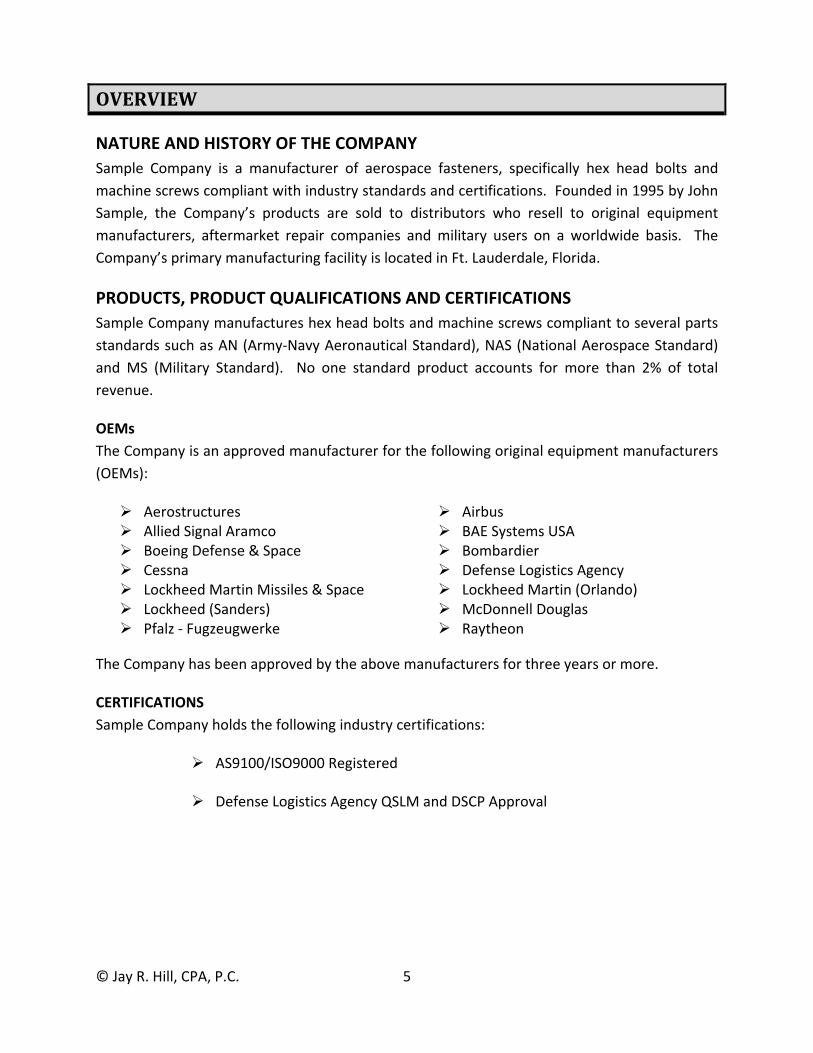
PRODUCTS, PRODUCT QUALIFICATIONS AND CERTIFICATIONS
Sample Company manufactures hex head bolts and machine screws compliant to several parts
standards such as AN (Army‐Navy Aeronautical Standard), NAS (National Aerospace Standard)
and MS (Military Standard). No one standard product accounts for more than 2% of total
revenue.
OEMs
The Company is an approved manufacturer for the following original equipment manufacturers
(OEMs):
Aerostructures Airbus Allied Signal Aramco BAE Systems USA Boeing Defense & Space Bombardier Cessna Defense Logistics Agency Lockheed Martin Missiles & Space Lockheed Martin (Orlando) Lockheed (Sanders) McDonnell Douglas Pfalz ‐ Fugzeugwerke Raytheon
The Company has been approved by the above manufacturers for three years or more.
CERTIFICATIONS
Sample Company holds the following industry certifications:
AS9100/ISO9000 Registered
Defense Logistics Agency QSLM and DSCP Approval
© Jay R. Hill, CPA, P.C. 6
DISTRIBUTION AND COMPETITION
Sample Company sells its products primarily through key distribution agreements. Its most
recent agreement is with Example Distributors, a large East coast distributor of airplane parts.
In addition, there are smaller distribution agreements and also government and non‐
government contracts with parties in the U.S. and Europe.
Sample Company competes on a worldwide basis in what is considered a somewhat niche
industry. In the United States there are only about 15 viable competitors. Management cites
HH Fastener, Inc., located in Rhode Island, as the Company’s primary competitor. Six of the
other main competitors are located in California with another in Kansas. Competition keys are
quality and price and management believes it outperforms most, if not all, of its competitors in
these areas.
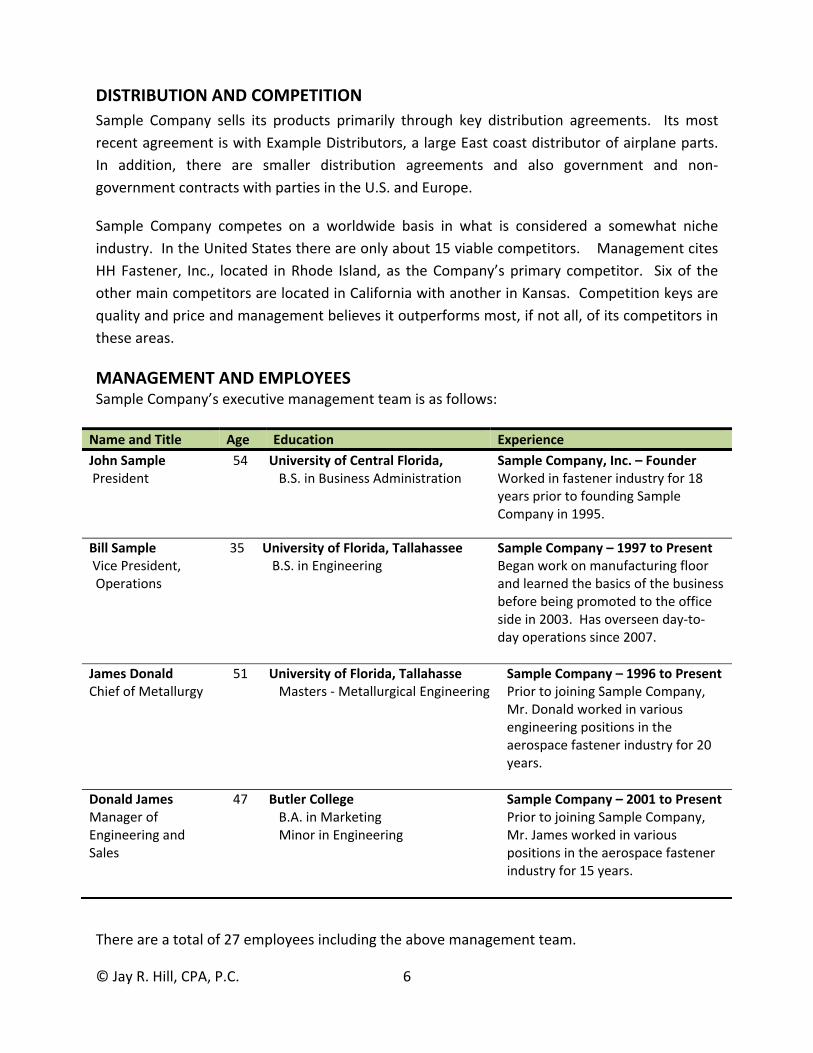
MANAGEMENT AND EMPLOYEES Sample Company’s executive management team is as follows:
Name and Title Age Education Experience
John Sample President
54 University of Central Florida, B.S. in Business Administration
Sample Company, Inc. – Founder Worked in fastener industry for 18 years prior to founding Sample Company in 1995.
Bill Sample Vice President, Operations
35 University of Florida, Tallahassee B.S. in Engineering
Sample Company – 1997 to Present Began work on manufacturing floor and learned the basics of the business before being promoted to the office side in 2003. Has overseen day‐to‐day operations since 2007.
James Donald Chief of Metallurgy
51 University of Florida, Tallahasse Masters ‐ Metallurgical Engineering
Sample Company – 1996 to Present Prior to joining Sample Company, Mr. Donald worked in various engineering positions in the aerospace fastener industry for 20 years.
Donald James Manager of Engineering and Sales
47 Butler College B.A. in Marketing Minor in Engineering
Sample Company – 2001 to Present Prior to joining Sample Company, Mr. James worked in various positions in the aerospace fastener industry for 15 years.
There are a total of 27 employees including the above management team.
© Jay R. Hill, CPA, P.C. 7
FACILITIES The Company’s primary operations are located at 1111 Sample Street in Ft. Lauderdale, Florida.
The facility provides about 25,000 square feet of usable space and houses the manufacturing,
sales and administrative operations. The manufacturing sector contains the following major
equipment:
20 Single Die Double Stroke Heading machines of different diameter and make
10 thread rollers of varying makes and sizes (also has 4 additional machines in cold storage)
5 single die single blow trimming machines of varying makes and diameters
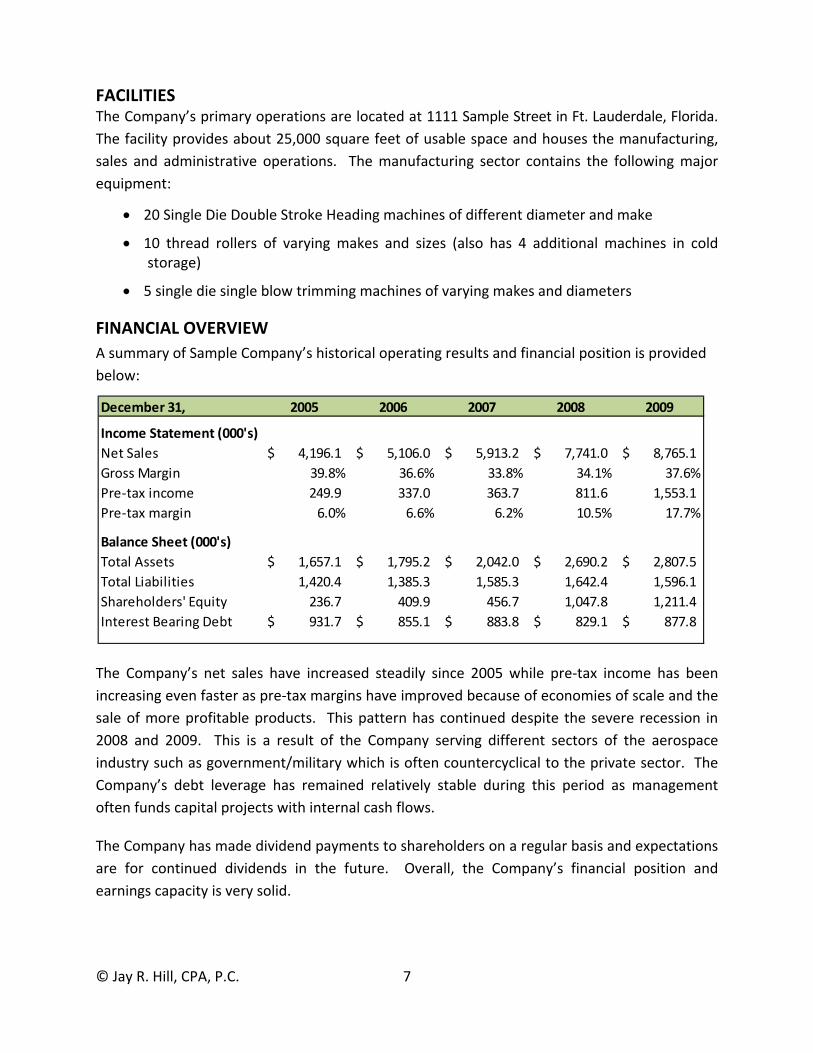
FINANCIAL OVERVIEW
A summary of Sample Company’s historical operating results and financial position is provided
below:
The Company’s net sales have increased steadily since 2005 while pre‐tax income has been
increasing even faster as pre‐tax margins have improved because of economies of scale and the
sale of more profitable products. This pattern has continued despite the severe recession in
2008 and 2009. This is a result of the Company serving different sectors of the aerospace
industry such as government/military which is often countercyclical to the private sector. The
Company’s debt leverage has remained relatively stable during this period as management
often funds capital projects with internal cash flows.
The Company has made dividend payments to shareholders on a regular basis and expectations
are for continued dividends in the future. Overall, the Company’s financial position and
earnings capacity is very solid.
December 31, 2005 2006 2007 2008 2009
Income Statement (000's)
Net Sales 4,196.1$ 5,106.0$ 5,913.2$ 7,741.0$ 8,765.1$
Gross Margin 39.8% 36.6% 33.8% 34.1% 37.6%
Pre‐tax income 249.9 337.0 363.7 811.6 1,553.1
Pre‐tax margin 6.0% 6.6% 6.2% 10.5% 17.7%
Balance Sheet (000's)
Total Assets 1,657.1$ 1,795.2$ 2,042.0$ 2,690.2$ 2,807.5$
Total Liabilities 1,420.4 1,385.3 1,585.3 1,642.4 1,596.1
Shareholders' Equity 236.7 409.9 456.7 1,047.8 1,211.4
Interest Bearing Debt 931.7$ 855.1$ 883.8$ 829.1$ 877.8$
© Jay R. Hill, CPA, P.C. 8
STOCK OWNERSHIP AND TRANSFERS OF STOCK
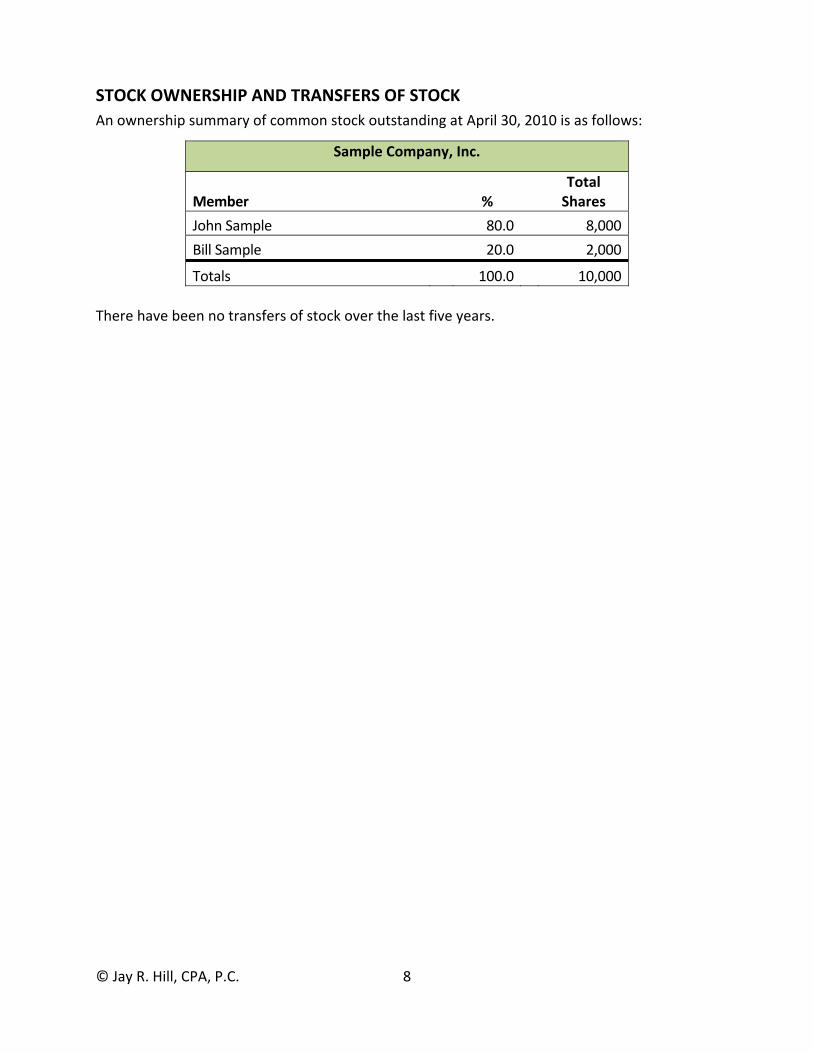
An ownership summary of common stock outstanding at April 30, 2010 is as follows:
Sample Company, Inc.
Member % Total
Shares
John Sample 80.0 8,000
Bill Sample 20.0 2,000
Totals 100.0 10,000
There have been no transfers of stock over the last five years.
© Jay R. Hill, CPA, P.C. 9
ECONOMIC AND INDUSTRY OUTLOOK Understanding the current state of the national economy and its impact on business entities in
the United States is important for the valuation of a privately held entity. The following section
discusses general economic indicators, their historical trends and outlook.
NATIONAL ECONOMY OVERVIEW2
The gross domestic product (GDP), the broadest measure of the U.S. economy, grew at a 3.2%
annual rate in the first quarter of 2010. The GDP is the total market value of goods and services
produced in the U.S. economy and is generally considered the most comprehensive measure of
economic growth. President Obama called this news “an important milepost on our road to
recovery.” He went on to say, “After the single biggest economic crisis in our lifetimes, we're
heading in the right direction.”
However, GDP growth this quarter was slightly less than some analysts had forecasted, as
economists surveyed by
Briefing.com forecasted
3.3% growth. "Despite a
softer headline number
than we had expected, this
is an encouraging report,"
said economist Peter
Newland of Barclays Capital.
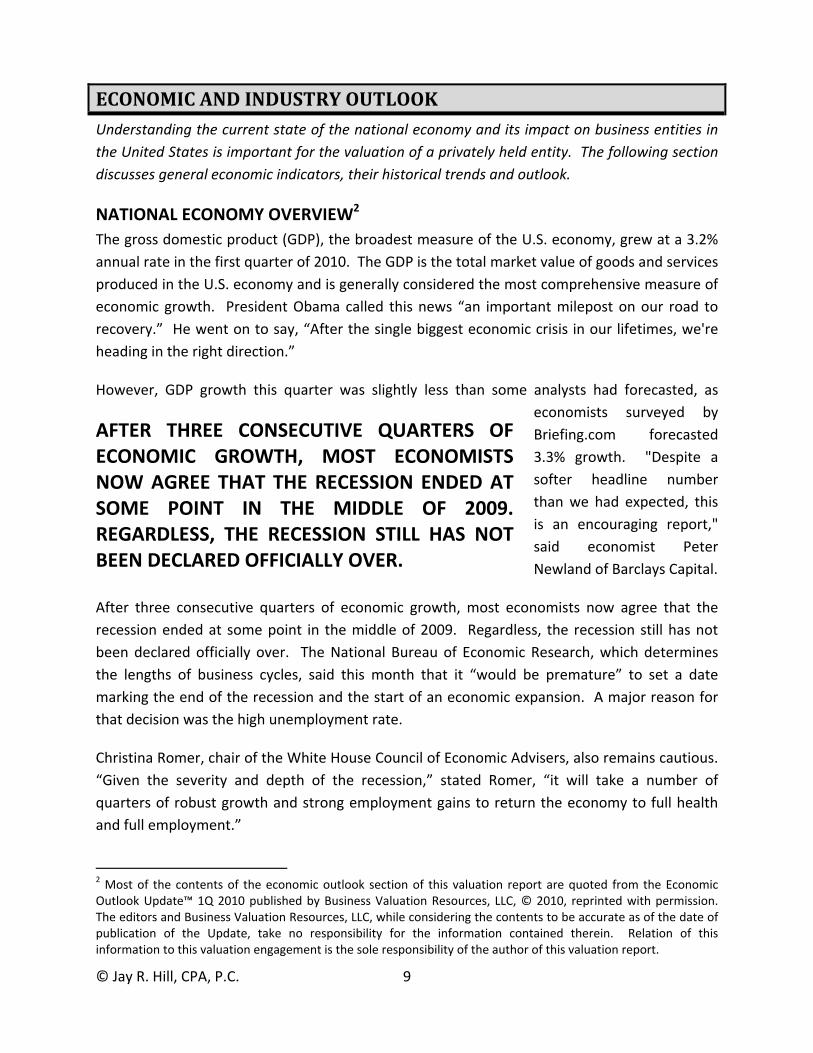
After three consecutive quarters of economic growth, most economists now agree that the
recession ended at some point in the middle of 2009. Regardless, the recession still has not
been declared officially over. The National Bureau of Economic Research, which determines
the lengths of business cycles, said this month that it “would be premature” to set a date
marking the end of the recession and the start of an economic expansion. A major reason for
that decision was the high unemployment rate.
Christina Romer, chair of the White House Council of Economic Advisers, also remains cautious.
“Given the severity and depth of the recession,” stated Romer, “it will take a number of
quarters of robust growth and strong employment gains to return the economy to full health
and full employment.”
2 Most of the contents of the economic outlook section of this valuation report are quoted from the Economic Outlook Update™ 1Q 2010 published by Business Valuation Resources, LLC, © 2010, reprinted with permission. The editors and Business Valuation Resources, LLC, while considering the contents to be accurate as of the date of publication of the Update, take no responsibility for the information contained therein. Relation of this information to this valuation engagement is the sole responsibility of the author of this valuation report.
AFTER THREE CONSECUTIVE QUARTERS OF ECONOMIC GROWTH, MOST ECONOMISTS NOW AGREE THAT THE RECESSION ENDED AT SOME POINT IN THE MIDDLE OF 2009. REGARDLESS, THE RECESSION STILL HAS NOT BEEN DECLARED OFFICIALLY OVER.
© Jay R. Hill, CPA, P.C. 10
With consumer spending experiencing its biggest rate of increase in three years, it was the
largest contributor to this quarter’s GDP growth. “Consumer spending has come out of the
deep freeze,” said Sung Won Sohn, economics professor at Cal State University Channel Islands.
“To be sure, the job market is poor and yet to show sustained recovery, but consumers are
feeling better about the future.”
Josh Bivens, an economist with the Economic Policy Institute, notes that disposable personal
incomes remained flat this quarter, indicating that personal spending rose simply because
savings rates fell. “A recovery that relies on savings rates retreating back to their pre‐recession
minimums would be extremely fragile,” warns Bivens.
State and local government spending declined for a third straight quarter, dragging the GDP
down. The decline in state and local government spending was the biggest drop since 1981.
This is largely due to budget crises. “Given balanced budget rules at the state‐level, this implies
that states will be cutting spending and/or raising taxes for years to come and hence exerting a
powerful drag on growth,” states Bivens.
The 3.2% growth in the first quarter of 2010 was the third straight quarter of economic growth.
The economy grew at a 5.6% annualized rate last quarter. The largest contributions to growth
came from personal consumption expenditures and a rise in inventory investment, which
added 2.55 and 1.57 percentage points to the GDP, respectively.
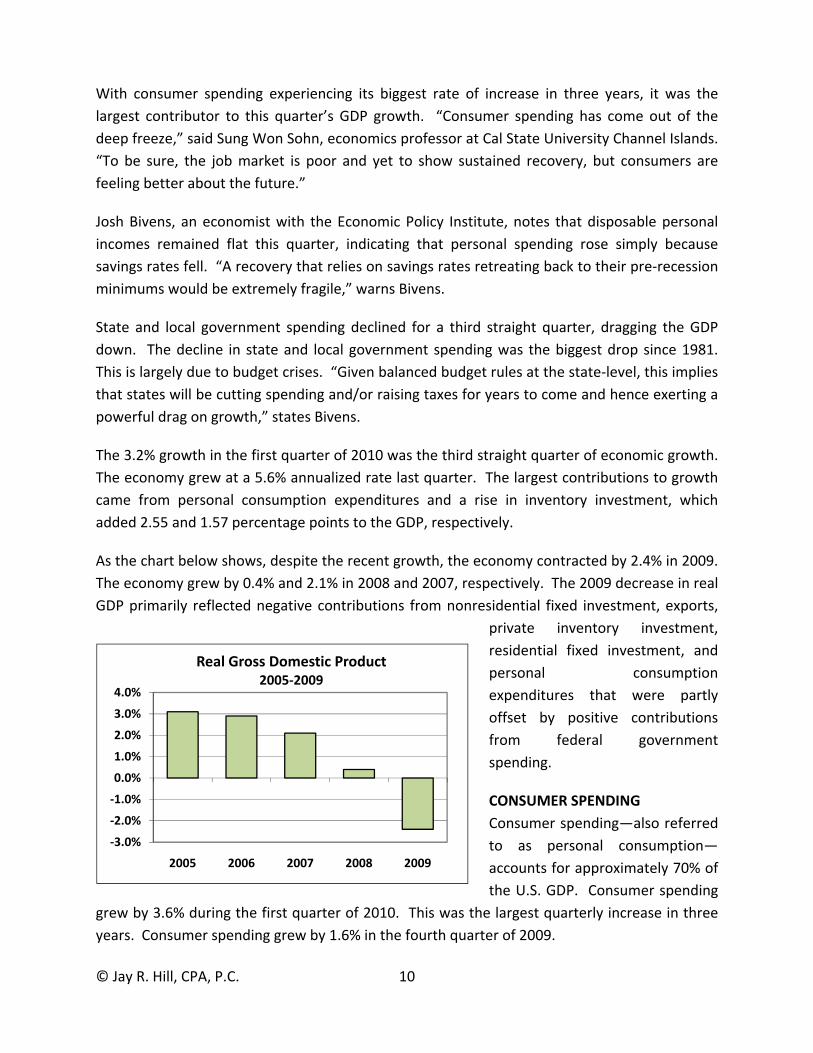
As the chart below shows, despite the recent growth, the economy contracted by 2.4% in 2009.
The economy grew by 0.4% and 2.1% in 2008 and 2007, respectively. The 2009 decrease in real
GDP primarily reflected negative contributions from nonresidential fixed investment, exports,
private inventory investment,
residential fixed investment, and
personal consumption
expenditures that were partly
offset by positive contributions
from federal government
spending.
CONSUMER SPENDING
Consumer spending—also referred
to as personal consumption—
accounts for approximately 70% of
the U.S. GDP. Consumer spending
grew by 3.6% during the first quarter of 2010. This was the largest quarterly increase in three
years. Consumer spending grew by 1.6% in the fourth quarter of 2009.
‐3.0%
‐2.0%
‐1.0%
0.0%
1.0%
2.0%
3.0%
4.0%
2005 2006 2007 2008 2009
Real Gross Domestic Product2005‐2009
© Jay R. Hill, CPA, P.C. 11
GOVERNMENT SPENDING
Total government spending decreased at a rate of 1.8% in the first quarter. Government
spending fell 1.3% in the fourth quarter of 2009 but grew 2.6% in the third. This quarter’s
decline in government spending had a negative 0.37 percentage point effect on the first‐
quarter GDP. The previous quarter’s decline in government spending had a negative 0.26
percentage point effect on the fourth‐quarter GDP. The primary reason for these declines was
severe cutbacks by state and local governments. Total government spending grew by 1.8% in
2009, 3.1% in 2008, and 1.7% in 2007.
Federal government spending increased at a rate of 1.4% this quarter. Federal government
spending remained unchanged in the previous quarter but grew 8.0% in the third quarter of
2009. Federal government spending grew by 5.2% in 2009, after growing 7.7% in 2008 and
1.3% in 2007.
BUSINESS INVESTMENT AND INVENTORIES
Business spending, also known as nonresidential fixed investment, grew at a rate of 4.1% in the
first quarter. This is the second straight quarter of growth. Business spending increased at a
rate of 5.3% in the fourth quarter of 2009, but decreased by 5.9% in the third. Business
spending declined by 17.8% in 2009, after growing 1.6% in 2008 and 6.2% in 2007.
Business spending on structures (nonresidential structures) continued to decrease this quarter,
dropping at an annual rate of 14.0%. This quarter’s drop marks seven consecutive quarterly
declines. Business spending on structures decreased at a rate of 18.0% in the previous quarter
and 18.4% in the third quarter of 2009. Business expenditures on equipment and software
increased at an annual rate of 13.4% in the first quarter—the third consecutive quarterly
increase.
Business investments in inventories rose this quarter. The change in real private inventories
added 1.57 percentage points to the first‐quarter change in real GDP, after adding 3.79
percentage points to the fourth‐quarter change in 2009. Private businesses increased
inventories $31.1 billion in the first quarter, following decreases of $19.7 billion in the fourth
quarter and $139.2 billion in the third.
CONSUMER PRICES AND INFLATION RATES
Inflationary pressures remained essentially flat in the first quarter. The Federal Open Market
Committee (FOMC) stated in their most recent release that they expect inflation to “remain
subdued for some time.”
According to the U.S. Department of Commerce, the price index for gross domestic purchases
increased 1.7% in the first quarter. The price index for gross domestic purchases measures
© Jay R. Hill, CPA, P.C. 12
prices paid by U.S. residents. In the fourth quarter, the index increased 2.0%. Excluding food
and energy prices, the price index for gross domestic purchases increased by 1.1% in the first
quarter, compared with an increase of 1.5% in the previous quarter.
The U.S. Department of Labor reported that the Consumer Price Index for All Urban Consumers
(CPI‐U) increased 0.1% (seasonally adjusted) in March. The index was unchanged in February
and increased 0.2% in January. Over the last 12 months, the index increased 2.3% before
seasonal adjustment. The index decreased 0.3% in 2009 after increasing 3.8% in 2008 and 2.9%
in 2007.
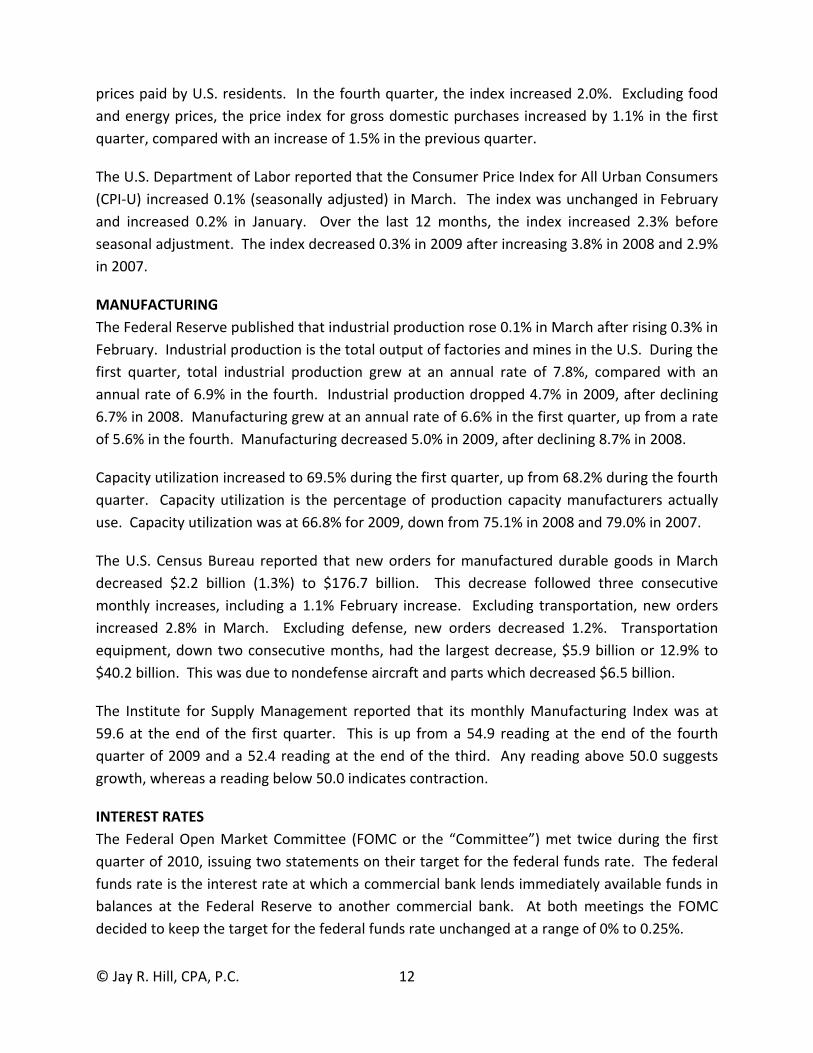
MANUFACTURING
The Federal Reserve published that industrial production rose 0.1% in March after rising 0.3% in
February. Industrial production is the total output of factories and mines in the U.S. During the
first quarter, total industrial production grew at an annual rate of 7.8%, compared with an
annual rate of 6.9% in the fourth. Industrial production dropped 4.7% in 2009, after declining
6.7% in 2008. Manufacturing grew at an annual rate of 6.6% in the first quarter, up from a rate
of 5.6% in the fourth. Manufacturing decreased 5.0% in 2009, after declining 8.7% in 2008.
Capacity utilization increased to 69.5% during the first quarter, up from 68.2% during the fourth
quarter. Capacity utilization is the percentage of production capacity manufacturers actually
use. Capacity utilization was at 66.8% for 2009, down from 75.1% in 2008 and 79.0% in 2007.
The U.S. Census Bureau reported that new orders for manufactured durable goods in March
decreased $2.2 billion (1.3%) to $176.7 billion. This decrease followed three consecutive
monthly increases, including a 1.1% February increase. Excluding transportation, new orders
increased 2.8% in March. Excluding defense, new orders decreased 1.2%. Transportation
equipment, down two consecutive months, had the largest decrease, $5.9 billion or 12.9% to
$40.2 billion. This was due to nondefense aircraft and parts which decreased $6.5 billion.
The Institute for Supply Management reported that its monthly Manufacturing Index was at
59.6 at the end of the first quarter. This is up from a 54.9 reading at the end of the fourth
quarter of 2009 and a 52.4 reading at the end of the third. Any reading above 50.0 suggests
growth, whereas a reading below 50.0 indicates contraction.
INTEREST RATES
The Federal Open Market Committee (FOMC or the “Committee”) met twice during the first
quarter of 2010, issuing two statements on their target for the federal funds rate. The federal
funds rate is the interest rate at which a commercial bank lends immediately available funds in
balances at the Federal Reserve to another commercial bank. At both meetings the FOMC
decided to keep the target for the federal funds rate unchanged at a range of 0% to 0.25%.
© Jay R. Hill, CPA, P.C. 13
During the first quarter of 2010, the Board of Governors of the Federal Reserve System
increased the discount rate to 0.75% from the previous rate of 0.5%. The move was intended
to encourage financial institutions to rely more on money markets rather than the central bank
for short‐term liquidity needs. The discount rate is the interest rate a commercial bank is
charged to borrow funds, typically for a short period, directly from a Federal Reserve Bank. The
board of directors of each Reserve Bank establishes the discount rate every 14 days, subject to
the approval of the Board of Governors.
UNEMPLOYMENT AND PERSONAL INCOME
The U.S. Department of Labor reported that unemployment averaged 9.7% during the first
quarter, down from 10.0% in the previous quarter. At the start of the recession in December
2007, the unemployment rate was 5.0%.
ECONOMIC OUTLOOK The economy has now grown for three consecutive quarters, indicating a steady, though
modest, recovery. This quarter’s GDP grew at a rate of 3.2%, down from a rate of 5.6% in the
previous quarter. The decreasing rate was somewhat expected, as the federal government’s
stimulus policies peaked last quarter and state and local governments cut back on spending in
the face of a budget crises.
Despite the growth, some economists remain leery. “It's a recovery, but by any standard it's
still a muted recovery,” said Diane Swonk, chief economist at Mesirow Financial in Chicago. “At
the end of the day, none of this really matters unless we can get the employment machine
going, which is coming, but very slowly.”
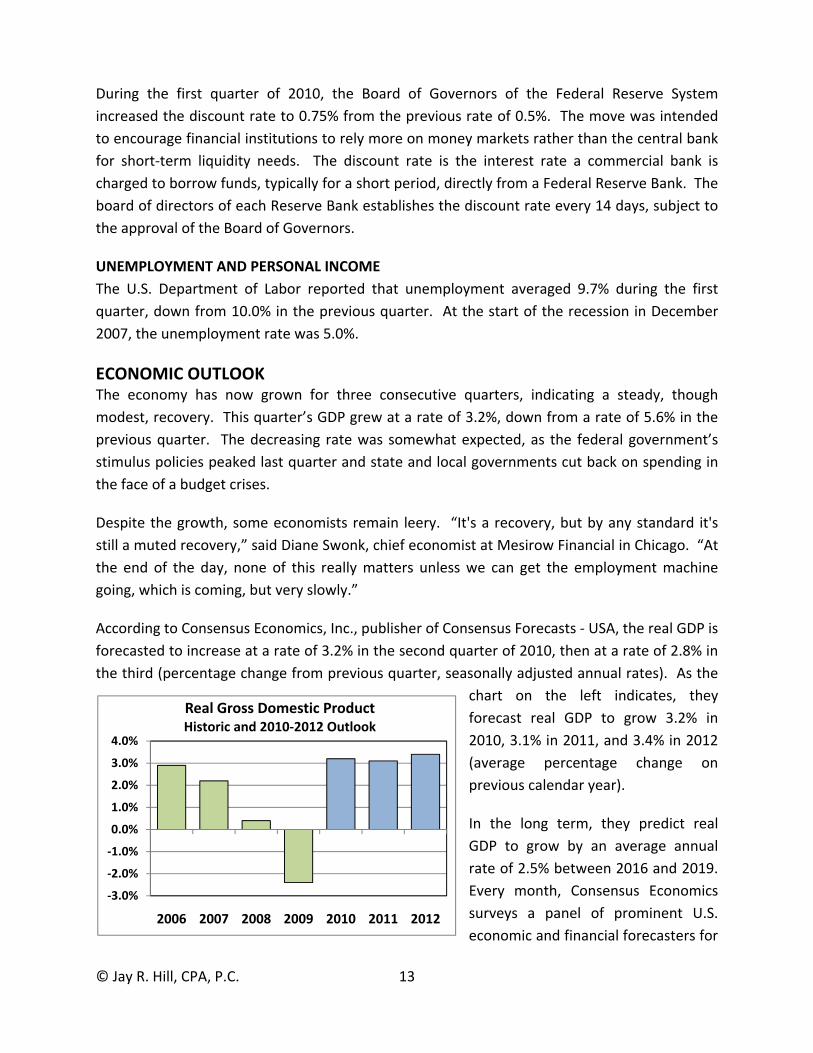
According to Consensus Economics, Inc., publisher of Consensus Forecasts ‐ USA, the real GDP is
forecasted to increase at a rate of 3.2% in the second quarter of 2010, then at a rate of 2.8% in
the third (percentage change from previous quarter, seasonally adjusted annual rates). As the
chart on the left indicates, they
forecast real GDP to grow 3.2% in
2010, 3.1% in 2011, and 3.4% in 2012
(average percentage change on
previous calendar year).
In the long term, they predict real
GDP to grow by an average annual
rate of 2.5% between 2016 and 2019.
Every month, Consensus Economics
surveys a panel of prominent U.S.
economic and financial forecasters for
‐3.0%
‐2.0%
‐1.0%
0.0%
1.0%
2.0%
3.0%
4.0%
2006 2007 2008 2009 2010 2011 2012
Real Gross Domestic ProductHistoric and 2010‐2012 Outlook
© Jay R. Hill, CPA, P.C. 14
their predictions on a range of variables including future growth, inflation, current account and
budget balances, and interest rates.
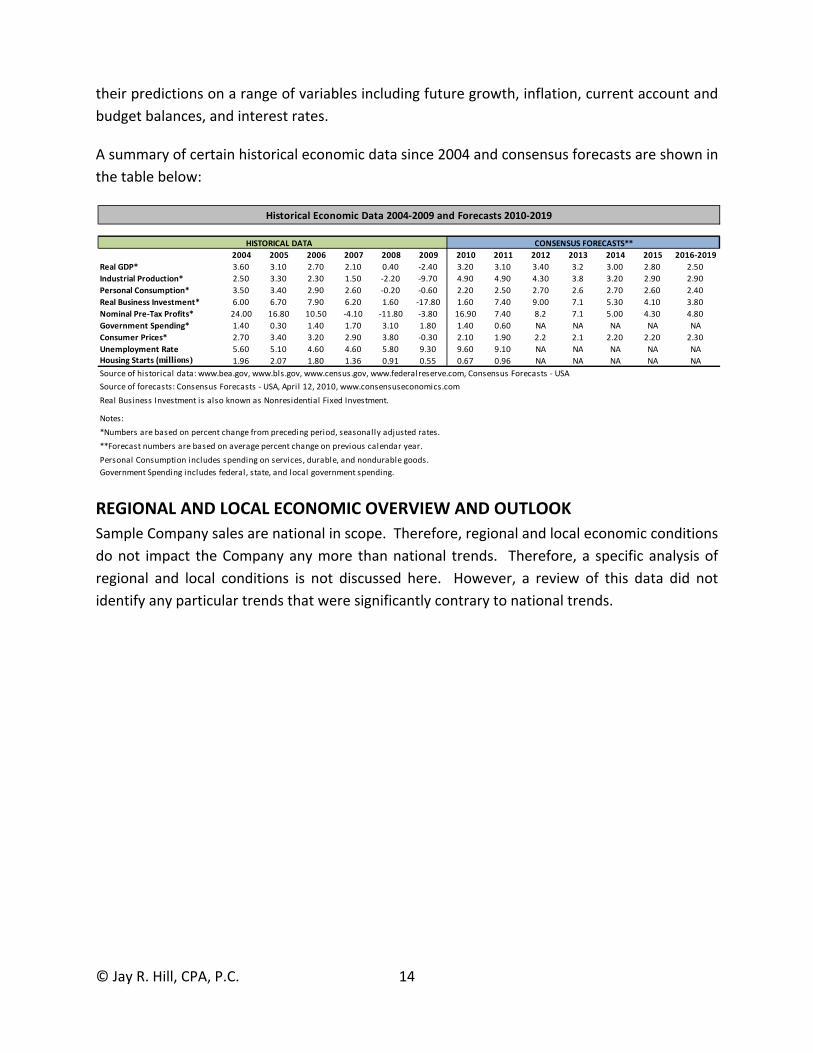
A summary of certain historical economic data since 2004 and consensus forecasts are shown in
the table below:
REGIONAL AND LOCAL ECONOMIC OVERVIEW AND OUTLOOK
Sample Company sales are national in scope. Therefore, regional and local economic conditions
do not impact the Company any more than national trends. Therefore, a specific analysis of
regional and local conditions is not discussed here. However, a review of this data did not
identify any particular trends that were significantly contrary to national trends.
Historical Economic Data 2004‐2009 and Forecasts 2010‐2019
HISTORICAL DATA CONSENSUS FORECASTS**
2004 2005 2006 2007 2008 2009 2010 2011 2012 2013 2014 2015 2016‐2019
Real GDP* 3.60 3.10 2.70 2.10 0.40 ‐2.40 3.20 3.10 3.40 3.2 3.00 2.80 2.50
Industrial Production* 2.50 3.30 2.30 1.50 ‐2.20 ‐9.70 4.90 4.90 4.30 3.8 3.20 2.90 2.90
Personal Consumption* 3.50 3.40 2.90 2.60 ‐0.20 ‐0.60 2.20 2.50 2.70 2.6 2.70 2.60 2.40
Real Business Investment* 6.00 6.70 7.90 6.20 1.60 ‐17.80 1.60 7.40 9.00 7.1 5.30 4.10 3.80
Nominal Pre‐Tax Profits* 24.00 16.80 10.50 ‐4.10 ‐11.80 ‐3.80 16.90 7.40 8.2 7.1 5.00 4.30 4.80
Government Spending* 1.40 0.30 1.40 1.70 3.10 1.80 1.40 0.60 NA NA NA NA NA
Consumer Prices* 2.70 3.40 3.20 2.90 3.80 ‐0.30 2.10 1.90 2.2 2.1 2.20 2.20 2.30
Unemployment Rate 5.60 5.10 4.60 4.60 5.80 9.30 9.60 9.10 NA NA NA NA NAHousing Starts (millions) 1.96 2.07 1.80 1.36 0.91 0.55 0.67 0.96 NA NA NA NA NA
Source of historical data: www.bea.gov, www.bls.gov, www.census.gov, www.federalreserve.com, Consensus Forecasts ‐ USA
Source of forecasts: Consensus Forecasts ‐ USA, April 12, 2010, www.consensuseconomics.com
Real Business Investment is also known as Nonresidential Fixed Investment.
Notes:
*Numbers are based on percent change from preceding period, seasonally adjusted rates.
**Forecast numbers are based on average percent change on previous calendar year.
Personal Consumption includes spending on services, durable, and nondurable goods.
Government Spending includes federal, state, and local government spending.
© Jay R. Hill, CPA, P.C. 15
INDUSTRY OVERVIEW AND OUTLOOK – AEROSPACE AND DEFENSE3
Sample Company is a manufacturer that serves the aerospace and defense industry throughout
the United States. A description of this industry and its outlook is below.
CURRENT PERFORMANCE
The aircraft, engine and parts manufacturing industry comprise both civil and military
segments. The commercial segment is sensitive to downstream demand for scheduled and
non‐scheduled air transport globally. When the financial situation is tight, people tend to
reduce spending on discretionary items, such as air travel, and substitute for other cheaper
modes of transport. Falling disposable income also undermines holiday travel as people are
more likely to stay home. In the military division, the industry is sensitive to federal funding on
defense, technology advancement in aerospace products, political developments, procurement
policies and the threat to homeland security/national security. When there is an increase in
funds allocated towards the budget for defense, there is a strong likelihood that demand for
military aerospace products will increase. When the US Government increased its defense
budget in 2002 due to the Iraq and Afghanistan war, it led to increased spending on military
equipment. Demand for US aircraft, engines and parts is also partially dependent on the value
of the US dollar; US products are more competitive globally when the dollar is weak.
AIRCRAFT ORDERS
The industry has shown an increase in both orders and deliveries since 2005, which is being
driven by improving technology and growth in smaller markets such as regional jets and very
light jets. Interestingly, there has been a divergence in recent times from the oil prices and the
level of aircraft orders and manufacturing, where traditionally higher oil prices and lower airline
profitability has reduced demand for new aircraft. Instead, demand for new aircraft has been
pushed upwards by improving technology, which has created an operating climate such that
the demand for new and more fuel efficient aircraft is, at present, positively related to
increases in the price of oil and jet fuel.
The new generation of technology is being enhanced by advances in construction techniques,
engine efficiencies, and lightweight construction materials. Airlines are now choosing to
upgrade their fleets instead of running older aircraft, as the cost benefit of purchasing new
planes now outweighs the cost of running the older aircraft with 20 year old technology.
However, during 2009, the industry has experienced a drop in orders and numerous
cancellations, blamed on poor economic conditions. At the same time, the delay in the
production of the 787 Dreamliner has reduced confidence in buyers. Orders are expected to
increase during 2010 due to a recovery in confidence.
3 Most of the parts of the industry overview and outlook section are quoted from IBISWorld Industry Market Research Reports – Tanning Salons in the US, reprinted with permission
© Jay R. Hill, CPA, P.C. 16
SMALL JETS FLYING HIGH
The last five years have seen strong growth in the small and light aircraft segment. Business
jets have increased in popularity with the growth in fractional ownership operations such as
those operated by NetJets. Fractional ownership has allowed businesses to gain access to very
light jets (VLJ) at a fraction of the cost of the aircraft by sharing the ownership of the aircraft
among many different entities. This trend has come about due to increasingly crowded airports
and the higher occurrence of delays to flights across the country. Companies such as Textron
Inc's Cessna have benefited greatly from the popularity of VLJs; their phenomenal increase in
backlog was mentioned earlier.
The growth in smaller aircraft manufacturing is expected to continue, although is under threat
by the current economic conditions and tightening of larger company's budgets. The benefits
of flying on smaller aircraft remain valid despite the current business climate, however, there
will be a drop in demand from those whose decision to adopt the VLJs was marginal to begin
with.
REVENUE IS TURBULENT
Aircraft, engine and parts manufacturing industry revenue is expected to increase at an
annualized rate of 1.1% during the five years to 2010, to $130.11 billion. Revenue per
establishment grew from $88.3 billion in 2005 to $93.2 billion in 2009, and will drop slightly to
$93 billion in 2010. This indicates that the rise in sales has been faster compared with the
increase in industry participation; industry participation has fallen due to tough operating
conditions since 2008.
INDUSTRY OUTLOOK – AEROSPACE AND DEFENSE
During the 2010 to 2015 period, industry revenue is expected to rise from $130.11 billion at
end of 2010 to $166.3 billion. This represents an annualized increase in revenue of 5.0%.
Revenue is predicted based on: an increase in air passenger traffic; increased demand resulting
from technology advances; weak US dollar and growing demand for exports; reasonable growth
in US defense budget; and the introduction of unmanned combat aerial vehicles as strike
aircraft.
The Federal Aviation Administration (FAA) stated in a 2004 report forecast that by 2015, US
commercial air carriers will transport nearly 1.1 billion passengers (up 4.3% annually) just over
1.1 trillion passenger miles (up 4.8% annually). Growth in traffic is expected to continue
especially on North Atlantic routes and in the near future Trans‐Pacific routes as airlines fight
for direct flights into China. The industry is also reliant on export sales especially in the LCA
oligopoly market which is dominated by Boeing and Airbus. Exports are likely to increase over

© Jay R. Hill, CPA, P.C. 17
the next five years, especially among developing nations that are constantly improving their air
transport infrastructure to cater to increasing air travel demand due to higher wealth.
IBISWorld believes that oil prices will range between $90 and $115 over the next five years.
The price of jet fuel is linked directly with crude oil but is more volatile as the cost of refining is
higher. While the oil price is expected to stabilize somewhat, it will remain very high over the
next five years and will add pressure to airframe and engine manufacturers for more fuel
efficient products and cause airlines to acquire larger capacity aircraft with lower fuel burn per
seat. In addition, high fuel prices will have an impact on the aircraft retirement cycle retiring
less fuel efficient types out of the market at a faster rate.
As mentioned earlier, advances in technology have increased the advantage of new aircraft
over existing aircraft to the extent that airlines are undertaking significant fleet renewal
programs. IBISWorld estimates that the fleet renewal process will continue to occur
throughout the five years to 2015, and will be a strong source of growth throughout the
industry. Worldwide GDP growth will ensure growth markets in the Asia Pacific region will
continue to aggressively expand their fleet sizes.
The Trade Weighted Index is estimated to increase at a marginal annualized rate of 0.3% over
the five years to 2015. This mean that the dollar will remain low based on a historical average,
creating a competitive advantage for US manufacturers. While some industry products such as
aircraft are less price competitive, others such as engine parts, parts and auxiliary equipment
are sold in very competitive global conditions. In addition, exports are expected to increase
significantly when Boeing's 787 "Dreamliner" is introduced to the market.
IBISWorld estimates that the US Department of Defense budget will grow at a reasonable pace
over the outlook period. Public expenditure on defense is projected to increase at 2.2% per
annum. IBISWorld believes that the majority will be attributed to systems, communications
equipment and unmanned aerial vehicles in preparation for the Future Combat System (FCS)
project (prototypes were fielded in 2008 with full scale production by 2010). US army spending
is expected to have peaked in 2008 and will decline until 2011 due to decreased supplemental
spending. Supplemental spending is in place primarily to pay for continuing military operations
in Iraq and Afghanistan.
The next wave of aircraft will be unmanned combat aerial aircraft (UAV) headed by the US army
FCS project. The US army's request for UAV procurement is expected to total $15,354.8 million
between financial years 2005 to 2011. UAV's aircraft will be used for dull, dirty and dangerous
missions although manned aircraft will still fly these missions. Helicopter sales are expected to
stabilize after consecutive years of strong growth as demand will be determined by operations
rather than war. In addition, the Federal Government in its 2007 budget has cleared funding

© Jay R. Hill, CPA, P.C. 18
for the acquisition of 183 F‐22 fighters which can extend the production line of this model until
2012.
IBISWorld forecast that profitability will increase over the five years to 2015, buoyed by new
aircraft models such as the 787 Dreamliner. The regional aircraft market is also expected to
release new designs and models in the outlook period further contributing to profitability
growth. As new aircraft come to market, they will be able to command higher margins and this
will lead to an increase in profits. Net year orders for Boeing aircraft increased from 277 in
2004 to 1028 in 2005, and 1423 in 2007. This will translate to higher revenue and profit in the
future.
Profit is likely to decrease slightly in the military sector as increasing program collaboration
between allied nations to split the risk associated with new developments (e.g. F35 ‐ Lightning
Strike II ‐ Joint Strike Fighter) will mean lower margins for companies when the manufacturing
of such products take place. The mounting US budget deficit may also reduce the potential
margins expected by prime contractors. Finally, wages as a proportion to revenue are expected
to decrease over the next five years as companies transfer operations to countries with low
labor rates to reduce operating cost and utilize greater technology to improve efficiency.
IBISWorld estimates that the number of new establishments will not change over the next five
years. During the economic recovery period, demand for aircraft, engines and parts is expected
to grow at a solid rate, encoring new entrants in the more competitive part of the market (parts
manufacturing). However, major industry players will begin to acquire smaller operators to
expand market share or force them out of business with competitive prices. The industry is
declining and market share growth is hard to come by. Some major players will also expand to
states but they are more likely to expand to developing countries in order to increase
production capacity and to lower production cost. It is anticipated that over the next five to 10
years, approximately two‐thirds of the commercial aerospace market is forecast to be outside
the United States.
Employment numbers are likely to contract over the five years to 2015, falling at 0.3% per
annum. Wage costs will be up by 0.1% on yearly basis. While labor productivity is set to
continue to grow in light of newer technology, in the coming years, the industry may face a
shortage of skilled labor as demand for workers outstrips supply. This will cause an increase in
training costs needed to bring less‐skilled workers up to the requisite level to manufacture
increasingly complex engines and avionics systems. Wages will increase to reflect supply
shortages, with the average wage set to boost from $70,398 in 2010 to $71,970 in 2015.
© Jay R. Hill, CPA, P.C. 19
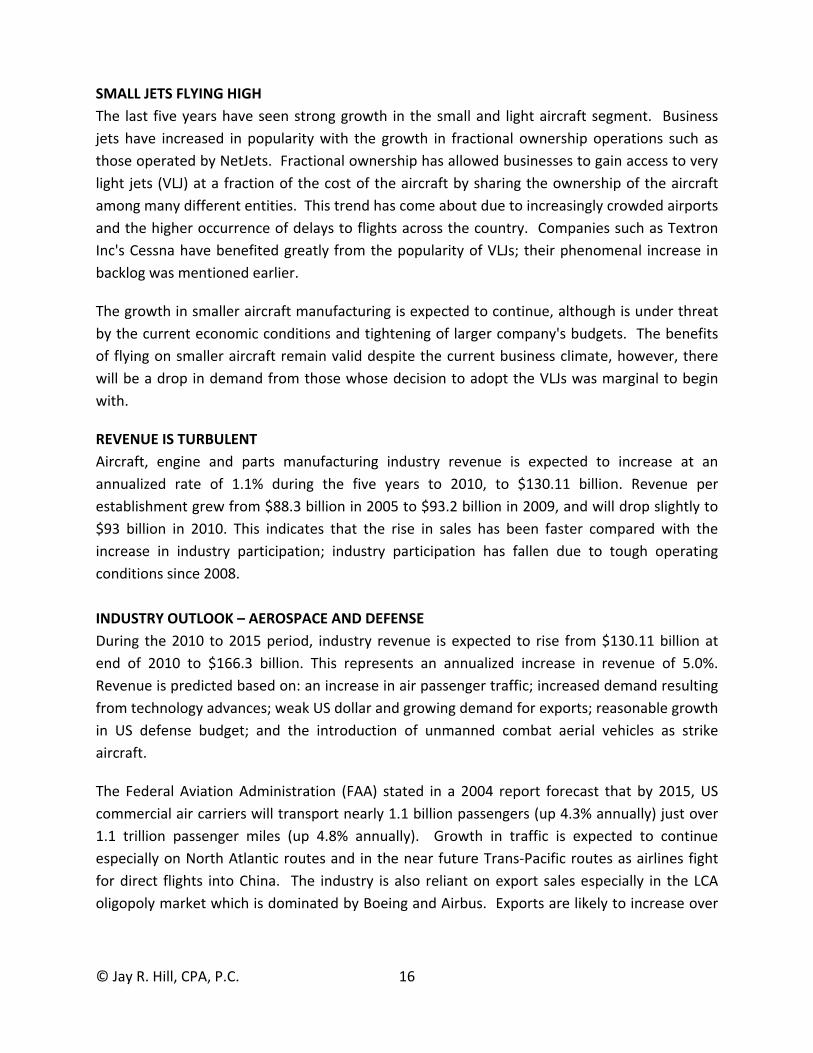
Below is a projection of revenue growth for the aircraft, engine & parts manufacturing industry
in the U.S.
IMPACT ON COMPANY
Sample Company’s revenue growth has generally mirrored the aerospace and defense industry
since 2005. Management states that the Company will likely continue to follow the trend of the
industry in the future although they do not anticipate revenues to decline in the future as is
predicted for the overall industry in 2015.
Aircraft, Engine & Parts Manufacturing in the US
Revenue Growth Projection
Year Revenue $ Million Growth %
2010 130,111.50
2011 143,515.70 10.3
2012 159,564.00 11.2
2013 173,282.20 8.6
2014 176,305.70 1.7
2015 166,320.00 ‐5.7
2016 162,352.70 ‐2.4
© Jay R. Hill, CPA, P.C. 20
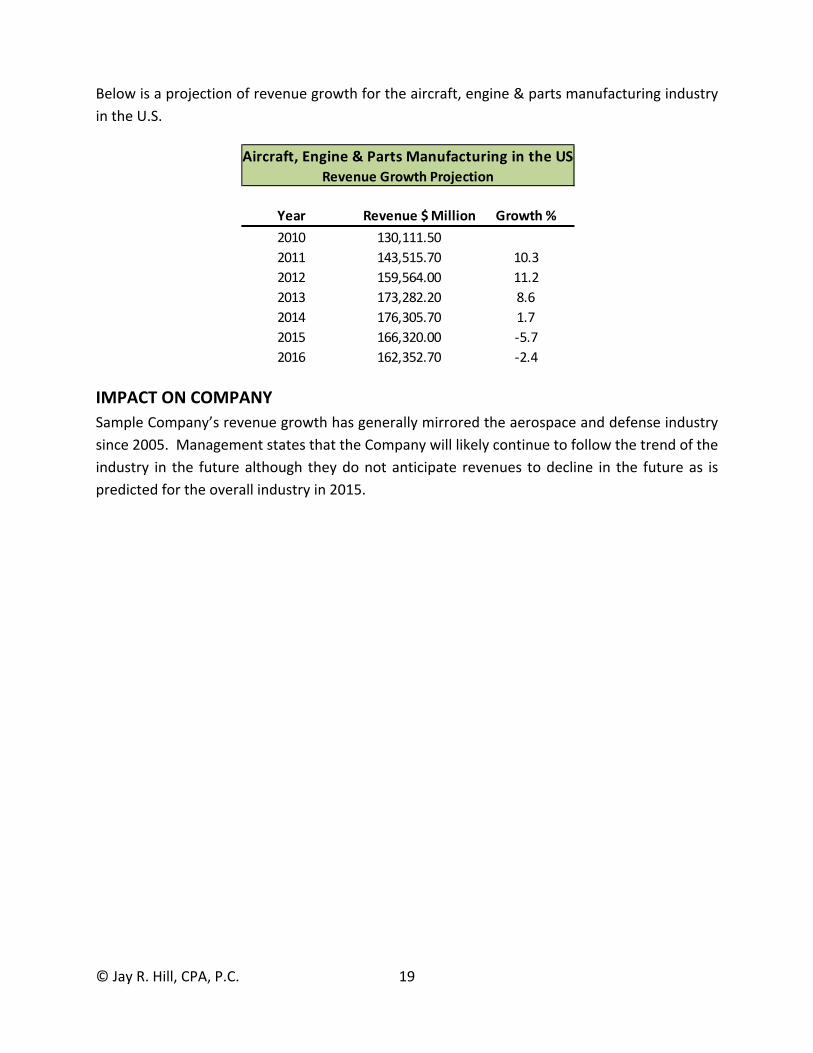
FINANCIAL STATEMENT ANALYSIS
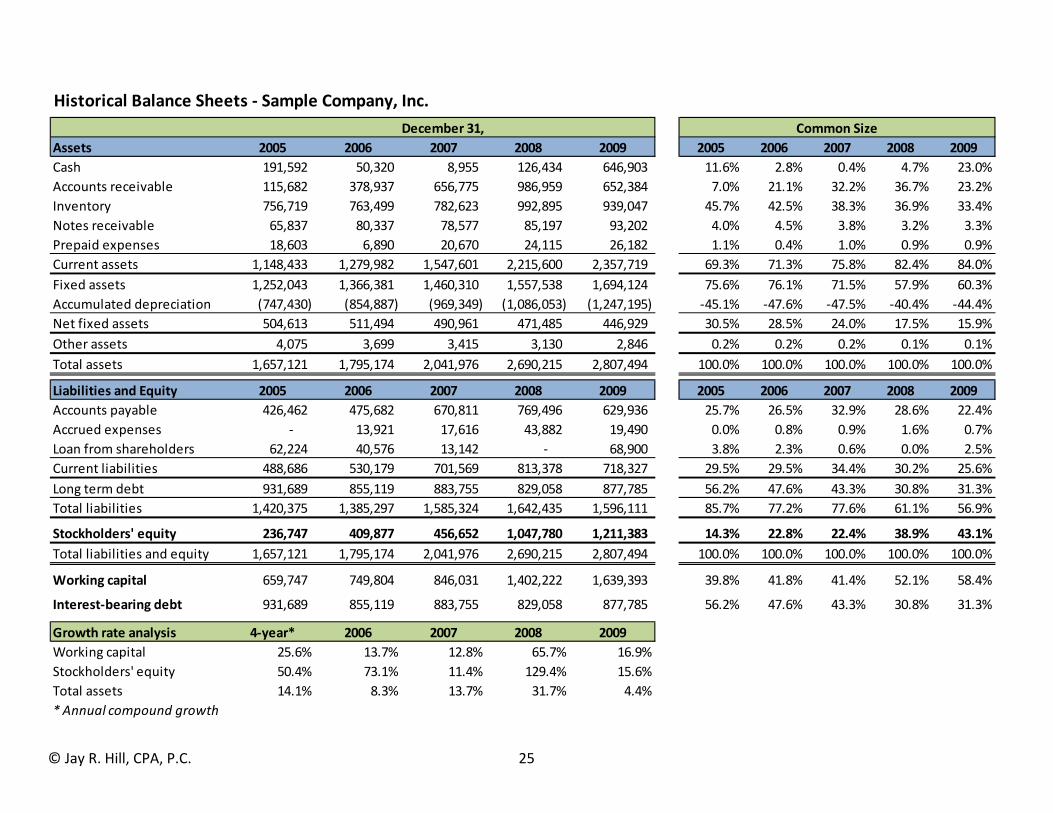
FINANCIAL POSITION OF COMPANY AND TRENDS
Historical trends normally are the best indicators of future trends. An analysis of these trends over a period of time can provide additional information on a company’s financial stability and performance. The following is an analysis of the subject company’s financial statements.
A graphical display of the pertinent balance sheet items for the last five calendar years is below:
Total Assets – Sample Company’s current financial position is solid with its debt leverage below
a ratio of 1. The Company’s primary assets are cash, accounts receivable, inventory and fixed
assets. Up to 2008, accounts receivable and inventories have increased or decreased with
sales. In 2009, accounts receivable and inventories declined despite an increase in revenue.
This was a result of bringing higher priced products into the sales mix while at the same time
the Company began working down a substantial backlog of business. Gross fixed assets have
© Jay R. Hill, CPA, P.C. 21
increased as revenue has increased but net fixed assets have remained flat as a result of
accelerated depreciation.4
Inventory – Inventory is the Company’s largest net asset category and was $939,047 at the end
of 2009. Inventory decreased in 2009 despite a decrease in revenue as the Company reduced
purchases because of the uncertainty of future orders in 2010 and 2011. Inventory turnover
remained relatively stable at about 5.7 times per year. The Company’s raw inventory of steel
and other metal products have a long shelf life that lessens the risk associated with a slower
turnover rate versus other manufacturing industries.
Working Capital – At the end of 2009, Sample Company’s working capital was a comfortable
$1.6 million. Management does not expect significant increases in working capital to support
future revenue growth.
Interest‐Bearing Debt – The Company’s long‐term debt financing increased only slightly in
2009. Management anticipates maintaining its current debt level in the foreseeable future.
Overall, the risk level is low to moderate in connection with Sample Company’s financial
position. A detailed balance sheet history is at the end of this section following the ratio
analysis.
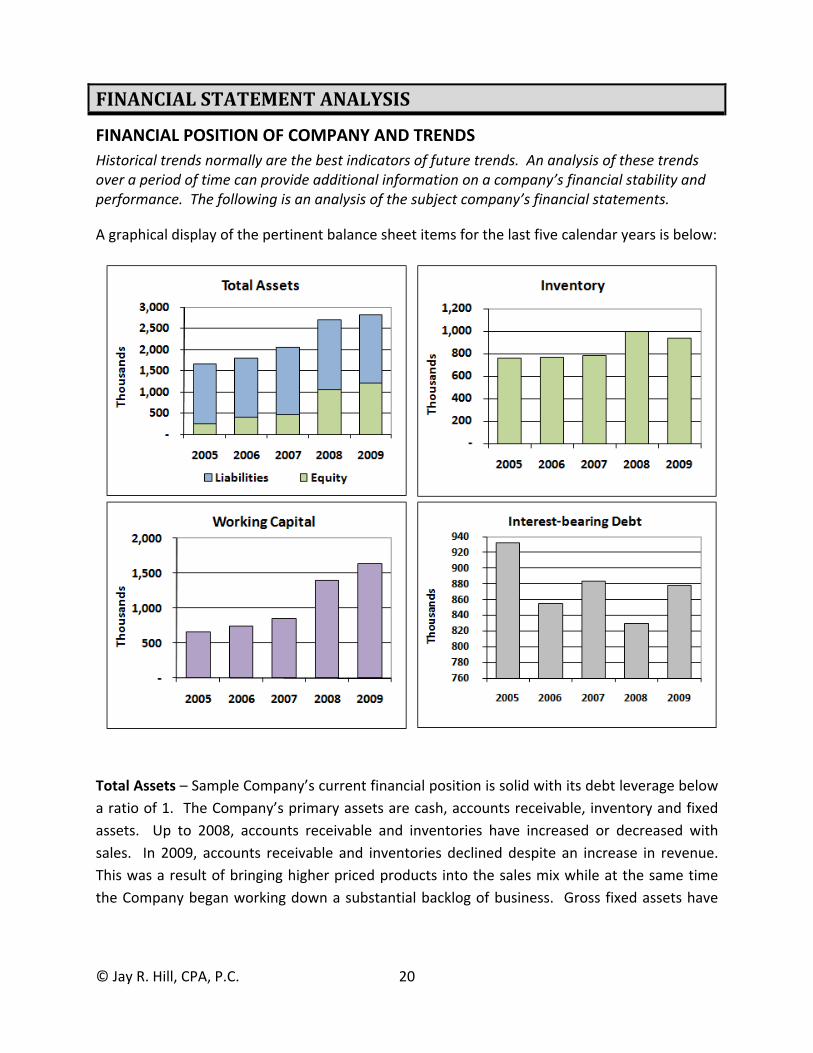
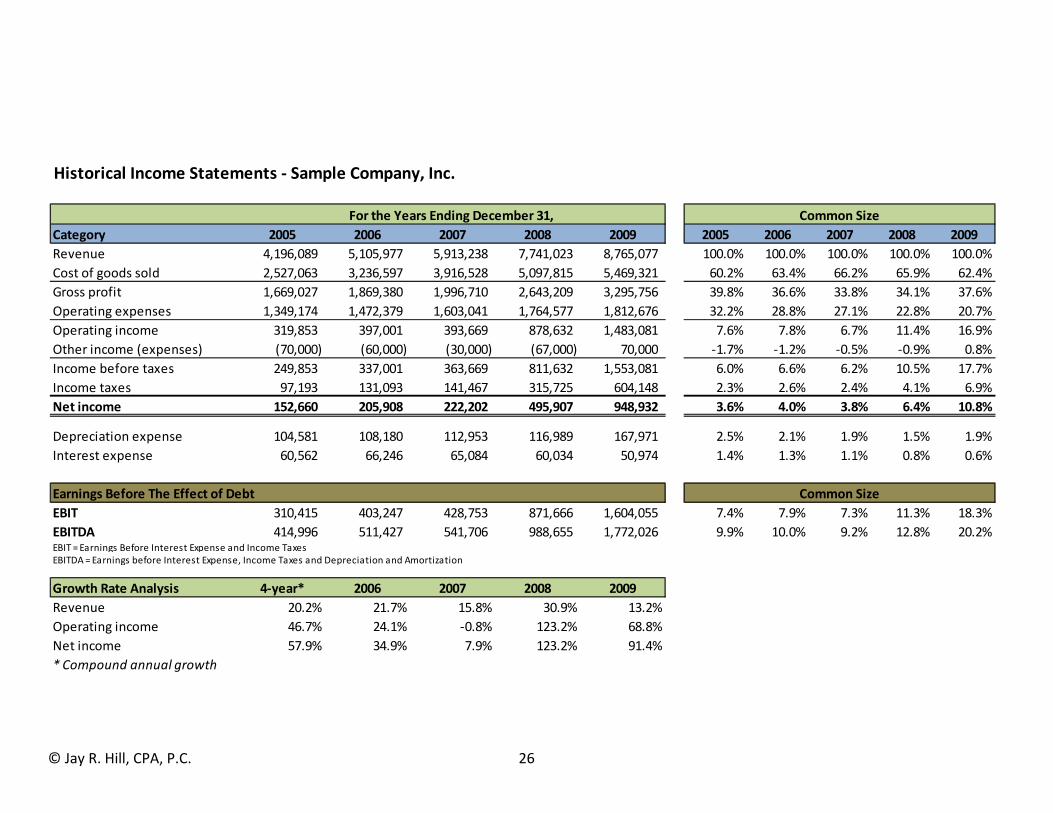
OPERATING RESULTS AND TRENDS
Adjustments to Historical Earnings
In evaluating the Company’s earnings capacity, we chose to make adjustments to the last five
years of historical operating results for trend analysis and valuation purposes as follows:
1. Sec. 179 depreciation – In each of the last five years, the Company has elected to take
accelerated Sec. 179 depreciation expense. This accelerated expense does not reflect the
economic reality of the equipment put in service. The accelerated depreciation is
recalculated on a 5 year MACRS basis.
A summary of the adjustments to the historical income statements is shown below:
4 See the section entitled “Operating Trends and Results” for a description of the adjustment for this acceleration.
Adjustments 2005 2006 2007 2008 2009
Operating expenses:
Sec 179 Depr adjustment (1) (53,926) (37,959) (32,145) (28,568) (57,910)
Total operating expenses (53,926) (37,959) (32,145) (28,568) (57,910)
© Jay R. Hill, CPA, P.C. 22
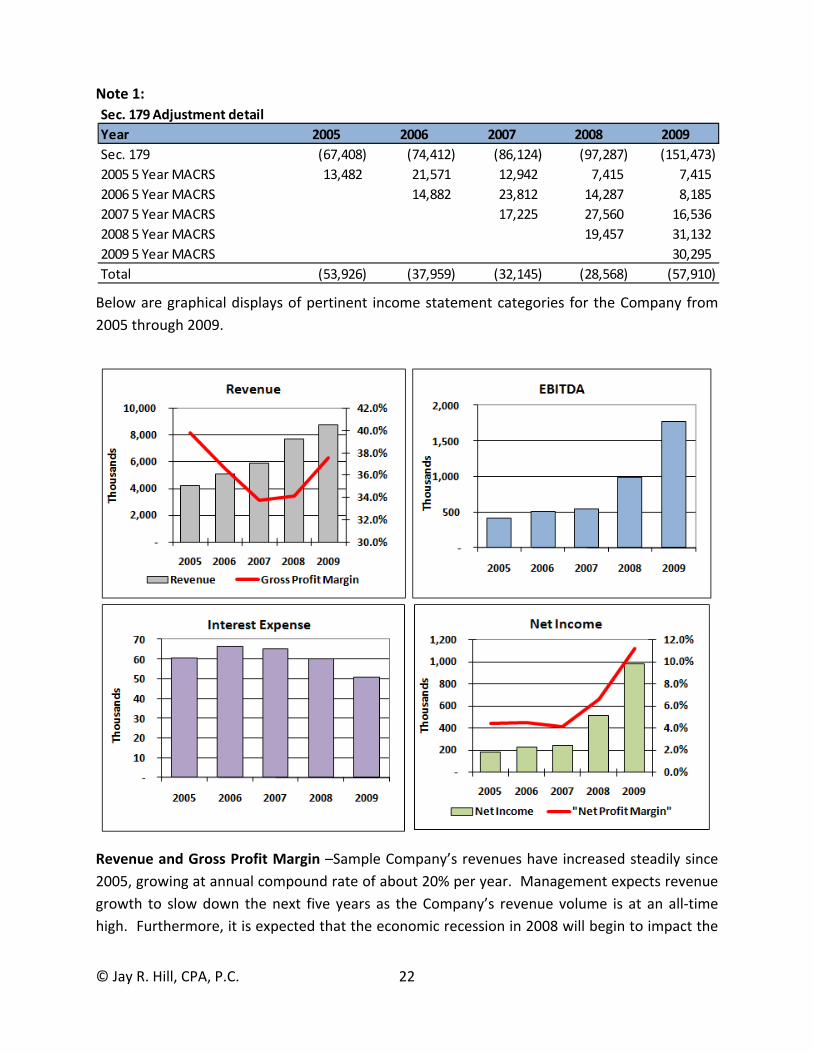
Note 1:
Below are graphical displays of pertinent income statement categories for the Company from
2005 through 2009.
Revenue and Gross Profit Margin –Sample Company’s revenues have increased steadily since
2005, growing at annual compound rate of about 20% per year. Management expects revenue
growth to slow down the next five years as the Company’s revenue volume is at an all‐time
high. Furthermore, it is expected that the economic recession in 2008 will begin to impact the
Sec. 179 Adjustment detail
Year 2005 2006 2007 2008 2009
Sec. 179 (67,408) (74,412) (86,124) (97,287) (151,473)
2005 5 Year MACRS 13,482 21,571 12,942 7,415 7,415
2006 5 Year MACRS 14,882 23,812 14,287 8,185
2007 5 Year MACRS 17,225 27,560 16,536
2008 5 Year MACRS 19,457 31,132
2009 5 Year MACRS 30,295
Total (53,926) (37,959) (32,145) (28,568) (57,910)

© Jay R. Hill, CPA, P.C. 23
aerospace industry, which has traditionally lagged behind the general economy in terms of
business cycles. The Company’s gross profit margin improved in 2009 as the Company’s
product mix included higher margin products.
Interest Expense – Interest expense is decreasing as interest rates have dropped. Interest
expense should remain relatively level as management anticipates its debt levels to remain
static along with rates.
EBITDA and Net Income – EBITDA (Earnings before interest expense, income taxes,
depreciation and amortization) and net income have increased along with revenues. Net profit
margins have also improved like gross profit margins. However, management is anticipating
profit margins to stabilize in 2010 as it does not anticipate its product mix to change
significantly from 2009.
Overall, the positive revenue and profit performance results in a low risk assessment of this
investment. Detailed historical balance sheets and income statements are shown at the end of
this section.
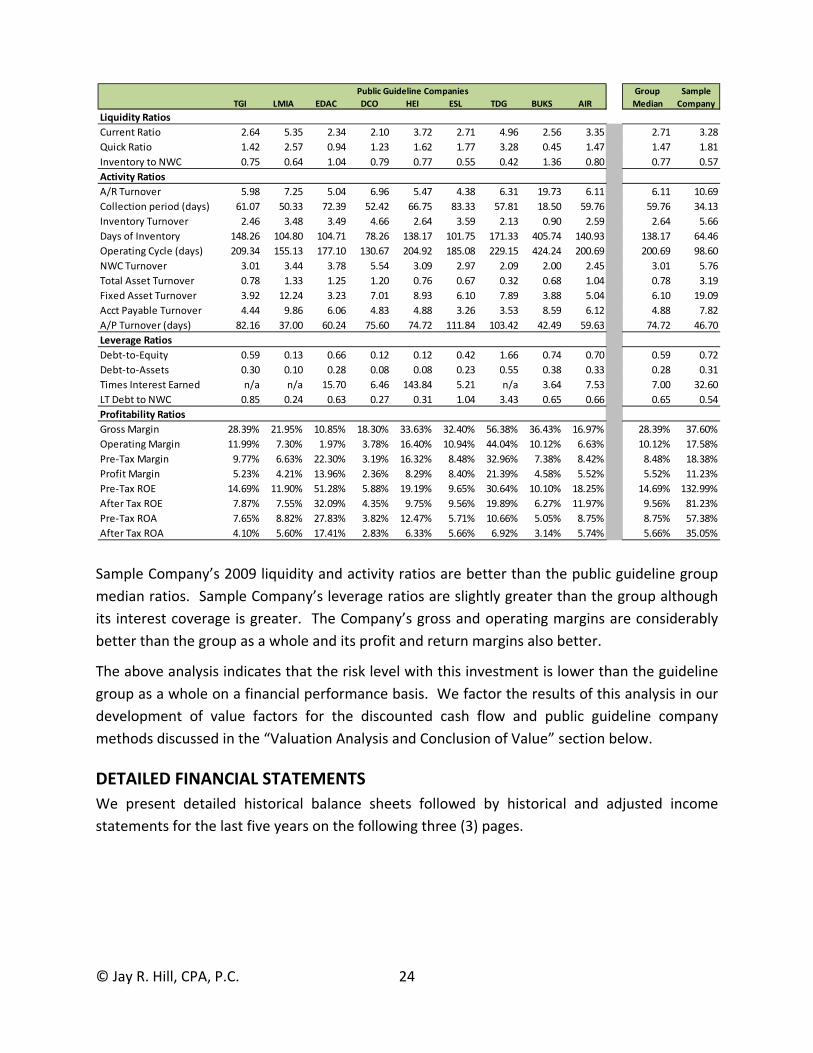
RATIO ANALYSIS
A ratio analysis of a company can lend further insight to the financial health of the company
and identify trends. Below is a ratio analysis of Sample Company in comparison to the group of
public companies that we are using as a benchmark to develop value factors applicable to the
subject company in the Public Guideline Company method.
© Jay R. Hill, CPA, P.C. 24
Sample Company’s 2009 liquidity and activity ratios are better than the public guideline group
median ratios. Sample Company’s leverage ratios are slightly greater than the group although
its interest coverage is greater. The Company’s gross and operating margins are considerably
better than the group as a whole and its profit and return margins also better.
The above analysis indicates that the risk level with this investment is lower than the guideline
group as a whole on a financial performance basis. We factor the results of this analysis in our
development of value factors for the discounted cash flow and public guideline company
methods discussed in the “Valuation Analysis and Conclusion of Value” section below.
DETAILED FINANCIAL STATEMENTS
We present detailed historical balance sheets followed by historical and adjusted income
statements for the last five years on the following three (3) pages.
Public Guideline Companies Group Sample
TGI LMIA EDAC DCO HEI ESL TDG BUKS AIR Median Company
Liquidity Ratios
Current Ratio 2.64 5.35 2.34 2.10 3.72 2.71 4.96 2.56 3.35 2.71 3.28
Quick Ratio 1.42 2.57 0.94 1.23 1.62 1.77 3.28 0.45 1.47 1.47 1.81
Inventory to NWC 0.75 0.64 1.04 0.79 0.77 0.55 0.42 1.36 0.80 0.77 0.57
Activity Ratios
A/R Turnover 5.98 7.25 5.04 6.96 5.47 4.38 6.31 19.73 6.11 6.11 10.69
Collection period (days) 61.07 50.33 72.39 52.42 66.75 83.33 57.81 18.50 59.76 59.76 34.13
Inventory Turnover 2.46 3.48 3.49 4.66 2.64 3.59 2.13 0.90 2.59 2.64 5.66
Days of Inventory 148.26 104.80 104.71 78.26 138.17 101.75 171.33 405.74 140.93 138.17 64.46
Operating Cycle (days) 209.34 155.13 177.10 130.67 204.92 185.08 229.15 424.24 200.69 200.69 98.60
NWC Turnover 3.01 3.44 3.78 5.54 3.09 2.97 2.09 2.00 2.45 3.01 5.76
Total Asset Turnover 0.78 1.33 1.25 1.20 0.76 0.67 0.32 0.68 1.04 0.78 3.19
Fixed Asset Turnover 3.92 12.24 3.23 7.01 8.93 6.10 7.89 3.88 5.04 6.10 19.09
Acct Payable Turnover 4.44 9.86 6.06 4.83 4.88 3.26 3.53 8.59 6.12 4.88 7.82
A/P Turnover (days) 82.16 37.00 60.24 75.60 74.72 111.84 103.42 42.49 59.63 74.72 46.70
Leverage Ratios
Debt‐to‐Equity 0.59 0.13 0.66 0.12 0.12 0.42 1.66 0.74 0.70 0.59 0.72
Debt‐to‐Assets 0.30 0.10 0.28 0.08 0.08 0.23 0.55 0.38 0.33 0.28 0.31
Times Interest Earned n/a n/a 15.70 6.46 143.84 5.21 n/a 3.64 7.53 7.00 32.60
LT Debt to NWC 0.85 0.24 0.63 0.27 0.31 1.04 3.43 0.65 0.66 0.65 0.54
Profitability Ratios
Gross Margin 28.39% 21.95% 10.85% 18.30% 33.63% 32.40% 56.38% 36.43% 16.97% 28.39% 37.60%
Operating Margin 11.99% 7.30% 1.97% 3.78% 16.40% 10.94% 44.04% 10.12% 6.63% 10.12% 17.58%
Pre‐Tax Margin 9.77% 6.63% 22.30% 3.19% 16.32% 8.48% 32.96% 7.38% 8.42% 8.48% 18.38%
Profit Margin 5.23% 4.21% 13.96% 2.36% 8.29% 8.40% 21.39% 4.58% 5.52% 5.52% 11.23%
Pre‐Tax ROE 14.69% 11.90% 51.28% 5.88% 19.19% 9.65% 30.64% 10.10% 18.25% 14.69% 132.99%
After Tax ROE 7.87% 7.55% 32.09% 4.35% 9.75% 9.56% 19.89% 6.27% 11.97% 9.56% 81.23%
Pre‐Tax ROA 7.65% 8.82% 27.83% 3.82% 12.47% 5.71% 10.66% 5.05% 8.75% 8.75% 57.38%
After Tax ROA 4.10% 5.60% 17.41% 2.83% 6.33% 5.66% 6.92% 3.14% 5.74% 5.66% 35.05%
© Jay R. Hill, CPA, P.C. 25
Historical Balance Sheets ‐ Sample Company, Inc.
December 31, Common Size
Assets 2005 2006 2007 2008 2009 2005 2006 2007 2008 2009
Cash 191,592 50,320 8,955 126,434 646,903 11.6% 2.8% 0.4% 4.7% 23.0%
Accounts receivable 115,682 378,937 656,775 986,959 652,384 7.0% 21.1% 32.2% 36.7% 23.2%
Inventory 756,719 763,499 782,623 992,895 939,047 45.7% 42.5% 38.3% 36.9% 33.4%
Notes receivable 65,837 80,337 78,577 85,197 93,202 4.0% 4.5% 3.8% 3.2% 3.3%
Prepaid expenses 18,603 6,890 20,670 24,115 26,182 1.1% 0.4% 1.0% 0.9% 0.9%
Current assets 1,148,433 1,279,982 1,547,601 2,215,600 2,357,719 69.3% 71.3% 75.8% 82.4% 84.0%
Fixed assets 1,252,043 1,366,381 1,460,310 1,557,538 1,694,124 75.6% 76.1% 71.5% 57.9% 60.3%
Accumulated depreciation (747,430) (854,887) (969,349) (1,086,053) (1,247,195) ‐45.1% ‐47.6% ‐47.5% ‐40.4% ‐44.4%
Net fixed assets 504,613 511,494 490,961 471,485 446,929 30.5% 28.5% 24.0% 17.5% 15.9%
Other assets 4,075 3,699 3,415 3,130 2,846 0.2% 0.2% 0.2% 0.1% 0.1%
Total assets 1,657,121 1,795,174 2,041,976 2,690,215 2,807,494 100.0% 100.0% 100.0% 100.0% 100.0%
Liabilities and Equity 2005 2006 2007 2008 2009 2005 2006 2007 2008 2009
Accounts payable 426,462 475,682 670,811 769,496 629,936 25.7% 26.5% 32.9% 28.6% 22.4%
Accrued expenses ‐ 13,921 17,616 43,882 19,490 0.0% 0.8% 0.9% 1.6% 0.7%
Loan from shareholders 62,224 40,576 13,142 ‐ 68,900 3.8% 2.3% 0.6% 0.0% 2.5%
Current liabilities 488,686 530,179 701,569 813,378 718,327 29.5% 29.5% 34.4% 30.2% 25.6%
Long term debt 931,689 855,119 883,755 829,058 877,785 56.2% 47.6% 43.3% 30.8% 31.3%
Total liabilities 1,420,375 1,385,297 1,585,324 1,642,435 1,596,111 85.7% 77.2% 77.6% 61.1% 56.9%
Stockholders' equity 236,747 409,877 456,652 1,047,780 1,211,383 14.3% 22.8% 22.4% 38.9% 43.1%
Total liabilities and equity 1,657,121 1,795,174 2,041,976 2,690,215 2,807,494 100.0% 100.0% 100.0% 100.0% 100.0%
Working capital 659,747 749,804 846,031 1,402,222 1,639,393 39.8% 41.8% 41.4% 52.1% 58.4%
Interest‐bearing debt 931,689 855,119 883,755 829,058 877,785 56.2% 47.6% 43.3% 30.8% 31.3%
Growth rate analysis 4‐year* 2006 2007 2008 2009
Working capital 25.6% 13.7% 12.8% 65.7% 16.9%
Stockholders' equity 50.4% 73.1% 11.4% 129.4% 15.6%
Total assets 14.1% 8.3% 13.7% 31.7% 4.4%
* Annual compound growth
© Jay R. Hill, CPA, P.C. 26
Historical Income Statements ‐ Sample Company, Inc.
For the Years Ending December 31, Common Size
Category 2005 2006 2007 2008 2009 2005 2006 2007 2008 2009
Revenue 4,196,089 5,105,977 5,913,238 7,741,023 8,765,077 100.0% 100.0% 100.0% 100.0% 100.0%
Cost of goods sold 2,527,063 3,236,597 3,916,528 5,097,815 5,469,321 60.2% 63.4% 66.2% 65.9% 62.4%
Gross profit 1,669,027 1,869,380 1,996,710 2,643,209 3,295,756 39.8% 36.6% 33.8% 34.1% 37.6%
Operating expenses 1,349,174 1,472,379 1,603,041 1,764,577 1,812,676 32.2% 28.8% 27.1% 22.8% 20.7%
Operating income 319,853 397,001 393,669 878,632 1,483,081 7.6% 7.8% 6.7% 11.4% 16.9%
Other income (expenses) (70,000) (60,000) (30,000) (67,000) 70,000 ‐1.7% ‐1.2% ‐0.5% ‐0.9% 0.8%
Income before taxes 249,853 337,001 363,669 811,632 1,553,081 6.0% 6.6% 6.2% 10.5% 17.7%
Income taxes 97,193 131,093 141,467 315,725 604,148 2.3% 2.6% 2.4% 4.1% 6.9%
Net income 152,660 205,908 222,202 495,907 948,932 3.6% 4.0% 3.8% 6.4% 10.8%
Depreciation expense 104,581 108,180 112,953 116,989 167,971 2.5% 2.1% 1.9% 1.5% 1.9%
Interest expense 60,562 66,246 65,084 60,034 50,974 1.4% 1.3% 1.1% 0.8% 0.6%
Earnings Before The Effect of Debt Common Size
EBIT 310,415 403,247 428,753 871,666 1,604,055 7.4% 7.9% 7.3% 11.3% 18.3%
EBITDA 414,996 511,427 541,706 988,655 1,772,026 9.9% 10.0% 9.2% 12.8% 20.2%EBIT = Earnings Before Interest Expense and Income TaxesEBITDA = Earnings before Interest Expense, Income Taxes and Depreciation and Amortization
Growth Rate Analysis 4‐year* 2006 2007 2008 2009
Revenue 20.2% 21.7% 15.8% 30.9% 13.2%
Operating income 46.7% 24.1% ‐0.8% 123.2% 68.8%
Net income 57.9% 34.9% 7.9% 123.2% 91.4%
* Compound annual growth
© Jay R. Hill, CPA, P.C. 27
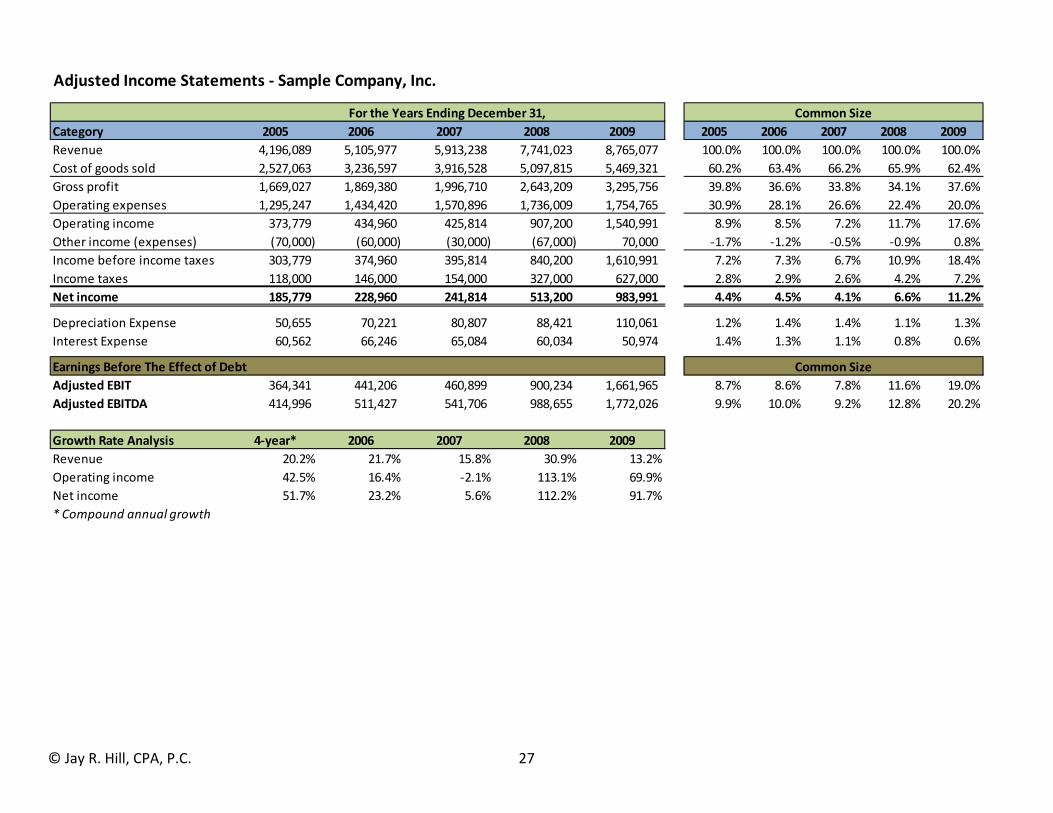
Adjusted Income Statements ‐ Sample Company, Inc.
For the Years Ending December 31, Common Size
Category 2005 2006 2007 2008 2009 2005 2006 2007 2008 2009
Revenue 4,196,089 5,105,977 5,913,238 7,741,023 8,765,077 100.0% 100.0% 100.0% 100.0% 100.0%
Cost of goods sold 2,527,063 3,236,597 3,916,528 5,097,815 5,469,321 60.2% 63.4% 66.2% 65.9% 62.4%
Gross profit 1,669,027 1,869,380 1,996,710 2,643,209 3,295,756 39.8% 36.6% 33.8% 34.1% 37.6%
Operating expenses 1,295,247 1,434,420 1,570,896 1,736,009 1,754,765 30.9% 28.1% 26.6% 22.4% 20.0%
Operating income 373,779 434,960 425,814 907,200 1,540,991 8.9% 8.5% 7.2% 11.7% 17.6%
Other income (expenses) (70,000) (60,000) (30,000) (67,000) 70,000 ‐1.7% ‐1.2% ‐0.5% ‐0.9% 0.8%
Income before income taxes 303,779 374,960 395,814 840,200 1,610,991 7.2% 7.3% 6.7% 10.9% 18.4%
Income taxes 118,000 146,000 154,000 327,000 627,000 2.8% 2.9% 2.6% 4.2% 7.2%
Net income 185,779 228,960 241,814 513,200 983,991 4.4% 4.5% 4.1% 6.6% 11.2%
Depreciation Expense 50,655 70,221 80,807 88,421 110,061 1.2% 1.4% 1.4% 1.1% 1.3%
Interest Expense 60,562 66,246 65,084 60,034 50,974 1.4% 1.3% 1.1% 0.8% 0.6%
Earnings Before The Effect of Debt Common Size
Adjusted EBIT 364,341 441,206 460,899 900,234 1,661,965 8.7% 8.6% 7.8% 11.6% 19.0%
Adjusted EBITDA 414,996 511,427 541,706 988,655 1,772,026 9.9% 10.0% 9.2% 12.8% 20.2%
Growth Rate Analysis 4‐year* 2006 2007 2008 2009
Revenue 20.2% 21.7% 15.8% 30.9% 13.2%
Operating income 42.5% 16.4% ‐2.1% 113.1% 69.9%
Net income 51.7% 23.2% 5.6% 112.2% 91.7%
* Compound annual growth
© Jay R. Hill, CPA, P.C. 28
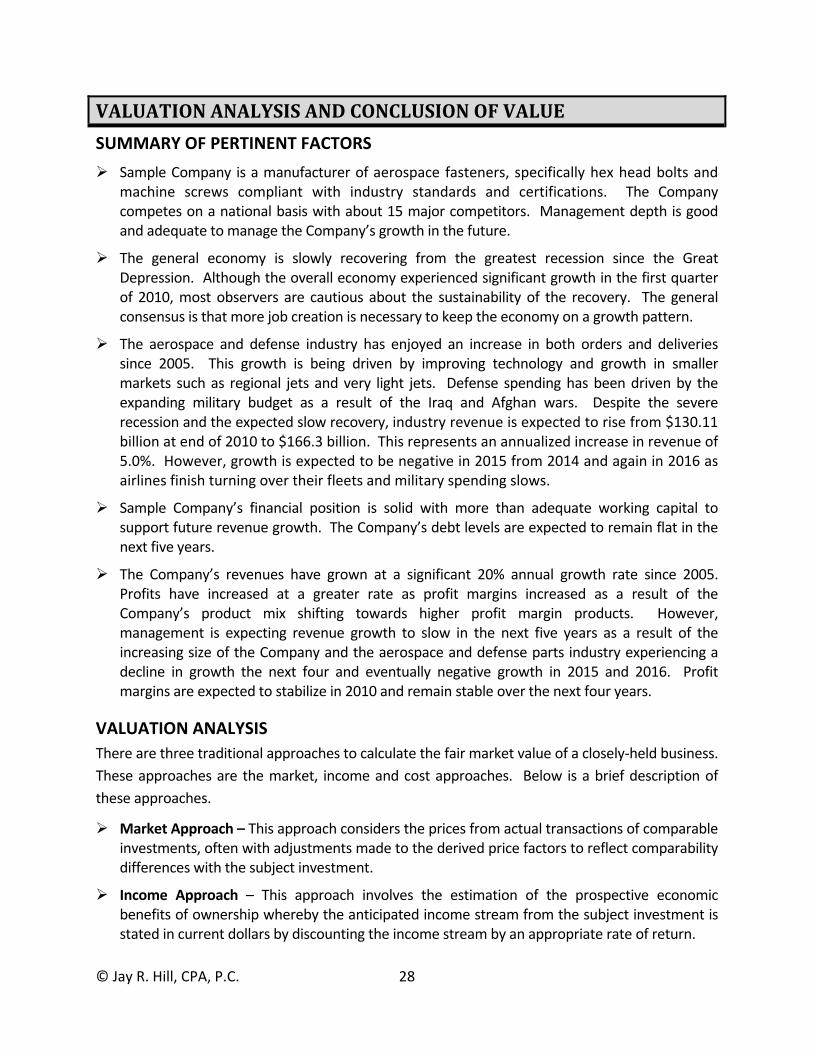
VALUATION ANALYSIS AND CONCLUSION OF VALUE
SUMMARY OF PERTINENT FACTORS
Sample Company is a manufacturer of aerospace fasteners, specifically hex head bolts and machine screws compliant with industry standards and certifications. The Company competes on a national basis with about 15 major competitors. Management depth is good and adequate to manage the Company’s growth in the future.
The general economy is slowly recovering from the greatest recession since the Great Depression. Although the overall economy experienced significant growth in the first quarter of 2010, most observers are cautious about the sustainability of the recovery. The general consensus is that more job creation is necessary to keep the economy on a growth pattern.
The aerospace and defense industry has enjoyed an increase in both orders and deliveries since 2005. This growth is being driven by improving technology and growth in smaller markets such as regional jets and very light jets. Defense spending has been driven by the expanding military budget as a result of the Iraq and Afghan wars. Despite the severe recession and the expected slow recovery, industry revenue is expected to rise from $130.11 billion at end of 2010 to $166.3 billion. This represents an annualized increase in revenue of 5.0%. However, growth is expected to be negative in 2015 from 2014 and again in 2016 as airlines finish turning over their fleets and military spending slows.
Sample Company’s financial position is solid with more than adequate working capital to support future revenue growth. The Company’s debt levels are expected to remain flat in the next five years.
The Company’s revenues have grown at a significant 20% annual growth rate since 2005. Profits have increased at a greater rate as profit margins increased as a result of the Company’s product mix shifting towards higher profit margin products. However, management is expecting revenue growth to slow in the next five years as a result of the increasing size of the Company and the aerospace and defense parts industry experiencing a decline in growth the next four and eventually negative growth in 2015 and 2016. Profit margins are expected to stabilize in 2010 and remain stable over the next four years.
VALUATION ANALYSIS
There are three traditional approaches to calculate the fair market value of a closely‐held business.
These approaches are the market, income and cost approaches. Below is a brief description of
these approaches.
Market Approach – This approach considers the prices from actual transactions of comparable investments, often with adjustments made to the derived price factors to reflect comparability differences with the subject investment.
Income Approach – This approach involves the estimation of the prospective economic benefits of ownership whereby the anticipated income stream from the subject investment is stated in current dollars by discounting the income stream by an appropriate rate of return.
© Jay R. Hill, CPA, P.C. 29
Cost Approach – This approach considers the investment necessary to reproduce or replace the subject investment adjusted for estimated depreciation and /or deterioration.
Normally, if the subject entity is an operating entity that sells a product or service, then the
most important factor to an investor is the subject entity’s earnings history and future earnings
stream. Conversely, if the subject entity is a holding entity that is holding assets for investment
purposes, then an investor’s interest is in the fair market value of the subject entity’s
underlying assets.
Sample Company is an operating company that sells products. Therefore, we use several
earnings methods under the income and market approaches to value the Company. A
summary of the methods we use to estimate the fair market value of a minority interest in
Sample Company are as follows:
Discounted Cash Flow Method Public Guideline Company Methods
o Price/earnings method o TIC/EBIT method o TIC/EBITDA method o TIC/Revenue method
Below is a further description of these methods and the resulting value estimates we derive
from our use of these methods.
VALUATION METHODS CONSIDERED BUT NOT UTILIZED
Cost or Replacement Methods: These methods estimate the value of the underlying assets of the Company based on the fair market value cost or replacement value of the assets.
Reasons for not using these methods: These methods are normally performed for a controlling interest valuation because a minority interest normally cannot force the sale of the underlying assets. Furthermore, it is difficult to measure the intangible goodwill asset of an operating company with this method since earnings of the Company have a major impact on this asset.
The Capitalized Excess Earnings Method: This method is a hybrid of the capitalization of earnings method and the net asset value method. The method involves the estimate of the fair market value of the underlying assets and the estimation of the intangible or goodwill value of the earnings in excess of the required earnings on the underlying assets. The method was promulgated in Revenue Ruling 68‐609. However, the Internal Revenue Service also stated that the method should only be used if no other method is appropriate or applicable.
Reasons for not using this method: It is our opinion more appropriate methods are available to
value the subject company.
© Jay R. Hill, CPA, P.C. 30
DISCOUNTED CASH FLOW METHOD
Frequently, a company’s historical operations provide a good indication of the future earnings
or growth rate of the business. In this instance, management is expecting sales volume and
earnings to be different from historical results. Therefore, an appropriate method to determine
the value of Sample Company is forecasting the cash flows of the Company and then
discounting these future cash flows to today’s dollars. The application of the discounted cash
flow (DCF) method requires the valuator to make several key decisions as follows:
1. The determination of the type of financial return to be forecast. 2. The determination if the selected return is one applicable to equity or invested
capital. 3. The number of years to be discretely forecast. 4. The selection of a discount rate appropriate to the type of return selected.
TYPE OF FINANCIAL RETURN TO BE FORECAST
In this instance, we select net cash flow because net cash flow is the return that may be
available to minority shareholders.
EQUITY OR INVESTED CAPITAL
We are valuing a minority equity interest so we assess the net cash flow available before
paying creditors, called invested capital, and then subtract the Company’s interest‐bearing
debt to determine an equity value for Sample Company.
NUMBER OF YEARS TO BE FORECAST
A discussion with management about the number of years it will take to stabilize revenue and
earnings growth reveals that a five‐year period of specific forecasting is appropriate.
DEVELOPMENT OF DISCOUNT RATE – WEIGHTED AVERAGE COST OF CAPITAL
We estimate the appropriate present value discount rate for Central’s projected cash flows by
analyzing the Company’s weighted average cost of capital (WACC). The WACC combines the
present cost of the Sample’s debt capital and equity capital as determined from market‐derived
empirical evidence. The debt and equity costs, expressed as rates of return, are weighted
according to the capital structure of Sample Company as a minority shareholder can not
influence the capital structure of the Company.
DEBT RATE
We estimate the cost of Sample’s debt capital by reviewing the Company’s current debt
interest rates. The average rate is about 8%. Corporate interest expense is tax deductible,
therefore, we use the after‐tax cost of debt or 4.9% (.08 x [1 – 0.389]).
© Jay R. Hill, CPA, P.C. 31
EQUITY DISCOUNT RATE ‐ MODIFIED CAPM
We use the Modified Capital Asset Pricing Model (CAPM) to derive a rate of return or discount
rate to apply to the future net cash flow estimates of Sample Company’s operations. The CAPM
model is one of the primary aspects of the modern capital market theory. The model quantifies
the return an investor requires to invest in securities that bear the risk of failure to pay a return
on such investment or even a complete loss as opposed to the “guaranteed” or “risk‐free”
return on a U.S. treasury security. The additional return that an investor requires above the
risk‐free return is known as a “premium”. The pure CAPM model formula determines the
required return by summing the risk‐free rate and the additional return required by investors in
the market as a whole (known as systematic risk) adjusted for volatility of the price of the
particular security know as Beta as follows:
Required Return = rf + ß(rm ‐ rf)
Where: rf = risk‐free rate of return ß = Beta or volatility of the security rm = equity market return (rm ‐ rf) is referred to as the equity market risk premium
To value this closely‐held security, we modify the CAPM model to incorporate two other factors
as follows:
Size premium – Empirical studies indicate that investors require an additional return or premium purely based on the size of the underlying company of the subject stock. The smaller the company in terms of assets and revenues, the greater the required return.
Specific company or idiosyncratic risk – This is the additional return or reduction in return that an investor requires because of the specific company factors that separate the subject stock from the market and specific industry as a whole.
The Modified CAPM Model is as follows:
Required Return = rf + ß(rm ‐ rf) + rsize+/‐ Alpha
Where: rf = risk‐free rate of return ß = Beta or volatility of the security rm = equity market return rsize = additional return for smaller companies Alpha = specific company risk factors
We derive the applicable discount rate using the Modified CAPM Model for Sample Company
below:
© Jay R. Hill, CPA, P.C. 32
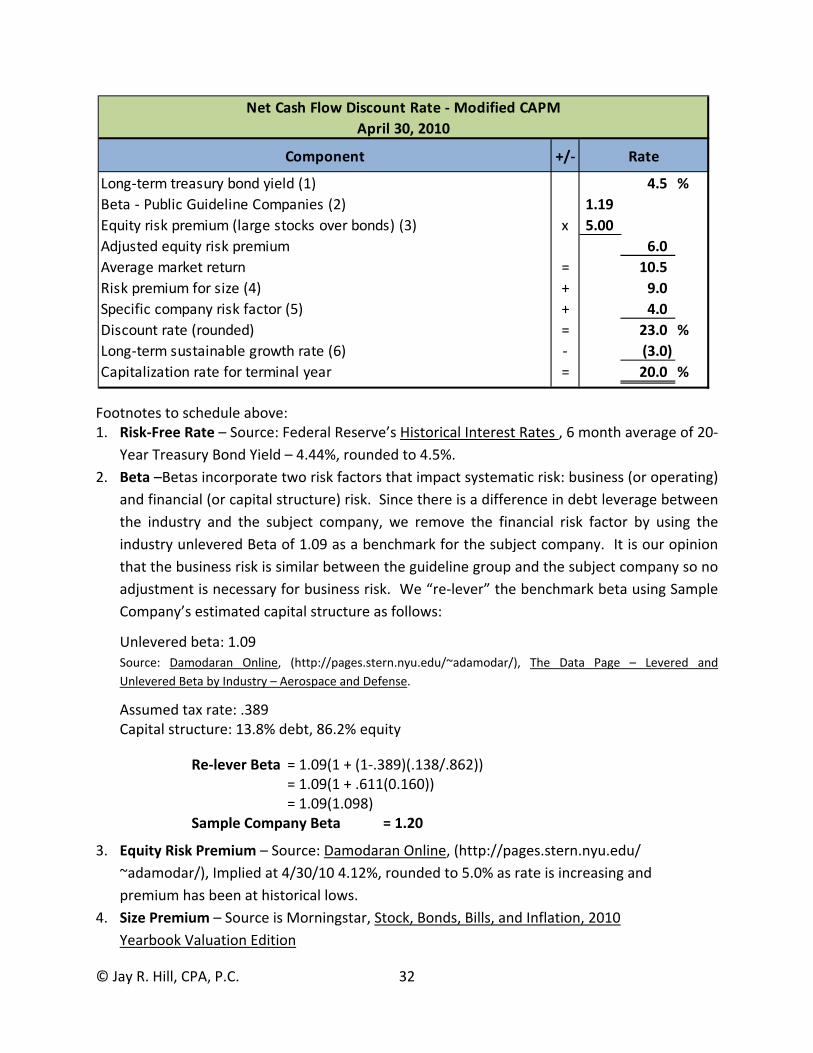
Footnotes to schedule above: 1. Risk‐Free Rate – Source: Federal Reserve’s Historical Interest Rates , 6 month average of 20‐
Year Treasury Bond Yield – 4.44%, rounded to 4.5%.
2. Beta –Betas incorporate two risk factors that impact systematic risk: business (or operating)
and financial (or capital structure) risk. Since there is a difference in debt leverage between
the industry and the subject company, we remove the financial risk factor by using the
industry unlevered Beta of 1.09 as a benchmark for the subject company. It is our opinion
that the business risk is similar between the guideline group and the subject company so no
adjustment is necessary for business risk. We “re‐lever” the benchmark beta using Sample
Company’s estimated capital structure as follows:
Unlevered beta: 1.09 Source: Damodaran Online, (http://pages.stern.nyu.edu/~adamodar/), The Data Page – Levered and
Unlevered Beta by Industry – Aerospace and Defense.
Assumed tax rate: .389 Capital structure: 13.8% debt, 86.2% equity
Re‐lever Beta = 1.09(1 + (1‐.389)(.138/.862)) = 1.09(1 + .611(0.160)) = 1.09(1.098) Sample Company Beta = 1.20
3. Equity Risk Premium – Source: Damodaran Online, (http://pages.stern.nyu.edu/
~adamodar/), Implied at 4/30/10 4.12%, rounded to 5.0% as rate is increasing and
premium has been at historical lows.
4. Size Premium – Source is Morningstar, Stock, Bonds, Bills, and Inflation, 2010
Yearbook Valuation Edition
Net Cash Flow Discount Rate ‐ Modified CAPM
April 30, 2010
Component +/‐ Rate
Long‐term treasury bond yield (1) 4.5 %
Beta ‐ Public Guideline Companies (2) 1.19
Equity risk premium (large stocks over bonds) (3) x 5.00
Adjusted equity risk premium 6.0
Average market return = 10.5
Risk premium for size (4) + 9.0
Specific company risk factor (5) + 4.0
Discount rate (rounded) = 23.0 %
Long‐term sustainable growth rate (6) ‐ (3.0)
Capitalization rate for terminal year = 20.0 %
© Jay R. Hill, CPA, P.C. 33
Size Premium for the smallest public companies is as follows: 10th decile ‐ Smallest ‐ 6.28%, broken down further the premium is as follows: 10a ‐ Market Capitalization (millions) from $123.536 to $214.111 ‐ 4.45% 10b ‐ Market Capitalization (millions) from $1.007 to $123.516 ‐ 10.01% The smaller companies in the 10b decile are frequently reporting losses, which likely increases the premium. Sample Company is profitable but is a relatively small company in an industry niche. Therefore, a size premium a little lower than the 10b average or 9% is deemed appropriate for Sample Company which recognizes its profitability but small size.
5. Specific Company or Unsystematic Risk – Source is valuator's opinion based on the following risk factors:
a. Product innovation and diversity opportunities are limited. b. Relatively older management team.
6. Capitalization Rate for Terminal Year ‐ In addition to the discount rate to apply to the
specific forecast, we determine a capitalization rate applicable to the terminal year cash
flow. The terminal year is the single period estimate of future cash flows after the discrete
five year forecast period. In determining the terminal year net cash flow, we consider the
growth pattern of the forecast period and the long‐term sustainable growth rate of the
business after the forecast period. In general, most companies cannot sustain long‐term
earnings growth greater than the long‐term risk‐free rate as the resulting implied market
share, revenues and profits reach levels that cannot be reasonably obtained considering
competition, capital resources, etc. The current risk‐free rate is about 4.5%. However, the
economy is coming out of a severe recession and long‐term industry projections indicate
negative revenue growth in 2015 and 2016. Therefore, we assume a long‐term earnings
growth rate for Sample Company after year five of 3%. This is the growth rate we use to
convert the discount rate we develop below into a capitalization rate to apply to the
terminal year.
To determine the weight to accord to the debt and equity rates we estimate the current capital
structure ratio assuming a market value for capital and using book value for debt. We run
iterations of the DCF calculations to ensure the resulting equity market value and debt capital
ratio is equal to the weights given to the respective rates of return. The final calculation of the
WACC for Sample is shown below:
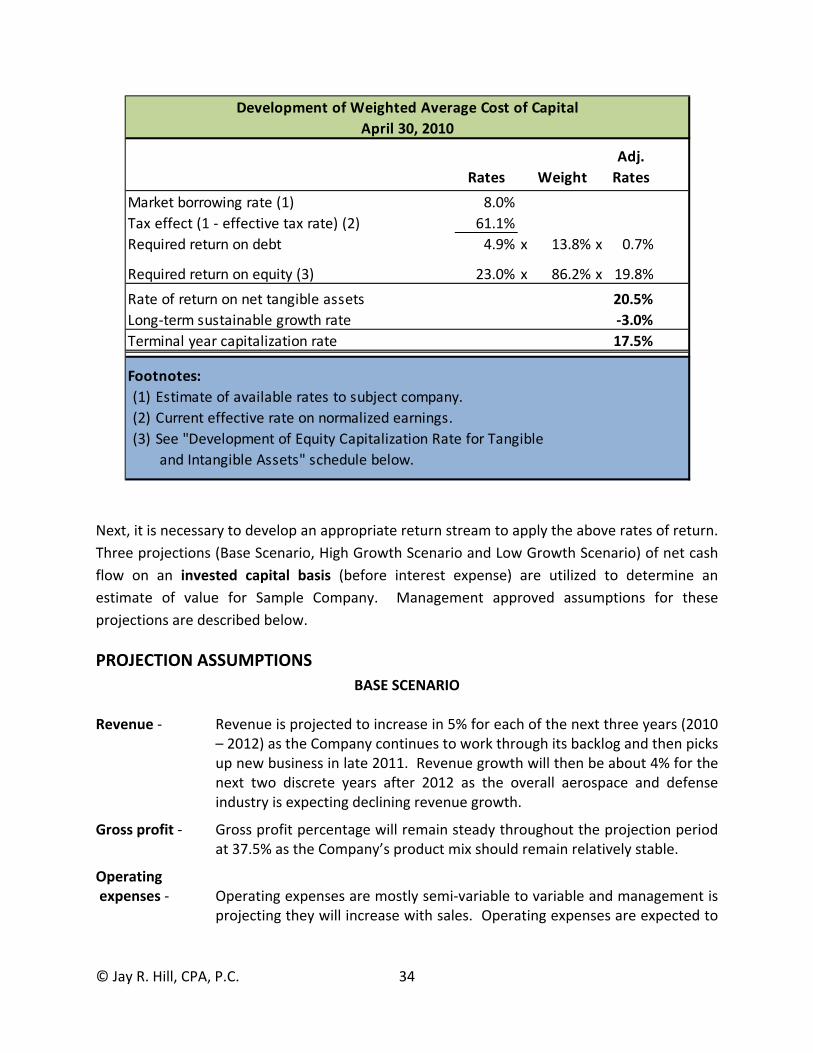
© Jay R. Hill, CPA, P.C. 34
Next, it is necessary to develop an appropriate return stream to apply the above rates of return.
Three projections (Base Scenario, High Growth Scenario and Low Growth Scenario) of net cash
flow on an invested capital basis (before interest expense) are utilized to determine an
estimate of value for Sample Company. Management approved assumptions for these
projections are described below.
PROJECTION ASSUMPTIONS
BASE SCENARIO Revenue ‐ Revenue is projected to increase in 5% for each of the next three years (2010
– 2012) as the Company continues to work through its backlog and then picks up new business in late 2011. Revenue growth will then be about 4% for the next two discrete years after 2012 as the overall aerospace and defense industry is expecting declining revenue growth.
Gross profit ‐ Gross profit percentage will remain steady throughout the projection period at 37.5% as the Company’s product mix should remain relatively stable.
Operating expenses ‐ Operating expenses are mostly semi‐variable to variable and management is
projecting they will increase with sales. Operating expenses are expected to
Development of Weighted Average Cost of Capital
April 30, 2010
Rates Weight
Adj.
Rates
Market borrowing rate (1) 8.0%
Tax effect (1 ‐ effective tax rate) (2) 61.1%
Required return on debt 4.9% x 13.8% x 0.7%
Required return on equity (3) 23.0% x 86.2% x 19.8%
Rate of return on net tangible assets 20.5%
Long‐term sustainable growth rate ‐3.0%
Terminal year capitalization rate 17.5%
Footnotes:
(1) Estimate of available rates to subject company.
(2) Current effective rate on normalized earnings.
(3) See "Development of Equity Capitalization Rate for Tangible
and Intangible Assets" schedule below.
© Jay R. Hill, CPA, P.C. 35
be about 20.0% of revenue throughout the projection period similar to historical trends.
Other income and expenses ‐ Other expenses and income consists primarily of miscellaneous income
sources and is expected to be about 0.6% of revenue throughout the projection period.
Income taxes ‐ Historical effective rate of 38.9% is applied to all years.
Non‐cash charges ‐ Depreciation expense is based on anticipated additions and retirements.
Amortization expense is minimal and will remain steady throughout the projection period.
Capital expenditures ‐ Capital expenditures are estimated at $110,000 per year based on historical
and anticipated capital needs.
Working capital requirements ‐ Working capital requirements are determined by using historical turnover
ratios for accounts receivable, inventory and accounts payable throughout the forecast period.
HIGH GROWTH SCENARIO
The only difference is this scenario is that revenue growth for 2010 and 2011 will be 7% per
year, 6% for 2012, 5% for 2013 and 4% for 2014. All other assumptions are the same.
LOW GROWTH SCENARIO
The only difference is this scenario is that revenue growth for all five years will be 3% per year.
All other assumptions are the same.
The income statement, cash flow and balance sheet projections for the Base Scenario are
shown on the next three (3) pages. It is assumed in the projection that a substantial portion of
profits are paid out as dividends to shareholders. The two other scenarios’ income statement,
cash flow and balance sheet projections are shown in Exhibit C. (NOTE: Exhibit C omitted to
condense sample report).

© Jay R. Hill, CPA, P.C. 36
Sample Company, Inc.
Income Statement Projections ‐ Base Scenario
Projected Projected Common Size
Category Year 1 Year 2 Year 3 Year 4 Year 5 Year 1 Year 2 Year 3 Year 4 Year 5
Revenue 9,203,331 9,663,497 10,146,672 10,552,539 10,974,641 100.0% 100.0% 100.0% 100.0% 100.0%
Cost of good sold 5,752,082 6,039,686 6,341,670 6,595,337 6,859,150 62.5% 62.5% 62.5% 62.5% 62.5%
Gross profit 3,451,249 3,623,811 3,805,002 3,957,202 4,115,491 37.5% 37.5% 37.5% 37.5% 37.5%
Operating expenses 1,840,666 1,932,699 2,029,334 2,110,508 2,194,928 20.0% 20.0% 20.0% 20.0% 20.0%
Operating income 1,610,583 1,691,112 1,775,668 1,846,694 1,920,563 17.5% 17.5% 17.5% 17.5% 17.5%
Other income (expenses) 2,020 3,181 4,080 4,415 4,948 0.6% 0.6% 0.6% 0.6% 0.6%
Income before income taxes 1,612,603 1,694,293 1,779,748 1,851,109 1,925,511 17.5% 17.5% 17.5% 17.5% 17.5%
Income taxes 627,303 659,080 692,322 720,081 749,024 6.8% 6.8% 6.8% 6.8% 6.8%
Net income 985,300 1,035,213 1,087,426 1,131,028 1,176,487 10.7% 10.7% 10.7% 10.7% 10.7%
Depreciation Expense 110,000 110,000 110,000 110,000 110,000 1.2% 1.1% 1.1% 1.0% 1.0%
Interest Expense 53,200 54,800 56,800 58,900 60,900 0.6% 0.6% 0.6% 0.6% 0.6%
Earnings Before The Effect of Debt
EBIT 1,665,803 1,749,093 1,836,548 1,910,009 1,986,411 18.1% 18.1% 18.1% 18.1% 18.1%
EBITDA 1,775,803 1,859,093 1,946,548 2,020,009 2,096,411 19.3% 19.2% 19.2% 19.1% 19.1%
Growth Rate Assumptions
Year Year 1 Year 2 Year 3 Year 4 Year 5
Revenue 5.00% 5.00% 5.00% 4.00% 4.00%
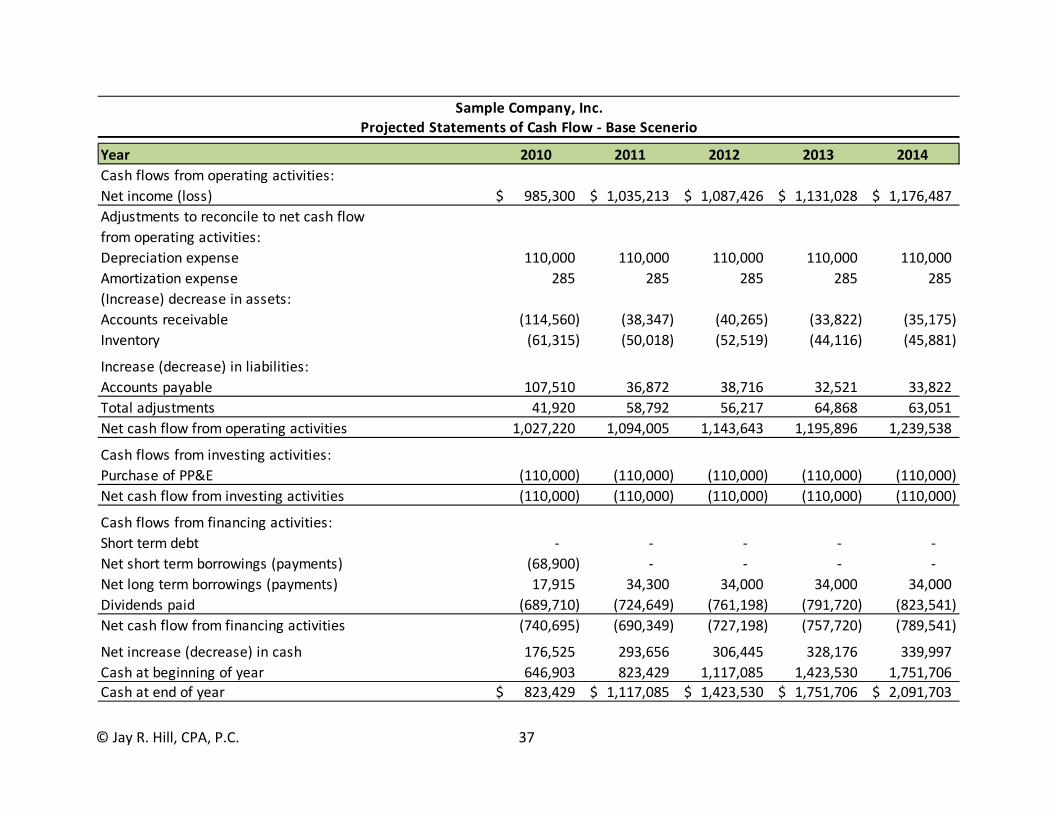
© Jay R. Hill, CPA, P.C. 37
Sample Company, Inc.Projected Statements of Cash Flow ‐ Base Scenerio
Year 2010 2011 2012 2013 2014
Cash flows from operating activities:
Net income (loss) 985,300$ 1,035,213$ 1,087,426$ 1,131,028$ 1,176,487$
Adjustments to reconcile to net cash flow
from operating activities:
Depreciation expense 110,000 110,000 110,000 110,000 110,000
Amortization expense 285 285 285 285 285
(Increase) decrease in assets:
Accounts receivable (114,560) (38,347) (40,265) (33,822) (35,175)
Inventory (61,315) (50,018) (52,519) (44,116) (45,881)
Increase (decrease) in liabilities:
Accounts payable 107,510 36,872 38,716 32,521 33,822
Total adjustments 41,920 58,792 56,217 64,868 63,051
Net cash flow from operating activities 1,027,220 1,094,005 1,143,643 1,195,896 1,239,538
Cash flows from investing activities:
Purchase of PP&E (110,000) (110,000) (110,000) (110,000) (110,000)
Net cash flow from investing activities (110,000) (110,000) (110,000) (110,000) (110,000)
Cash flows from financing activities:
Short term debt ‐ ‐ ‐ ‐ ‐
Net short term borrowings (payments) (68,900) ‐ ‐ ‐ ‐
Net long term borrowings (payments) 17,915 34,300 34,000 34,000 34,000
Dividends paid (689,710) (724,649) (761,198) (791,720) (823,541)
Net cash flow from financing activities (740,695) (690,349) (727,198) (757,720) (789,541)
Net increase (decrease) in cash 176,525 293,656 306,445 328,176 339,997
Cash at beginning of year 646,903 823,429 1,117,085 1,423,530 1,751,706
Cash at end of year 823,429$ 1,117,085$ 1,423,530$ 1,751,706$ 2,091,703$
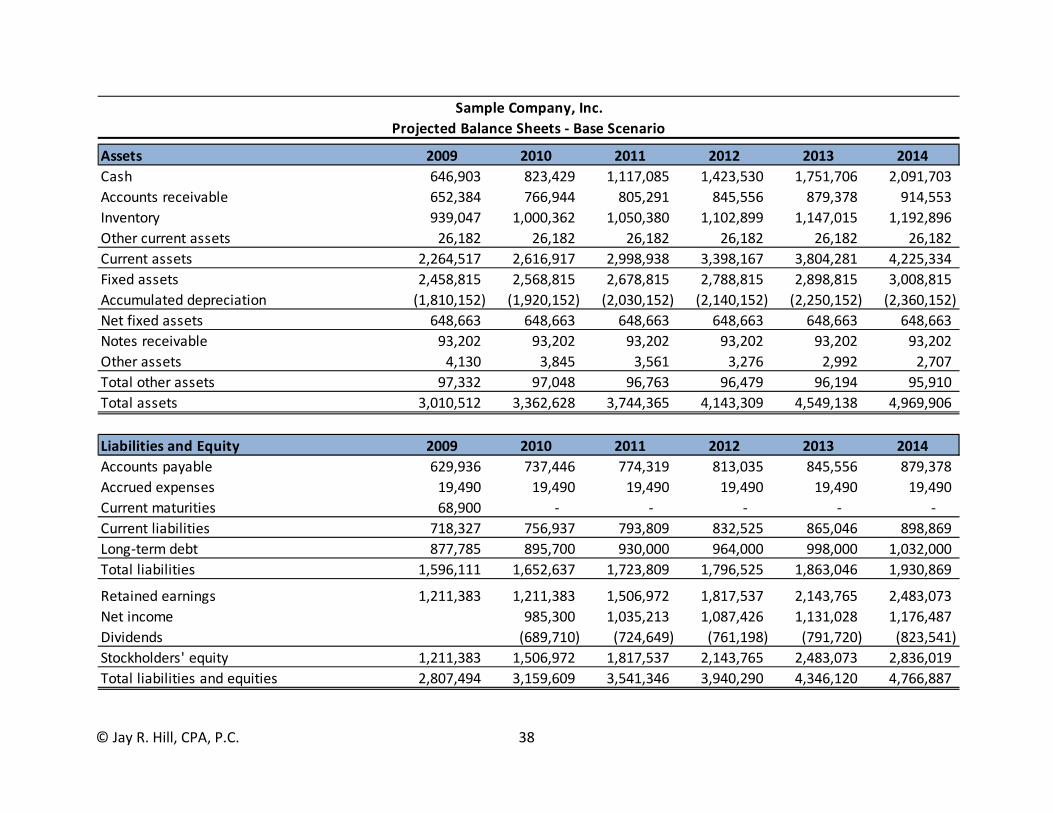
© Jay R. Hill, CPA, P.C. 38
Sample Company, Inc.
Projected Balance Sheets ‐ Base Scenario
Assets 2009 2010 2011 2012 2013 2014
Cash 646,903 823,429 1,117,085 1,423,530 1,751,706 2,091,703
Accounts receivable 652,384 766,944 805,291 845,556 879,378 914,553
Inventory 939,047 1,000,362 1,050,380 1,102,899 1,147,015 1,192,896
Other current assets 26,182 26,182 26,182 26,182 26,182 26,182
Current assets 2,264,517 2,616,917 2,998,938 3,398,167 3,804,281 4,225,334
Fixed assets 2,458,815 2,568,815 2,678,815 2,788,815 2,898,815 3,008,815
Accumulated depreciation (1,810,152) (1,920,152) (2,030,152) (2,140,152) (2,250,152) (2,360,152)
Net fixed assets 648,663 648,663 648,663 648,663 648,663 648,663
Notes receivable 93,202 93,202 93,202 93,202 93,202 93,202
Other assets 4,130 3,845 3,561 3,276 2,992 2,707
Total other assets 97,332 97,048 96,763 96,479 96,194 95,910
Total assets 3,010,512 3,362,628 3,744,365 4,143,309 4,549,138 4,969,906
Liabilities and Equity 2009 2010 2011 2012 2013 2014
Accounts payable 629,936 737,446 774,319 813,035 845,556 879,378
Accrued expenses 19,490 19,490 19,490 19,490 19,490 19,490
Current maturities 68,900 ‐ ‐ ‐ ‐ ‐
Current liabilities 718,327 756,937 793,809 832,525 865,046 898,869
Long‐term debt 877,785 895,700 930,000 964,000 998,000 1,032,000
Total liabilities 1,596,111 1,652,637 1,723,809 1,796,525 1,863,046 1,930,869
Retained earnings 1,211,383 1,211,383 1,506,972 1,817,537 2,143,765 2,483,073
Net income 985,300 1,035,213 1,087,426 1,131,028 1,176,487
Dividends (689,710) (724,649) (761,198) (791,720) (823,541)
Stockholders' equity 1,211,383 1,506,972 1,817,537 2,143,765 2,483,073 2,836,019
Total liabilities and equities 2,807,494 3,159,609 3,541,346 3,940,290 4,346,120 4,766,887
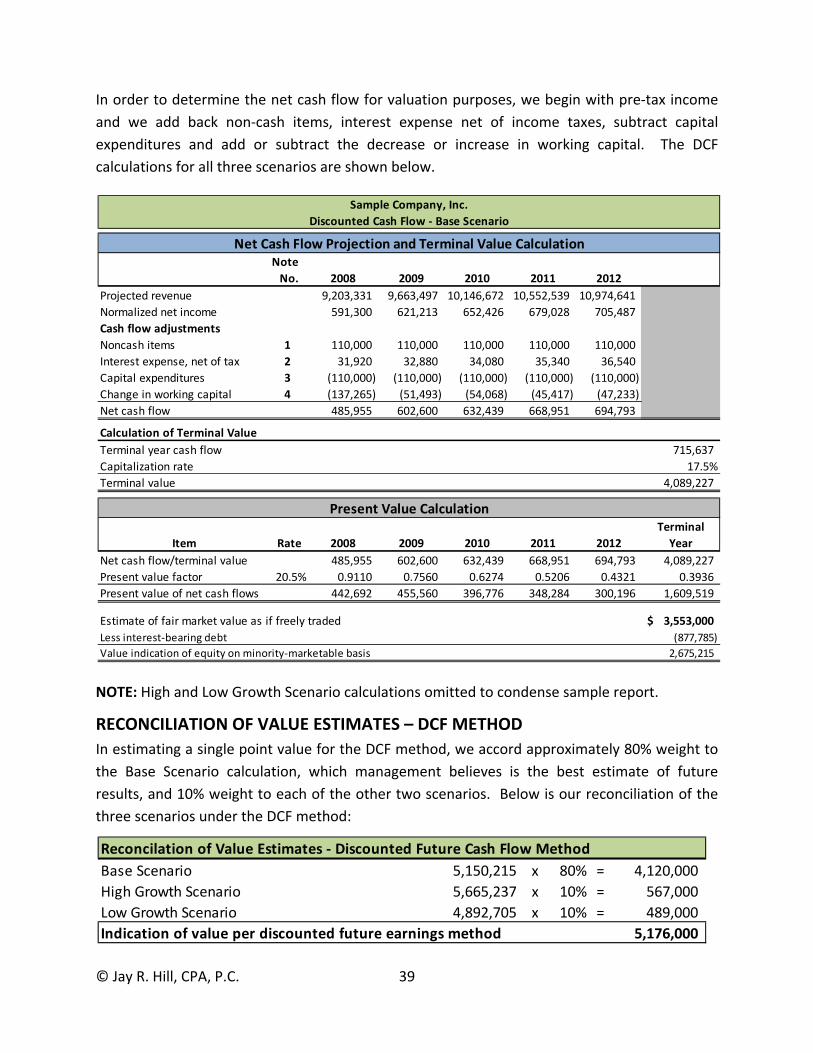
© Jay R. Hill, CPA, P.C. 39
In order to determine the net cash flow for valuation purposes, we begin with pre‐tax income
and we add back non‐cash items, interest expense net of income taxes, subtract capital
expenditures and add or subtract the decrease or increase in working capital. The DCF
calculations for all three scenarios are shown below.
NOTE: High and Low Growth Scenario calculations omitted to condense sample report.
RECONCILIATION OF VALUE ESTIMATES – DCF METHOD
In estimating a single point value for the DCF method, we accord approximately 80% weight to
the Base Scenario calculation, which management believes is the best estimate of future
results, and 10% weight to each of the other two scenarios. Below is our reconciliation of the
three scenarios under the DCF method:
Sample Company, Inc.
Discounted Cash Flow ‐ Base Scenario
Net Cash Flow Projection and Terminal Value CalculationNote
No. 2008 2009 2010 2011 2012
Projected revenue 9,203,331 9,663,497 10,146,672 10,552,539 10,974,641
Normalized net income 591,300 621,213 652,426 679,028 705,487
Cash flow adjustments
Noncash items 1 110,000 110,000 110,000 110,000 110,000
Interest expense, net of tax 2 31,920 32,880 34,080 35,340 36,540
Capital expenditures 3 (110,000) (110,000) (110,000) (110,000) (110,000)
Change in working capital 4 (137,265) (51,493) (54,068) (45,417) (47,233)
Net cash flow 485,955 602,600 632,439 668,951 694,793
Calculation of Terminal Value
Terminal year cash flow 715,637
Capitalization rate 17.5%
Terminal value 4,089,227
Present Value CalculationTerminal
Item Rate 2008 2009 2010 2011 2012 Year
Net cash flow/terminal value 485,955 602,600 632,439 668,951 694,793 4,089,227
Present value factor 20.5% 0.9110 0.7560 0.6274 0.5206 0.4321 0.3936
Present value of net cash flows 442,692 455,560 396,776 348,284 300,196 1,609,519
Estimate of fair market value as if freely traded 3,553,000$
Less interest‐bearing debt (877,785)
Value indication of equity on minority‐marketable basis 2,675,215
Reconcilation of Value Estimates ‐ Discounted Future Cash Flow Method
Base Scenario 5,150,215 x 80% = 4,120,000
High Growth Scenario 5,665,237 x 10% = 567,000
Low Growth Scenario 4,892,705 x 10% = 489,000
Indication of value per discounted future earnings method 5,176,000

© Jay R. Hill, CPA, P.C. 40
PUBLIC GUIDELINE COMPANY METHOD
The public guideline company method entails determining a single period estimate of future
earnings and applying market value factors for each method from appropriate guideline
publicly‐held companies’ transaction data. Since the transaction data represents freely traded
minority interests, the use of this method derives a freely traded noncontrolling or minority value
for the subject company. It is our opinion that net income, earnings before interest expense and
income taxes (EBIT), earnings before interest expense, income taxes, depreciation and
amortization (EBITDA) and revenue are the most appropriate earnings bases to value the
subject company. Since Sample Company is projecting that revenue and profits are going to
increase from 2009, which was by far the Company best year to date, we utilize 2009 as the
base for these methods as follows:
Sample Company – 2009 Adjusted Earnings Bases Net income $984,000 EBIT 1,662,000 EBITDA 1,772,000 Revenue 8,765,000
DEVELOPMENT OF VALUE FACTORS – GUIDELINE COMPANIES
Sample Company operates in a niche industry that does not have any public companies that
compete specifically in their industry. However, there are public companies that have divisions
that operate in the niche or serve a similar customer base and are similar in both their
operational and financial structure. We search the EdgarPro database of public companies that
are categorized as aerospace and defense companies. Seventy‐two (72) companies were
identified. Of these seventy‐two, we eliminated all non‐manufacturing companies and
companies that were currently reporting losses. In addition, we eliminated those companies
whose primary revenue was derived from security or defense related products. The remaining
companies were primarily manufacturers of basic airplane parts. Descriptions of the public
guideline companies we selected in the development of valuation factors for Sample Company
are as follows:5
TRIUMPH GROUP, INC. (TGI) Triumph Group, Inc., through its subsidiaries, engages in the design, engineering, manufacture, repair, overhaul, and distribution of aircraft components in the United States and internationally. The company operates in two segments, Aerospace Systems and Aftermarket Services. The Aerospace Systems segment provides mechanical and electromechanical controls, such as hydraulic systems and components, main engine gearbox assemblies, and accumulators and mechanical control cables. It also involves in stretch forming, die forming, milling, bonding, machining, welding, and assembling and fabricating various structural components used in aircraft wings, fuselages, and other assemblies. In addition, this
5 Description source: Yahoo Finance, finance.yahoo.com
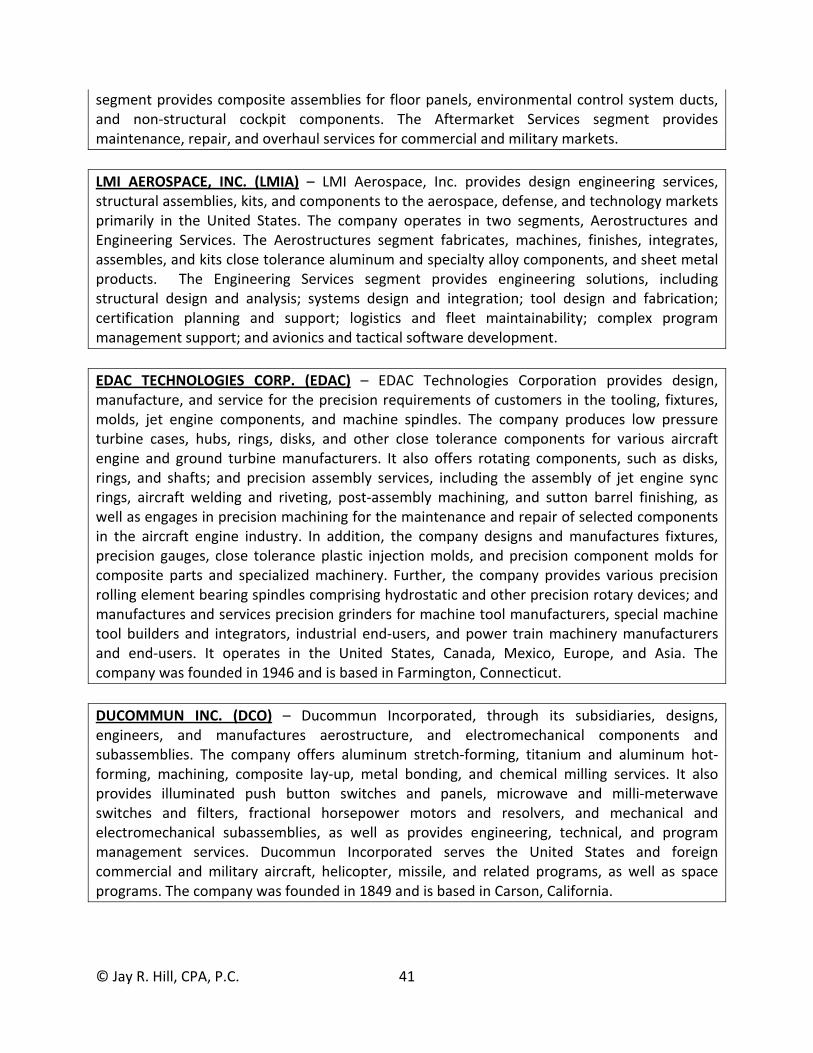
© Jay R. Hill, CPA, P.C. 41
segment provides composite assemblies for floor panels, environmental control system ducts, and non‐structural cockpit components. The Aftermarket Services segment provides maintenance, repair, and overhaul services for commercial and military markets.
LMI AEROSPACE, INC. (LMIA) – LMI Aerospace, Inc. provides design engineering services, structural assemblies, kits, and components to the aerospace, defense, and technology markets primarily in the United States. The company operates in two segments, Aerostructures and Engineering Services. The Aerostructures segment fabricates, machines, finishes, integrates, assembles, and kits close tolerance aluminum and specialty alloy components, and sheet metal products. The Engineering Services segment provides engineering solutions, including structural design and analysis; systems design and integration; tool design and fabrication; certification planning and support; logistics and fleet maintainability; complex program management support; and avionics and tactical software development.
EDAC TECHNOLOGIES CORP. (EDAC) – EDAC Technologies Corporation provides design, manufacture, and service for the precision requirements of customers in the tooling, fixtures, molds, jet engine components, and machine spindles. The company produces low pressure turbine cases, hubs, rings, disks, and other close tolerance components for various aircraft engine and ground turbine manufacturers. It also offers rotating components, such as disks, rings, and shafts; and precision assembly services, including the assembly of jet engine sync rings, aircraft welding and riveting, post‐assembly machining, and sutton barrel finishing, as well as engages in precision machining for the maintenance and repair of selected components in the aircraft engine industry. In addition, the company designs and manufactures fixtures, precision gauges, close tolerance plastic injection molds, and precision component molds for composite parts and specialized machinery. Further, the company provides various precision rolling element bearing spindles comprising hydrostatic and other precision rotary devices; and manufactures and services precision grinders for machine tool manufacturers, special machine tool builders and integrators, industrial end‐users, and power train machinery manufacturers and end‐users. It operates in the United States, Canada, Mexico, Europe, and Asia. The company was founded in 1946 and is based in Farmington, Connecticut.
DUCOMMUN INC. (DCO) – Ducommun Incorporated, through its subsidiaries, designs, engineers, and manufactures aerostructure, and electromechanical components and subassemblies. The company offers aluminum stretch‐forming, titanium and aluminum hot‐forming, machining, composite lay‐up, metal bonding, and chemical milling services. It also provides illuminated push button switches and panels, microwave and milli‐meterwave switches and filters, fractional horsepower motors and resolvers, and mechanical and electromechanical subassemblies, as well as provides engineering, technical, and program management services. Ducommun Incorporated serves the United States and foreign commercial and military aircraft, helicopter, missile, and related programs, as well as space programs. The company was founded in 1849 and is based in Carson, California.

© Jay R. Hill, CPA, P.C. 42
HEICO CORPORATION (HEI) – HEICO Corporation, through its subsidiaries, engages in the design, manufacture, and sale of aerospace, defense, and electronics related products, as well as in the provision of related services in the United States and internationally. Its Flight Support Group segment offers jet engine and aircraft component replacement parts. It manufactures thermal insulation blankets primarily for aerospace, defense, and commercial applications; and provides specialty components as a subcontractor for aerospace and industrial original equipment manufacturers, and the United States government. The company’s Electronic Technologies Group segment offers electronic, microwave, and electro‐optical products, including infrared simulation and test equipment, laser rangefinder receivers, electrical and back‐up power supplies, electromagnetic interference and radio frequency interference shielding, high power capacitor charging power supplies, amplifiers, photo detectors, amplifier modules, laser diode drivers, arc lamp power supplies, custom power supply designs, cable assemblies, high voltage interconnection devices and wire, high voltage energy generators, high frequency power delivery systems, and high‐speed interface products primarily for the aviation, defense, space, medical, and electronics industries. HEICO Corporation primarily serves commercial and cargo airlines, repair and overhaul facilities, other aftermarket suppliers of aircraft engine and airframe materials, military units, and electronic manufacturing service companies. It has strategic alliance with Lufthansa. The company was founded in 1949 and is headquartered in Hollywood, Florida.
ESTERLINE TECHNOLOGIES CORP. (ESL) – Esterline Technologies Corporation designs, manufactures, and markets engineered products and systems for the aerospace and defense, industrial/commercial, and medical markets primarily in the United States and Europe. Its Avionics & Controls segment provides GPS, head‐up displays, vision systems, and electronic flight management systems for control and display applications. It also offers technology interface systems, including lighted push‐button and rotary switches, keyboards, lighted indicators, panels, and displays for commercial and military aircraft. The company’s Sensors & Systems segment produces high‐precision temperature, pressure, and speed sensors; electrical power switching, and control and data communication devices; and related systems for jet engine and airframe manufacturers. Its Advanced Materials segment manufactures elastomer products for commercial aerospace, space, and military applications. Esterline sells its products through direct internal international sales force, manufacturer representatives, and distributors. The company was founded in 1967 and is based in Bellevue, Washington.
TRANSDIGM GROUP (TDG) – TransDigm Group Incorporated designs, produces, and supplies engineered aircraft components for use on commercial and military aircraft principally in the United States. The company offers mechanical /electro‐mechanical actuators and controls used in actuation applications; ignition systems and components, such as igniters, exciters, and spark plugs used to start and spark turbine and reciprocating aircraft engines; gear pumps used primarily in lubrication and fuel applications; specialized valves used in fuel, hydraulic, and pneumatic applications; engineered connectors used in fuel, pneumatic, and hydraulic applications; power conditioning devices used to modify and control electrical power; specialized fluorescent lighting; and specialized AC/DC electric motors and components.
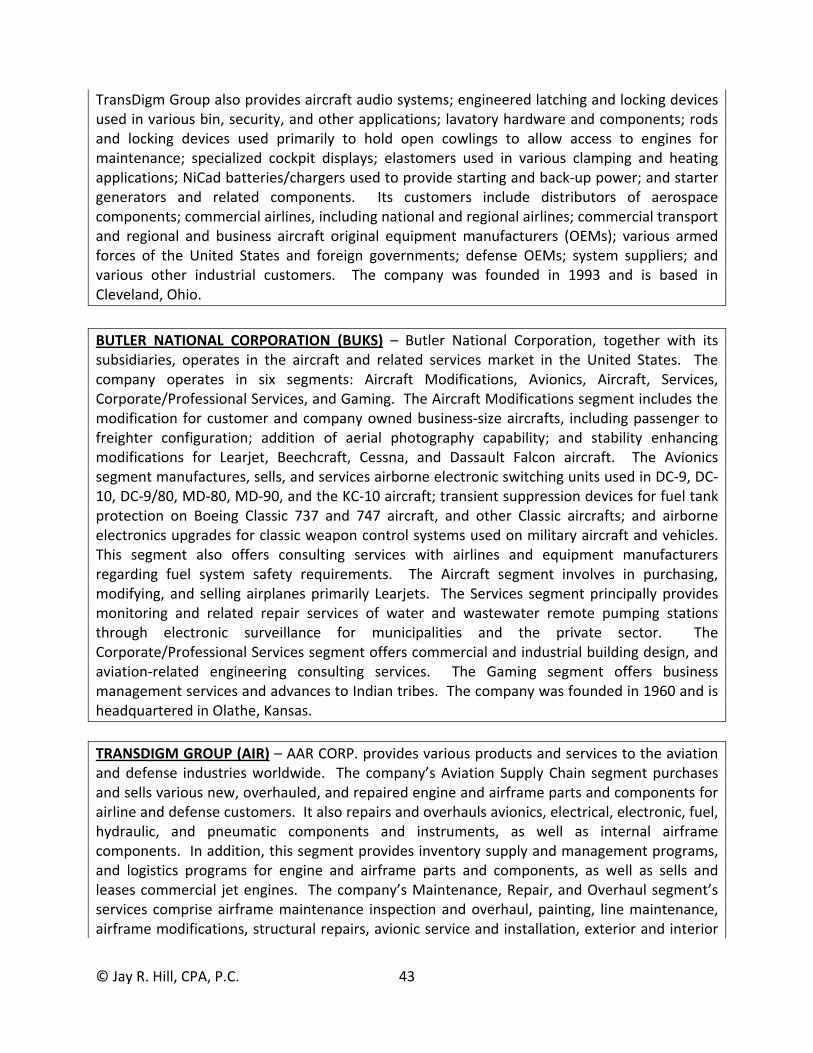
© Jay R. Hill, CPA, P.C. 43
TransDigm Group also provides aircraft audio systems; engineered latching and locking devices used in various bin, security, and other applications; lavatory hardware and components; rods and locking devices used primarily to hold open cowlings to allow access to engines for maintenance; specialized cockpit displays; elastomers used in various clamping and heating applications; NiCad batteries/chargers used to provide starting and back‐up power; and starter generators and related components. Its customers include distributors of aerospace components; commercial airlines, including national and regional airlines; commercial transport and regional and business aircraft original equipment manufacturers (OEMs); various armed forces of the United States and foreign governments; defense OEMs; system suppliers; and various other industrial customers. The company was founded in 1993 and is based in Cleveland, Ohio.
BUTLER NATIONAL CORPORATION (BUKS) – Butler National Corporation, together with its subsidiaries, operates in the aircraft and related services market in the United States. The company operates in six segments: Aircraft Modifications, Avionics, Aircraft, Services, Corporate/Professional Services, and Gaming. The Aircraft Modifications segment includes the modification for customer and company owned business‐size aircrafts, including passenger to freighter configuration; addition of aerial photography capability; and stability enhancing modifications for Learjet, Beechcraft, Cessna, and Dassault Falcon aircraft. The Avionics segment manufactures, sells, and services airborne electronic switching units used in DC‐9, DC‐10, DC‐9/80, MD‐80, MD‐90, and the KC‐10 aircraft; transient suppression devices for fuel tank protection on Boeing Classic 737 and 747 aircraft, and other Classic aircrafts; and airborne electronics upgrades for classic weapon control systems used on military aircraft and vehicles. This segment also offers consulting services with airlines and equipment manufacturers regarding fuel system safety requirements. The Aircraft segment involves in purchasing, modifying, and selling airplanes primarily Learjets. The Services segment principally provides monitoring and related repair services of water and wastewater remote pumping stations through electronic surveillance for municipalities and the private sector. The Corporate/Professional Services segment offers commercial and industrial building design, and aviation‐related engineering consulting services. The Gaming segment offers business management services and advances to Indian tribes. The company was founded in 1960 and is headquartered in Olathe, Kansas.
TRANSDIGM GROUP (AIR) – AAR CORP. provides various products and services to the aviation and defense industries worldwide. The company’s Aviation Supply Chain segment purchases and sells various new, overhauled, and repaired engine and airframe parts and components for airline and defense customers. It also repairs and overhauls avionics, electrical, electronic, fuel, hydraulic, and pneumatic components and instruments, as well as internal airframe components. In addition, this segment provides inventory supply and management programs, and logistics programs for engine and airframe parts and components, as well as sells and leases commercial jet engines. The company’s Maintenance, Repair, and Overhaul segment’s services comprise airframe maintenance inspection and overhaul, painting, line maintenance, airframe modifications, structural repairs, avionic service and installation, exterior and interior
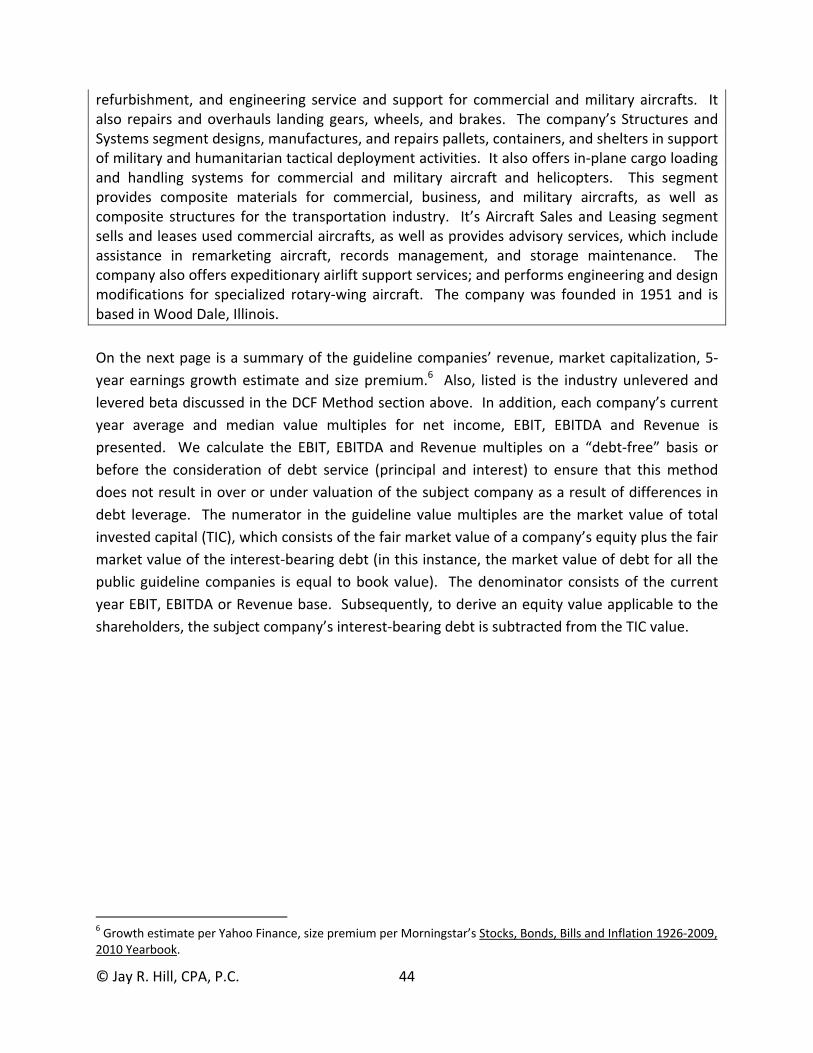
© Jay R. Hill, CPA, P.C. 44
refurbishment, and engineering service and support for commercial and military aircrafts. It also repairs and overhauls landing gears, wheels, and brakes. The company’s Structures and Systems segment designs, manufactures, and repairs pallets, containers, and shelters in support of military and humanitarian tactical deployment activities. It also offers in‐plane cargo loading and handling systems for commercial and military aircraft and helicopters. This segment provides composite materials for commercial, business, and military aircrafts, as well as composite structures for the transportation industry. It’s Aircraft Sales and Leasing segment sells and leases used commercial aircrafts, as well as provides advisory services, which include assistance in remarketing aircraft, records management, and storage maintenance. The company also offers expeditionary airlift support services; and performs engineering and design modifications for specialized rotary‐wing aircraft. The company was founded in 1951 and is based in Wood Dale, Illinois.
On the next page is a summary of the guideline companies’ revenue, market capitalization, 5‐
year earnings growth estimate and size premium.6 Also, listed is the industry unlevered and
levered beta discussed in the DCF Method section above. In addition, each company’s current
year average and median value multiples for net income, EBIT, EBITDA and Revenue is
presented. We calculate the EBIT, EBITDA and Revenue multiples on a “debt‐free” basis or
before the consideration of debt service (principal and interest) to ensure that this method
does not result in over or under valuation of the subject company as a result of differences in
debt leverage. The numerator in the guideline value multiples are the market value of total
invested capital (TIC), which consists of the fair market value of a company’s equity plus the fair
market value of the interest‐bearing debt (in this instance, the market value of debt for all the
public guideline companies is equal to book value). The denominator consists of the current
year EBIT, EBITDA or Revenue base. Subsequently, to derive an equity value applicable to the
shareholders, the subject company’s interest‐bearing debt is subtracted from the TIC value.
6 Growth estimate per Yahoo Finance, size premium per Morningstar’s Stocks, Bonds, Bills and Inflation 1926‐2009, 2010 Yearbook.
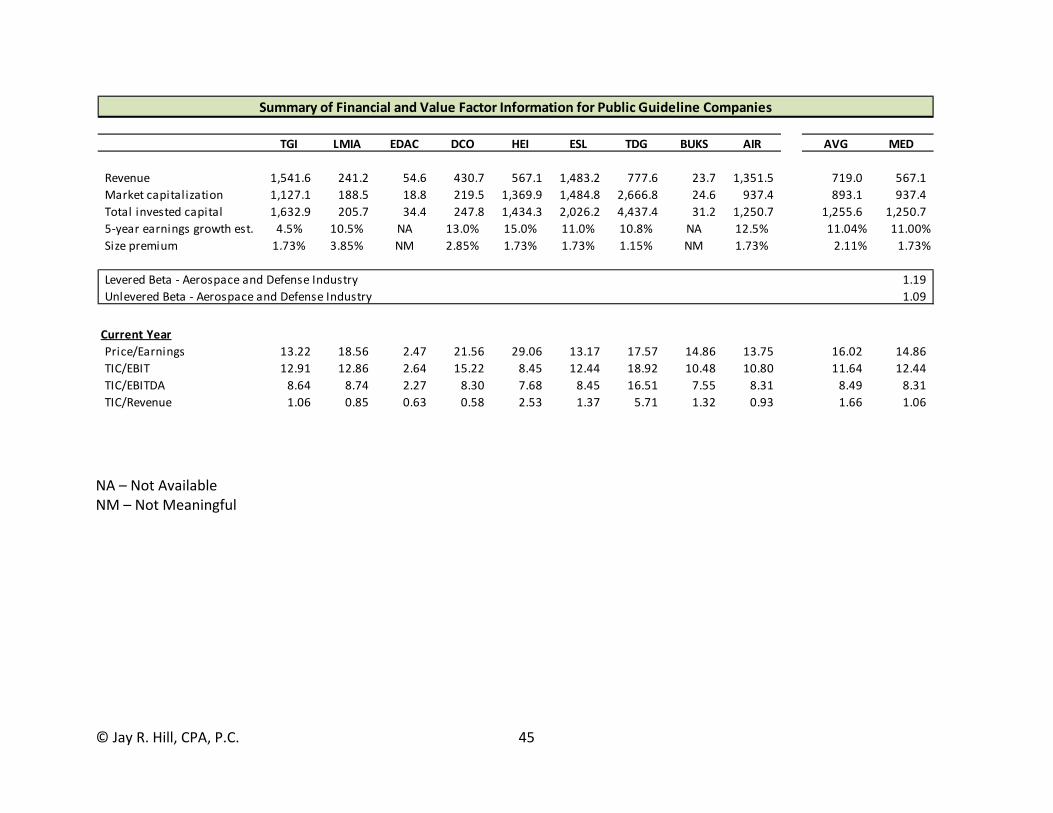
© Jay R. Hill, CPA, P.C. 45
NA – Not Available NM – Not Meaningful
Summary of Financial and Value Factor Information for Public Guideline Companies
TGI LMIA EDAC DCO HEI ESL TDG BUKS AIR AVG MED
Revenue 1,541.6 241.2 54.6 430.7 567.1 1,483.2 777.6 23.7 1,351.5 719.0 567.1
Market capitalization 1,127.1 188.5 18.8 219.5 1,369.9 1,484.8 2,666.8 24.6 937.4 893.1 937.4
Total invested capital 1,632.9 205.7 34.4 247.8 1,434.3 2,026.2 4,437.4 31.2 1,250.7 1,255.6 1,250.7
5‐year earnings growth est. 4.5% 10.5% NA 13.0% 15.0% 11.0% 10.8% NA 12.5% 11.04% 11.00%
Size premium 1.73% 3.85% NM 2.85% 1.73% 1.73% 1.15% NM 1.73% 2.11% 1.73%
Levered Beta ‐ Aerospace and Defense Industry 1.19
Unlevered Beta ‐ Aerospace and Defense Industry 1.09
Current Year
Price/Earnings 13.22 18.56 2.47 21.56 29.06 13.17 17.57 14.86 13.75 16.02 14.86
TIC/EBIT 12.91 12.86 2.64 15.22 8.45 12.44 18.92 10.48 10.80 11.64 12.44
TIC/EBITDA 8.64 8.74 2.27 8.30 7.68 8.45 16.51 7.55 8.31 8.49 8.31
TIC/Revenue 1.06 0.85 0.63 0.58 2.53 1.37 5.71 1.32 0.93 1.66 1.06
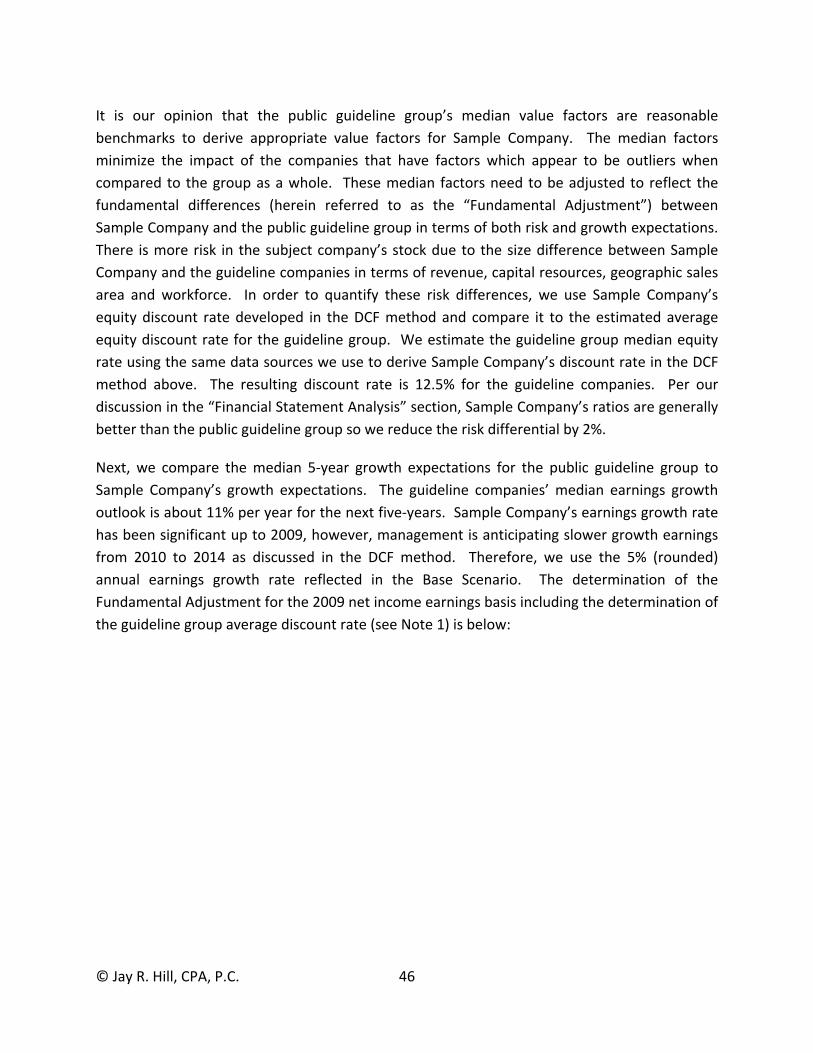
© Jay R. Hill, CPA, P.C. 46
It is our opinion that the public guideline group’s median value factors are reasonable
benchmarks to derive appropriate value factors for Sample Company. The median factors
minimize the impact of the companies that have factors which appear to be outliers when
compared to the group as a whole. These median factors need to be adjusted to reflect the
fundamental differences (herein referred to as the “Fundamental Adjustment”) between
Sample Company and the public guideline group in terms of both risk and growth expectations.
There is more risk in the subject company’s stock due to the size difference between Sample
Company and the guideline companies in terms of revenue, capital resources, geographic sales
area and workforce. In order to quantify these risk differences, we use Sample Company’s
equity discount rate developed in the DCF method and compare it to the estimated average
equity discount rate for the guideline group. We estimate the guideline group median equity
rate using the same data sources we use to derive Sample Company’s discount rate in the DCF
method above. The resulting discount rate is 12.5% for the guideline companies. Per our
discussion in the “Financial Statement Analysis” section, Sample Company’s ratios are generally
better than the public guideline group so we reduce the risk differential by 2%.
Next, we compare the median 5‐year growth expectations for the public guideline group to
Sample Company’s growth expectations. The guideline companies’ median earnings growth
outlook is about 11% per year for the next five‐years. Sample Company’s earnings growth rate
has been significant up to 2009, however, management is anticipating slower growth earnings
from 2010 to 2014 as discussed in the DCF method. Therefore, we use the 5% (rounded)
annual earnings growth rate reflected in the Base Scenario. The determination of the
Fundamental Adjustment for the 2009 net income earnings basis including the determination of
the guideline group average discount rate (see Note 1) is below:

© Jay R. Hill, CPA, P.C. 47
The resulting price/earnings factor for Sample Company is 5. The implied Fundamental
Adjustment of 66.4% is applied to the three invested capital method’s equity value indication,
i.e. after subtracting Sample Company’s interest‐bearing debt. The valuation calculations for
the public guideline company method using the adjusted 2009 earnings bases are below.
Fundamental Adjustment Calculation ‐ Current Year
Public Guideline Company Median Price/Earnings 14.86
Guideline Company Capitalization Rate (1/(Price/Earnings)) 6.7%
Cost of Equity for Sample Company (Per DCF Method) 23.0%
Less: Discount for better financial ratio performance ‐2.0%
Less: Cost of Equity for Guideline Companies ‐ Build‐Up (Note 1) ‐12.50%
Risk Premium Differential 8.5%
Guideline Company Median Expected Growth Rate Next Five Years 11.0%
Less: Sample Company's Expected Earnings Growth Rate Next Five Years ‐5.0%
Growth Rate Differential 6.0%
Capitalization Rate Applicable to Sample Company 21.2%
Price/Earnings Multiple Applicable to Sample Company 5.0
Implied Fundamental Adjustment of Guideline Median Multiple 66.4%
Note 1 ‐ Determination of Cost of Equity for Guideline Companies ‐ Modified CAPM
Treasury rate (1) 4.5%
Equity risk premium (2) 5.0%
Median Guideline Companies' Beta (3) 1.19
Estimated market premium 6.0%
Median Size premium ‐ rounded (4) 2.0%
Median Cost of Equity for Guideline Companies 12.5%
(1) Source: Federal Reserve’s Historical Interest Rates , 6 month average of 20‐Year Treasury Bond Yield – 4.44%, rounded to 4.5%.
(2) Source: Source: Damodaran Online, (http://pages.stern.nyu.edu/ ~adamodar/), Implied at 4/30/10 4.12%,
rounded to 5.0% as rate is increasing and premium has been at historical lows.
(3) Source: Damodaran Online, (http://pages.stern.nyu.edu/~adamodar/), The Data Page – Levered and Unlevered Beta by Industry – Aerospace and Defense
(4) Source: Morningstar, Stock, Bonds, Bills, and Inflation, Valuation Edition, 2010 Yearbook
Price/Earnings Method
Year 2009
Adjusted net income (rounded) 984,000
Price/earnings value factor (including Fundament Adjustment) 5.0
Indicated minority interest value (rounded) 4,920,000
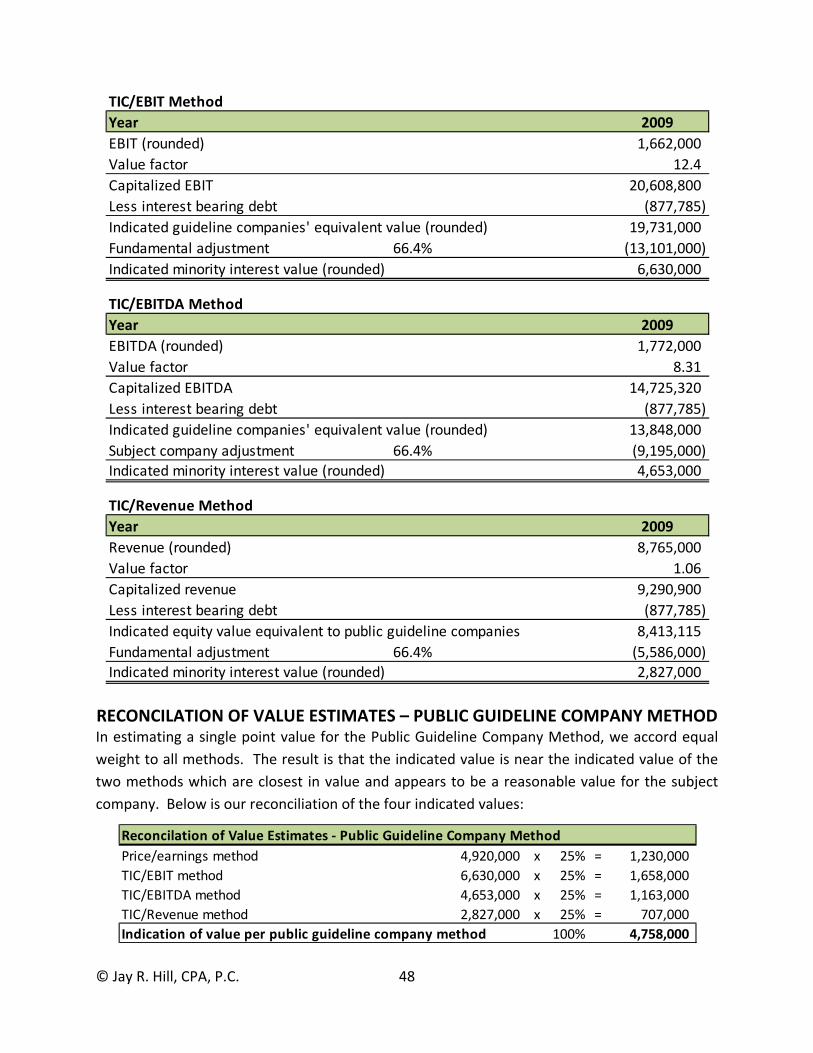
© Jay R. Hill, CPA, P.C. 48
RECONCILATION OF VALUE ESTIMATES – PUBLIC GUIDELINE COMPANY METHOD In estimating a single point value for the Public Guideline Company Method, we accord equal
weight to all methods. The result is that the indicated value is near the indicated value of the
two methods which are closest in value and appears to be a reasonable value for the subject
company. Below is our reconciliation of the four indicated values:
TIC/EBIT Method
Year 2009
EBIT (rounded) 1,662,000
Value factor 12.4
Capitalized EBIT 20,608,800
Less interest bearing debt (877,785)
Indicated guideline companies' equivalent value (rounded) 19,731,000
Fundamental adjustment 66.4% (13,101,000)
Indicated minority interest value (rounded) 6,630,000
TIC/EBITDA Method
Year 2009
EBITDA (rounded) 1,772,000
Value factor 8.31
Capitalized EBITDA 14,725,320
Less interest bearing debt (877,785)
Indicated guideline companies' equivalent value (rounded) 13,848,000
Subject company adjustment 66.4% (9,195,000)
Indicated minority interest value (rounded) 4,653,000
TIC/Revenue Method
Year 2009
Revenue (rounded) 8,765,000
Value factor 1.06
Capitalized revenue 9,290,900
Less interest bearing debt (877,785)
Indicated equity value equivalent to public guideline companies 8,413,115
Fundamental adjustment 66.4% (5,586,000)
Indicated minority interest value (rounded) 2,827,000
Reconcilation of Value Estimates ‐ Public Guideline Company Method
Price/earnings method 4,920,000 x 25% = 1,230,000
TIC/EBIT method 6,630,000 x 25% = 1,658,000
TIC/EBITDA method 4,653,000 x 25% = 1,163,000
TIC/Revenue method 2,827,000 x 25% = 707,000
Indication of value per public guideline company method 100% 4,758,000
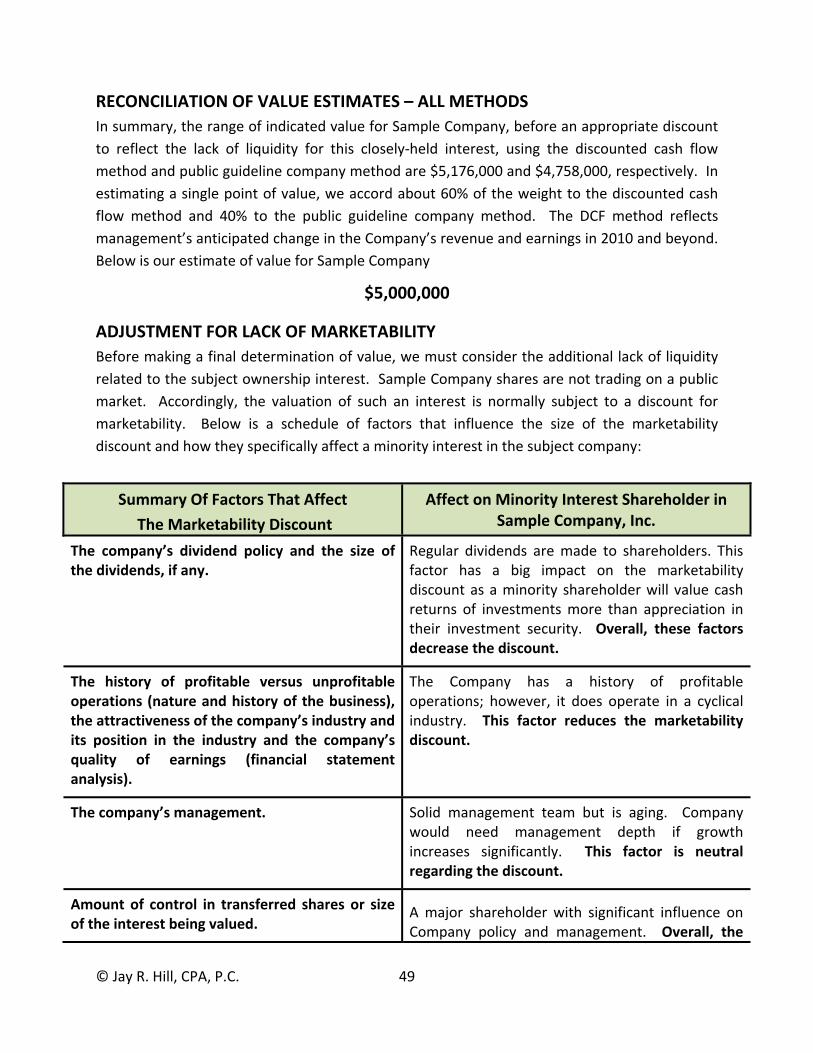
© Jay R. Hill, CPA, P.C. 49
RECONCILIATION OF VALUE ESTIMATES – ALL METHODS
In summary, the range of indicated value for Sample Company, before an appropriate discount
to reflect the lack of liquidity for this closely‐held interest, using the discounted cash flow
method and public guideline company method are $5,176,000 and $4,758,000, respectively. In
estimating a single point of value, we accord about 60% of the weight to the discounted cash
flow method and 40% to the public guideline company method. The DCF method reflects
management’s anticipated change in the Company’s revenue and earnings in 2010 and beyond.
Below is our estimate of value for Sample Company
$5,000,000
ADJUSTMENT FOR LACK OF MARKETABILITY
Before making a final determination of value, we must consider the additional lack of liquidity
related to the subject ownership interest. Sample Company shares are not trading on a public
market. Accordingly, the valuation of such an interest is normally subject to a discount for
marketability. Below is a schedule of factors that influence the size of the marketability
discount and how they specifically affect a minority interest in the subject company:
Summary Of Factors That Affect
The Marketability Discount
Affect on Minority Interest Shareholder in Sample Company, Inc.
The company’s dividend policy and the size of the dividends, if any.
Regular dividends are made to shareholders. This factor has a big impact on the marketability discount as a minority shareholder will value cash returns of investments more than appreciation in their investment security. Overall, these factors decrease the discount.
The history of profitable versus unprofitable operations (nature and history of the business), the attractiveness of the company’s industry and its position in the industry and the company’s quality of earnings (financial statement analysis).
The Company has a history of profitable operations; however, it does operate in a cyclical industry. This factor reduces the marketability discount.
The company’s management. Solid management team but is aging. Company would need management depth if growth increases significantly. This factor is neutral regarding the discount.
Amount of control in transferred shares or size of the interest being valued.
A major shareholder with significant influence on Company policy and management. Overall, the
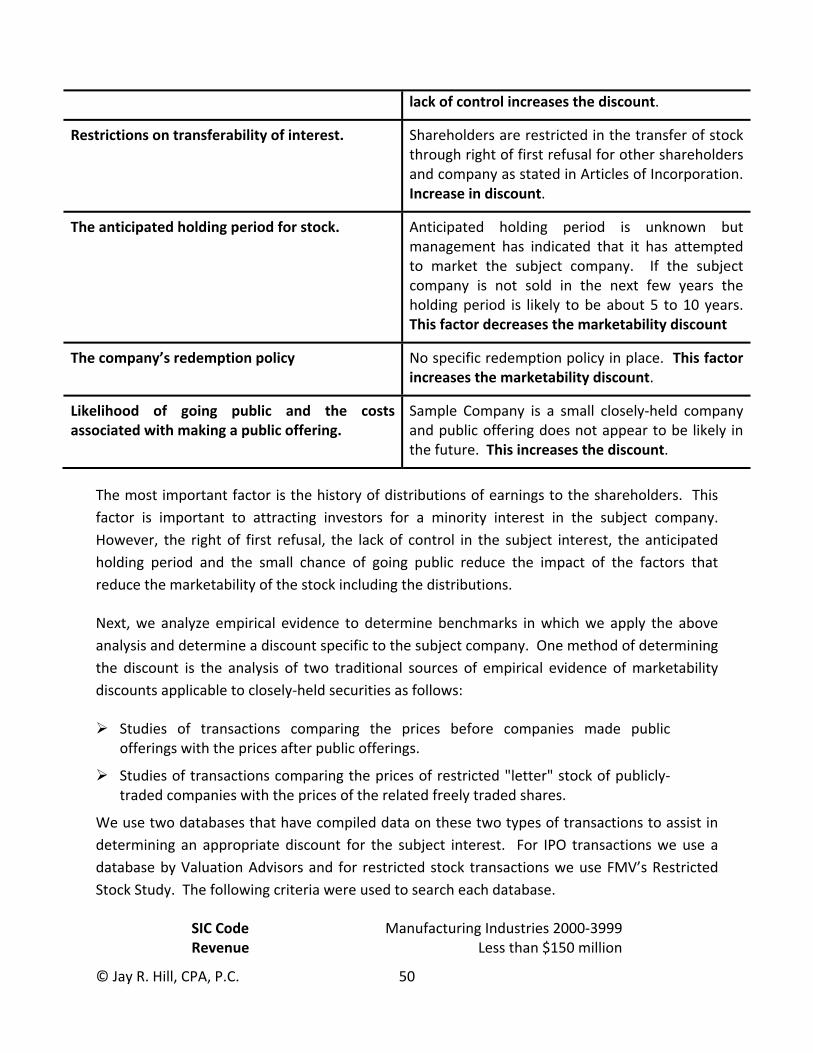
© Jay R. Hill, CPA, P.C. 50
lack of control increases the discount.
Restrictions on transferability of interest. Shareholders are restricted in the transfer of stock through right of first refusal for other shareholders and company as stated in Articles of Incorporation. Increase in discount.
The anticipated holding period for stock. Anticipated holding period is unknown but management has indicated that it has attempted to market the subject company. If the subject company is not sold in the next few years the holding period is likely to be about 5 to 10 years. This factor decreases the marketability discount
The company’s redemption policy No specific redemption policy in place. This factor increases the marketability discount.
Likelihood of going public and the costs associated with making a public offering.
Sample Company is a small closely‐held company and public offering does not appear to be likely in the future. This increases the discount.
The most important factor is the history of distributions of earnings to the shareholders. This
factor is important to attracting investors for a minority interest in the subject company.
However, the right of first refusal, the lack of control in the subject interest, the anticipated
holding period and the small chance of going public reduce the impact of the factors that
reduce the marketability of the stock including the distributions.
Next, we analyze empirical evidence to determine benchmarks in which we apply the above
analysis and determine a discount specific to the subject company. One method of determining
the discount is the analysis of two traditional sources of empirical evidence of marketability
discounts applicable to closely‐held securities as follows:
Studies of transactions comparing the prices before companies made public offerings with the prices after public offerings.
Studies of transactions comparing the prices of restricted "letter" stock of publicly‐traded companies with the prices of the related freely traded shares.
We use two databases that have compiled data on these two types of transactions to assist in
determining an appropriate discount for the subject interest. For IPO transactions we use a
database by Valuation Advisors and for restricted stock transactions we use FMV’s Restricted
Stock Study. The following criteria were used to search each database.
SIC Code Manufacturing Industries 2000‐3999 Revenue Less than $150 million
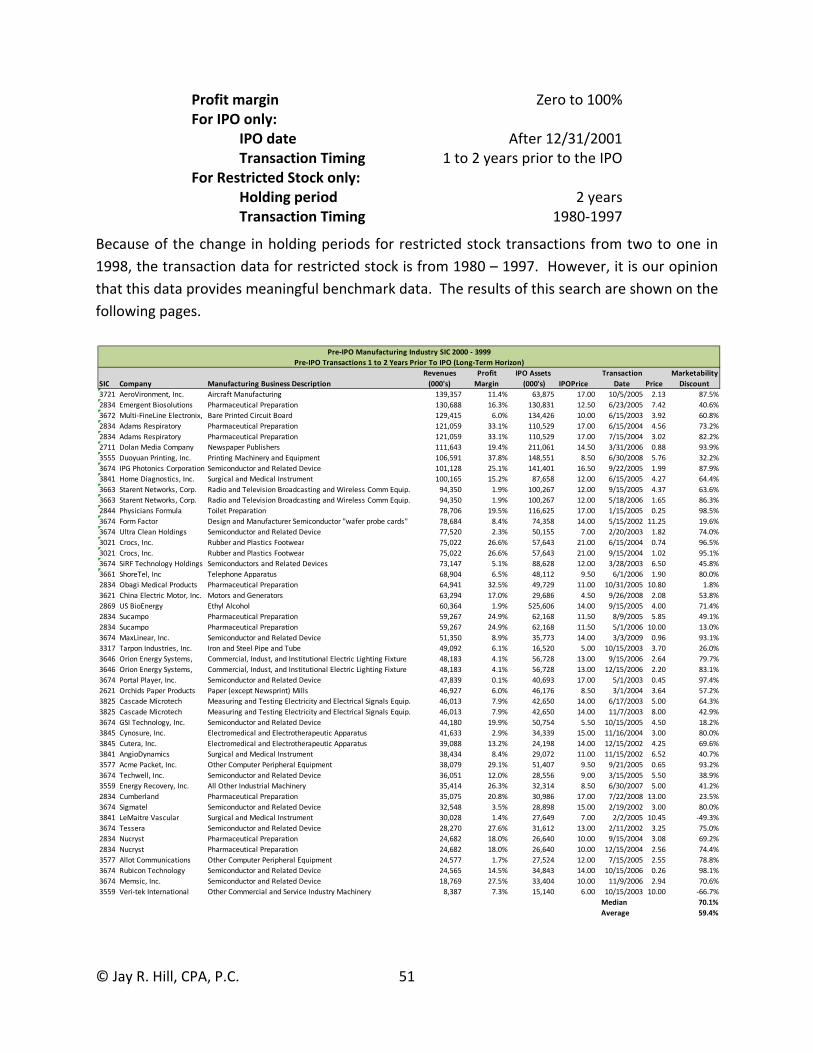
© Jay R. Hill, CPA, P.C. 51
Profit margin Zero to 100% For IPO only: IPO date After 12/31/2001 Transaction Timing 1 to 2 years prior to the IPO For Restricted Stock only: Holding period 2 years Transaction Timing 1980‐1997
Because of the change in holding periods for restricted stock transactions from two to one in
1998, the transaction data for restricted stock is from 1980 – 1997. However, it is our opinion
that this data provides meaningful benchmark data. The results of this search are shown on the
following pages.
Pre‐IPO Transactions 1 to 2 Years Prior To IPO (Long‐Term Horizon)
Revenues Profit IPO Assets Transaction Marketability
SIC Company Manufacturing Business Description (000's) Margin (000's) IPOPrice Date Price Discount
3721 AeroVironment, Inc. Aircraft Manufacturing 139,357 11.4% 63,875 17.00 10/5/2005 2.13 87.5%
2834 Emergent Biosolutions Pharmaceutical Preparation 130,688 16.3% 130,831 12.50 6/23/2005 7.42 40.6%
3672 Multi‐FineLine Electronix, Bare Printed Circuit Board 129,415 6.0% 134,426 10.00 6/15/2003 3.92 60.8%
2834 Adams Respiratory Pharmaceutical Preparation 121,059 33.1% 110,529 17.00 6/15/2004 4.56 73.2%
2834 Adams Respiratory Pharmaceutical Preparation 121,059 33.1% 110,529 17.00 7/15/2004 3.02 82.2%
2711 Dolan Media Company Newspaper Publishers 111,643 19.4% 211,061 14.50 3/31/2006 0.88 93.9%
3555 Duoyuan Printing, Inc. Printing Machinery and Equipment 106,591 37.8% 148,551 8.50 6/30/2008 5.76 32.2%
3674 IPG Photonics Corporation Semiconductor and Related Device 101,128 25.1% 141,401 16.50 9/22/2005 1.99 87.9%
3841 Home Diagnostics, Inc. Surgical and Medical Instrument 100,165 15.2% 87,658 12.00 6/15/2005 4.27 64.4%
3663 Starent Networks, Corp. Radio and Television Broadcasting and Wireless Comm Equip. 94,350 1.9% 100,267 12.00 9/15/2005 4.37 63.6%
3663 Starent Networks, Corp. Radio and Television Broadcasting and Wireless Comm Equip. 94,350 1.9% 100,267 12.00 5/18/2006 1.65 86.3%
2844 Physicians Formula Toilet Preparation 78,706 19.5% 116,625 17.00 1/15/2005 0.25 98.5%
3674 Form Factor Design and Manufacturer Semiconductor "wafer probe cards" 78,684 8.4% 74,358 14.00 5/15/2002 11.25 19.6%
3674 Ultra Clean Holdings Semiconductor and Related Device 77,520 2.3% 50,155 7.00 2/20/2003 1.82 74.0%
3021 Crocs, Inc. Rubber and Plastics Footwear 75,022 26.6% 57,643 21.00 6/15/2004 0.74 96.5%
3021 Crocs, Inc. Rubber and Plastics Footwear 75,022 26.6% 57,643 21.00 9/15/2004 1.02 95.1%
3674 SiRF Technology Holdings Semiconductors and Related Devices 73,147 5.1% 88,628 12.00 3/28/2003 6.50 45.8%
3661 ShoreTel, Inc Telephone Apparatus 68,904 6.5% 48,112 9.50 6/1/2006 1.90 80.0%
2834 Obagi Medical Products Pharmaceutical Preparation 64,941 32.5% 49,729 11.00 10/31/2005 10.80 1.8%
3621 China Electric Motor, Inc. Motors and Generators 63,294 17.0% 29,686 4.50 9/26/2008 2.08 53.8%
2869 US BioEnergy Ethyl Alcohol 60,364 1.9% 525,606 14.00 9/15/2005 4.00 71.4%
2834 Sucampo Pharmaceutical Preparation 59,267 24.9% 62,168 11.50 8/9/2005 5.85 49.1%
2834 Sucampo Pharmaceutical Preparation 59,267 24.9% 62,168 11.50 5/1/2006 10.00 13.0%
3674 MaxLinear, Inc. Semiconductor and Related Device 51,350 8.9% 35,773 14.00 3/3/2009 0.96 93.1%
3317 Tarpon Industries, Inc. Iron and Steel Pipe and Tube 49,092 6.1% 16,520 5.00 10/15/2003 3.70 26.0%
3646 Orion Energy Systems, Commercial, Indust, and Institutional Electric Lighting Fixture 48,183 4.1% 56,728 13.00 9/15/2006 2.64 79.7%
3646 Orion Energy Systems, Commercial, Indust, and Institutional Electric Lighting Fixture 48,183 4.1% 56,728 13.00 12/15/2006 2.20 83.1%
3674 Portal Player, Inc. Semiconductor and Related Device 47,839 0.1% 40,693 17.00 5/1/2003 0.45 97.4%
2621 Orchids Paper Products Paper (except Newsprint) Mills 46,927 6.0% 46,176 8.50 3/1/2004 3.64 57.2%
3825 Cascade Microtech Measuring and Testing Electricity and Electrical Signals Equip. 46,013 7.9% 42,650 14.00 6/17/2003 5.00 64.3%
3825 Cascade Microtech Measuring and Testing Electricity and Electrical Signals Equip. 46,013 7.9% 42,650 14.00 11/7/2003 8.00 42.9%
3674 GSI Technology, Inc. Semiconductor and Related Device 44,180 19.9% 50,754 5.50 10/15/2005 4.50 18.2%
3845 Cynosure, Inc. Electromedical and Electrotherapeutic Apparatus 41,633 2.9% 34,339 15.00 11/16/2004 3.00 80.0%
3845 Cutera, Inc. Electromedical and Electrotherapeutic Apparatus 39,088 13.2% 24,198 14.00 12/15/2002 4.25 69.6%
3841 AngioDynamics Surgical and Medical Instrument 38,434 8.4% 29,072 11.00 11/15/2002 6.52 40.7%
3577 Acme Packet, Inc. Other Computer Peripheral Equipment 38,079 29.1% 51,407 9.50 9/21/2005 0.65 93.2%
3674 Techwell, Inc. Semiconductor and Related Device 36,051 12.0% 28,556 9.00 3/15/2005 5.50 38.9%
3559 Energy Recovery, Inc. All Other Industrial Machinery 35,414 26.3% 32,314 8.50 6/30/2007 5.00 41.2%
2834 Cumberland Pharmaceutical Preparation 35,075 20.8% 30,986 17.00 7/22/2008 13.00 23.5%
3674 Sigmatel Semiconductor and Related Device 32,548 3.5% 28,898 15.00 2/19/2002 3.00 80.0%
3841 LeMaitre Vascular Surgical and Medical Instrument 30,028 1.4% 27,649 7.00 2/2/2005 10.45 ‐49.3%
3674 Tessera Semiconductor and Related Device 28,270 27.6% 31,612 13.00 2/11/2002 3.25 75.0%
2834 Nucryst Pharmaceutical Preparation 24,682 18.0% 26,640 10.00 9/15/2004 3.08 69.2%
2834 Nucryst Pharmaceutical Preparation 24,682 18.0% 26,640 10.00 12/15/2004 2.56 74.4%
3577 Allot Communications Other Computer Peripheral Equipment 24,577 1.7% 27,524 12.00 7/15/2005 2.55 78.8%
3674 Rubicon Technology Semiconductor and Related Device 24,565 14.5% 34,843 14.00 10/15/2006 0.26 98.1%
3674 Memsic, Inc. Semiconductor and Related Device 18,769 27.5% 33,404 10.00 11/9/2006 2.94 70.6%
3559 Veri‐tek International Other Commercial and Service Industry Machinery 8,387 7.3% 15,140 6.00 10/15/2003 10.00 ‐66.7%
Median 70.1%
Average 59.4%
Pre‐IPO Manufacturing Industry SIC 2000 ‐ 3999
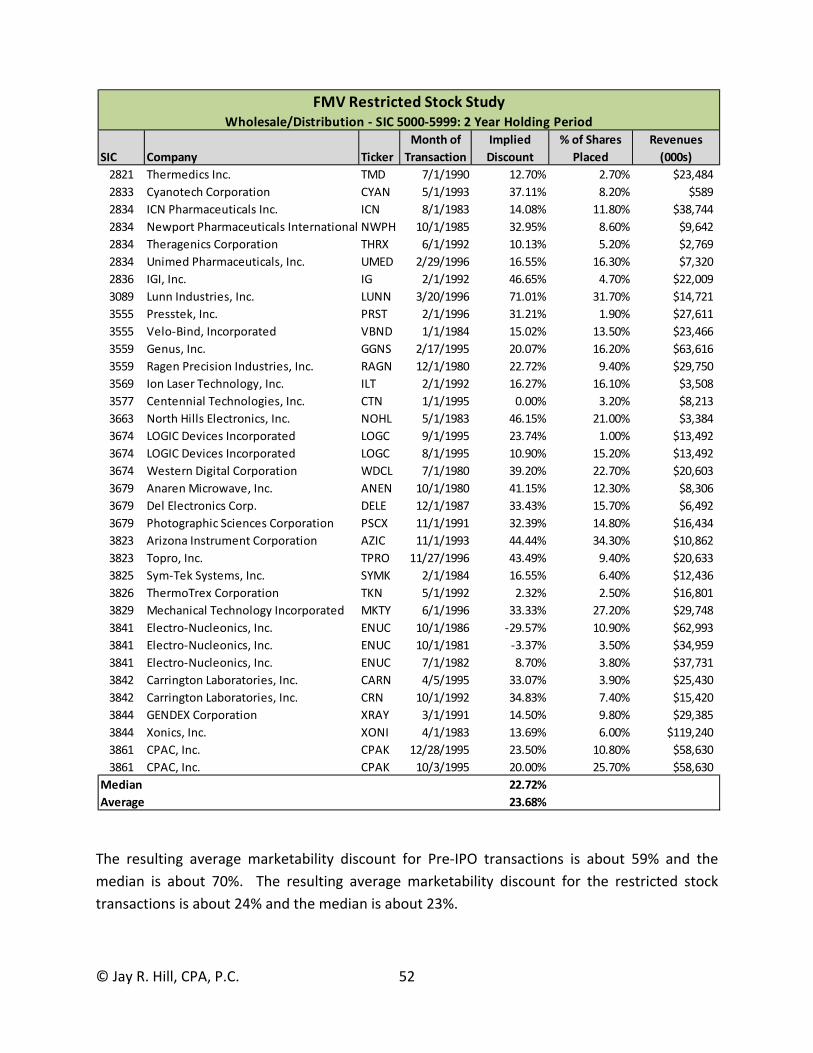
© Jay R. Hill, CPA, P.C. 52
The resulting average marketability discount for Pre‐IPO transactions is about 59% and the
median is about 70%. The resulting average marketability discount for the restricted stock
transactions is about 24% and the median is about 23%.
FMV Restricted Stock StudyWholesale/Distribution ‐ SIC 5000‐5999: 2 Year Holding Period
SIC Company Ticker
Month of
Transaction
Implied
Discount
% of Shares
Placed
Revenues
(000s)
2821 Thermedics Inc. TMD 7/1/1990 12.70% 2.70% $23,484
2833 Cyanotech Corporation CYAN 5/1/1993 37.11% 8.20% $589
2834 ICN Pharmaceuticals Inc. ICN 8/1/1983 14.08% 11.80% $38,744
2834 Newport Pharmaceuticals International NWPH 10/1/1985 32.95% 8.60% $9,642
2834 Theragenics Corporation THRX 6/1/1992 10.13% 5.20% $2,769
2834 Unimed Pharmaceuticals, Inc. UMED 2/29/1996 16.55% 16.30% $7,320
2836 IGI, Inc. IG 2/1/1992 46.65% 4.70% $22,009
3089 Lunn Industries, Inc. LUNN 3/20/1996 71.01% 31.70% $14,721
3555 Presstek, Inc. PRST 2/1/1996 31.21% 1.90% $27,611
3555 Velo‐Bind, Incorporated VBND 1/1/1984 15.02% 13.50% $23,466
3559 Genus, Inc. GGNS 2/17/1995 20.07% 16.20% $63,616
3559 Ragen Precision Industries, Inc. RAGN 12/1/1980 22.72% 9.40% $29,750
3569 Ion Laser Technology, Inc. ILT 2/1/1992 16.27% 16.10% $3,508
3577 Centennial Technologies, Inc. CTN 1/1/1995 0.00% 3.20% $8,213
3663 North Hills Electronics, Inc. NOHL 5/1/1983 46.15% 21.00% $3,384
3674 LOGIC Devices Incorporated LOGC 9/1/1995 23.74% 1.00% $13,492
3674 LOGIC Devices Incorporated LOGC 8/1/1995 10.90% 15.20% $13,492
3674 Western Digital Corporation WDCL 7/1/1980 39.20% 22.70% $20,603
3679 Anaren Microwave, Inc. ANEN 10/1/1980 41.15% 12.30% $8,306
3679 Del Electronics Corp. DELE 12/1/1987 33.43% 15.70% $6,492
3679 Photographic Sciences Corporation PSCX 11/1/1991 32.39% 14.80% $16,434
3823 Arizona Instrument Corporation AZIC 11/1/1993 44.44% 34.30% $10,862
3823 Topro, Inc. TPRO 11/27/1996 43.49% 9.40% $20,633
3825 Sym‐Tek Systems, Inc. SYMK 2/1/1984 16.55% 6.40% $12,436
3826 ThermoTrex Corporation TKN 5/1/1992 2.32% 2.50% $16,801
3829 Mechanical Technology Incorporated MKTY 6/1/1996 33.33% 27.20% $29,748
3841 Electro‐Nucleonics, Inc. ENUC 10/1/1986 ‐29.57% 10.90% $62,993
3841 Electro‐Nucleonics, Inc. ENUC 10/1/1981 ‐3.37% 3.50% $34,959
3841 Electro‐Nucleonics, Inc. ENUC 7/1/1982 8.70% 3.80% $37,731
3842 Carrington Laboratories, Inc. CARN 4/5/1995 33.07% 3.90% $25,430
3842 Carrington Laboratories, Inc. CRN 10/1/1992 34.83% 7.40% $15,420
3844 GENDEX Corporation XRAY 3/1/1991 14.50% 9.80% $29,385
3844 Xonics, Inc. XONI 4/1/1983 13.69% 6.00% $119,240
3861 CPAC, Inc. CPAK 12/28/1995 23.50% 10.80% $58,630
3861 CPAC, Inc. CPAK 10/3/1995 20.00% 25.70% $58,630
Median 22.72%
Average 23.68%
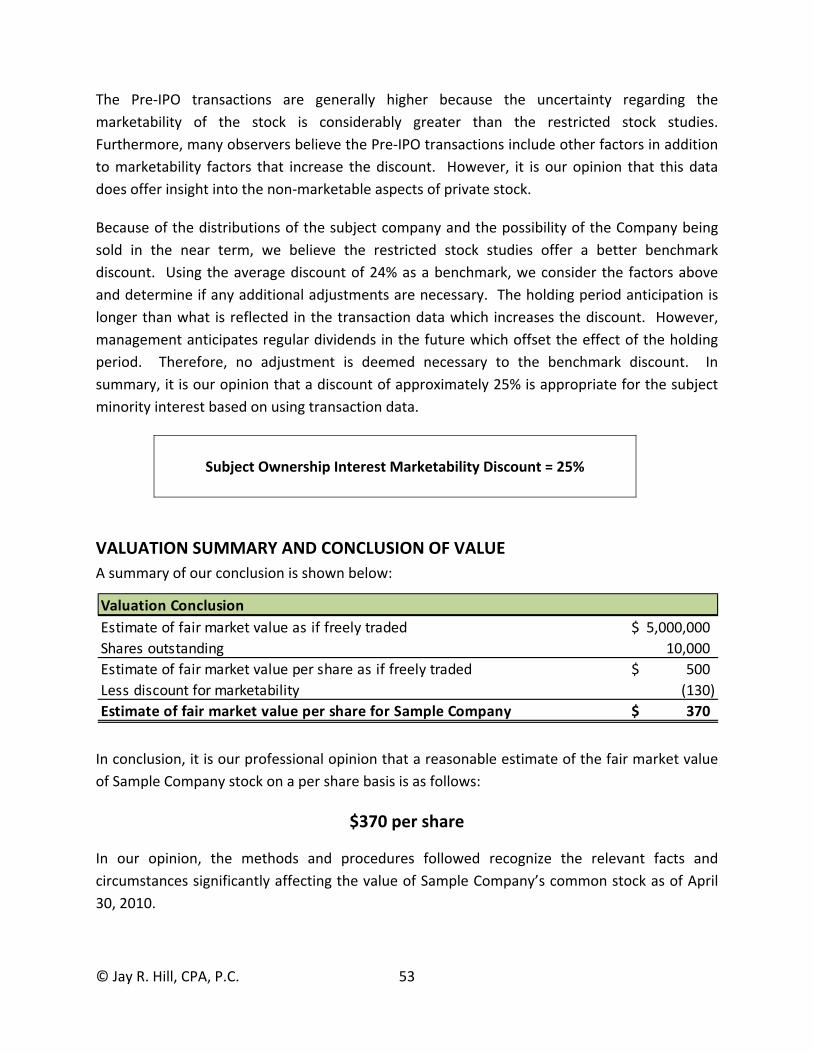
© Jay R. Hill, CPA, P.C. 53
The Pre‐IPO transactions are generally higher because the uncertainty regarding the
marketability of the stock is considerably greater than the restricted stock studies.
Furthermore, many observers believe the Pre‐IPO transactions include other factors in addition
to marketability factors that increase the discount. However, it is our opinion that this data
does offer insight into the non‐marketable aspects of private stock.
Because of the distributions of the subject company and the possibility of the Company being
sold in the near term, we believe the restricted stock studies offer a better benchmark
discount. Using the average discount of 24% as a benchmark, we consider the factors above
and determine if any additional adjustments are necessary. The holding period anticipation is
longer than what is reflected in the transaction data which increases the discount. However,
management anticipates regular dividends in the future which offset the effect of the holding
period. Therefore, no adjustment is deemed necessary to the benchmark discount. In
summary, it is our opinion that a discount of approximately 25% is appropriate for the subject
minority interest based on using transaction data.
Subject Ownership Interest Marketability Discount = 25%
VALUATION SUMMARY AND CONCLUSION OF VALUE
A summary of our conclusion is shown below:
In conclusion, it is our professional opinion that a reasonable estimate of the fair market value
of Sample Company stock on a per share basis is as follows:
$370 per share
In our opinion, the methods and procedures followed recognize the relevant facts and
circumstances significantly affecting the value of Sample Company’s common stock as of April
30, 2010.
Valuation Conclusion
Estimate of fair market value as if freely traded 5,000,000$
Shares outstanding 10,000
Estimate of fair market value per share as if freely traded 500$
Less discount for marketability (130)
Estimate of fair market value per share for Sample Company 370$
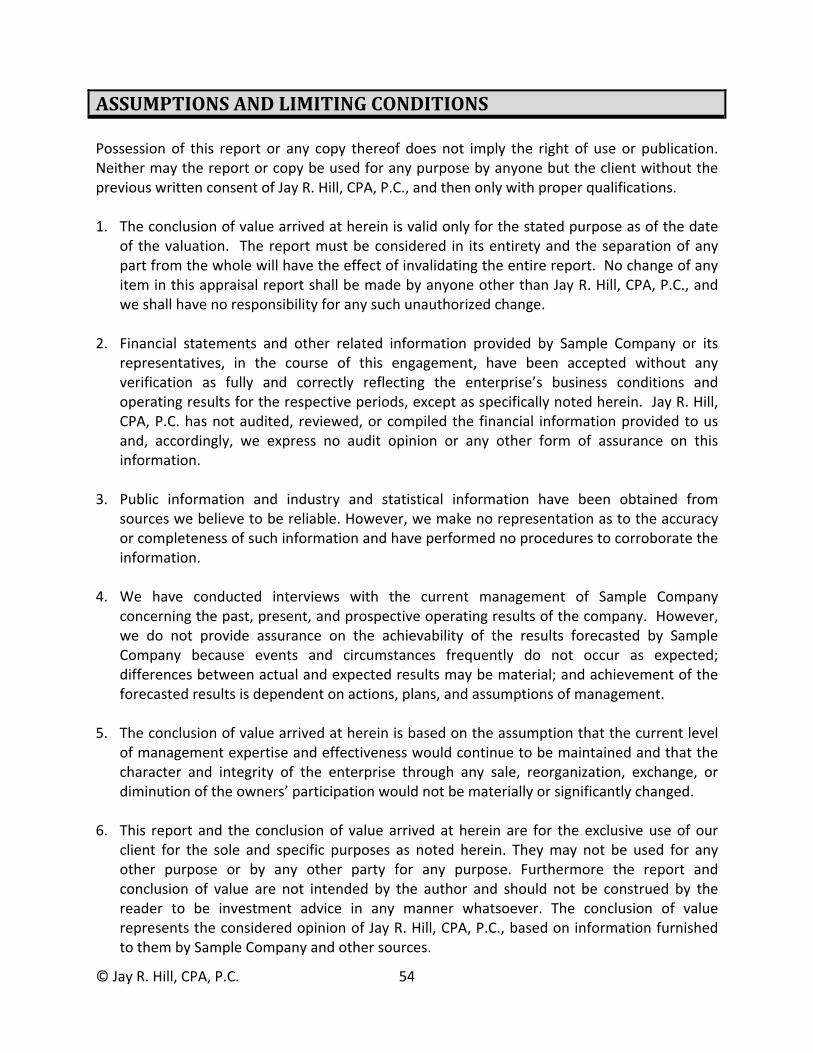
© Jay R. Hill, CPA, P.C. 54
ASSUMPTIONS AND LIMITING CONDITIONS Possession of this report or any copy thereof does not imply the right of use or publication. Neither may the report or copy be used for any purpose by anyone but the client without the previous written consent of Jay R. Hill, CPA, P.C., and then only with proper qualifications. 1. The conclusion of value arrived at herein is valid only for the stated purpose as of the date
of the valuation. The report must be considered in its entirety and the separation of any part from the whole will have the effect of invalidating the entire report. No change of any item in this appraisal report shall be made by anyone other than Jay R. Hill, CPA, P.C., and we shall have no responsibility for any such unauthorized change.
2. Financial statements and other related information provided by Sample Company or its representatives, in the course of this engagement, have been accepted without any verification as fully and correctly reflecting the enterprise’s business conditions and operating results for the respective periods, except as specifically noted herein. Jay R. Hill, CPA, P.C. has not audited, reviewed, or compiled the financial information provided to us and, accordingly, we express no audit opinion or any other form of assurance on this information.
3. Public information and industry and statistical information have been obtained from sources we believe to be reliable. However, we make no representation as to the accuracy or completeness of such information and have performed no procedures to corroborate the information.
4. We have conducted interviews with the current management of Sample Company concerning the past, present, and prospective operating results of the company. However, we do not provide assurance on the achievability of the results forecasted by Sample Company because events and circumstances frequently do not occur as expected; differences between actual and expected results may be material; and achievement of the forecasted results is dependent on actions, plans, and assumptions of management.
5. The conclusion of value arrived at herein is based on the assumption that the current level of management expertise and effectiveness would continue to be maintained and that the character and integrity of the enterprise through any sale, reorganization, exchange, or diminution of the owners’ participation would not be materially or significantly changed.
6. This report and the conclusion of value arrived at herein are for the exclusive use of our
client for the sole and specific purposes as noted herein. They may not be used for any other purpose or by any other party for any purpose. Furthermore the report and conclusion of value are not intended by the author and should not be construed by the reader to be investment advice in any manner whatsoever. The conclusion of value represents the considered opinion of Jay R. Hill, CPA, P.C., based on information furnished to them by Sample Company and other sources.

© Jay R. Hill, CPA, P.C. 55
7. Neither all nor any part of the contents of this report (especially the conclusion of value, the
identity of any valuation specialist(s), or the firm with which such valuation specialists are connected or any reference to any of their professional designations) should be disseminated to the public through advertising media, public relations, news media, sales media, mail, direct transmittal, or any other means of communication, including but not limited to the Securities and Exchange Commission or other governmental agency or regulatory body, without the prior written consent and approval of Jay R. Hill, CPA, P.C.
8. Future services regarding the subject matter of this report, including, but not limited to testimony or attendance in court, shall not be required of Jay R. Hill, CPA, P.C. or Jay R. Hill unless previous arrangements have been made in writing.
9. Jay R. Hill, CPA, P.C. is not an environmental consultant or auditor, and it takes no responsibility for any actual or potential environmental liabilities. Any person entitled to rely on this report, wishing to know whether such liabilities exist, or the scope and their effect on the value of the property, is encouraged to obtain a professional environmental assessment. Jay R. Hill, CPA, P.C. does not conduct or provide environmental assessments and has not performed one for the subject property.
10. Jay R. Hill, CPA, P.C. has not determined independently whether Sample Company is subject to any present or future liability relating to environmental matters (including, but not limited to CERCLA/Superfund liability) or the scope of any such liabilities. Jay R. Hill, CPA, P.C.’s valuation takes no such liabilities into account, except as they have been reported to Jay R. Hill, CPA, P.C. by Sample Company or by an environmental consultant working for Sample Company, and then only to the extent that the liability was reported to us in an actual or estimated dollar amount. Such matters, if any, are noted in the report. To the extent such information has been reported to us, Jay R. Hill, CPA, P.C. has relied on it without verification and offers no warranty or representation as to its accuracy or completeness.
11. Jay R. Hill, CPA, P.C. has not made a specific compliance survey or analysis of the subject property to determine whether it is subject to, or in compliance with, the American Disabilities Act of 1990, and this valuation does not consider the effect, if any, of noncompliance.
12. Unless otherwise stated, no effort has been made to determine the possible effect, if any, on the subject business due to future Federal, state, or local legislation, including any environmental or ecological matters or interpretations thereof.
13. If prospective financial information approved by management has been used in our work, we have not examined or compiled the prospective financial information and therefore, do not express an audit opinion or any other form of assurance on the prospective financial information or the related assumptions. Events and circumstances frequently do not occur

© Jay R. Hill, CPA, P.C. 56
as expected, and there will usually be differences between prospective financial information and actual results, and those differences may be material.
14. Except as noted, we have relied on the representations of the owners, management, and
other third parties concerning the value and useful condition of all equipment, real estate, investments used in the business, and any other assets or liabilities, except as specifically stated to the contrary in this report. We have not attempted to confirm whether or not all assets of the business are free and clear of liens and encumbrances or that the entity has good title to all assets.

Exhibit A
© Jay R. Hill, CPA, P.C. 57
DOCUMENTS ANALYZED AND UTILIZED Subject company’s documents:
Corporate tax returns, December 31, 2005 through December 31, 2009 Accounts receivable and accounts payable aging schedules Ownership summary Fixed asset listing Related party leases By‐Laws and Articles of Incorporation Organizational chart Revenue by customer Product list Management team description Other pertinent information per interview
Market and industry data: As cited in report
Exhibit B
© Jay R. Hill, CPA, P.C. 58
QUALIFICATIONS OF VALUATOR
This valuation report is prepared by Jay R. Hill, CPA, P.C., a Certified Public Accounting firm which conducts valuation studies of closely‐held corporations for income, gift and estate tax planning, buy/sell agreements, mergers/acquisitions/divestitures, expert witness testimony, Employee Stock Ownership Plans and other related purposes.
Jay R. Hill, CPA, ABV Jay R. Hill, CPA, ABV is a certified public accountant and accredited in business valuation. He has over 22 years of business valuation and related services experience and is President of Jay R. Hill, CPA, P.C. He earned a Bachelor of Arts degree in Political Science in 1984 and a Bachelor of Science degree in Business Administration in 1985 from the University of Kansas. He completed additional undergraduate courses in accounting from the University of Missouri‐Kansas City and Rockhurst University. In addition, he is a candidate member of the American Society of Appraisers.
INDEPENDENCE OF VALUATOR
Neither Jay R. Hill, CPA, P.C., nor the individuals involved with this valuation have a present, prospective or contemplated interest in the business discussed in this report. Further, the compensation and employment for this valuation were not contingent upon the conclusions stated.

Exhibit C
© Jay R. Hill, CPA, P.C. 59
NOTE: Exhibit C data omitted to condense sample report