![Cough severity and quality of life assessment in acute ... · the European Medicines Agency (EMA) as a quality of life assessment instrument [10]. As a validated instrument to assess](https://static.fdocuments.us/doc/165x107/5f30370980a5631bcd1a8c55/cough-severity-and-quality-of-life-assessment-in-acute-the-european-medicines.jpg)
Validation of a self-report instrument to assess social ... of a self-report instrument to assess...
20
Validation of a self-rep Califo ABSTRACT The current study, using a validity of the Social Emotional D education. Although there are a m of emotional intelligence (EI), ve developmental path of social emo prior validity studies with these m and discriminant analyses assesse SED-I is a reliable, robust and co emotional competency changes. L discussed. Keywords: social, emotional, co Research in Higher E Validation social emotional deve port instrument to assess social and development Craig R. Seal ornia State University, San Bernardino Kenneth L. Beauchamp University of the Pacific Krystal Miguel Claremont Graduate University Amy N. Scott University of the Pacific Stefanie E. Naumann University of the Pacific Qingwen Dong University of the Pacific Suzanne Galal University of the Pacific a factor level analysis approach, provides eviden Development Instrument (SED-I) for students in multitude of models and measures that borrow fr ery few current instruments focus exclusively on otional competence development for young adul measures fail to include a full spectrum of poten ed at the factor level. This validation study sugg omprehensive measurement for assessing college Limitations and suggestions for future research ompetence, development, validation Education Journal elopment, Page 1 d emotional nce of the n higher rom the premise n a lts. In addition, ntial convergent gests that the e students’ social are also
Transcript of Validation of a self-report instrument to assess social ... of a self-report instrument to assess...
Validation of a self-report instrument to assess social and emotional
California State University, San Bernardino
ABSTRACT
The current study, using a factor level analysis approach,
validity of the Social Emotional Development Instrument (SED
education. Although there are a multitude of models and measures that borrow from the premise
of emotional intelligence (EI), very few current instruments focus exclusiv
developmental path of social emotional competenc
prior validity studies with these measures fail to include a full spectrum of potential convergent
and discriminant analyses assessed at the factor level.
SED-I is a reliable, robust and comprehensive measurement for assessing college students’ social
emotional competency changes. Limitation
discussed.
Keywords: social, emotional, competence, development, validation
Research in Higher Education Journal
Validation social emotional development, Page
report instrument to assess social and emotional
development
Craig R. Seal
California State University, San Bernardino
Kenneth L. Beauchamp
University of the Pacific
Krystal Miguel
Claremont Graduate University
Amy N. Scott
University of the Pacific
Stefanie E. Naumann
University of the Pacific
Qingwen Dong
University of the Pacific
Suzanne Galal
University of the Pacific
The current study, using a factor level analysis approach, provides evidence of the
Social Emotional Development Instrument (SED-I) for students in
Although there are a multitude of models and measures that borrow from the premise
of emotional intelligence (EI), very few current instruments focus exclusively on a
developmental path of social emotional competence development for young adults.
prior validity studies with these measures fail to include a full spectrum of potential convergent
assessed at the factor level. This validation study suggests that the
I is a reliable, robust and comprehensive measurement for assessing college students’ social
emotional competency changes. Limitations and suggestions for future research are also
emotional, competence, development, validation
Research in Higher Education Journal
Validation social emotional development, Page 1
report instrument to assess social and emotional
provides evidence of the
students in higher
Although there are a multitude of models and measures that borrow from the premise
ely on a
development for young adults. In addition,
prior validity studies with these measures fail to include a full spectrum of potential convergent
This validation study suggests that the
I is a reliable, robust and comprehensive measurement for assessing college students’ social
and suggestions for future research are also
INTRODUCTION
Although there are a multitude of models and measures that borrow from the premise of
emotional intelligence (EI), there are no current instruments that focus exclusively on a
developmental path of social emotional competence development for
education. The purpose of this paper is to
social emotional competence development that has emerged in the literature (
Scott, & Royce-Davis, 2011a; Seal, Beauchamp, Miguel, & Scott, 2011
Emotional Development Inventory (SED
potential utility of the new instrument,
various emotional/social assessments.
EI measures with other assessments
sub-factor levels. Previous studies typically
defaulting to comparing total scores with one another.
current paper is the integration of multiple measures focusing on factor level analys
pre-defined framework of a priori hypotheses. The paper demonstrates the valid use of the SED
self-report assessment as one of a series of developmental tools available
education to better assess student
providing validation for the SED
competence development, the related soft skills measures, and a series of sub
examine the convergent and disc
instruments.
Emotional Intelligence
In general, EI may be defined as the overlap between emotion and intelligence, or more
simply, the intelligent use of emotions.
emotions, emotional quotient (EQ) refers specifically to the
On (1988), emotional ability (EA) refers to the underlying potential of EI as advocated by
Salovey and Mayer (1990), and emotional competency (EC) refers to the EI skills related to
superior performance as advocated by Goleman (1995; 1998).
a constellation of capacities, patterns, and behaviors to recognize and regulate
self and others toward successful environmental adaptation
Social Emotional Competence Development
Social emotional competence development
social and emotional intelligence theories toward the practice of student de
education. The model is primarily an outgrowth of the emotional social competence
developed by Boyatzis and Goleman (Boyatzis, Stubbs, & Taylor, 2002; Goleman, Boyatzis, &
McKee, 2002). Their model was
(SAQ), developed by Boyatzis (1994) which
In contrast, the SED-I items were
groups geared toward tapping underlying competences ascribed to college academic, relational,
and career success (Seal et al., 2011a)
Research in Higher Education Journal
Validation social emotional development, Page
Although there are a multitude of models and measures that borrow from the premise of
emotional intelligence (EI), there are no current instruments that focus exclusively on a
ath of social emotional competence development for students in higher
The purpose of this paper is to provide evidence of the validity of a new measure of
social emotional competence development that has emerged in the literature (Seal, Naumann,
; Seal, Beauchamp, Miguel, & Scott, 2011b), called the
nventory (SED-I). This paper provides an empirical eviden
new instrument, as well as an in-depth analysis of the relationships
emotional/social assessments. There are few validity studies that have compared
other assessments and even fewer have examined constructs at the factor and
evious studies typically fail to examine constructs at the factor level
otal scores with one another. Therefore, a key contribution of the
current paper is the integration of multiple measures focusing on factor level analys
defined framework of a priori hypotheses. The paper demonstrates the valid use of the SED
report assessment as one of a series of developmental tools available for educators in higher
education to better assess student knowledge, traits and behaviors. To accomplish the goal of
D-I, this paper provides an overview of social emotional
competence development, the related soft skills measures, and a series of sub-studies that
discriminant relationships between the SED-I and relevant, related
In general, EI may be defined as the overlap between emotion and intelligence, or more
e intelligent use of emotions. EI is the overall term reflecting the intelligent use of
emotions, emotional quotient (EQ) refers specifically to the emotional traits as advocated by
), emotional ability (EA) refers to the underlying potential of EI as advocated by
d Mayer (1990), and emotional competency (EC) refers to the EI skills related to
ated by Goleman (1995; 1998). Specifically, EI may be defined as
a constellation of capacities, patterns, and behaviors to recognize and regulate the emotions of
self and others toward successful environmental adaptation (Seal & Andrews-Brown, 2010).
Social Emotional Competence Development
Social emotional competence development (SECD) emerged from the integration of
intelligence theories toward the practice of student development in higher
The model is primarily an outgrowth of the emotional social competence
developed by Boyatzis and Goleman (Boyatzis, Stubbs, & Taylor, 2002; Goleman, Boyatzis, &
derived heavily from the Self-Assessment Questionnaire
), developed by Boyatzis (1994) which focuses on business managers and MBA students
ere developed using undergraduate and graduate level
underlying competences ascribed to college academic, relational,
(Seal et al., 2011a).
Research in Higher Education Journal
Validation social emotional development, Page 2
Although there are a multitude of models and measures that borrow from the premise of
emotional intelligence (EI), there are no current instruments that focus exclusively on a
students in higher
a new measure of
Seal, Naumann,
, called the Social
evidence of the
depth analysis of the relationships with
that have compared multiple
and even fewer have examined constructs at the factor and
fail to examine constructs at the factor level, often
Therefore, a key contribution of the
current paper is the integration of multiple measures focusing on factor level analysis, within a
defined framework of a priori hypotheses. The paper demonstrates the valid use of the SED-I
for educators in higher
To accomplish the goal of
an overview of social emotional
studies that
I and relevant, related
In general, EI may be defined as the overlap between emotion and intelligence, or more
EI is the overall term reflecting the intelligent use of
emotional traits as advocated by Bar-
), emotional ability (EA) refers to the underlying potential of EI as advocated by
d Mayer (1990), and emotional competency (EC) refers to the EI skills related to
Specifically, EI may be defined as
the emotions of
Brown, 2010).
emerged from the integration of
velopment in higher
The model is primarily an outgrowth of the emotional social competence model
developed by Boyatzis and Goleman (Boyatzis, Stubbs, & Taylor, 2002; Goleman, Boyatzis, &
Assessment Questionnaire
on business managers and MBA students.
level focus
underlying competences ascribed to college academic, relational,
SECD is defined as the enhancement of personal capacity to manage environmental
challenges. The concept is a consequence of the application of social intelligence, emotional
intelligence, and competence research toward higher education development. The conceptual
model encompasses four primary factors (Seal et al., 2011a): Self
understanding of your emotions and aptitudes
and situation before thinking and acting
rapport and closeness with others
opportunities and move others toward change
develop their capacity to understand themselves, consider the world around them, build
meaningful relationships, and foster positive changes will have
academic, relational, and career challenges
The model and measure are best used
identifying key strengths and limitations
The SECD model is measured using the SED
style questions asking the test-taker to indicate how often a particular question relates to them (1
= very rarely; 7 = very often). Each of the four factors is
survey instrument. In assessing Self
asked “how often that statement is true of you
Orientation factors use the prompt “
true of you.” The SED-I demonstrated adequate internal consistency (
population of freshman (Seal et al., 2011b).
against other, similar types of instruments using an expanded sample population in order to
validate the tool.
Alternative Measures of Soft Skills
One of the major concerns regarding measures of soft skills
relationships between people), particularity those that have emerged from the literature on EI
the lack of robust, comprehensive validity studies that incorporate multiple measures of EI, as
well as personality and other related constructs, and examine instruments at the factor level
(rather than just comparing total scores).
two prominent measures of EI as well as measures of personality, emotions, self
social desirability. These six soft skills assessments are leading measures in the fields of
psychology, education, and management
Mayer-Salovey-Caruso Emotional Intelligence Test 2.0 (MSCEIT 2.0)
Salovey and Mayer (1990) defined EI as “the subset o
the ability to monitor one’s own and others’ feelings and emotions, to discriminate among them
and to use this information to guide one’s t
emerged from the literature on social intelligence with a focus on how emotions facilitate
thought using an instrument that had right and wrong answers (
normed scoring). Generally, emotional ability is the potential capacity to understand and explain
emotions and to use that knowledge to improve decision making.
The MSCEIT uses four branch scores: (1)
which the respondent can identify emotion in himself or herself and others; (2)
Research in Higher Education Journal
Validation social emotional development, Page
the enhancement of personal capacity to manage environmental
consequence of the application of social intelligence, emotional
intelligence, and competence research toward higher education development. The conceptual
model encompasses four primary factors (Seal et al., 2011a): Self-awareness (knowledge and
ing of your emotions and aptitudes), Consideration of Others (regard for the person
and situation before thinking and acting), Connection to Others (ease and effort in developing
rapport and closeness with others), and Influence Orientation (propensity to seek leadership
opportunities and move others toward change). The assumption of SECD is that s
develop their capacity to understand themselves, consider the world around them, build
meaningful relationships, and foster positive changes will have an advantage in meeting
academic, relational, and career challenges (Kuh, Kinzie, Schuh, Whit, & Associates, 2010)
The model and measure are best used in conjunction with other developmental tools to assist in
s and limitations of students.
The SECD model is measured using the SED-I which includes 48 self-reported Likert
taker to indicate how often a particular question relates to them (1
Each of the four factors is linked to 12 of the questions on the
survey instrument. In assessing Self-awareness and Consideration of Others, the question is
“how often that statement is true of you,” while Connection to Others and Influence
Orientation factors use the prompt “predict how often your friends would say that statement is
I demonstrated adequate internal consistency (r = .91) with a university
freshman (Seal et al., 2011b). However, the instrument needs to be assessed
er, similar types of instruments using an expanded sample population in order to
Alternative Measures of Soft Skills
One of the major concerns regarding measures of soft skills (e.g., skills that focus on
, particularity those that have emerged from the literature on EI
the lack of robust, comprehensive validity studies that incorporate multiple measures of EI, as
lated constructs, and examine instruments at the factor level
n just comparing total scores).To address those issues, the present validity study uses
two prominent measures of EI as well as measures of personality, emotions, self-
These six soft skills assessments are leading measures in the fields of
management.
Caruso Emotional Intelligence Test 2.0 (MSCEIT 2.0)
Salovey and Mayer (1990) defined EI as “the subset of social intelligence that involves
the ability to monitor one’s own and others’ feelings and emotions, to discriminate among them
and to use this information to guide one’s thinking and actions” (p. 189). Their version of EI
social intelligence with a focus on how emotions facilitate
instrument that had right and wrong answers (using consensual and/or expert,
emotional ability is the potential capacity to understand and explain
tions and to use that knowledge to improve decision making.
The MSCEIT uses four branch scores: (1) Perceiving Emotions indicates the degree to
which the respondent can identify emotion in himself or herself and others; (2) Facilitating
Research in Higher Education Journal
Validation social emotional development, Page 3
the enhancement of personal capacity to manage environmental
consequence of the application of social intelligence, emotional
intelligence, and competence research toward higher education development. The conceptual
knowledge and
regard for the person
ease and effort in developing
seek leadership
). The assumption of SECD is that students who
develop their capacity to understand themselves, consider the world around them, build
an advantage in meeting
Kuh, Kinzie, Schuh, Whit, & Associates, 2010).
developmental tools to assist in
reported Likert
taker to indicate how often a particular question relates to them (1
linked to 12 of the questions on the
awareness and Consideration of Others, the question is
,” while Connection to Others and Influence
predict how often your friends would say that statement is
= .91) with a university
However, the instrument needs to be assessed
er, similar types of instruments using an expanded sample population in order to
(e.g., skills that focus on
, particularity those that have emerged from the literature on EI, is
the lack of robust, comprehensive validity studies that incorporate multiple measures of EI, as
lated constructs, and examine instruments at the factor level
To address those issues, the present validity study uses
two prominent measures of EI as well as measures of personality, emotions, self-monitoring, and
These six soft skills assessments are leading measures in the fields of
f social intelligence that involves
the ability to monitor one’s own and others’ feelings and emotions, to discriminate among them
Their version of EI
social intelligence with a focus on how emotions facilitate
consensual and/or expert,
emotional ability is the potential capacity to understand and explain
indicates the degree to
Facilitating
Thought specifies the degree to which the respondent can use his or her emotions to improve
thinking; (3) Understanding Emotions
complexity of emotional meanings; and (4)
respondent is able to manage emotions in his or her own life and in others.
between EI measures would be expected. However, since the underlying assumptions and
method of assessment are different, minimal relationships between the MSCEIT and SED
expected surrounding the Emotional Management scores.
Bar-On Emotional Quotient Inventory (EQ
Bar-On (2006) defined EI as the “cross section of interrelated emotional and social
competencies, skills, and facilitators that determine how effectively w
ourselves, understand others, and relate with them, and cope with daily demands” (p. 14).
version of EI emerged from the literature on positive psychology with a focus on psychological
well-being using a self-report measure
involves the preferred emotional patterns that influence understanding and coping with
environmental demands to achieve psychological well
The EQ-i uses five component scores: (1)
self-awareness, assertiveness, self
EQ which includes interpersonal relationship
Management EQ which includes s
includes problem solving, reality testing, and flexibility
includes happiness and optimism. Given the overlap in assumptions and method between the
SED-I and EQ-i, we would assume a greater level of statistical overlap
particularly in the areas of Inter-
International Personality Item Pool (IPIP) Big
Personality is generally defined as a stable set of characteristics and tendencies that
determine those commonalities and differences in the psychological behavior (thoughts, feelings,
and actions) of people that have continuity in time and that may not be
sole result of the social and biological pressures of the moment
To assess personality, the IPIP focuses on
engagement with the external world; (2)
Conscientiousness – control, regulation,
coping effectively with normal demands of life; and (5)
creativity (Goldberg, 2001). As with all self
would expect a high level of method bias as well as significant relationships between the SED
and IPIP, in particular the factors of Extraversion, Agreeableness, and Conscientiousness.
Trait Meta-Mood Scale (TMMS)
An early pre-cursor to the modern EI measures, the TMMS
Turvey, & Palfai, 1995) is focused
Emotional Clarity (distinguishing among feelings), and
moods). As a measure of emotional self
Research in Higher Education Journal
Validation social emotional development, Page
the degree to which the respondent can use his or her emotions to improve
motions suggests how well the respondent understands the
complexity of emotional meanings; and (4) Emotional Management registers how well the
t is able to manage emotions in his or her own life and in others. Some overlap
between EI measures would be expected. However, since the underlying assumptions and
method of assessment are different, minimal relationships between the MSCEIT and SED
expected surrounding the Emotional Management scores.
On Emotional Quotient Inventory (EQ-i)
EI as the “cross section of interrelated emotional and social
competencies, skills, and facilitators that determine how effectively we understand and express
ourselves, understand others, and relate with them, and cope with daily demands” (p. 14).
version of EI emerged from the literature on positive psychology with a focus on psychological
report measure that included normed scoring. Overall, emotional quotient
the preferred emotional patterns that influence understanding and coping with
environmental demands to achieve psychological well-being.
i uses five component scores: (1) Intrapersonal EQ which includes emotional
self-regard, self-actualization, and independence; (2)
nterpersonal relationships, empathy, and social responsibility
anagement EQ which includes stress tolerance and impulse control; (4) Adaptability EQ which
eality testing, and flexibility; and (5) General Mood EQ which
and optimism. Given the overlap in assumptions and method between the
, we would assume a greater level of statistical overlap than with the MSCEIT
and Intrapersonal EQ and SECD.
International Personality Item Pool (IPIP) Big-Five Factor Markers
Personality is generally defined as a stable set of characteristics and tendencies that
determine those commonalities and differences in the psychological behavior (thoughts, feelings,
and actions) of people that have continuity in time and that may not be easily understood as the
sole result of the social and biological pressures of the moment (Goldberg, 1992).
To assess personality, the IPIP focuses on the Big Five factor model of (1)
engagement with the external world; (2) Agreeableness – cooperation and social harmony; (3)
regulation, and direction of impulses; (4) Emotional
effectively with normal demands of life; and (5) Intellect - novelty, variety, change, and
As with all self-report instruments that focus on social skills, we
would expect a high level of method bias as well as significant relationships between the SED
and IPIP, in particular the factors of Extraversion, Agreeableness, and Conscientiousness.
Mood Scale (TMMS)
cursor to the modern EI measures, the TMMS (Salovey, Mayer, Goldman,
is focused on Emotional Attention (attending to thoughts and feelings),
larity (distinguishing among feelings), and Emotional Repair (improving negative
emotional self-awareness we would expect an overlap between the
Research in Higher Education Journal
Validation social emotional development, Page 4
the degree to which the respondent can use his or her emotions to improve
how well the respondent understands the
registers how well the
Some overlap
between EI measures would be expected. However, since the underlying assumptions and
method of assessment are different, minimal relationships between the MSCEIT and SED-I are
EI as the “cross section of interrelated emotional and social
e understand and express
ourselves, understand others, and relate with them, and cope with daily demands” (p. 14). This
version of EI emerged from the literature on positive psychology with a focus on psychological
, emotional quotient
the preferred emotional patterns that influence understanding and coping with
l EQ which includes emotional
; (2) Interpersonal
social responsibility; (3) Stress
daptability EQ which
ood EQ which
and optimism. Given the overlap in assumptions and method between the
than with the MSCEIT,
Personality is generally defined as a stable set of characteristics and tendencies that
determine those commonalities and differences in the psychological behavior (thoughts, feelings,
easily understood as the
(Goldberg, 1992).
factor model of (1) Extraversion –
cooperation and social harmony; (3)
motional Stability –
ovelty, variety, change, and
report instruments that focus on social skills, we
would expect a high level of method bias as well as significant relationships between the SED-I
and IPIP, in particular the factors of Extraversion, Agreeableness, and Conscientiousness.
Salovey, Mayer, Goldman,
ttention (attending to thoughts and feelings),
epair (improving negative
we would expect an overlap between the
TMMS scales of Emotional Attention and
factor.
Self-Monitoring Scale (SM)
Self-monitoring is defined as the presumed and consistent patterns of individual
differences in the extent to which people regulate their self
in accordance with immediate situatio
monitoring is divided into two aspects: (1)
(2) Sensitivity Others – sensitivity to
the social emotional competence development model,
of Others as the thoughtful regard for the person and situation in anticipating the likely
consequences before thinking and acting. One
monitoring, which includes recognizing/anticipating consequences and regulating/thinking
before speaking or acting. Since the
relates to monitoring one’s behavi
positive relationship between SM and
Marlowe-Crowne Social Desirability Scale (SD)
Social desirability is the tendency of respondents to reply in a manner that wi
favorably by others (Reynolds, 1982).
which factors are influenced by social desirability becomes a concern. The hope is that none of
the factors indicates a significant relationship
RESEARCH DESIGN
The six critical measures reviewed above
reported here. The current paper builds
by expanding the demographics of the initial study, considering students at different levels in
their education (e.g., undergraduate, graduate students), establish
as examining convergent/discriminant validity evidence (e.g., the relatio
alternative emotional intelligence
assessed other aspects of the measure
structure, and readability grade level.
evaluate the SED-I measures were conducted
reliability assessment, and convergent/discriminant validity assessment
STUDY 1: PSYCHOMETRICS
To assess the generalizability of the SED
were conducted to replicate results from the freshman study (Seal et al., 2011b), using transfer,
professional, and graduate students.
Research in Higher Education Journal
Validation social emotional development, Page
ttention and Emotional Clarity and the SED-I Self-
monitoring is defined as the presumed and consistent patterns of individual
differences in the extent to which people regulate their self-presentation by tailoring their actions
in accordance with immediate situational cues (Lennox & Wolfe, 1984). In particular self
monitoring is divided into two aspects: (1) Modify Self – ability to modify self-presentation and
sensitivity to the expressive behavior of others. In the article introducing
the social emotional competence development model, Seal et al. (2011a) defined Consideration
of Others as the thoughtful regard for the person and situation in anticipating the likely
consequences before thinking and acting. One of the components of Consideration is
monitoring, which includes recognizing/anticipating consequences and regulating/thinking
Since the Consideration of Others factor of the SED-I specifically
one’s behavior in the presence of others, we would expect a significant
relationship between SM and the Consideration factor score.
Crowne Social Desirability Scale (SD)
Social desirability is the tendency of respondents to reply in a manner that wi
Reynolds, 1982). Since the SED-I is a self-report instrument, the question of
which factors are influenced by social desirability becomes a concern. The hope is that none of
the factors indicates a significant relationship to social desirability.
The six critical measures reviewed above establish the framework for the
. The current paper builds on the psychometric assessment paper (Seal et al.,
demographics of the initial study, considering students at different levels in
their education (e.g., undergraduate, graduate students), establishing test-retest reliability, as well
convergent/discriminant validity evidence (e.g., the relationship of the SED
alternative emotional intelligence and personality instruments). Seal et al. (2011b
aspects of the measure, including item generation, internal consistency, factor
structure, and readability grade level. In the current investigation, three assessment studies to
were conducted, including psychometrics assessment, test
and convergent/discriminant validity assessment
CS
To assess the generalizability of the SED-I instrument, a series of psychometric analyses
were conducted to replicate results from the freshman study (Seal et al., 2011b), using transfer,
professional, and graduate students.
Research in Higher Education Journal
Validation social emotional development, Page 5
elf-Awareness
monitoring is defined as the presumed and consistent patterns of individual
presentation by tailoring their actions
In particular self-
presentation and
In the article introducing
Seal et al. (2011a) defined Consideration
of Others as the thoughtful regard for the person and situation in anticipating the likely
of the components of Consideration is
monitoring, which includes recognizing/anticipating consequences and regulating/thinking
I specifically
, we would expect a significant
Social desirability is the tendency of respondents to reply in a manner that will be viewed
report instrument, the question of
which factors are influenced by social desirability becomes a concern. The hope is that none of
the factor analysis
psychometric assessment paper (Seal et al., 2011b)
demographics of the initial study, considering students at different levels in
retest reliability, as well
of the SED-I to
2011b) previously
, including item generation, internal consistency, factor
three assessment studies to
, including psychometrics assessment, test-retest
I instrument, a series of psychometric analyses
were conducted to replicate results from the freshman study (Seal et al., 2011b), using transfer,
METHOD
A total of 1,134 students completed the survey
instrument, students were divided into two different groups based on student characteristics.
Group 1 includes 632 first time freshman students from the original study (Seal et al., 2011b) and
Group 2 included 502 students comprised of sophomores, juniors, seniors, transfer students,
professional students, and graduate students.
Group 1 was made up of
years old, with a mean age of 18. The ethnic makeup of the
Hispanic, 35% Asian/Pacific Islander, 15% Hispanic, and 11%
American, Native American, multiethnic, and international/unknown/other categories.
Group 2 was comprised of 60% female and 40% male, between th
with a mean age of 23.The ethnic makeup of
White/Non-Hispanic, 9% Hispanic,
Multi-ethnic, and international/unknown/other categories
Participants were recruited through an email campaign asking students to complete
SED-I measure online receiving
the email link, they were given an informed consent screen with the o
study. Total time to complete the measure was about 15 minutes.
Results
The psychometric analyses
consistency assessment, and exploratory factor analysis.
The descriptive statistics for item scores, item
communalities, and principal components pattern matrices coefficients (using direct oblimin
rotation, δ = 0) are presented in Table 1.
Most items were significantly (
Scores were reflected and transformed to square root equivalents. As with the
data set (Seal et al., 2011b), the square root transformation reduced the number of skewed (
and leptokurtic cases (3). Using z score > 4.00 as the criterion, one univariate out
detected and removed. The search for multivariate outliers was limited to those cases with
complete data (517). Fifteen people met the outlier criterion of a M
than 103 (p < .00001) and these scores were removed. The resulting d
cases indicated above.
The untransformed scores
reliability) using Cronbach’s coefficient alpha. The total score alpha of .91 indicates good
internal consistency. As compared to the results reported by Seal et al., (2011b), this sample had
slightly higher internal consistency scores
factor. Table 2 contains the coefficient alpha values for this study and the study by Seal et al.
(2011b). See Table 2 (Appendix).
To determine the number of factors, a principle components analysis (PCA) was
conducted with the untransformed data. Indicating that the correlation matrix was factorable, the
Kaiser-Meyer-Olkin (KMO) measure of sampling adequacy was .89
.90 for their freshmen data set. The PCA, with SPSS default settings in place, was
the 48 items using the raw data and 10 factors
Research in Higher Education Journal
Validation social emotional development, Page
dents completed the survey. In order to test the reliability of the
instrument, students were divided into two different groups based on student characteristics.
Group 1 includes 632 first time freshman students from the original study (Seal et al., 2011b) and
udents comprised of sophomores, juniors, seniors, transfer students,
professional students, and graduate students.
62% females and 38% males, between the ages of 16 and 19
of 18. The ethnic makeup of the sample was 39% White/Non
Hispanic, 35% Asian/Pacific Islander, 15% Hispanic, and 11% were comprised of
American, Native American, multiethnic, and international/unknown/other categories.
Group 2 was comprised of 60% female and 40% male, between the ages of 17 and 53,
The ethnic makeup of the sample was 44% Asian/Pacific Islander, 32%
Hispanic, 9% Hispanic, and 15% comprised of African American, Native American,
nternational/unknown/other categories.
Participants were recruited through an email campaign asking students to complete
a web link to the survey in the email. Once students clicked on
the email link, they were given an informed consent screen with the option of opting into the
Total time to complete the measure was about 15 minutes.
psychometric analyses included descriptive statistics, data screening, internal
consistency assessment, and exploratory factor analysis.
The descriptive statistics for item scores, item-factor correlations, 4-factor
communalities, and principal components pattern matrices coefficients (using direct oblimin
= 0) are presented in Table 1. See Table 1 (Appendix).
gnificantly (p < .001) negatively skewed (31) and leptokurtic (11).
Scores were reflected and transformed to square root equivalents. As with the Group 1 freshman
square root transformation reduced the number of skewed (
and leptokurtic cases (3). Using z score > 4.00 as the criterion, one univariate out
The search for multivariate outliers was limited to those cases with
people met the outlier criterion of a Mahalanobis distance greater
< .00001) and these scores were removed. The resulting data set consisted of the 502
The untransformed scores were used to assess internal consistency (total score and factor
Cronbach’s coefficient alpha. The total score alpha of .91 indicates good
As compared to the results reported by Seal et al., (2011b), this sample had
consistency scores across the factors, except for the Influence
factor. Table 2 contains the coefficient alpha values for this study and the study by Seal et al.
See Table 2 (Appendix).
To determine the number of factors, a principle components analysis (PCA) was
rmed data. Indicating that the correlation matrix was factorable, the
Olkin (KMO) measure of sampling adequacy was .89. Seal et al. (2011) reported
data set. The PCA, with SPSS default settings in place, was
using the raw data and 10 factors were extracted. The resultant information is
Research in Higher Education Journal
Validation social emotional development, Page 6
In order to test the reliability of the
instrument, students were divided into two different groups based on student characteristics.
Group 1 includes 632 first time freshman students from the original study (Seal et al., 2011b) and
udents comprised of sophomores, juniors, seniors, transfer students,
the ages of 16 and 19
sample was 39% White/Non-
were comprised of African
American, Native American, multiethnic, and international/unknown/other categories.
e ages of 17 and 53,
44% Asian/Pacific Islander, 32%
15% comprised of African American, Native American,
Participants were recruited through an email campaign asking students to complete the
Once students clicked on
on of opting into the
included descriptive statistics, data screening, internal
factor
communalities, and principal components pattern matrices coefficients (using direct oblimin
< .001) negatively skewed (31) and leptokurtic (11).
Group 1 freshman
square root transformation reduced the number of skewed (27)
and leptokurtic cases (3). Using z score > 4.00 as the criterion, one univariate outlier was
The search for multivariate outliers was limited to those cases with
ahalanobis distance greater
ata set consisted of the 502
to assess internal consistency (total score and factor
Cronbach’s coefficient alpha. The total score alpha of .91 indicates good
As compared to the results reported by Seal et al., (2011b), this sample had
luence Orientation
factor. Table 2 contains the coefficient alpha values for this study and the study by Seal et al.
To determine the number of factors, a principle components analysis (PCA) was
rmed data. Indicating that the correlation matrix was factorable, the
. Seal et al. (2011) reported
data set. The PCA, with SPSS default settings in place, was conducted on
The resultant information is

returned in the form of a scree plot and variance tables. The scree plot
components five and six, leveling afterward. Th
the eigenvalues were < 2. The eigenvalue on the fifth factor was 2.20
dropped to preserve the 4-factor model. The PCA was run again, forcing four factor
for communalities and pattern matrix coefficients. Multiple PCAs were conducted with two data
transformations and several rotation procedures; the results were not substantially improved
relative to the results from the raw data analysis reported here.
accounted for 40% of the variance in the
variance for the Seal et al. (2011) data set. Thus, t
two data sets.
STUDY 2: TEST-RETEST RELIABILITY A
To assess the reliability of the SED
determine the consistency of scores over time.
Method
A total of 84 freshmen participants
period with the majority of the students complet
month interval, admittedly a long delay for self
developmental instrument. Studen
instrument for the test-retest study.
Results
Pearson test-retest correlation coefficients were calculated for each of the 48 items and
for the four factors; the factor results are reported alon
correlation values exceed 0. Means and standard deviations were computed for each set of test
scores for each factor. With regard to the four factors, the results show good test
consistency for the Connection with Others
other two factors as outlined in Table 3.
The means declined for every factor. Given that unpredicted result, post
calculated for the mean differences
reductions. None of the 95% confidence intervals include
result that no t-test value showed a probability greater than .01, suggests that the
for each factor were reliable. The
reduction. The reliability and mean differences data
tend to modify their Self-Awareness and
their self-ratings in these areas. Results of the
(Appendix).
STUDY 3: CONVERGENT/DISCRIMINANT VALIDIT
To provide evidence of the potential validity of the SED
convergent and discriminant studies were conducted, comparing the SED
Research in Higher Education Journal
Validation social emotional development, Page
returned in the form of a scree plot and variance tables. The scree plot showed elbows between
components five and six, leveling afterward. The drop between factors five and six
The eigenvalue on the fifth factor was 2.20; however,
factor model. The PCA was run again, forcing four factor
nd pattern matrix coefficients. Multiple PCAs were conducted with two data
transformations and several rotation procedures; the results were not substantially improved
relative to the results from the raw data analysis reported here. The four-factor soluti
accounted for 40% of the variance in the dataset; the same procedure accounted for 38% of the
for the Seal et al. (2011) data set. Thus, there was little variance in results across
RETEST RELIABILITY ASSESSMENT OF THE SED-1
To assess the reliability of the SED-I instrument, a test-retest study was conducted to
determine the consistency of scores over time.
participants completed the SED-I twice within a 3 to 7 month time
period with the majority of the students completing the two self-assessments within a 4 to 6
long delay for self-report, test-retest reliability assessment
Students were recruited through their classes to re-take the SED
retest study.
retest correlation coefficients were calculated for each of the 48 items and
for the four factors; the factor results are reported along with two-tailed probabilities that the
correlation values exceed 0. Means and standard deviations were computed for each set of test
scores for each factor. With regard to the four factors, the results show good test-
with Others and Influence Orientation factors, but not for th
other two factors as outlined in Table 3. See Table 3 (Appendix).
The means declined for every factor. Given that unpredicted result, post-hoc
calculated for the mean differences for each factor to assess the reliability of the score
95% confidence intervals included zero, that result in addition to the
test value showed a probability greater than .01, suggests that the
The Connection to Others factor showed the least amount of
reduction. The reliability and mean differences data imply that during freshmen year
wareness and Consideration of Others, showing a trend of reducing
Results of the t-tests are presented in Table 4. See Table 4
DISCRIMINANT VALIDITY TESTING
To provide evidence of the potential validity of the SED-I instrument, a seri
convergent and discriminant studies were conducted, comparing the SED-I to other general
Research in Higher Education Journal
Validation social emotional development, Page 7
elbows between
drop between factors five and six shows where
it was still
factor model. The PCA was run again, forcing four factors; see Table 1
nd pattern matrix coefficients. Multiple PCAs were conducted with two data
transformations and several rotation procedures; the results were not substantially improved
factor solution
accounted for 38% of the
little variance in results across the
1
retest study was conducted to
twice within a 3 to 7 month time
assessments within a 4 to 6
retest reliability assessment of a
take the SED-I
retest correlation coefficients were calculated for each of the 48 items and
tailed probabilities that the
correlation values exceed 0. Means and standard deviations were computed for each set of test
-retest
factors, but not for the
hoc t-tests were
for each factor to assess the reliability of the score
, that result in addition to the
test value showed a probability greater than .01, suggests that the score reductions
the least amount of
that during freshmen year, students
trend of reducing
See Table 4
I instrument, a series of
I to other general
measures of EI (MSCEIT and EQ
monitoring (Lennox & Wolfe, 1984), and social desirability (
Method
The measures chosen for
psychology, education, and management.
decision rules to define the level of relationship (correlation), criterion for convergent validity
(alpha level to reject the null hypothesis), and criterion for discriminant validity (alpha level to
accept the null hypothesis). In terms of correlations (level of relationship of the SED
the alternative measure), we created the following categories: a
negligible, ± 0.10 through 0.30 is
correlation, and > ± 0.50 is a strong correlation
was set at the standard .05 to minimize type I errors. Finally, for discriminant validity, the alpha
level was set at a higher threshold of .20 to minimize type II errors.
In order to establish the a priori hypotheses, a series of steps were followed.
independent researchers predicted the level of convergence between the SED
measures based on (a) the purpose
authors and (b) a language analysis that
concept match. First the researchers mapped out conceptual overlaps that occurred between
instruments. Any definitions of constructs that appeared related were marked, regardless of
actual method. Second, a set of researchers familiar with the instruments then reviewed the
predicted relationships and adjusted them based on intent of the construct as
operational method used. The researchers
predicted a negligible, small, moderate, or strong correlative value with SED
predictions, both summative and semantic, were then reviewed
synthesized the results matrix into one set of predictions. The two
to develop a comprehensive view of the SED
hypotheses were then compared to
correlation was run between each assessment’s factors and the SED
test of significance, mean, and standard deviation reported and significant correlations flagged.
Correlations were declared significant at
for discriminant validity.
The following details the six sub
SED-I scores. In each sub-study, we indicate t
the overall sample), hypothesis (established through the process outlined above), and results (of
the Pearson correlation coefficient). For an overview of the results, see Table 5
Study 3.1: Mayer-Salovey-Caruso Emotional Intelligence Test (MSCEIT)
As noted earlier, Salovey and Mayer (1990)
explain emotions and to use that knowl
focused on differentiating individual levels of specific em
Mayer-Salovey-Caruso Emotional Intelligence Test or MSCEIT (Mayer, Salovey,
2002) to measure those differences.
consensual and expert scoring) that are normed using demographic information (age, gender, and
Research in Higher Education Journal
Validation social emotional development, Page
measures of EI (MSCEIT and EQ-i) as well as personality (IPIP), emotion (TMMS), self
monitoring (Lennox & Wolfe, 1984), and social desirability (Reynolds, 1982).
chosen for inclusion are among the most widely used measures in
psychology, education, and management. For the purposes of this study, we used several
decision rules to define the level of relationship (correlation), criterion for convergent validity
(alpha level to reject the null hypothesis), and criterion for discriminant validity (alpha level to
the null hypothesis). In terms of correlations (level of relationship of the SED
the alternative measure), we created the following categories: a correlation of less than ±
is a small correlation, ± 0.31 through 0.49 is a moderate
a strong correlation. In terms of convergent validity, the alpha level
was set at the standard .05 to minimize type I errors. Finally, for discriminant validity, the alpha
hreshold of .20 to minimize type II errors.
In order to establish the a priori hypotheses, a series of steps were followed.
independent researchers predicted the level of convergence between the SED-I and the various
a) the purpose and definitions of each of the measures as indicated by their
b) a language analysis that assessed the frequency of exact match, close match, and
First the researchers mapped out conceptual overlaps that occurred between
ments. Any definitions of constructs that appeared related were marked, regardless of
actual method. Second, a set of researchers familiar with the instruments then reviewed the
predicted relationships and adjusted them based on intent of the construct as well as the
The researchers examined each assessment at the factor level and
a negligible, small, moderate, or strong correlative value with SED-I factors. The
predictions, both summative and semantic, were then reviewed by a third researcher, who
synthesized the results matrix into one set of predictions. The two-pronged approach attempt
to develop a comprehensive view of the SED-I convergent/discriminant validity. The final
then compared to observed Pearson’s correlation coefficients; the bivariate
run between each assessment’s factors and the SED-I factors with the two
test of significance, mean, and standard deviation reported and significant correlations flagged.
significant at the .05 level for convergent validity and at the .20
The following details the six sub-studies, comparing the specific instrument scores to the
study, we indicate the participants (as each had a different sub
the overall sample), hypothesis (established through the process outlined above), and results (of
the Pearson correlation coefficient). For an overview of the results, see Table 5 (Appendix).
Caruso Emotional Intelligence Test (MSCEIT)
Salovey and Mayer (1990) defined EI as the capacity to understand and
explain emotions and to use that knowledge to improve decision making. Their definition
tiating individual levels of specific emotional reasoning capacities using the
Caruso Emotional Intelligence Test or MSCEIT (Mayer, Salovey,
2002) to measure those differences. The MSCEIT uses right/wrong answer formats (based on
consensual and expert scoring) that are normed using demographic information (age, gender, and
Research in Higher Education Journal
Validation social emotional development, Page 8
i) as well as personality (IPIP), emotion (TMMS), self-
most widely used measures in
For the purposes of this study, we used several
decision rules to define the level of relationship (correlation), criterion for convergent validity
(alpha level to reject the null hypothesis), and criterion for discriminant validity (alpha level to
the null hypothesis). In terms of correlations (level of relationship of the SED-I factors to
correlation of less than ± 0.09 is
a moderate
. In terms of convergent validity, the alpha level
was set at the standard .05 to minimize type I errors. Finally, for discriminant validity, the alpha
In order to establish the a priori hypotheses, a series of steps were followed. Two
I and the various
and definitions of each of the measures as indicated by their
frequency of exact match, close match, and
First the researchers mapped out conceptual overlaps that occurred between
ments. Any definitions of constructs that appeared related were marked, regardless of
actual method. Second, a set of researchers familiar with the instruments then reviewed the
well as the
each assessment at the factor level and
I factors. The
by a third researcher, who
pronged approach attempted
I convergent/discriminant validity. The final
the bivariate
I factors with the two-tailed
test of significance, mean, and standard deviation reported and significant correlations flagged.
for convergent validity and at the .20 level
studies, comparing the specific instrument scores to the
he participants (as each had a different sub-set of
the overall sample), hypothesis (established through the process outlined above), and results (of
(Appendix).
apacity to understand and
Their definition
otional reasoning capacities using the
Caruso Emotional Intelligence Test or MSCEIT (Mayer, Salovey, & Caruso,
The MSCEIT uses right/wrong answer formats (based on
consensual and expert scoring) that are normed using demographic information (age, gender, and
ethnicity) to differentiate levels of emotional ability.
related abilities that reflect overall EI potential capacity by measuring four branch scores
(Perceiving Emotions, Facilitating
Management), two area scores (E
Intelligence) and one final total s
administered the MSCEIT online, using consensual scoring, and focused on the four branch
scores.
The MSCEIT sub-study included
were male, and the remainder were not identified
= 21, SD = 6.3). Participants were enrolled in the undergraduate
(38%), the graduate education program
sciences (19%) and the remainder in an aggregate of other
Our initial hypotheses were the following:
H3.1.1 – The Managing Emotions branch of the MSCEIT would have a small
significant positive correlation with the Self
H3.1.2 – The Managing Emotions branch of the MSCEIT would have a small
significant positive correlation with the Influence Orientation factor of the SED
H3.1.3 – Since the underlying
different, we would expect that the two measures would not correlate in other areas, that
is, the remaining branch scores of the MSCEIT and factor scores of the SED
be significantly correlated.
To test the hypotheses, Pearson’s correlation coefficient
branch of the MSCEIT and each factor of the
Hypothesis 3.1.1 was not supported as there was a negligible correlation (
not statistically significant (even at the alpha = .20 level), indicating no relationship between the
variables.
Hypothesis 3.1.2 was not supported as there was a small, negative correlation (
was not statistically significant at the .05 level, but was significant at
possible negative relationship between the variables.
Hypothesis 3.1.3 was largely confirmed across factors of both instruments; however,
there was a small correlation between Perceiving Emotions (MSCEIT) and Consideration of
Others (SED-I) as well as a small correlation between Using Emotions (MSCEIT) and Influence
Orientation (SED-I), neither of which met the alpha > .20 decision rule, indicating possible
relationships between the variables.
Study 3.2: Bar-On Emotional Quoti
As noted earlier, Bar-On (2006)
understanding and coping with environmental demands to achieve psychological well
definition focuses on the emotional
psychological functioning using
measure the self-reported patterns.
uses a compensatory model of 5 composite scales (
Management, Adaptability, and G
we administered the EQ-i online and focused on the five composite scale scores.
Research in Higher Education Journal
Validation social emotional development, Page
e levels of emotional ability. The MSCEIT uses a hierarchical model of
lities that reflect overall EI potential capacity by measuring four branch scores
acilitating Thought, Understanding Emotions, and Emotional
Experiential Emotional Intelligence and Strategic
telligence) and one final total score (Emotional Intelligence). For our purposes, we
administered the MSCEIT online, using consensual scoring, and focused on the four branch
study included 85 participants. Fifty-one (60%) were fema
, and the remainder were not identified. Participants’ age ranged from
. Participants were enrolled in the undergraduate pharmacy/health program
ducation program (32%), various undergraduate programs
the remainder in an aggregate of other schools with less than 5%
Our initial hypotheses were the following:
The Managing Emotions branch of the MSCEIT would have a small
positive correlation with the Self-awareness factor score of the SED
The Managing Emotions branch of the MSCEIT would have a small
significant positive correlation with the Influence Orientation factor of the SED
Since the underlying assumptions and methods of assessment are
different, we would expect that the two measures would not correlate in other areas, that
is, the remaining branch scores of the MSCEIT and factor scores of the SED
be significantly correlated.
test the hypotheses, Pearson’s correlation coefficients were calculated between each
branch of the MSCEIT and each factor of the SED-I (Table 6).
Hypothesis 3.1.1 was not supported as there was a negligible correlation (
nificant (even at the alpha = .20 level), indicating no relationship between the
Hypothesis 3.1.2 was not supported as there was a small, negative correlation (
was not statistically significant at the .05 level, but was significant at the .20 level, indicating a
possible negative relationship between the variables.
Hypothesis 3.1.3 was largely confirmed across factors of both instruments; however,
there was a small correlation between Perceiving Emotions (MSCEIT) and Consideration of
I) as well as a small correlation between Using Emotions (MSCEIT) and Influence
I), neither of which met the alpha > .20 decision rule, indicating possible
relationships between the variables.
On Emotional Quotient Inventory (EQ-i)
On (2006) defined EI as the emotional patterns that influence
understanding and coping with environmental demands to achieve psychological well
the emotional-social traits or patterns that contribute toward effective
using the Emotional Quotient Inventory or EQ-i (Bar-
reported patterns. The EQ-i is a self-report measure of emotional quotient that
5 composite scales (Intrapersonal, Interpersonal, S
General Mood) comprised of 15 sub-scales. For our purposes,
i online and focused on the five composite scale scores.
Research in Higher Education Journal
Validation social emotional development, Page 9
The MSCEIT uses a hierarchical model of
lities that reflect overall EI potential capacity by measuring four branch scores
motional
trategic Emotional
core (Emotional Intelligence). For our purposes, we
administered the MSCEIT online, using consensual scoring, and focused on the four branch
one (60%) were female, 32 (38%)
’ age ranged from 17 to 53, (mean
ealth program
in arts and
schools with less than 5% each (21%).
The Managing Emotions branch of the MSCEIT would have a small
awareness factor score of the SED-I.
The Managing Emotions branch of the MSCEIT would have a small
significant positive correlation with the Influence Orientation factor of the SED-I
assumptions and methods of assessment are
different, we would expect that the two measures would not correlate in other areas, that
is, the remaining branch scores of the MSCEIT and factor scores of the SED-I should not
calculated between each
Hypothesis 3.1.1 was not supported as there was a negligible correlation (-.03) that was
nificant (even at the alpha = .20 level), indicating no relationship between the
Hypothesis 3.1.2 was not supported as there was a small, negative correlation (-.19) that
the .20 level, indicating a
Hypothesis 3.1.3 was largely confirmed across factors of both instruments; however,
there was a small correlation between Perceiving Emotions (MSCEIT) and Consideration of
I) as well as a small correlation between Using Emotions (MSCEIT) and Influence
I), neither of which met the alpha > .20 decision rule, indicating possible
emotional patterns that influence
understanding and coping with environmental demands to achieve psychological well-being. His
terns that contribute toward effective
-On, 1997) to
report measure of emotional quotient that
Stress
scales. For our purposes,
i online and focused on the five composite scale scores.
The EQ-i sub-study included
(38%) of which were male, and 2 not identified
(mean = 20, SD 4.3). Participants were undergraduate and graduate students, enrolled in b
administration (45%), pharmacy/health programs
(10%), and the remainder in an aggregate of other schools (5
Our initial hypotheses were
H3.2.1 – The Intrapersonal composite score of the EQ
significant positive correlation with the Self
H3.2.2 – The Interpersonal composite score of the EQ
significant positive correlation with the Consideration of Others factor
I.
H3.2.3 – The Interpersonal composite score of the EQ
significant positive correlation with the Connection to Others factor score of the SED
H2.4 – Stress Management, Adaptability, and General Mood of the EQ
have a small, but not significant relationship with the SED
To test the hypotheses Pearson’s correlation coefficient
composite scale of the EQ-i and each
Hypothesis 3.2.1 was supported, as there was a moderate, significant positive relationship
between the Intrapersonal composite score of the EQ
SED-I. In addition, although there were other significant relationships, this relationsh
highest correlation between EQ-i scores and Self
Hypotheses 3.2.2 and 3.2.3 were partially supported, as there was a significant positive
correlation between the Interpersonal composite score of the EQ
and Consideration of Others factors of the SED
of the predicted moderate values, and the other factors (Self
Orientation) displayed unpredicted, but similar small correlations.
Hypothesis 3.2.4 was not supported, as across all the analyses there were small to
moderate positive significant correlations between the measures, indicating substantial overlap
between the two instruments.
Study 3.3: International Personality Item Pool (IPI
Personality is generally defined as a
determine those commonalities and differences in the psychological
continuity in time (Goldberg, 1992). P
Personality Item Pool (Goldberg, 2001).
personality, originally developed by Thurstone (1934) and clarified by Goldberg (1992) and is
considered “the central paradigm for defining and
2000, p. 9). The IPIP inventory uses
describing people’s behavior describes
inaccurate to “5” very accurate), and
The alpha reliability coefficients of the items range
(Extroversion); (Buchanan, Johnson, and Goldberg, 2005).
The IPIP sub-study included 181 undergraduate
female and 88 (49%) were male.
Research in Higher Education Journal
Validation social emotional development, Page
study included 280 participants, 168 (60%) of which were female and 110
, and 2 not identified. Participants’ ages were between 17 and 53
rticipants were undergraduate and graduate students, enrolled in b
administration (45%), pharmacy/health programs (24%), arts and science (16%),
and the remainder in an aggregate of other schools (5%).
Our initial hypotheses were as follows:
The Intrapersonal composite score of the EQ-i would have a moderate
significant positive correlation with the Self-awareness factor score of the SED
The Interpersonal composite score of the EQ-i would have a moderate
significant positive correlation with the Consideration of Others factor score of the SED
The Interpersonal composite score of the EQ-i would have a moderate
significant positive correlation with the Connection to Others factor score of the SED
Stress Management, Adaptability, and General Mood of the EQ
have a small, but not significant relationship with the SED-I factors.
s Pearson’s correlation coefficients were calculated between each
each factor of the SED-I (Table 7).
supported, as there was a moderate, significant positive relationship
between the Intrapersonal composite score of the EQ-i and the Self-awareness factor score of the
I. In addition, although there were other significant relationships, this relationsh
i scores and Self-awareness.
Hypotheses 3.2.2 and 3.2.3 were partially supported, as there was a significant positive
correlation between the Interpersonal composite score of the EQ-i and the Connection to Others
nd Consideration of Others factors of the SED-I. However, the correlations were small instead
of the predicted moderate values, and the other factors (Self-awareness and Influence
Orientation) displayed unpredicted, but similar small correlations.
sis 3.2.4 was not supported, as across all the analyses there were small to
moderate positive significant correlations between the measures, indicating substantial overlap
Study 3.3: International Personality Item Pool (IPIP Big 5)
Personality is generally defined as a stable set of characteristics and tendencies that
determine those commonalities and differences in the psychological behavior of people that have
(Goldberg, 1992). Personality was measured using the International
, 2001). The IPIP assesses the Five-Factor Model (FFM) of
personality, originally developed by Thurstone (1934) and clarified by Goldberg (1992) and is
considered “the central paradigm for defining and measuring personality” (Polednik
inventory uses 50 items and users rate how accurately the phrases
describing people’s behavior describes them on a five-point Likert scale (from “1
5” very accurate), and the measure takes approximately 10-20 min to complete
The alpha reliability coefficients of the items range from .71 (Openness to Experience) to .89
(Extroversion); (Buchanan, Johnson, and Goldberg, 2005).
study included 181 undergraduate and graduate participants:
Participants were between 17 and 44 with a mean of 19 and a
Research in Higher Education Journal
Validation social emotional development, Page 10
were female and 110
were between 17 and 53,
rticipants were undergraduate and graduate students, enrolled in business
16%), education
would have a moderate
awareness factor score of the SED-I.
i would have a moderate
score of the SED-
i would have a moderate
significant positive correlation with the Connection to Others factor score of the SED-I.
Stress Management, Adaptability, and General Mood of the EQ-i would
calculated between each
supported, as there was a moderate, significant positive relationship
awareness factor score of the
I. In addition, although there were other significant relationships, this relationship had the
Hypotheses 3.2.2 and 3.2.3 were partially supported, as there was a significant positive
i and the Connection to Others
I. However, the correlations were small instead
awareness and Influence
sis 3.2.4 was not supported, as across all the analyses there were small to
moderate positive significant correlations between the measures, indicating substantial overlap
set of characteristics and tendencies that
of people that have
using the International
Factor Model (FFM) of
personality, originally developed by Thurstone (1934) and clarified by Goldberg (1992) and is
measuring personality” (Polednik & Greig,
sers rate how accurately the phrases
1” very
min to complete.
from .71 (Openness to Experience) to .89
and graduate participants: 93 (51%) were
Participants were between 17 and 44 with a mean of 19 and a

standard deviation of 3.0. Participants were enrolled in
sciences (12%), and the remainder is an aggregate of other schools (4%).
Our initial hypotheses were
H3.3.1 – Extraversion and Agreeableness scale scores of the IPIP will have small
positive correlations with the Connection to Others factor score of the SED
H3.3.2 – Conscientiousness scale scores of the IPIP will have a small positive
correlation with the Influence Orientation factor score of the SED
H3.3.3 – None of the other IPIP scale scores (including Emotional Stability and
Intellect) will have signif
To test the hypotheses Pearson’s correlation coefficient
factor of the IPIP and the factors
Hypothesis 3.3.1 was supported, as there was
Connection to Others factor of the SED
moderate positive correlation between the Agreeableness scale score of the IPIP. In addition,
those were the two highest correlations between the Connection to Others factor and the other
IPIP scores.
Hypothesis 3.3.2 was not supported, as there was a nonsignificant negligible
Conscientiousness-Influence correlation.
Hypothesis 3.3.3 was not supported, as both Emotional
to moderate significant positive correlations with each factor of the SED
Extraversion had moderate to strong correlations with Self
Connection to Others; Agreeableness
and Conscientiousness had small to moderate correlations with Connection to Others, Self
awareness, and Consideration of Others. Overall, there is quite a bit of overlap between the IPIP
and SED-I.
Study 3.4: Trait Meta-Mood Scale (TMMS)
The Trait Meta-Mood Scale (TMMS) focuses on assessing three core areas of emotion:
(1) Attention – attention that individuals devote to their feelings
experiences of these feelings; and (3)
states and prolonging positive ones
assessment that uses a five-point Likert scale asking participants how strongly they a
disagree with each statement. Results are organized into one of three factors: Attention, Clarity,
or Repair.
The TMMS sub-study included
were female and 94 (38%) were male
53 where M = 19 and SD = 3.3. Participants were enrolled in
pharmacy/health sciences (36%),
an aggregate of other schools (4%)
Our initial hypotheses were
H3.4.1 – Attention to feelings and Clarity of feelings scale scores from the
TMMS will have moderate positive correlations with the Self
the SED-I.
H3.4.2 - Repair scale score should no
scores.
Research in Higher Education Journal
Validation social emotional development, Page
. Participants were enrolled in business administration (84%), arts and
remainder is an aggregate of other schools (4%).
Our initial hypotheses were the following:
Extraversion and Agreeableness scale scores of the IPIP will have small
positive correlations with the Connection to Others factor score of the SED
Conscientiousness scale scores of the IPIP will have a small positive
correlation with the Influence Orientation factor score of the SED-I.
None of the other IPIP scale scores (including Emotional Stability and
Intellect) will have significant positive correlations with any of the SED-
s Pearson’s correlation coefficients were calculated between each
of the SED-I (Table 8).
Hypothesis 3.3.1 was supported, as there was a strong positive correlation between the
Connection to Others factor of the SED-I and the Extraversion scale score of the IPIP and a
moderate positive correlation between the Agreeableness scale score of the IPIP. In addition,
correlations between the Connection to Others factor and the other
Hypothesis 3.3.2 was not supported, as there was a nonsignificant negligible
Influence correlation.
Hypothesis 3.3.3 was not supported, as both Emotional Stability and Intellect had small
to moderate significant positive correlations with each factor of the SED-I. In addition
Extraversion had moderate to strong correlations with Self-awareness, Influence Orientation, and
Agreeableness had small to moderate relationships with all SED
and Conscientiousness had small to moderate correlations with Connection to Others, Self
awareness, and Consideration of Others. Overall, there is quite a bit of overlap between the IPIP
Mood Scale (TMMS)
Mood Scale (TMMS) focuses on assessing three core areas of emotion:
attention that individuals devote to their feelings; (2) Clarity – clarity of their
s; and (3) Repair – their beliefs about terminating negative mood
states and prolonging positive ones (Salovey et al., 1995, p. 127). The TMMS is a short, 30
point Likert scale asking participants how strongly they a
disagree with each statement. Results are organized into one of three factors: Attention, Clarity,
study included 248 undergraduate and graduate participants;
were female and 94 (38%) were male, with 1% not assigned. Participants were between 17 and
3.3. Participants were enrolled in business administration
(36%), arts and sciences (10%), education (7%), and the remainder in
(4%).
Our initial hypotheses were as follows:
Attention to feelings and Clarity of feelings scale scores from the
TMMS will have moderate positive correlations with the Self-awareness factor score of
Repair scale score should not correlate with any of the SED
Research in Higher Education Journal
Validation social emotional development, Page 11
business administration (84%), arts and
Extraversion and Agreeableness scale scores of the IPIP will have small
positive correlations with the Connection to Others factor score of the SED-I.
Conscientiousness scale scores of the IPIP will have a small positive
None of the other IPIP scale scores (including Emotional Stability and
-I factor scores.
calculated between each
a strong positive correlation between the
I and the Extraversion scale score of the IPIP and a
moderate positive correlation between the Agreeableness scale score of the IPIP. In addition,
correlations between the Connection to Others factor and the other
Hypothesis 3.3.2 was not supported, as there was a nonsignificant negligible
Stability and Intellect had small
I. In addition
awareness, Influence Orientation, and
had small to moderate relationships with all SED-I factors;
and Conscientiousness had small to moderate correlations with Connection to Others, Self-
awareness, and Consideration of Others. Overall, there is quite a bit of overlap between the IPIP
Mood Scale (TMMS) focuses on assessing three core areas of emotion:
clarity of their
their beliefs about terminating negative mood
(Salovey et al., 1995, p. 127). The TMMS is a short, 30-item
point Likert scale asking participants how strongly they agree or
disagree with each statement. Results are organized into one of three factors: Attention, Clarity,
undergraduate and graduate participants; 152 (61%)
. Participants were between 17 and
business administration (43%),
the remainder in
Attention to feelings and Clarity of feelings scale scores from the
awareness factor score of
t correlate with any of the SED-I factor
H3.4.3 – Attention to feelings and Clarity of feelings scale scores will have
significant positive correlations with Consideration, Connection, or Influence factors
scores of the SED-I.
To test the hypotheses Pearson’s correlation coefficient
factor of the TMMS and factor of the SED
Hypothesis 3.4.1 was partially supported, as there was a strong positive correlation
between Clarity of feelings of the TMMS and Self
relationship between Attention to feelings and Self
correlation, as Influence Orientation, Consideration of Others, and, in particular, Connection to
Others all had stronger correlations.
Hypothesis 3.4.2 was not supported as Repair emotions of the TMMS had a moderate
positive significant relationship to each factor of the SED
relationship between Repair and the various SED factors.
Hypothesis 3.4.3 was not supported as Attention to feelings and Clarity of feelings had
significant moderate positive relationshi
Study 3.5: Self-Monitoring (SM)
Self-monitoring presumes consistent patterns of individual differences in the extent to
which people regulate their self-presentation by tailoring their actions in acco
immediate situational cues (Lennox & Wolfe, 1984, p. 1349)
dimension of Consideration of Others is the thoughtful regard for the person and situation in
anticipating the likely consequenc
Consideration is monitoring, which includes recognizing/anticipating consequences and
regulating/thinking before speaking or acting.
relationship between Self-monitoring
The Self-Monitoring assessment (SM) uses a 13
respond to 5-point Likert type scale regarding their level of agreement with each item. Scores are
organized into two key dimensions of self
presentation and (2) Sensitivity Others
The SM sub-study included
were female and 89 (43%) were male. Participants were between 17 and 53 with a mean of 20
and a standard deviation of 4.2. Participants were enrolled in
and sciences (17%), education (8%), and
Our initial hypotheses were
H3.5.1 – Modify Self
significant positive correlation to the Consideration of Others factor of the SED
H5.2 – Neither of the SM scale sco
relationship to the three other SED factors.
To test the hypotheses Pearson’s correlation coefficient
dimension of the SD and factor of the SED
Hypothesis 3.5.1 was partially supported in that both modify self
sensitivity to others of the SM had significant, positive relationships with Consideration of
Others of the SED-I; however the correlations were small, not moderate.
Research in Higher Education Journal
Validation social emotional development, Page
Attention to feelings and Clarity of feelings scale scores will have
significant positive correlations with Consideration, Connection, or Influence factors
s Pearson’s correlation coefficients were calculated between each
and factor of the SED-I (Table 9).
Hypothesis 3.4.1 was partially supported, as there was a strong positive correlation
between Clarity of feelings of the TMMS and Self-awareness of the SED-I. However, the
relationship between Attention to feelings and Self-awareness was moderate and was t
correlation, as Influence Orientation, Consideration of Others, and, in particular, Connection to
Others all had stronger correlations.
Hypothesis 3.4.2 was not supported as Repair emotions of the TMMS had a moderate
ip to each factor of the SED-I. Of note is the consistency of the
relationship between Repair and the various SED factors.
Hypothesis 3.4.3 was not supported as Attention to feelings and Clarity of feelings had
significant moderate positive relationships to each factor of the SED-I as indicated above.
Monitoring (SM)
monitoring presumes consistent patterns of individual differences in the extent to
presentation by tailoring their actions in accordance with
immediate situational cues (Lennox & Wolfe, 1984, p. 1349). As mentioned earlier, the SED
Consideration of Others is the thoughtful regard for the person and situation in
anticipating the likely consequences before thinking and acting. One of the stated components of
Consideration is monitoring, which includes recognizing/anticipating consequences and
regulating/thinking before speaking or acting. Thus, we would expect a significant, positive
monitoring and the Consideration of Others factor of the SED
Monitoring assessment (SM) uses a 13-item survey, asking participants to
point Likert type scale regarding their level of agreement with each item. Scores are
dimensions of self-monitoring: (1) Modify self – ability to modify self
Sensitivity Others – sensitivity to expressive behavior of others
study included 209 undergraduate and graduate participants;
and 89 (43%) were male. Participants were between 17 and 53 with a mean of 20
and a standard deviation of 4.2. Participants were enrolled in business administration
(8%), and the remainder in an aggregate of other
Our initial hypotheses were the following:
Modify Self and Sensitivity Others of SM should both have a moderate
significant positive correlation to the Consideration of Others factor of the SED
Neither of the SM scale scores should have a moderate significant
relationship to the three other SED factors.
s Pearson’s correlation coefficients were calculated between each
and factor of the SED-I (Table 10).
Hypothesis 3.5.1 was partially supported in that both modify self-presentation and
sensitivity to others of the SM had significant, positive relationships with Consideration of
I; however the correlations were small, not moderate.
Research in Higher Education Journal
Validation social emotional development, Page 12
Attention to feelings and Clarity of feelings scale scores will have
significant positive correlations with Consideration, Connection, or Influence factors
calculated between each
Hypothesis 3.4.1 was partially supported, as there was a strong positive correlation
I. However, the
awareness was moderate and was the weakest
correlation, as Influence Orientation, Consideration of Others, and, in particular, Connection to
Hypothesis 3.4.2 was not supported as Repair emotions of the TMMS had a moderate
Of note is the consistency of the
Hypothesis 3.4.3 was not supported as Attention to feelings and Clarity of feelings had
I as indicated above.
monitoring presumes consistent patterns of individual differences in the extent to
rdance with
As mentioned earlier, the SED-I
Consideration of Others is the thoughtful regard for the person and situation in
One of the stated components of
Consideration is monitoring, which includes recognizing/anticipating consequences and
Thus, we would expect a significant, positive
and the Consideration of Others factor of the SED-I.
item survey, asking participants to
point Likert type scale regarding their level of agreement with each item. Scores are
ability to modify self-
sensitivity to expressive behavior of others.
undergraduate and graduate participants; 118 (57%)
and 89 (43%) were male. Participants were between 17 and 53 with a mean of 20
business administration (68%), arts
schools (7%).
thers of SM should both have a moderate
significant positive correlation to the Consideration of Others factor of the SED-I.
res should have a moderate significant
calculated between each
presentation and
sensitivity to others of the SM had significant, positive relationships with Consideration of
Hypothesis 3.5.2 was partially supported, as there was a small significant relationship
between Self-awareness on the SED
relationships corresponded as hypothesized.
Study 3.6: Marlowe-Crowne Social D
Social desirability is the tendency for individuals to respond
viewed favorably by others (Reynolds, 1982)
potential for bias due to the pressure on
short, 13 item survey that uses true/false answers.
The SD sub-study included
male. Participants were between 17 and 53
were enrolled in business administration
education (8%), and the remainder is an aggregate of other schools
Our initial hypothesis was
H3.6.1 – The four factor scores of
relationships with the SD score, and any correlations should be negligible.
To test the hypotheses Pearson’s correlation coefficient
factor of the SED-I and SD (Table 11).
Hypothesis 3.2.1 was partially supported in that Self
and Influence Orientation of the SED
meet the alpha .20 decision rules.
small significant positive correlation to SD.
DISCUSSION
The current study builds on the findings of earlier research (Seal et al., 2011b) that
validates a measure of social emotional competence development for higher education students,
the SED-I. This robust and comprehensive measure is expected to help educators to better assess
college students’ knowledge, traits, and behaviors to further their self
large number of EI measures exist
this constituent group. In addition, prior validity studies with emotional competency measures
have lacked a full spectrum of potential convergent/discriminant analyses assessed at the factor
level.
The psychometric properties of a
occasions of measurement (McArdle & Woodcock, 1997). The principal components analysis
results and the internal consistency of the SED
results of the previous study by Seal et al. (2011b). The current data set exhibited slightly higher
internal consistency scores across all factor
retained.
The SED-I factors of Influence Orientation and Connection to Others
test-retest reliability as compared to the Self
This may indicate that the Influence Orientation and Connection to Others factors are more
stable over time. These findings are not surprising
Consideration of Others might be expected to change over relatively brief time periods for
collegiate students and thus demonstrate lower test
Research in Higher Education Journal
Validation social emotional development, Page
Hypothesis 3.5.2 was partially supported, as there was a small significant relationship
awareness on the SED-I and sensitivity to others on SM; however, the other
relationships corresponded as hypothesized.
Social Desirability Scale (SD)
Social desirability is the tendency for individuals to respond in a manner that will be
(Reynolds, 1982). Correlations with this scale score
the pressure on respondents to appear socially desirable. The scale is a
short, 13 item survey that uses true/false answers.
study included 239 participants, 147 (62%) were female and 90 (38%) were
male. Participants were between 17 and 53 years of age, (mean = 19, SD = 3.5). Participants
business administration (45%), pharmacy/health (33%), arts and science
the remainder is an aggregate of other schools (7%).
as:
The four factor scores of the SED-I should not have significant
relationships with the SD score, and any correlations should be negligible.
s Pearson’s correlation coefficients were calculated between each
I and SD (Table 11).
was partially supported in that Self-awareness, Connection to Others,
and Influence Orientation of the SED-I all had negligible correlations with SD and all failed to
t the alpha .20 decision rules. However, Consideration of Others on the SED
small significant positive correlation to SD.
The current study builds on the findings of earlier research (Seal et al., 2011b) that
measure of social emotional competence development for higher education students,
This robust and comprehensive measure is expected to help educators to better assess
college students’ knowledge, traits, and behaviors to further their self-development.
exist, there are few current instruments that focus exclusively on
this constituent group. In addition, prior validity studies with emotional competency measures
have lacked a full spectrum of potential convergent/discriminant analyses assessed at the factor
The psychometric properties of a psychological test should be assessed from multiple
occasions of measurement (McArdle & Woodcock, 1997). The principal components analysis
results and the internal consistency of the SED-I were generally positive and similar to the
study by Seal et al. (2011b). The current data set exhibited slightly higher
internal consistency scores across all factors, except the Influence factor. A 4-factor model was
I factors of Influence Orientation and Connection to Others exhibited higher
retest reliability as compared to the Self-awareness and Consideration of Others factors.
This may indicate that the Influence Orientation and Connection to Others factors are more
stable over time. These findings are not surprising given that measures of Self-awareness and
Consideration of Others might be expected to change over relatively brief time periods for
collegiate students and thus demonstrate lower test-retest correlations.
Research in Higher Education Journal
Validation social emotional development, Page 13
Hypothesis 3.5.2 was partially supported, as there was a small significant relationship
I and sensitivity to others on SM; however, the other
in a manner that will be
score could indicate
to appear socially desirable. The scale is a
, 147 (62%) were female and 90 (38%) were
. Participants
arts and science (10%),
I should not have significant
relationships with the SD score, and any correlations should be negligible.
calculated between each
awareness, Connection to Others,
I all had negligible correlations with SD and all failed to
However, Consideration of Others on the SED-I exhibited a
The current study builds on the findings of earlier research (Seal et al., 2011b) that
measure of social emotional competence development for higher education students,
This robust and comprehensive measure is expected to help educators to better assess
development. Although a
exclusively on
this constituent group. In addition, prior validity studies with emotional competency measures
have lacked a full spectrum of potential convergent/discriminant analyses assessed at the factor
psychological test should be assessed from multiple
occasions of measurement (McArdle & Woodcock, 1997). The principal components analysis
I were generally positive and similar to the
study by Seal et al. (2011b). The current data set exhibited slightly higher
factor model was
exhibited higher
awareness and Consideration of Others factors.
This may indicate that the Influence Orientation and Connection to Others factors are more
awareness and
Consideration of Others might be expected to change over relatively brief time periods for

The correlations between the various measures and
integration of the concepts that create one pictur
examines separate elements of social and emotional competency development with the exception
of the Crowne-Marlow Social De
applying these elements to practical use
overlap and correlations to exist, we did not find a
SED-I as to suggest the SED-I is an unnecessarily redundant measure. Our a priori hypotheses
were grounded in multiple approaches to construct understanding and our data were measured at
more than one point in time providing
Limitations
As with any study, several caveats should be considered in the interpretation of the
results of our study. First, the test
generally used to examine the psychometric properties of a psyc
that the Connection to Others and Influence Orientation factors of the measure demonstrated
high test-retest reliability even after a significant time lag suggests these dimensions appear to be
robust. Second, our results may have been affected by same source bias or c
variance (CMV) which has been defined as
measured with and introduced as a function
Simmering, & Sturman, 2009, p. 763).
self-reported, the items all came from the same source and, thus, may be subject to CMV. Third,
we did not explicitly measure the I
SED-I. Thus, the correlative value of the SED
comparatively assessed in this analysis
participants on a college campus, different sampling pro
different sub-studies in this study, with varying subsets of students completing varying
combinations of the measures.
Future Directions
Future studies will need to provide additional reliability and validity evidence fo
SED-I. Based on the results of this study, specifically the PCA results for several questions and
the test-retest reliability study, some items may need to be revised or deleted from the measure.
Although the challenges will remain in recruiting coll
should be employed with a shorter time lag design and across a variety of grade and/or age levels
to help uncover outside factors explaining the differences in the test
the future, a confirmatory factor analysis will need to be conducted to validate the factor
structure of the measure. Additionally, future research should include a measure that is
comparative to the Influence Orientation factor on the SED
testing. Because our data is limited to self
multiple non-self-report sources, such as reports by others or behavioral data. Objective outcome
measures that would be especially relevant to this area of re
teamwork, relationship quality, or career readiness. Lastly, understanding the predictive utility of
this measure will be important and encourage greater use of the measure. This measure could
show added value as if it demonstrated the ability to predict grades and college retention, as well
Research in Higher Education Journal
Validation social emotional development, Page
The correlations between the various measures and the SED-I can be seen as a successful
integration of the concepts that create one picture of development possibilities. Each measure
of social and emotional competency development with the exception
Marlow Social Desirability scale. The SED-I takes a unique approach toward
applying these elements to practical use for higher education. While we would expect some
s to exist, we did not find a measure that correlated so strongly with the
I is an unnecessarily redundant measure. Our a priori hypotheses
were grounded in multiple approaches to construct understanding and our data were measured at
more than one point in time providing more confidence in the findings.
everal caveats should be considered in the interpretation of the
. First, the test-retest component of the study had a longer time frame than is
generally used to examine the psychometric properties of a psychological test. However, the fact
that the Connection to Others and Influence Orientation factors of the measure demonstrated
retest reliability even after a significant time lag suggests these dimensions appear to be
may have been affected by same source bias or common method
which has been defined as “systematic error variance shared among
measured with and introduced as a function of the same method and/or source” (Richardson,
Sturman, 2009, p. 763). Because all of the measures in the current study were
reported, the items all came from the same source and, thus, may be subject to CMV. Third,
we did not explicitly measure the Influence Orientation factor by any assessment
Thus, the correlative value of the SED-I Influence Orientation factor could not
comparatively assessed in this analysis. Finally, due to the challenges of obtaining research
participants on a college campus, different sampling procedures were used for each of the
studies in this study, with varying subsets of students completing varying
Future studies will need to provide additional reliability and validity evidence fo
I. Based on the results of this study, specifically the PCA results for several questions and
retest reliability study, some items may need to be revised or deleted from the measure.
Although the challenges will remain in recruiting college-aged students, additional studies
should be employed with a shorter time lag design and across a variety of grade and/or age levels
to help uncover outside factors explaining the differences in the test-retest scores over time. In
matory factor analysis will need to be conducted to validate the factor
structure of the measure. Additionally, future research should include a measure that is
comparative to the Influence Orientation factor on the SED-I to allow for convergent validity
esting. Because our data is limited to self-report data, future research should gather data from
report sources, such as reports by others or behavioral data. Objective outcome
measures that would be especially relevant to this area of research include grades, retention,
teamwork, relationship quality, or career readiness. Lastly, understanding the predictive utility of
this measure will be important and encourage greater use of the measure. This measure could
onstrated the ability to predict grades and college retention, as well
Research in Higher Education Journal
Validation social emotional development, Page 14
I can be seen as a successful
Each measure
of social and emotional competency development with the exception
I takes a unique approach toward
While we would expect some
so strongly with the
I is an unnecessarily redundant measure. Our a priori hypotheses
were grounded in multiple approaches to construct understanding and our data were measured at
everal caveats should be considered in the interpretation of the
retest component of the study had a longer time frame than is
hological test. However, the fact
that the Connection to Others and Influence Orientation factors of the measure demonstrated
retest reliability even after a significant time lag suggests these dimensions appear to be
ommon method
shared among variables
(Richardson,
Because all of the measures in the current study were
reported, the items all came from the same source and, thus, may be subject to CMV. Third,
ssessment other than the
could not be
. Finally, due to the challenges of obtaining research
cedures were used for each of the
studies in this study, with varying subsets of students completing varying
Future studies will need to provide additional reliability and validity evidence for the
I. Based on the results of this study, specifically the PCA results for several questions and
retest reliability study, some items may need to be revised or deleted from the measure.
aged students, additional studies
should be employed with a shorter time lag design and across a variety of grade and/or age levels
retest scores over time. In
matory factor analysis will need to be conducted to validate the factor
structure of the measure. Additionally, future research should include a measure that is
I to allow for convergent validity
report data, future research should gather data from
report sources, such as reports by others or behavioral data. Objective outcome
search include grades, retention,
teamwork, relationship quality, or career readiness. Lastly, understanding the predictive utility of
this measure will be important and encourage greater use of the measure. This measure could
onstrated the ability to predict grades and college retention, as well
as show career or relationship success. Although the potential benefits of social emotional
competence have been demonstrated (Boyatzis, Stubbs, & Taylor, 2002; Seal, Boyatzis, &
Bailey, 2006) previously, the focus has been on an adult population. The SED
that is appropriate for college-aged students accounting for the unique developmental stage and
experience.
REFERENCES
Bar-On, R. (1988). The development of an
Unpublished doctoral dissertation, Rhodes University, South Africa.
Bar-On, R. (1997). Bar-On Emotional Quotient Inventory. Toronto, ON: Multi
Bar-On, R. (2006). The Bar-On model of emotional
18(suppl.), 13-25.
Boyatzis, R.E. (1994). Stimulating self
Managerial Assessment and Development,
304-323.
Boyatzis, R. E., Stubbs, E. C., & Taylor, S. N. (2002). Learning cognitive and emotional
intelligence competencies through graduate management education.
Management Journal on Learning and Education
Buchanan, T.; Johnson, J. A.; & Goldberg, L. R. (2
inventory for use on the internet. European Journal of Psychological Assessment, 21 (2):
115-127.
Goldberg, L. R. (1992). The development of markers for the Big
Psychological Assessment
Goldberg, L. R. (2001). The International Personality Item Pool.
Goleman, D. (1995). Emotional Intelligence: Why it can matter more than IQ
Bantam Books.
Goleman, D. (1998). Working with emotional
Goleman, D., Boyatzis, R. E., & McKee, A. (2002).
Boston: Harvard Business School Press.
Kuh, G. D., Kinzie, J., Schuh, J. H., Whit, E. J. & Associates (2010).
Creating conditions that matter
Lennox, R. D., & Wolfe, R. N. (1984) Revision of the self
Personality and Social Psychology
Mayer, J. D.; Salovey, P.; & Caruso, P. (2002).
Test, Version 2.0 (MSCEIT V2.0)
McArdle, J. J., & Woodcock, R. W. (1997). Expanding test
developmental time-lag components.
Polednik, L & Greig, E. (2000). Personality and emotional intelligence.
Administrative Management
Reynolds, W. M. (1982). Development of reliable and valid short forms of the Marlowe
Social Desirability Scale.
Richardson, H. A., Simmering, M. J., & Sturman, M. C. (2009). A tale of three perspectives:
Examining post hoc statistical techniques for detection and correction of common method
variance. Organizational Research Metho
Research in Higher Education Journal
Validation social emotional development, Page
as show career or relationship success. Although the potential benefits of social emotional
competence have been demonstrated (Boyatzis, Stubbs, & Taylor, 2002; Seal, Boyatzis, &
, 2006) previously, the focus has been on an adult population. The SED-I is an assessment
aged students accounting for the unique developmental stage and
The development of an operational concept of psychological wellbeing
Unpublished doctoral dissertation, Rhodes University, South Africa.
On Emotional Quotient Inventory. Toronto, ON: Multi-Health Systems.
On model of emotional-social intelligence (ESI). Psicothema,
Boyatzis, R.E. (1994). Stimulating self-directed change: A required MBA course called
Managerial Assessment and Development, Journal of Management Education
Stubbs, E. C., & Taylor, S. N. (2002). Learning cognitive and emotional
intelligence competencies through graduate management education. Academy of
Management Journal on Learning and Education, 1, 150-162.
Buchanan, T.; Johnson, J. A.; & Goldberg, L. R. (2005). Implementing a five-factor personality
inventory for use on the internet. European Journal of Psychological Assessment, 21 (2):
Goldberg, L. R. (1992). The development of markers for the Big-Five factor structure.
Psychological Assessment, 4 (1): 26-42.
The International Personality Item Pool. (http://ipip.ori.org/)
Emotional Intelligence: Why it can matter more than IQ. New York, NY:
Working with emotional intelligence. New York: Bantam.
Goleman, D., Boyatzis, R. E., & McKee, A. (2002). Leadership and emotional intelligence
Boston: Harvard Business School Press.
Kuh, G. D., Kinzie, J., Schuh, J. H., Whit, E. J. & Associates (2010). Student success in colleg
reating conditions that matter. Jossey-Bass.
Lennox, R. D., & Wolfe, R. N. (1984) Revision of the self-monitoring scale. Journal of
Personality and Social Psychology, 46 (6), 1349-1364
Mayer, J. D.; Salovey, P.; & Caruso, P. (2002). Mayer-Salovey-Caruso Emotional Intelligence
Test, Version 2.0 (MSCEIT V2.0). Toronto, Canada: Multi-Health Systems.
McArdle, J. J., & Woodcock, R. W. (1997). Expanding test–retest designs to include
lag components. Psychological Methods, 2(4), 403-435.
olednik, L & Greig, E. (2000). Personality and emotional intelligence. The British Journal of
Administrative Management, 19: 9.
Reynolds, W. M. (1982). Development of reliable and valid short forms of the Marlowe
Social Desirability Scale. Journal of Clinical Psychology, 38, 119-125.
Richardson, H. A., Simmering, M. J., & Sturman, M. C. (2009). A tale of three perspectives:
Examining post hoc statistical techniques for detection and correction of common method
Organizational Research Methods, 12, 762–800.
Research in Higher Education Journal
Validation social emotional development, Page 15
as show career or relationship success. Although the potential benefits of social emotional
competence have been demonstrated (Boyatzis, Stubbs, & Taylor, 2002; Seal, Boyatzis, &
I is an assessment
aged students accounting for the unique developmental stage and
operational concept of psychological wellbeing.
Health Systems.
social intelligence (ESI). Psicothema,
directed change: A required MBA course called
Journal of Management Education, 18(3),
Stubbs, E. C., & Taylor, S. N. (2002). Learning cognitive and emotional
Academy of
factor personality
inventory for use on the internet. European Journal of Psychological Assessment, 21 (2):
Five factor structure.
(http://ipip.ori.org/)
. New York, NY:
Leadership and emotional intelligence.
Student success in college:
Journal of
uso Emotional Intelligence
Health Systems.
retest designs to include
435.
The British Journal of
Reynolds, W. M. (1982). Development of reliable and valid short forms of the Marlowe-Crowne
Richardson, H. A., Simmering, M. J., & Sturman, M. C. (2009). A tale of three perspectives:
Examining post hoc statistical techniques for detection and correction of common method
Salovey, P., & Mayer, J. D. (1990). Emotional intelligence.
Personality, 9, 185-211.
Salovey, P., Mayer, J. D., Goldman, S. L., Turvey, C., & Palfai, T. P. (1995).
Attention, Clarity, and Repair: Exploring Emotional Intelligence Using the Trait Meta
Mood Scale. Emotional, Disclosure, and Health
Psychological Associations (pp. 125
Seal, C. R. & Andrews-Brown, A. (
Emotional ability as a moderator of the mediated relationship of emotional quotient and
emotional competence. Organization Management Journal
Seal, C. R., Beauchamp, K., Miguel, K., & Scott,
self-report instrument to assess social and emotional development.
Psychological Issues in Organizational Culture
Seal, C. R., Boyatzis, R. E., & Bailey, J. R. (2006)
organizations. Organization Management Journal
Seal, C. R., Naumann, S. E., Scott, A., & Royce
development: A new model of learning in higher education.
Education Journal, 10, 1-
Thurstone, L. L. (1934). The vectors of mind.
Research in Higher Education Journal
Validation social emotional development, Page
Salovey, P., & Mayer, J. D. (1990). Emotional intelligence. Imagination, Cognition &
Salovey, P., Mayer, J. D., Goldman, S. L., Turvey, C., & Palfai, T. P. (1995). Emotional
Attention, Clarity, and Repair: Exploring Emotional Intelligence Using the Trait Meta
Emotional, Disclosure, and Health. Washington, DC: American
Psychological Associations (pp. 125-154).
Brown, A. (2010). An integrative model of emotional intelligence:
y as a moderator of the mediated relationship of emotional quotient and
Organization Management Journal, 7(2), 143-152.
Seal, C. R., Beauchamp, K., Miguel, K., & Scott, A. N. (forthcoming; 2011b). Development of a
report instrument to assess social and emotional development. Journal of
Psychological Issues in Organizational Culture. Expected publication in 2011.
Seal, C. R., Boyatzis, R. E., & Bailey, J. R. (2006). Fostering emotional and social intelligence in
Organization Management Journal, 3, 190-209.
Seal, C. R., Naumann, S. E., Scott, A., & Royce-Davis, J. (2011a). Social emotional
development: A new model of learning in higher education. Research in Higher
-13.
Thurstone, L. L. (1934). The vectors of mind. Psychological Review, 41, 1–32.
Research in Higher Education Journal
Validation social emotional development, Page 16
Imagination, Cognition &
Emotional
Attention, Clarity, and Repair: Exploring Emotional Intelligence Using the Trait Meta-
. Washington, DC: American
An integrative model of emotional intelligence:
y as a moderator of the mediated relationship of emotional quotient and
152.
A. N. (forthcoming; 2011b). Development of a
Journal of
. Expected publication in 2011.
. Fostering emotional and social intelligence in
Davis, J. (2011a). Social emotional
earch in Higher

Table 1–Item Scores, Correlation, Communalities, and CoefficientsItem Mean Median S.D. r - Factor
Q01 5.52 6 1.10 .52
Q02 4.83 5 1.20 .71
Q03 4.45 4 1.40 .46
Q04 4.70 5 1.18 .74
Q05 5.12 5 1.20 .52
Q06 5.01 5 1.02 .59
Q07 5.33 6 1.27 .48
Q08 4.74 5 1.03 .54
Q09 5.24 5 1.28 .46
Q10 4.79 5 1.38 .39
Q11 5.81 6 1.02 .56
Q12 4.75 5 1.12 .62
Q13 4.46 4 1.42 .43
Q14 4.46 4 1.23 .69
Q15 5.32 5 1.25 .54
Q16 4.84 5 1.19 .34
Q17 4.58 5 1.30 .28
Q18 3.81 4 1.37 .50
Q19 4.88 5 1.22 .52
Q20 4.74 5 .99 .32
Q21 4.80 5 1.55 .50
Q22 5.00 5 1.09 .38
Q23 5.33 5 1.01 .43
Q24 4.74 5 1.07 .50
Q25 5.86 6 .89 .54
Q26 5.41 6 1.20 .52
Q27 4.97 5 1.42 .45
Q28 5.70 6 1.12 .58
Q29 6.11 6 .82 .58
Q30 5.73 6 .88 .40
Q31 5.75 6 .90 .59
Q32 5.04 5 1.29 .49
Q33 5.92 6 .94 .57
Q34 5.43 6 1.12 .55
Q35 5.62 6 1.04 .45
Q36 5.54 6 1.04 .56
Q37 5.02 5 1.44 .42
Q38 5.67 6 1.10 .60
Q39 5.69 6 1.17 .56
Q40 5.43 6 1.00 .38
Q41 5.62 6 .97 .53
Q42 5.29 5 1.21 .35
Q43 6.07 6 .85 .55
Q44 5.89 6 .88 .54
Q45 4.42 4 1.36 .32
Q46 5.44 6 1.14 .42
Q47 4.85 5 1.27 .45
Q48 5.83 6 1.00 .48
Research in Higher Education Journal
Validation social emotional development, Page
Item Scores, Correlation, Communalities, and CoefficientsFactor Com.
4 Factor
Aware Consider Connect Influence
.52 .41 .41 .33
.71 .67 -
.46 .45 .66
.74 .73 -
.52 .39 .36 -
.59 .46 -
.48 .40 -
.54 .40 -
.46 .31 .44
.39 .24 -
.56 .44 .43 .40
.62 .53 -
.43 .44 .65
.69 .63 -
.54 .46 .34 .50
.34 .23
.28 .41 .34 .56
.50 .39 -
.52 .39 .35 .36
.32 .18 -
.50 .35 .54
.38 .23 -
.43 .30 .36
.50 .38 -
.54 .47 .68
.52 .39 .54
.45 .24 .33
.58 50 .63
.58 .49 .65
.40 .41 .60
.59 .43 .56
.49 .60 .78
.57 .43 .63
.55 .49 .66
.45 .41 .66
.56 .43 .33 .48
.42 .18
.60 .50 .57
.56 .45 .70
.38 .35 .47
.53 .39 .61
.35 .26 .39
.55 .43 .64
.54 .36 .42 .34
.32 .30 .35 .38
.42 .25 .36
.45 .22 .38
.48 .29 .38
Research in Higher Education Journal
Validation social emotional development, Page 17
Item Scores, Correlation, Communalities, and Coefficients Influence
-.84
-.88
-.40
-.64
-.44
-.57
-.48
-.75
-.82
-.65
-.35
-.35
-.47
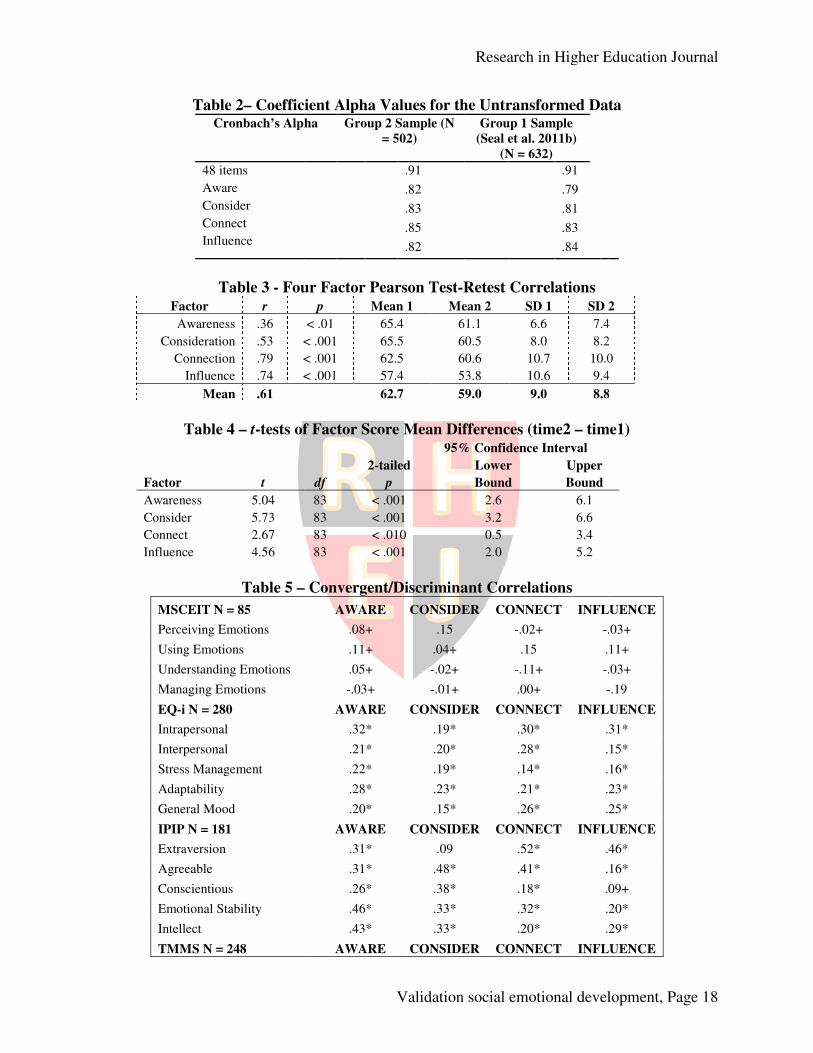
Table 2– Coefficient Alpha Values for the Untransformed Data Cronbach’s Alpha
48 items
Aware
Consider
Connect
Influence
Table 3 - Four Factor Pearson Test
Factor r
Awareness .36
Consideration .53 < .001
Connection .79 < .001
Influence .74 < .001
Mean .61
Table 4 – t-tests of Factor Score Mean Differences (time2
Factor t
Awareness 5.04
Consider 5.73
Connect 2.67
Influence 4.56
Table 5 –
MSCEIT N = 85
Perceiving Emotions
Using Emotions
Understanding Emotions
Managing Emotions
EQ-i N = 280
Intrapersonal
Interpersonal
Stress Management
Adaptability
General Mood
IPIP N = 181
Extraversion
Agreeable
Conscientious
Emotional Stability
Intellect
TMMS N = 248
Research in Higher Education Journal
Validation social emotional development, Page
Coefficient Alpha Values for the Untransformed Data Cronbach’s Alpha Group 2 Sample (N
= 502)
Group 1 Sample
(Seal et al. 2011b)
(N = 632)
.91 .91 .82 .79 .83 .81 .85 .83 .82 .84
Four Factor Pearson Test-Retest Correlations p Mean 1 Mean 2 SD 1 SD 2
< .01 65.4 61.1 6.6 7.4
< .001 65.5 60.5 8.0 8.2
< .001 62.5 60.6 10.7 10.0
< .001 57.4 53.8 10.6 9.4
62.7 59.0 9.0 8.8
tests of Factor Score Mean Differences (time2 – time1)95% Confidence Interval
2-tailed Lower Upper
df p Bound Bound
83 < .001 2.6 6.1
83 < .001 3.2 6.6
83 < .010 0.5 3.4
83 < .001 2.0 5.2
– Convergent/Discriminant Correlations
AWARE CONSIDER CONNECT INFLUENCE
.08+ .15 -.02+ -.03+
.11+ .04+ .15 .11+
.05+ -.02+ -.11+ -.03+
-.03+ -.01+ .00+ -
AWARE CONSIDER CONNECT INFLUENCE
.32* .19* .30* .31*
.21* .20* .28* .15*
.22* .19* .14* .16*
.28* .23* .21* .23*
.20* .15* .26* .25*
AWARE CONSIDER CONNECT INFLUENCE
.31* .09 .52* .46*
.31* .48* .41* .16*
.26* .38* .18* .09+
.46* .33* .32* .20*
.43* .33* .20* .29*
AWARE CONSIDER CONNECT INFLUENCE
Research in Higher Education Journal
Validation social emotional development, Page 18
Coefficient Alpha Values for the Untransformed Data
SD 2
7.4
8.2
10.0
9.4
8.8
time1)
INFLUENCE
.03+
.11+
.03+
-.19
INFLUENCE
.31*
.15*
.16*
.23*
.25*
INFLUENCE
.46*
.16*
.09+
.20*
.29*
INFLUENCE
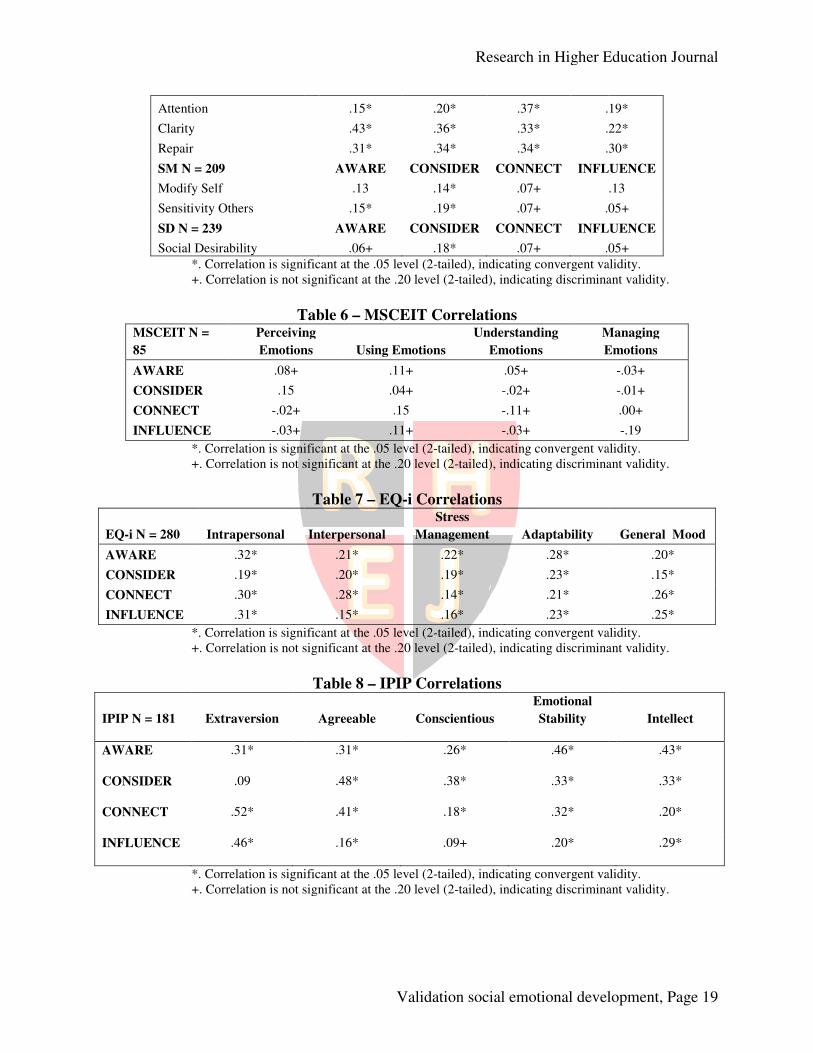
Attention
Clarity
Repair
SM N = 209
Modify Self
Sensitivity Others
SD N = 239
Social Desirability
*. Correlation is significant at the .05 level (2
+. Correlation is not significant at the .20 level (2
Table 6 MSCEIT N =
85
Perceiving
Emotions
AWARE .08+
CONSIDER .15
CONNECT -.02+
INFLUENCE -.03+
*. Correlation is significant at the .05 level (2
+. Correlation is not significant at the .20 level (2
EQ-i N = 280 Intrapersonal
AWARE .32*
CONSIDER .19*
CONNECT .30*
INFLUENCE .31*
*. Correlation is significant at the .05 level (2
+. Correlation is not significant at the .20 level (2
IPIP N = 181 Extraversion
AWARE .31*
CONSIDER .09
CONNECT .52*
INFLUENCE .46*
*. Correlation is significant at the .05 level
+. Correlation is not significant at the .20 level (2
Research in Higher Education Journal
Validation social emotional development, Page
.15* .20* .37* .19*
.43* .36* .33* .22*
.31* .34* .34* .30*
AWARE CONSIDER CONNECT INFLUENCE
.13 .14* .07+
.15* .19* .07+ .05+
AWARE CONSIDER CONNECT INFLUENCE
.06+ .18* .07+ .05+
*. Correlation is significant at the .05 level (2-tailed), indicating convergent validity.
Correlation is not significant at the .20 level (2-tailed), indicating discriminant validity.
Table 6 – MSCEIT Correlations Perceiving
Emotions Using Emotions
Understanding
Emotions
Managing
Emotions
.11+ .05+
.04+ -.02+
.15 -.11+
.11+ -.03+
*. Correlation is significant at the .05 level (2-tailed), indicating convergent validity.
+. Correlation is not significant at the .20 level (2-tailed), indicating discriminant validity.
Table 7 – EQ-i Correlations
Interpersonal
Stress
Management Adaptability
.21* .22* .28*
.20* .19* .23*
.28* .14* .21*
.15* .16* .23*
*. Correlation is significant at the .05 level (2-tailed), indicating convergent validity.
+. Correlation is not significant at the .20 level (2-tailed), indicating discriminant validity.
Table 8 – IPIP Correlations
Agreeable Conscientious
Emotional
Stability
.31* .26* .46*
.48* .38* .33*
.41* .18* .32*
.16* .09+ .20*
*. Correlation is significant at the .05 level (2-tailed), indicating convergent validity.
+. Correlation is not significant at the .20 level (2-tailed), indicating discriminant validity.
Research in Higher Education Journal
Validation social emotional development, Page 19
.19*
.22*
.30*
INFLUENCE
.13
.05+
INFLUENCE
.05+
tailed), indicating convergent validity. tailed), indicating discriminant validity.
Managing
Emotions
-.03+
-.01+
.00+
-.19
tailed), indicating convergent validity. discriminant validity.
General Mood
.20*
.15*
.26*
.25*
tailed), indicating convergent validity. tailed), indicating discriminant validity.
Intellect
.43*
.33*
.20*
.29*
tailed), indicating convergent validity. tailed), indicating discriminant validity.
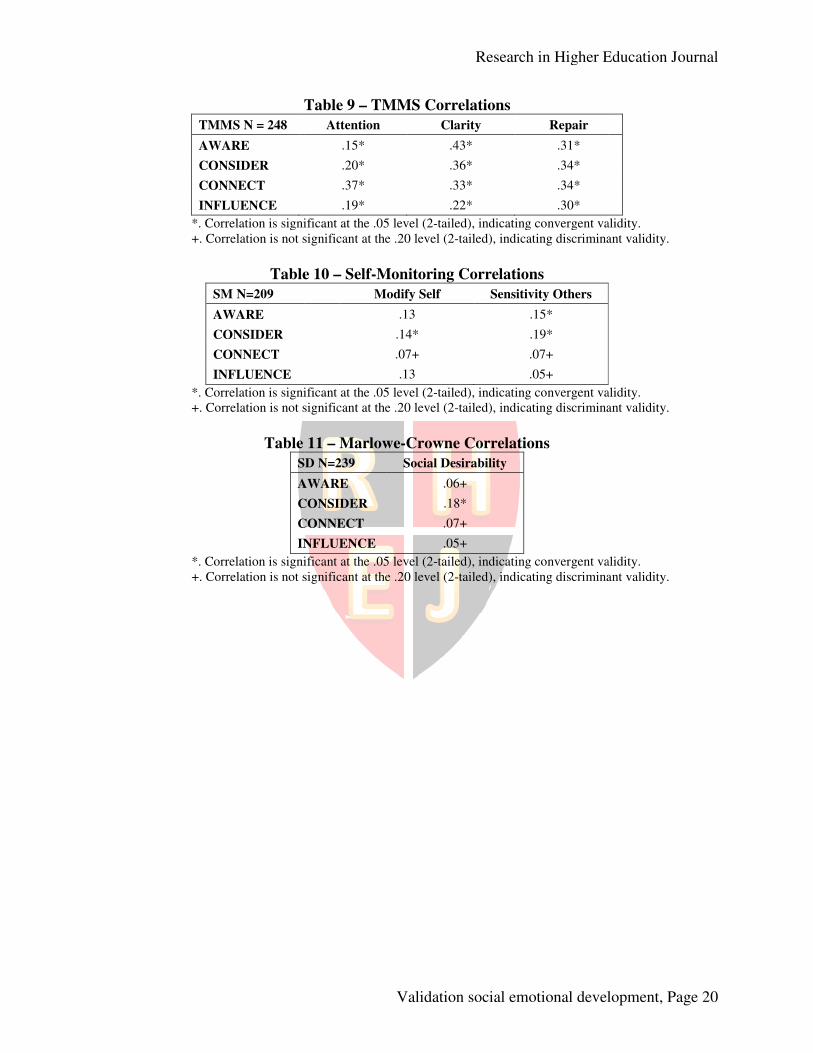
Table 9
TMMS N = 248
AWARE
CONSIDER
CONNECT
INFLUENCE
*. Correlation is significant at the .05 level (2
+. Correlation is not significant at the .20 level (2
Table 10
SM N=209
AWARE
CONSIDER
CONNECT
INFLUENCE
*. Correlation is significant at the .05 level (2
+. Correlation is not significant at the .20 level (2
Table 11
SD N=239
AWARE
CONSIDER
CONNECT
INFLUENCE
*. Correlation is significant at the .05 level
+. Correlation is not significant at the .20 level (2
Research in Higher Education Journal
Validation social emotional development, Page
Table 9 – TMMS Correlations
Attention Clarity Repair
.15* .43* .31*
.20* .36* .34*
.37* .33* .34*
.19* .22* .30*
*. Correlation is significant at the .05 level (2-tailed), indicating convergent validity.
+. Correlation is not significant at the .20 level (2-tailed), indicating discriminant validity.
Table 10 – Self-Monitoring Correlations
Modify Self Sensitivity Others
.13 .15*
.14* .19*
.07+ .07+
.13 .05+
*. Correlation is significant at the .05 level (2-tailed), indicating convergent validity.
not significant at the .20 level (2-tailed), indicating discriminant validity.
Table 11 – Marlowe-Crowne Correlations
SD N=239 Social Desirability
AWARE .06+
CONSIDER .18*
CONNECT .07+
INFLUENCE .05+
*. Correlation is significant at the .05 level (2-tailed), indicating convergent validity.
+. Correlation is not significant at the .20 level (2-tailed), indicating discriminant validity.
Research in Higher Education Journal
Validation social emotional development, Page 20
tailed), indicating convergent validity. tailed), indicating discriminant validity.
tailed), indicating convergent validity. tailed), indicating discriminant validity.
tailed), indicating convergent validity. tailed), indicating discriminant validity.