Development of an objective instrument to assess quality ... · Development of an objective...
19
© International Journal of Clinical and Health Psychology ISSN 1697-2600 2010, Vol. 10, Nº 1, pp. 105-123 Development of an objective instrument to assess quality of life in social services: Reliability and validity in Spain 1 Miguel Ángel Verdugo 2 (University of Salamanca, Spain), Benito Arias (University of Valladolid, Spain), Laura E. Gómez (University of Valladolid, Spain), and Robert L. Schalock (Hastings College, USA) ABSTRACT. This study reports on the development and validation of a questionnaire that allows the objective assessment of the quality of life of social service users. Because of the increasing demand for applying the concept of quality of life in social services for handicapped people, and because of the need to have a sensitive tool to use as a basis for organizational changes, the development of GENCAT Scale was carried out. The first study entailed the construction of items based on our current understanding of quality of life domains and indicators. In the second study, the psychometric properties of the Catalonian version of the GENCAT Scale were analyzed after applying the instrument to a representative sample of 608 professionals and 3,029 users of 239 services from Catalonia. The results showed reliability in terms of internal consistency of .92. The scale’s dimensionality was studied using confirmatory factor analysis (CFA). Finally, the use of this scale is discussed as a useful and innovative tool to serve as the basis for evidence-based practices, the improvement of services and programs. KEYWORDS. Quality of life assessment. Questionnaire development. Social services. Instrumental study. 1 This work was supported by funding from the Catalonian Institute of Assistance and Social Services (Action and Citizenship Department, Generalitat of Catalonia, Spain) and developed under the framework of research activities related to I+D SEJ2006-12575 project (Spanish Ministry of Science and Innovation) and the Excellence Research Group on Disabilities (GR 197; EDU/894/ 2009) (‘Junta de Castilla y León’, Spain). The authors are grateful to services, centers, entities and professionals for their collaboration in the field test of this study. 2 Correspondence: Institute on Community Integration (INICO). Facultad de Psicología. Universidad de Salamanca. Avda. de la Merced, 109-131. 37005 Salamanca (Spain). E-mail: [email protected]
Transcript of Development of an objective instrument to assess quality ... · Development of an objective...

© International Journal of Clinical and Health Psychology ISSN 1697-26002010, Vol. 10, Nº 1, pp. 105-123
Development of an objective instrument to assessquality of life in social services: Reliability
and validity in Spain1
Miguel Ángel Verdugo2 (University of Salamanca, Spain), Benito Arias(University of Valladolid, Spain), Laura E. Gómez (University of Valladolid, Spain),
and Robert L. Schalock (Hastings College, USA)
ABSTRACT. This study reports on the development and validation of a questionnairethat allows the objective assessment of the quality of life of social service users.Because of the increasing demand for applying the concept of quality of life in socialservices for handicapped people, and because of the need to have a sensitive tool touse as a basis for organizational changes, the development of GENCAT Scale wascarried out. The first study entailed the construction of items based on our currentunderstanding of quality of life domains and indicators. In the second study, thepsychometric properties of the Catalonian version of the GENCAT Scale were analyzedafter applying the instrument to a representative sample of 608 professionals and 3,029users of 239 services from Catalonia. The results showed reliability in terms of internalconsistency of .92. The scale’s dimensionality was studied using confirmatory factoranalysis (CFA). Finally, the use of this scale is discussed as a useful and innovativetool to serve as the basis for evidence-based practices, the improvement of services andprograms.
KEYWORDS. Quality of life assessment. Questionnaire development. Social services.Instrumental study.
1 This work was supported by funding from the Catalonian Institute of Assistance and Social Services(Action and Citizenship Department, Generalitat of Catalonia, Spain) and developed under theframework of research activities related to I+D SEJ2006-12575 project (Spanish Ministry ofScience and Innovation) and the Excellence Research Group on Disabilities (GR 197; EDU/894/2009) (‘Junta de Castilla y León’, Spain). The authors are grateful to services, centers, entitiesand professionals for their collaboration in the field test of this study.
2 Correspondence: Institute on Community Integration (INICO). Facultad de Psicología. Universidadde Salamanca. Avda. de la Merced, 109-131. 37005 Salamanca (Spain). E-mail: [email protected]

Int J Clin Health Psychol, Vol. 10. Nº 1
106 VERDUGO et al. Objective instrument to assess quality of life
RESUMEN. Este estudio instrumental describe el proceso de desarrollo y validaciónde un instrumento de evaluación objetiva de la calidad de vida de usuarios de serviciossociales. Ante la creciente demanda para aplicar el concepto de calidad de vida en losservicios dirigidos a personas en situación de desventaja social y ante la necesidad decontar con instrumentos sensibles a los cambios organizacionales, se planteó el desa-rrollo de la Escala GENCAT. El primer estudio consistió en la elaboración y evaluaciónteórica de los ítems. En el segundo estudio se analizaron las propiedades psicométricasde la versión catalana del instrumento tras su aplicación a una muestra representativade Cataluña formada por 608 profesionales y 3.029 usuarios de 239 centros y orga-nizaciones catalanas proveedoras de servicios sociales. Los resultados indicaron unaconsistencia interna de .92. La dimensionalidad de la escala se estudió mediante análisisfactorial confirmatorio (AFC). Finalmente, se discute el uso de la escala como uninstrumento útil y novedoso para la mejora continua de la calidad de los servicios ypara el desarrollo de programas basados en evidencias empíricas.
PALABRAS CLAVE. Evaluación de la calidad de vida. Desarrollo de cuestionario.Servicios sociales. Estudio instrumental.
This article describes an instrumental study (Montero and León, 2007) whose goalsconsisted in developing and validating an objective quality of life (QOL) questionnairefor users of social and human services: the GENCAT Scale3 (Verdugo, Arias, Gomez, andSchalock, 2008a, 2008b). During the last three decades, the concept of quality of life hasevolved from a generic philosophical concept to a sensitizing notion that guides programpractices, from an individual perspective to a social construct that allows assessing thecore domains of quality of life and guides quality improvement, and to a researchconstruct that serves as a systematic structure to develop politics and practices toenhance peoples’ quality of life. It is widely accepted that this concept is important insocial, health, human and educative services since it is currently being used to implementperson-centered programmes and practices, to assess and report personal outcomes, toguide quality improvement strategies, and to evaluate the effectiveness of those practicesand strategies (Martín-Rodríguez and Pérez-San Gregorio, 2007; McCabe, Firth, andO’Connor, 2009; Schalock, Bonham, and Verdugo, 2008). The QOL concept has recentlybegun to be applied in social policies since it has become a reference model for serviceprovision, a basis for evidence-based practices, and a tool to develop quality improvementstrategies (Schalock and Verdugo, 2002, 2007, 2008).
The construction of an assessment tool must be supported by a theoretical framework.To that end, the GENCAT Scale has been developed on the basis of the eight-domainmodel proposed by Schalock and Verdugo (2002) and subsequent work regarding themodel’s validation and cross-cultural use (Jenaro et al., 2005; Schalock, Verdugo, Bonham,Fantova, and Van Loon, 2008; Schalock et al., 2005; Verdugo, Arias, and Gómez, 2006;Verdugo, Gómez, Arias, and Martin, 2006; Verdugo and Schalock, 2003). The main reasonto choose this conceptual framework among other existing ones (such as those proposedby Cummins, 2005; Felce and Perry, 1995; Gardner and Carran, 2005; Perry and Felce,2005) was that it was the most cited in publications about person-centered QOL in

Int J Clin Health Psychol, Vol. 10. Nº 1
VERDUGO et al. Objective instrument to assess quality of life 107
disabilities last years. Although this framework was initially developed in the field ofintellectual disabilities, its use is being expanding not only to other kind of disabilities,but also to other target populations such as person’s with chemical dependency (DeMaeyer, Vanderplasschen, and Broekaert, 2009) and elderly (Gómez, Verdugo, Arias, andNavas, 2008).
According to this framework, QOL is composed of eight domains and core indicators(listed in Table 1) that define operationally each QOL domain. The indicator measurementresults in personal outcomes that can be used for both reporting purposes and guidingorganization improvements (Keith and Bonham, 2005; Langberg and Smith, 2006; Schalockand Bonham, 2003; Schalock, Bonham et al., 2008; Schalock, Verdugo et al., 2008;Veerman and van Yperen, 2007). QOL is defined as a concept that a) is multidimensional;b) has etic (universal) and emic (culture-bound) properties (Jenaro et al., 2005; Schalocket al., 2005); c) is influenced by personal and environmental factors; and d) hasobjective and subjective components (Schalock and Verdugo, 2007). Depending on thepurpose and the perspective of the instrument developed, indicator items will be usedto assess either person’s perceived well-being on the item (‘self-report’) or the person’slife experiences and circumstances (‘direct observation’) (Schalock, Bonham, and Ver-dugo, 2008).
TABLE 1. Domains and core indicators of quality of life.
Domains Indicators Item examples
Emotional well-being (EW)
Mental stability; satisfaction, self-concept; lack of stress/negative feelings
He/she shows symptoms of depression.
Interpersonal relations (IR)
Social relationships; family relationships; to have stable and clearly identifies friends; to have positive and gratifying social contacts
He/she complains about his/her relationships with friends.
Material well-being (MW)
Housing conditions; workplace conditions; Services conditions; employment; incomes/salary; possessions
His/her incomes are not enough to afford whims.
Personal development (PD)
Education; learning opportunities; work abilities; functional abilities (personal competency; adaptive behavior, etc.); activities of daily living.
He/she is involved in the development of his/her individual planning.
Physical wellbeing (PW)
Health care; sleep; health consequences (sorrow, medication, etc.); health; mobility; technical assistance
He/she has sleep problems.
Self-determination (SD)
Autonomy; goals and personal preferences; decisions; choices
Other people decide how to spend his/her money.
Social inclusion (SI) Participation; integration; supports His/her family supports him/her.
Rights (RI) Knowledge of rights; defense of rights; exercise of rights; privacy; respect
He/she suffers exploitation, violence or abuse.

Int J Clin Health Psychol, Vol. 10. Nº 1
108 VERDUGO et al. Objective instrument to assess quality of life
In this sense, we can speak about objective and subjective measures and measurementinstruments, depending on their purpose, content, and respondent (Bonham, Basehart,and Marchand, 2005; Bonham et al., 2004; Brown, Keith, and Schalock, 2004; Cummins,1997, 2005; Gardner and Carran, 2005; Keith and Bonham, 2005; Keith and Schalock,2000; Perry and Felce, 1995, 2005; Schalock, Bonham, and Verdugo, 2008; Schalock etal., 2002; Schalock and Felce, 2004; Schalock, Gardner, and Bradley, 2007; Schalock andVerdugo, 2002, 2007; Verdugo, Arias, and Gómez, 2006; Verdugo et al., 2008b; Verdugo,Arias, Gómez, and van Loon, 2007; Verdugo, Gómez, and Arias, 2007; Verdugo, Gómez,Arias, and Schalock, 2009; Verdugo, Gomez, Schalock, and Arias, in press; Walsh,Erickson, Bradley, Moseley, and Schalock, 2006). If an evaluator desires to assesspersonal outcomes and develop person-centered programs, subjective Likert-type scalesanswered by the client or user of the service should be applied (Schalock and Felce,2004). In distinction, when the goal is program evaluation, service quality improvement,or to assess organizational changes, it is recommended to use objective questionnairesbased on the direct observation of personal experiences and circumstances.
The purpose of this two part study was to develop an instrument and evaluate itspsychometric properties that serves the purposes discussed above. In terms of its firstpurpose, the GENCAT Scale was developed through a systematic and rigorous method,following the recommendations for instrumental studies (Carretero-Dios and Pérez, 2007).The GENCAT developmental method has served nationally and internationally as amodel for developing other multidimensional QOL scales focusing on the context (Schalock,Keith, Verdugo, and Gómez, in press; Arias, Gómez, Schalock, and Verdugo, 2007; VanLoon, van Hove, Schalock, and Claes, 2008). In reference to the second purpose,psychometric properties of the measures provided by the Catalonian version of theGENCAT scale were analyzed. As this is an objective instrument, professionals assessthe quality of life of social service users after observing them. So, it must be noted thatthe psychometric properties of the GENCAT measures belong to the ratings made bythe professionals rather than the users assessed.
STUDY 1: ITEM CONSTRUCTION AND ITEM THEORETICAL ASSESSMENTThe development of the GENCAT Scale involved the suggested steps for developing
multidimensional QOL questionnaires (Schalock et al., in press; Verdugo et al., in press;Verdugo, Schalock et al., 2007).
Step I: Selecting representative itemsOnce the conceptual and measurement framework has been defined and the goal
of the assessment has been specified, the next step in the development of an instrumententails selecting representative items. A concept mapping approach is typically used toselect specific items (Schalock et al., in press). With this goal, an exhaustive review ofprevious QOL research and literature was carried out. As the final scale should have8 items per domain at least (n = 64), a pool of more than 300 items based on that reviewwas developed; the items were organized by the 8 domains and 46 core indicators thatwere found in the literature. Next, items were organized by microsystem (individual and
Int J Clin Health Psychol, Vol. 10. Nº 1
VERDUGO et al. Objective instrument to assess quality of life 109
family level), mesosystem (organizational level) and macrosystem (societal level). As thegoal of the instrument was being sensitive to organizational changes and person-centered programs, items referred to macrosystem level were eliminated since they arenot dependent on organizational interventions. The most representative items of theremaining classification categories were selected and new items were created when itwas necessary (there should be at least 2 items by indicator, 10 items by domain, and2 items by system –micro and meso- in each domain). Once all categories were representedas it has been indicated, the selected items (n = 106) were reformulated as third-personstatements to be answered by an external observer with 4-frequency options (Never orhardly ever, Often, Sometimes, and Always or almost always).
Step II: Panel of expertsWith the goal of studying the evidence based on the content of the test, the 106
items were evaluated by 73 judges that were experts in QOL. About 16.4% (n = 12) wereexperts on QOL in elderly, 11% (n = 8) in mental health, 19.2% (n = 14) in physicaldisabilities, 4.1% (n = 3) in auditory disabilities, 8.2% (n = 6) in visual disabilities, 24.7%(n = 18) in intellectual disabilities, 11% (n = 8) in drug dependences, and 5.5% (n = 4)in AIDS/HIV. Their task was to evaluate the 106 items, sorted by domains, from 1 to 10in three categories: Idoneity (degree in which the item is adequate to assess thedomain), importance (degree in which the item is important to assess person-centeredQOL) and observability (degree in which the action is subject of direct observation).Besides, the experts were asked for making reformulations, suggestions or commentariesabout the proposed items, and for adding new items and indicators if they consideredas important. Obtained information was analyzed using qualitative and quantitativemethods.
Expert concordance was analyzed by Bangdiwala’s Weighted Agreement Coefficient(BW
N) (Bangdiwala, 1987), a weighted kappa statistic which takes into account differentmarginal frequencies in the data. As Cohen’s kappa, Bangdiwala’s coefficient rangesfrom 0 (No agreement) to 1 (Perfect agreement). The agreement strength mean wassubstantial (M = .61), as it is shown in Table 2 and taking into account the high numberof participating experts (n = 73, when normally 6-10 participants participate in this kindof studies). The mean rank comparison among groups (elderly, intellectual disabilities,auditory disabilities, visual disabilities, mental health, drug dependences, and HIV/AIDS) was calculated for idoneity, importance and observability using Kruskal-Wallistest. The groups presented significant differences (p < .05) in idoneity mean for 13 items,in importance for 14, and in observability for 4 items. In total, 22 items showed significantdifferences for one criterion (only one item showed significant differences for the threecriteria). In this way, a high agreement for idoneity, importance and observability wasfound for 84 items (79.25%). Thus, very high correlation coefficients (p < .001) wereobserved among idoneity and importance (r > .80), and slightly lower among them andobservability (r ≈ .60) for all domains. The highest correlations were found for Self-determination and the lowest ones for Social inclusion.

Int J Clin Health Psychol, Vol. 10. Nº 1
110 VERDUGO et al. Objective instrument to assess quality of life
TABLE 2. Bangdiwala’s Weighted Agreement Coefficient (BWN) means.
Domains Idoneity Importance Observability M
Emotional well-being .60 .58 .57 .59
Interpersonal relations .57 .58 .56 .57
Material well-being .54 .56 .57 .56
Personal development .51 .53 .54 .53
Physical well-being .68 .69 .67 .68
Self-determination .69 .64 .63 .65
Social inclusión .77 .76 .71 .75
Rights .67 .69 .61 .65
M .62 .62 .60 .61
The next step involved calculating item mean scores (M) and standard deviations(SD) for idoneity, importance and observability. The criterion was to eliminate thoseitems presenting higher standard deviations and lower means. In order to safeguard thecontent validity, idoneity to assess the domain took priority over importance, and thisone took it over observability. This led to the elimination of items presenting M < 8 andSD e» 2.5 for idoneity and importance, and M < 6 and SD > 3 for observability. Only20 items (18.86%) did not meet these requirements and so were eliminated (EW = 5; IR= 3; MW = 5; PD = 4; PW = 2; RI = 1). Among these 20 items, 15 did not meet the idoneityrequirements, 16 did not meet the importance ones, and only 2 did not meet the onereferred to observability. In conclusion, the analyses resulted in 86 items (81.13%) thatwere considered as valid by experts. Among these, the 55 most adequate items (EW =8; IR = 8; MW = 8; PD = 6, PW = 6, SD = 8; SI = 3, and RI = 8) were selected not onlytaking into account their M and SD, but also if they were representative of all coreindicators and the two system levels in each domain (with the exception of Emotionalwellbeing, whose items were only related to microsystem since it is something internalto individuals). Some of them were lightly reformulated following expert suggestions.
As it was determined that each domain should consist of 8 items at least, domainswere completed with a selection of new items and indicators proposed by the experts.They proposed a total of 97 items (EW = 12; IR = 11; MW = 15; PD = 13, PW = 11, SD= 12; SI = 12, and RI = 11) and 17 indicators (MW = 7; PD = 3, PW = 4, SI = 1; IR =2). After an exhaustive review of all them, the most adequate were selected accordingto the following criteria: a) number of experts proposing the item; b) theoretical evidenceabout their belonging to the domain; c) evidence about not similar items included in thescale; e) influence on person-centered QOL; and f) organizational opportunities to takepart and achieve changes. The result of this review was the selection of 9 new items(PD = 2; PW = 2; SI = 5), and 4 indicators: limitations and abilities (PD), new technologies(PD), diet (PW), and accessibility (SI). This procedure ended with a total of 64 items (8items per domain). More extensive information about the selected and eliminated itemscan be found in Verdugo et al. (2008b).

Int J Clin Health Psychol, Vol. 10. Nº 1
VERDUGO et al. Objective instrument to assess quality of life 111
Step III: Focus groupsDespite of the exhaustive work described before, a step forward in developing the
items to be included in field-test version of the scale was taken. As Bonham et al. (2004)and Schalock et al. (2007) suggested, all stakeholder groups should be involved in theselection of indicator items, and the collection and use of the resultant data. For that,the selected items and indicators were evaluated by several focus groups. The specificgoals were: a) to confirm the idoneity, importance and observability of the selecteditems; b) to make sure that any relevant aspect had been forgotten, and c) to improvethe item formulations.
A total of five groups were celebrated with a moderator (n = 5) and 7-14 participantseach (n = 54). Users of social services, relatives, and stakeholders from Catalonia(Spain) were the participants. Each focus group was referred to one target population:elderly (n = 10), mental health (n = 12), drug addicts and HIV/SIDA (n = 14), intellectualdisabilities (n = 11), and physical disabilities (n = 7). The duration of each focus groupwas about 2 hours.
In order to systematize the procedure and the collected data, a discussion guideincluding the focus group questions was available for moderators. These questionswere: a) «Do you think that the item/indicator have an influence on the person-centeredQOL?»; b) «Do you think that this item/indicator is important to this population?»; c)«Do you think that the items to assess this indicator are observable for an externalobserver?»; and d) «Do you think any important item/indicator to assess this domainis not included?».
The results can be summarized as follows: a) all items were suitable for all populations,consequently all they were retained; b) some items were reformulated; c) clarificationswere made to 13 items; and d) and 5 items were added based on the input from focusgroups. Concerning to the first result, all items were considered as suitable, importantand observable by the different focus groups. Only the observability was discussed fora few items but it was solved with its reformulation. For instance, the item ‘He/she isdepressed’ was reformulated in order to be more observable like this ‘He/she showssymptoms of depression’. All the focus groups proposed the reformulation of most ofthe items or added one or more words to clarify the intent of the item. The goal of allreformulations and clarifications were to try to make the content of the items morespecific and guarantee they were suitable for all people. An example of a reformulateditem was: ‘He/she has a partner or he/she has the chance to have a partner if wanted’was reformulated as ‘It is difficult to him/her to start a sentimental relationship». Anexample of a clarification for the item was ‘He/she cares about his/her personal hygiene’,was the next: ‘It doesn’t matter if he does by himself/herself or he/she needs help todo it’. Regarding the last result, the 11 items were also suitable for all people. The focusgroup proposing the highest number of items was the one related to intellectual disabilities(n = 6), followed by the one related to drug dependences and HIV/AIDS (n = 5). Thephysical disabilities’ group only proposed one item (coinciding with one proposed byintellectual disabilities’ group) and the rest of the group considered that it was necessaryto include any item. After an exhaustive review of the 11 items, 5 items (IR = 2; RI =2; SD = 1) and 1 indicator (‘sexuality’ for IR) were selected to be part of the field-testversion of the scale. The selecting criteria were the same than for panel of experts.

Int J Clin Health Psychol, Vol. 10. Nº 1
112 VERDUGO et al. Objective instrument to assess quality of life
STUDY 2: PSYCHOMETRIC PROPERTIES OF THECATALONIAN VERSION OF THE SCALE
Study 1 resulted in a field –test version of GENCAT Scale that was composed of69 items (55 came from the literature review, 9 from the panel of experts, and 5 from thefocus groups). The purpose of study 2 was to evaluate the scale on a representativesample of social service users from Catalonia (Spain). The evaluation included reliabilityand validity. Reliability was evaluated by Cronbach’s alpha index and the standard errorof measurement. Validity was evaluated by Confirmatory Factor Analysis. The goodness-of-fit of the eight-dimension model of QOL was compared with the goodness-of-fit ofanother conceptualization in which QOL is one-dimensional.
MethodParticipants
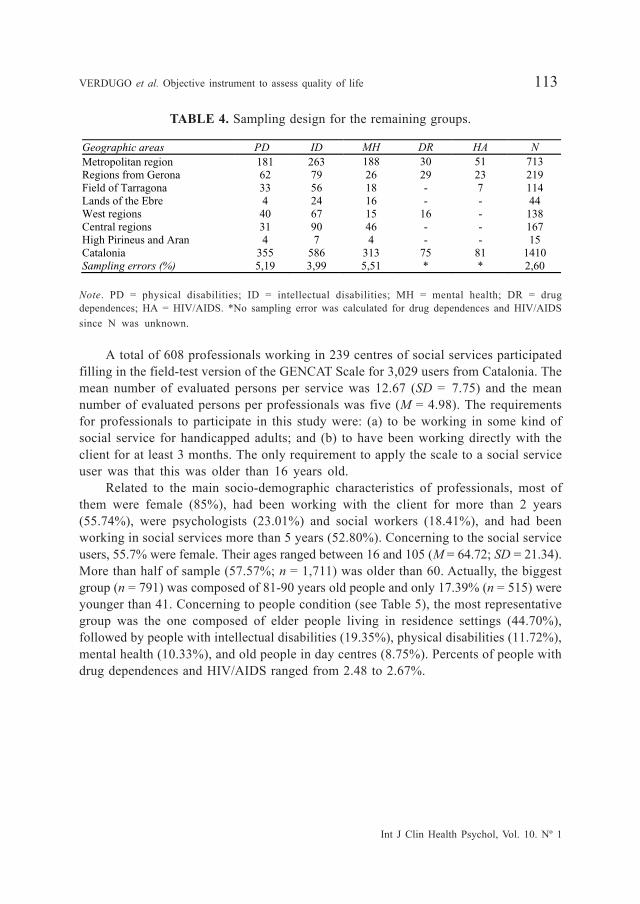
With the purpose of guaranteeing the representativity, a probabilistic polietapicsample design was carried out. For elder people group, sample was selected by geographicareas (sampling error of 2.43 with 95% confidence and p = q) (see Table 3). If onlyresidence settings were considered, the sampling error was increased to 2.66%, whilea sampling error of 6.07% was found for day centres. For the remaining groups, giventhe found variety in number of centres by geographical areas, the sampling was carriedout by target populations. In this case, a fixed and a proportional-to-size number ofunits were assigned to each group. Sampling errors ranged from 3.99 to 5.51 (see Table4).
TABLE 3. Sampling design for elder people.
Geographic areas Residence settings Day Centres n Sampling errors (%) Metropolitan region 570 89 659 3,75 Regions from Gerona 231 25 256 5,84 Field of Tarragona 144 22 166 7,28 Lands of the Ebre 89 21 110 7,90 West regions 194 44 238 5,96 Central regions 85 36 121 8,70 High Pirineus and Aran 41 28 69 11,32 Catalonia 1354 265 1619 2,43
Int J Clin Health Psychol, Vol. 10. Nº 1
VERDUGO et al. Objective instrument to assess quality of life 113
TABLE 4. Sampling design for the remaining groups. Geographic areas PD ID MH DR HA N Metropolitan region 181 263 188 30 51 713 Regions from Gerona 62 79 26 29 23 219 Field of Tarragona 33 56 18 - 7 114 Lands of the Ebre 4 24 16 - - 44 West regions 40 67 15 16 - 138 Central regions 31 90 46 - - 167 High Pirineus and Aran 4 7 4 - - 15 Catalonia 355 586 313 75 81 1410 Sampling errors (%) 5,19 3,99 5,51 * * 2,60
Note. PD = physical disabilities; ID = intellectual disabilities; MH = mental health; DR = drugdependences; HA = HIV/AIDS. *No sampling error was calculated for drug dependences and HIV/AIDSsince N was unknown.
A total of 608 professionals working in 239 centres of social services participatedfilling in the field-test version of the GENCAT Scale for 3,029 users from Catalonia. Themean number of evaluated persons per service was 12.67 (SD = 7.75) and the meannumber of evaluated persons per professionals was five (M = 4.98). The requirementsfor professionals to participate in this study were: (a) to be working in some kind ofsocial service for handicapped adults; and (b) to have been working directly with theclient for at least 3 months. The only requirement to apply the scale to a social serviceuser was that this was older than 16 years old.
Related to the main socio-demographic characteristics of professionals, most ofthem were female (85%), had been working with the client for more than 2 years(55.74%), were psychologists (23.01%) and social workers (18.41%), and had beenworking in social services more than 5 years (52.80%). Concerning to the social serviceusers, 55.7% were female. Their ages ranged between 16 and 105 (M = 64.72; SD = 21.34).More than half of sample (57.57%; n = 1,711) was older than 60. Actually, the biggestgroup (n = 791) was composed of 81-90 years old people and only 17.39% (n = 515) wereyounger than 41. Concerning to people condition (see Table 5), the most representativegroup was the one composed of elder people living in residence settings (44.70%),followed by people with intellectual disabilities (19.35%), physical disabilities (11.72%),mental health (10.33%), and old people in day centres (8.75%). Percents of people withdrug dependences and HIV/AIDS ranged from 2.48 to 2.67%.

Int J Clin Health Psychol, Vol. 10. Nº 1
114 VERDUGO et al. Objective instrument to assess quality of life
TABLE 5. Distribution of users by groups.
Groups n % Elder people (residences) 1,354 44.70 Persons with intellectual disabilities 586 19.35 Persons with physical disabilities 355 11.72 Persons with mental health problems 313 10.33 Elder people (day centres) 265 8.75 Persons with HIV/AIDS 81 2.67 Persons with drug dependences 75 2.48 Total 3,029 100
InstrumentsSince the GENCAT Scale application was going to be carried out in Catalonia, the
field-test version needed to be translated to Catalan. Along the entire process ofdevelopment, the International Quality of Life Assessment Project (IQOLA) and theInternational Test Commission (ITC) (Bartram, 2001; Hambleton, 2001; Muñiz andHambleton, 1996; Van de Vyjver and Hambleton, 1996) guidelines on adapting tests werefollowed. It must be noted that this case is not exactly a test adaptation since the scalewas developed from the beginning to be used with Catalonian population. In fact, aswe noted earlier, all items were validated by professionals, users and relatives fromCatalonia. Nevertheless, a translation methodology meeting all the requirements for thebest practice was applied: two translations, two back-translations, an expert committeeand a pretest.
Translation. The first step was to produce two translations from Spanish to Catalonian,using two qualified and bilingual translators whose mother tongue was Catalonian.Translations are of higher quality when undertaken by at least two independent translatorssince allows for the detection of errors and divergent interpretation of ambiguous items.One translator was aware of the objectives underlying the GENCAT Scale and thequality of life concepts, whereas the second was unaware of these objectives andconcepts. The two translations were compared in order to find discrepancies andidentify the more ambiguous words. Working from the initial version together with thefirst translator’s version (T-A) and the second translator’s version (T-B), the synthesisresulted in a common translation (T-AB).
Back-translation. Translating back from the final language into the source languagehas been shown to help improve the quality of the final version of an assessmentinstrument. From the T-AB version, two translators who were fluent in the idioms andcolloquial forms of Catalonian translated this version into their mother tongue: Spanish.None of the translators was aware of the intent and content of the material. Bothversions were synthesized (BT-AB). This version (BT-AB) was compared with the initialone in order to detect differences and reveal unexpected meanings or interpretations.
Expert committee. An expert committee was constituted in order to produce a finalversion of the GENCAT scale based on the various translations and back-translations.

Int J Clin Health Psychol, Vol. 10. Nº 1
VERDUGO et al. Objective instrument to assess quality of life 115
Membership was multidisciplinary: a methodologist, two experts on quality of life, twoexperts on languages, the two translators and both back-translators. Each committeemember reviewed the instructions, the items and the answer options. Committee memberaimed for semantic, idiomatic, and conceptual equivalence. There were no difficulties inobtaining the consensus about the final version since all the items were developed inreference to Catalonian users and reformulated by persons from Catalonia. In addition,all items were very specific and clear. For these reasons, all versions were very similarand, once the equivalence was guaranteed, the synthesis of the two versions that weretranslated into Catalonian (without any modification) constituted the final Catalonianversion.
Pre-test. The original and the final version were administered to two bilingualindividuals. As discrepancies were not found between them, the translating process wasconcluded in order to administer the developed version and check its psychometricproperties in a Catalonian sample.
This is a self-administered questionnaire in which professionals must answer objectiveand observable questions about user QOL. Administration time varies from 8 and 13minutes. It is composed of eight scales -that correspond to the eight QOL-domains- and69 items (EW = 8; IR = 10; MW = 8, PD = 8; PW = 8; SD = 9; SI = 8, RI = 10). All itemsare formulated as third person declarative statements and random organized by domains.Half items have positive (n = 35) and half have negative (n = 34) valence. The answerformat is a frequency scale with 4 options (Never o hardly ever, Sometimes, Often,Always or almost always); however, in case that using this answer format turned outdifficult, a 4-points Likert scale (Totally disagree, Disagree, Agree, and Totally agree)can be used instead. The instrument offers a direct score for each QOL domain that areconverted to standard scores (M = 10; SD = 3) and to percentiles. It is also possibleto illustrate all scores on a QOL profile that makes score interpretation easier. Finally,a QOL Index is also provided.
ProcedureOnce the participant services were selected, a letter was sent in order to explain
the researching goals and make the participation request. This letter was sent by postand by email. After that, the research team phoned every single service with thefollowing goals: a) to confirm the letter reception; b) to confirm the post address sincethe scales were sent by a courier company; c) to give detailed information about theresearch project; and d) to confirm if they were determined to collaborate. When someservice rejected to participate, it was replaced by other one with similar characteristics.Once their participation was confirmed, the specific number of scales they must com-plete plus 5 (to be sure of achieving a big enough sample) and an evaluator’s guide weresent. About 4,500 scales were sent. We must point out here that the Catalonian versionof the GENCAT Scale was applied to all participants in this study. Phone and emailcontact was kept all along the process in case there were doubts or suggestions. Phonewas also used to remind the deadlines when it was necessary.

Int J Clin Health Psychol, Vol. 10. Nº 1
116 VERDUGO et al. Objective instrument to assess quality of life
ResultsReliability
Reliability was evaluated by Cronbach’s alpha index (α) and the standard error ofmeasurement (SEM) (see Table 6). The internal consistency indexes (α) fluctuatedbetween .47 and .88. The lowest coefficient was reported by the Physical Wellbeingdomain; however, this result is congruent with findings in other similar studies (Gómezet al., 2008; Verdugo et al., in press). The internal consistency of the 69 items was quitehigh (α = .92), whereas SEM values were not too high (1.87 - 2.75).
TABLE 6. Reliability coefficients for each domain. Domains SEM n
Emotional well-being .83 2.03 8 Interpersonal relations .66 2.75 10 Material well-being .57 1.87 8 Personal development .74 2.39 8 Physical well-being .47 2.05 8 Self-determination .88 2.41 9 Social inclusión .57 2.52 8 Rights .69 2.18 10 GENCAT .92 6.92 69
Construct validityA Confirmatory Factor Analysis (CFA) was used to evaluate the goodness-of-fit for
two measurement models. Model I contained the eight-factors proposed by Schalockand Verdugo (2002): Emotional wellbeing, Material wellbeing, Physical wellbeing,Social inclusion, Interpersonal relations, Rights, Self-determination, and Personaldevelopment. Model II was one-dimensional. Given the nature of the data, the CFA wasperformed implementing DWLS estimation method with the covariance and asymptoticcovariance matrices. LISREL 8.8 (Scientific Software International, 2006) was the soft-ware used. As observed variables for each QOL factor, 4 parcels composed of thecorresponding and random selected item means were used (Bandalos, 2002; Bandalosand Finney, 2001; Brown, 2006; Hall, Snell, and Singer Foust, 1999; Kishton and Widaman,1994; Little, Cunningham, Shahar, and Widaman, 2002; West, Finch, and Curran, 1995).In this way, a total of 32 parcels (4 parcels per domain) were analyzed. Previously toCFA, one-dimensionality of each parcel was guaranteed.
To address the limitations of Chi-square test (χ2), several goodness-of-fit indexes(McDonald and Ho, 2002) were used to evaluate the goodness-of fit of eight vs. one-factor models. Absolute fit indexes, such as the Goodness of Fit Index (GFI), directlyassess how well a priori model reproduces the sample data; whereas relative fit indexes,such as Root Mean Square Error of Approximation (RMSEA), the Normed Fit Index(NFI), the Tucker-Lewis Index (TLI), and the Comparative Fix Index (CFI) measure theproportionate improvement in fit by comparing a target model with a more restrictednested baseline model (a null model in which all the observed variables are uncorrelated).Hu and Bentler (1999) identified cut off criteria for indexes. The GFI, the NFI, the TLI,
Int J Clin Health Psychol, Vol. 10. Nº 1
VERDUGO et al. Objective instrument to assess quality of life 117
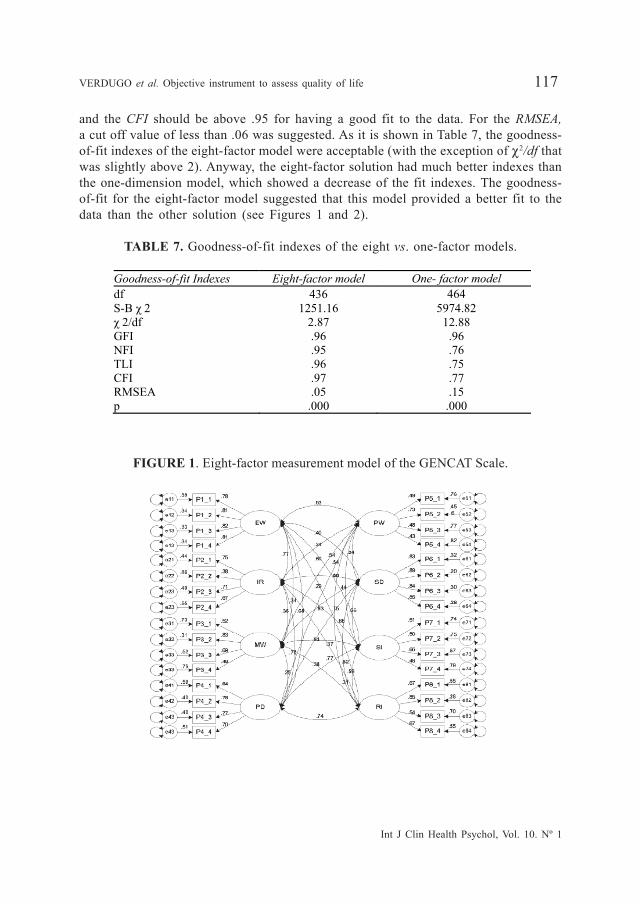
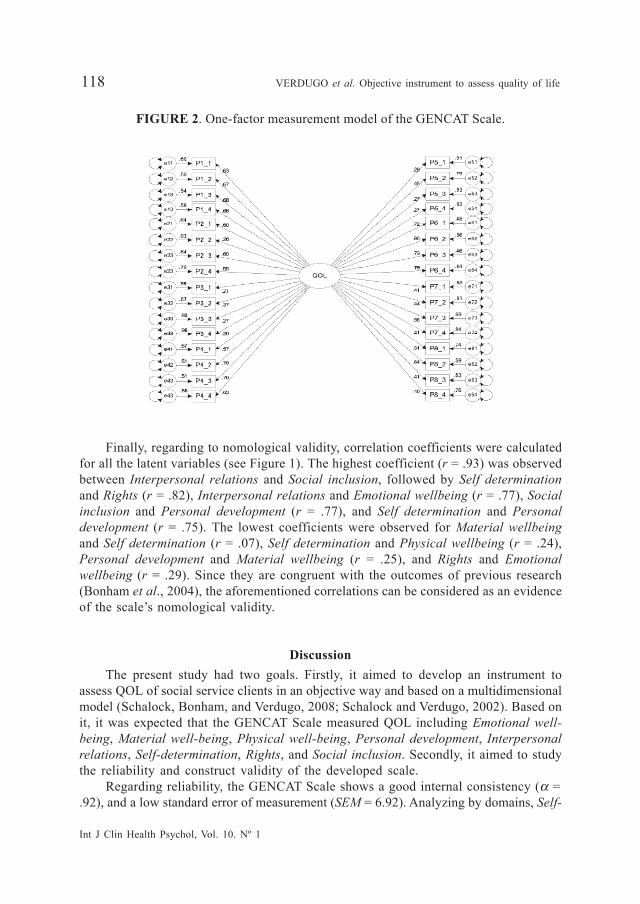
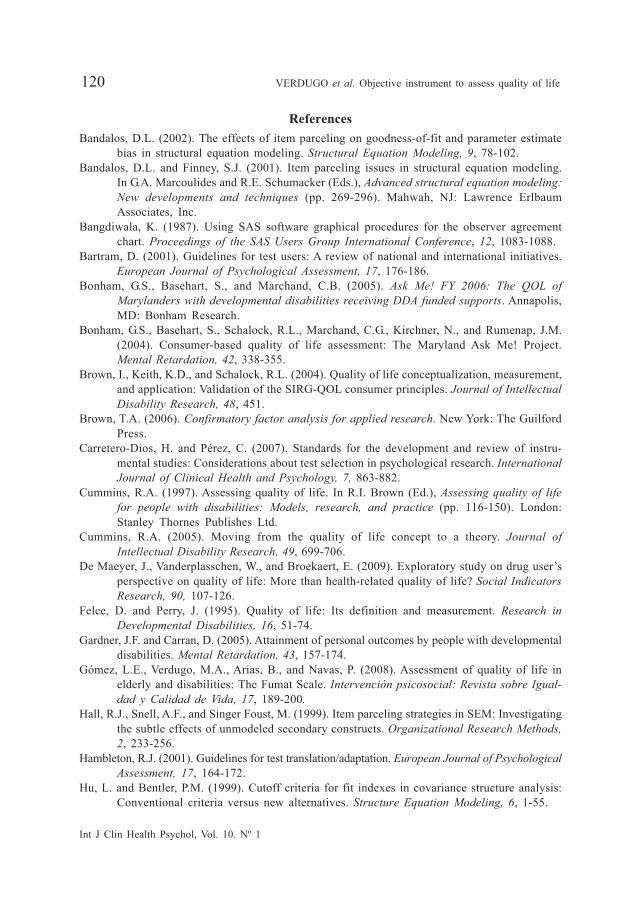
and the CFI should be above .95 for having a good fit to the data. For the RMSEA,a cut off value of less than .06 was suggested. As it is shown in Table 7, the goodness-of-fit indexes of the eight-factor model were acceptable (with the exception of χ2/df thatwas slightly above 2). Anyway, the eight-factor solution had much better indexes thanthe one-dimension model, which showed a decrease of the fit indexes. The goodness-of-fit for the eight-factor model suggested that this model provided a better fit to thedata than the other solution (see Figures 1 and 2).
TABLE 7. Goodness-of-fit indexes of the eight vs. one-factor models.
Goodness-of-fit Indexes Eight-factor model One- factor model
df 436 464
S-B 2 1251.16 5974.82
2/df 2.87 12.88
GFI .96 .96
NFI .95 .76
TLI .96 .75
CFI .97 .77
RMSEA .05 .15
p .000 .000
FIGURE 1. Eight-factor measurement model of the GENCAT Scale.
Int J Clin Health Psychol, Vol. 10. Nº 1
118 VERDUGO et al. Objective instrument to assess quality of life
FIGURE 2. One-factor measurement model of the GENCAT Scale.
Finally, regarding to nomological validity, correlation coefficients were calculatedfor all the latent variables (see Figure 1). The highest coefficient (r = .93) was observedbetween Interpersonal relations and Social inclusion, followed by Self determinationand Rights (r = .82), Interpersonal relations and Emotional wellbeing (r = .77), Socialinclusion and Personal development (r = .77), and Self determination and Personaldevelopment (r = .75). The lowest coefficients were observed for Material wellbeingand Self determination (r = .07), Self determination and Physical wellbeing (r = .24),Personal development and Material wellbeing (r = .25), and Rights and Emotionalwellbeing (r = .29). Since they are congruent with the outcomes of previous research(Bonham et al., 2004), the aforementioned correlations can be considered as an evidenceof the scale’s nomological validity.
DiscussionThe present study had two goals. Firstly, it aimed to develop an instrument to
assess QOL of social service clients in an objective way and based on a multidimensionalmodel (Schalock, Bonham, and Verdugo, 2008; Schalock and Verdugo, 2002). Based onit, it was expected that the GENCAT Scale measured QOL including Emotional well-being, Material well-being, Physical well-being, Personal development, Interpersonalrelations, Self-determination, Rights, and Social inclusion. Secondly, it aimed to studythe reliability and construct validity of the developed scale.
Regarding reliability, the GENCAT Scale shows a good internal consistency (α =.92), and a low standard error of measurement (SEM = 6.92). Analyzing by domains, Self-

Int J Clin Health Psychol, Vol. 10. Nº 1
VERDUGO et al. Objective instrument to assess quality of life 119
determination, Emotional well-being, and Personal development, with values higherthan .70, are the most reliable; whereas Rights, Interpersonal relations, Material well-being, and Social inclusion are very close to .60. Finally, Physical wellbeing has thelowest internal consistency (α = .47). Since Physical wellbeing consists of eight itemsas other factors, its low level of internal consistency cannot be explained by the numberof items. A more detailed analysis of the content of the items belonging to this domainfound that there are three items with very low corrected homogeneity indexes andwhose content seem to be slightly different to the other items within the domain.Although they undoubtedly contribute to Physical wellbeing, they also may assessother domains such as Material wellbeing or Rights. Given the strong consensusreached by the experts and the focus groups about their importance during the processof development of the scale, the items were retained. However, further studies shouldbe done to determine its importance and reliability to assess this or other domain.
Concerning to construct validity, the aim is to demonstrate that indicators (items,or parcels in this study) load on only one factor (or domain) and are not influenced byany other systematic effect. To that end, two models were compared. The first one(Model I) approaches QOL as a one-domain construct and the second model (ModelII) conceives QOL as composed of eight correlated domains. The Confirmatory FactorAnalysis supported the eight-domain model is supported by the data, in comparisonwith the one-dimension solution. Also the scale showed an adequate nomologicalvalidity, although deeper research about this issue is recommended.
The sampling design guarantees the results’ representativeness and allows concludingthat they can be generalized to users of social services in Catalonia. Besides, since eachtarget-population involved in the development and validation of the scale shows asimilar distribution all around Spain, the authors, other researchers and professionalsof social services consider the GENCAT Scale ass suitable to be applied to clients fromother counties in Spain. In order to check it, it is being applied in other Spanish countiesat present. Anyway, the study has also some limitations. For example, as the instrumentwas developed to assess QOL in an objective way, it is assumed that QOL scoresshould be invariant depending on the observer. Although this issue was not studied,we plan to do it after applying the scale in other areas.
The originality, importance and utility of this instrument reside on several aspects.Firstly, there is only one QOL questionnaire serving to the same goal, the FUMAT Scale(Gómez et al., 2008), but it was developed after this one and it is focused on elderlyand disabilities. The GENCAT Scale, in contrast, can be applied to all kind of users ofsocial and human services, including people with disabilities and elder people, but alsopeople with mental health problems or AIDS/HIV. And secondly, it responds to all basicprinciples of conceptualization, measurement and application of QOL (Schalock, 2005,2006; Schalock, Bonham, and Verdugo, 2008; Schalock and Verdugo, 2007; Schalock,Verdugo, et al., 2008; Verdugo, 2006; Verdugo, Schalock, Keith, and Stancliffe, 2005). Inconclusion, the GENCAT Scale is in consonance with conceptual advances in the fieldand it constitutes a useful tool for organizations, entities and services interested inimproving the assessed QOL of their service recipients, and for social service professionalsthat are concerned about improving their programs and practices.
Int J Clin Health Psychol, Vol. 10. Nº 1
120 VERDUGO et al. Objective instrument to assess quality of life
ReferencesBandalos, D.L. (2002). The effects of item parceling on goodness-of-fit and parameter estimate
bias in structural equation modeling. Structural Equation Modeling, 9, 78-102.Bandalos, D.L. and Finney, S.J. (2001). Item parceling issues in structural equation modeling.
In G.A. Marcoulides and R.E. Schumacker (Eds.), Advanced structural equation modeling:New developments and techniques (pp. 269-296). Mahwah, NJ: Lawrence ErlbaumAssociates, Inc.
Bangdiwala, K. (1987). Using SAS software graphical procedures for the observer agreementchart. Proceedings of the SAS Users Group International Conference, 12, 1083-1088.
Bartram, D. (2001). Guidelines for test users: A review of national and international initiatives.European Journal of Psychological Assessment, 17, 176-186.
Bonham, G.S., Basehart, S., and Marchand, C.B. (2005). Ask Me! FY 2006: The QOL ofMarylanders with developmental disabilities receiving DDA funded supports. Annapolis,MD: Bonham Research.
Bonham, G.S., Basehart, S., Schalock, R.L., Marchand, C.G., Kirchner, N., and Rumenap, J.M.(2004). Consumer-based quality of life assessment: The Maryland Ask Me! Project.Mental Retardation, 42, 338-355.
Brown, I., Keith, K.D., and Schalock, R.L. (2004). Quality of life conceptualization, measurement,and application: Validation of the SIRG-QOL consumer principles. Journal of IntellectualDisability Research, 48, 451.
Brown, T.A. (2006). Confirmatory factor analysis for applied research. New York: The GuilfordPress.
Carretero-Dios, H. and Pérez, C. (2007). Standards for the development and review of instru-mental studies: Considerations about test selection in psychological research. InternationalJournal of Clinical Health and Psychology, 7, 863-882.
Cummins, R.A. (1997). Assessing quality of life. In R.I. Brown (Ed.), Assessing quality of lifefor people with disabilities: Models, research, and practice (pp. 116-150). London:Stanley Thornes Publishes Ltd.
Cummins, R.A. (2005). Moving from the quality of life concept to a theory. Journal ofIntellectual Disability Research, 49, 699-706.
De Maeyer, J., Vanderplasschen, W., and Broekaert, E. (2009). Exploratory study on drug user’sperspective on quality of life: More than health-related quality of life? Social IndicatorsResearch, 90, 107-126.
Felce, D. and Perry, J. (1995). Quality of life: Its definition and measurement. Research inDevelopmental Disabilities, 16, 51-74.
Gardner, J.F. and Carran, D. (2005). Attainment of personal outcomes by people with developmentaldisabilities. Mental Retardation, 43, 157-174.
Gómez, L.E., Verdugo, M.A., Arias, B., and Navas, P. (2008). Assessment of quality of life inelderly and disabilities: The Fumat Scale. Intervención psicosocial: Revista sobre Igual-dad y Calidad de Vida, 17, 189-200.
Hall, R.J., Snell, A.F., and Singer Foust, M. (1999). Item parceling strategies in SEM: Investigatingthe subtle effects of unmodeled secondary constructs. Organizational Research Methods,2, 233-256.
Hambleton, R.J. (2001). Guidelines for test translation/adaptation. European Journal of PsychologicalAssessment, 17, 164-172.
Hu, L. and Bentler, P.M. (1999). Cutoff criteria for fit indexes in covariance structure analysis:Conventional criteria versus new alternatives. Structure Equation Modeling, 6, 1-55.

Int J Clin Health Psychol, Vol. 10. Nº 1
VERDUGO et al. Objective instrument to assess quality of life 121
Jenaro, C., Verdugo, M.A., Caballo, C., Balboni, G., Lachapelle, Y., Otbrebski, W., et al. (2005).Cross-cultural study of person-centered quality of life domains and indicators: A replication.Journal of Intellectual Disability Research, 49, 734-739.
Keith, K.D. and Bonham, G.S. (2005). The use of quality of life data at the organization andsystems level. Journal of Intellectual Disability Research, 49, 799-805.
Keith, K.D. and Schalock, R.L. (2000). Cross-cultural perspectives on quality of life. Washington,DC: American Association on Mental Retardation.
Kishton, J.M. and Widaman, K.F. (1994). Unidimensional versus domain representative parcelingof questionnaire items: An empirical example. Educational and Psychological Measurement,54, 757–765.
Langberg, J.M. and Smith, B.H. (2006). Developing evidence-based intervention for deploymentinto school settings: A case example highlighting key issues of efficacy and effectiveness.Evaluation and Program Planning, 29, 323-334.
Little, T.D., Cunningham, W.A., Shahar, G., and Widaman, K.F. (2002). To parcel or not toparcel: Exploring the question, weighing the merits. Structural Equation Modeling, 9, 151-173.
Martín-Rodríguez, A. y Pérez-San Gregorio, M.A. (2007). Influencia de la unidad de cuidadosintensivos en los familiares de pacientes con mala calidad de vida. International Journalof Clinical and Health Psychology, 7, 71-82.
McCabe, M.P., Firth, L., and O’Connor, E. (2009). Mood and quality of life among people withprogressive neurological illnesses. International Journal of Clinical and Health Psychology,9, 21-35.
McDonald, R.P. and Ho, M.R. (2002). Principles and practice in reporting structural equationanalyses. Psychological Methods, 7, 64-82.
Montero, I. and León, O.G. (2007). A guide for naming research studies in Psychology. InternationalJournal of Clinical and Health Psychology, 7, 847-862.
Muñiz, J. and Hambleton, R.K. (1996). Directrices para la traducción y adaptación de los tests.Papeles del Psicólogo, 66, 63-70.
Perry, J. and Felce, D. (1995). Objective assessments of quality of life: How much do they agreewith each other? Journal of Community and Applied Social Psychology, 5, 1-19.
Perry, J. and Felce, D. (2005). Factors associated with outcomes in community group homes.American Journal on Mental Retardation, 110, 121-135.
Schalock R.L. (2005) Moving from a quality of care to a quality of life program emphasis. InInternational Congress about Quality of Life of persons with a disability. Quito, Equator,17–21 October.
Schalock, R.L. (2006). Prólogo. In J.A. Verdugo (Dir.), Cómo mejorar la calidad de vida de laspersonas con discapacidad. Instrumentos y estrategias de evaluación (pp. 21-25). Salamanca:Amarú.
Schalock, R.L. and Bonham, G.S. (2003). Measuring outcomes and managing for results. Evaluationand Program Planning, 26, 229-235.
Schalock, R.L., Bonham, G.S., and Verdugo, M.A. (2008). The concept of quality of life as aframework for program planning, implementation, evaluation, and improvement. Evaluationand Program Planning, 3, 181-190.
Schalock, R.L., Brown, I., Brown, R., Cummins, R.A., Felce, D., Matikka, L. et al. (2002).Conceptualization, measurement, and application of quality of life for persons withintellectual disabilities: Results of an international panel of experts. Mental Retardation,40, 457-470.
Int J Clin Health Psychol, Vol. 10. Nº 1
122 VERDUGO et al. Objective instrument to assess quality of life
Schalock, R.L. and Felce, D. (2004). Quality of life and subjective well-being: Conceptual andmeasurement issues. In E. Emerson, C. Hatton, T. Thompson, and T.R. Parmenter (Eds.),International Handbook of Applied Research in Intellectual Disabilities (pp. 261-279).London: John Wiley and Sons.
Schalock, R.L., Gardner, J.F., and Bradley, V.J. (2007). Quality of life for persons with intellectualand other developmental disabilities: Applications across individuals, organizations,communities, and systems. Washington, DC: American Association on Intellectual andDevelopmental Disabilities.
Schalock, R.L., Keith, K.D., Verdugo, M.A., and Gómez, L.E. (in press). Quality of life theoryconstruction and model development. Journal of Intellectual Disability Research.
Schalock, R.L. and Verdugo, M.A. (2002). Quality of life for human service practitioners.Washington, DC: American Association on Mental Retardation.
Schalock, R.L. and Verdugo, M.A. (2007). The concept of quality of life in services and supportsfor people with intellectual disabilities. Siglo Cero, 38, 21-36.
Schalock, R.L. and Verdugo, M.A. (2008). Quality of life conceptual and measurement frameworks:From concept to application in the field of intellectual disabilities. Evaluation andProgram Planning, 31, 181-190.
Schalock, R.L., Verdugo, M.A., Bonham, G.S., Fantova, F., and Van Loon, J. (2008). Enhancingpersonal outcomes: Organizational strategies, guidelines, and examples. Journal of Policyand Practice in Intellectual Disabilities, 5, 18-28.
Schalock, R.L., Verdugo, M.A., Jenaro, C., Wang, M., Wehmeyer, M., Xu, J. et al. (2005). Across-cultural study of quality of life indicators. American Journal on Mental Retardation,110, 298-311.
Scientific Software International (2006). LISREL, v. 8.8 [Computer Program]. Lincolnwood, IL:Scientific Software International.
Van de Vyjver, F. and Hambleton, R.K. (1996). Translating tests: Some practical guidelines.European Psychologist, 1, 89-99.
Van Loon, J., van Hove, G., Schalock, R.L., and Claes, C. (2008). Personal Outcomes Scale.Middleburg, NL: Arduin Steichlich and Gent, Belgium: Department of Special Education,University of Gent.
Veerman, J.W. and van Yperen, T.A. (2007). Degrees of freedom and degrees of certainty: Adevelopmental model for the establishment of evidence-based youth care. Evaluation andProgram Planning, 30, 136-148.
Verdugo, M.A. (2006). Cómo mejorar la calidad de vida de las personas con discapacidad.Salamanca: Amarú.
Verdugo, M.A., Arias, B., and Gómez, L.E. (2006). Escala integral de medición subjetiva yobjetiva de la calidad de vida en personas con discapacidad intelectual. In M.A. Verdugo(Dir.), Como mejorar la calidad de vida de las personas con discapacidad. Instrumentosy estrategias de evaluación (pp. 417-448). Salamanca: Amarú.
Verdugo, M.A., Arias, B., Gómez, L.E., and Schalock, R.L. (2008a). Formulari de l’EscalaGencat de Qualitat de vida. Manual d’aplicació de l’Escala Gencat de Qualitat de vida.Barcelona: Departament d’Acció Social i Ciutadania, Generalitat de Cataluña.
Verdugo, M.A., Arias, B., Gómez, L.E., and Schalock, R.L. (2008b). Informe sobre la creaciód’una escala multidimensional per avaluar la qualitat de vida de les persones usuàriesdels serveis socials a Catalunya. Barcelona: Departament d’Acció Social i Ciutadania,Generalitat de Cataluña.
Verdugo, M.A., Arias, B., Gómez, L.E., and van Loon, J. (2007). Schaal Voor Kwaliteit VanBestaan Voor Mensen Met Een Verstandelijke Beperking [QOL Integral Scale]. Holland:Stichting Arduin.

Int J Clin Health Psychol, Vol. 10. Nº 1
VERDUGO et al. Objective instrument to assess quality of life 123
Verdugo, M.A., Gómez, L.E., and Arias, B. (2007). La Escala Integral de Calidad de Vida.Desarrollo y estudio preliminar de sus propiedades psicométricas. Siglo Cero, 38, 37-56.
Verdugo, M.A., Gómez, L.E., Arias, B., and Martin, J.C. (2006, may). Validation of the eightdomain model of quality of life. Presentation at the symposium on quality of lifeoutcomes: Their empirical development, verification, and use. International Symposiumon Social Inclusion, Montreal, CA.
Verdugo, M.A., Gómez, L.E., Arias, B., and Schalock, R.L. (2009). Quality of Life Integral Scale.Madrid: CEPE.
Verdugo, M.A., Gómez, L.E., Schalock, R.L., and Arias, B. (in press). The Integral Quality ofLife Scale: Development, Validation, and Use. In R. Kober (Ed.), Quality of life for peoplewith intellectual disability. New York: Springer.
Verdugo, M.A. and Schalock, R.L. (2003). Cross-cultural Survey of QOL Indicators. Salamanca:Institute on Community Integration. University of Salamanca.
Verdugo, M.A., Schalock, R.L., Gómez, L.E., and Arias, B. (2007). Developing multidimensionalquality of life scales focusing on the context: The Gencat Scale. Siglo Cero, 38, 57-72.
Verdugo, M.A., Schalock, R.L., Keith, K., and Stancliffe, R. (2005). Quality of life and itsmeasurement: Important principles and guidelines. Journal of Intellectual Disability Research,49, 707-717.
Walsh, P., Erickson, E., Bradley, V., Moseley, C., and Schalock, R.L. (2006). Supportedaccommodation services for people with intellectual disabilities: A review of models andinstruments used to measure quality of life in various settings. Dublin: National DisabilityAuthority.
West, S.G., Finch, J.F., and Curran, P.J. (1995). Structural equation models with nonnormalvariables: Problems and remedies. In R.H. Hoyle (Ed.), Structural equation modeling:Concepts, issues, and applications (pp. 56-75). Thousand Oaks, CA: Sage.
Received September 17, 2008Accepted April 24, 2009