Utilizing LCA and key performance indicators to assess ... · -a case study of a cement production...
19
1 Utilizing LCA and key performance indicators to assess development within the cement industry -a case study of a cement production cluster in Germany Roozbeh Feiz a , Jonas Ammenberg, Leonard Baas, Mats Eklund, Anton Helgstrand and Richard Marshall b Linköping University, Department of Management and Engineering, Division of Environmental Technology and Management, Linköping, Sweden. a Corresponding author: [email protected], +46-13-282754 b CEMEX Research Group AG, Switzerland. Abstract Cement is a vital and commonly used construction material that requires large amounts of resources and causes significant environmental impact. However, there are many different types of cement products, roughly ranging from traditional products with a rather linear production to more synergistic alternatives where byproducts are utilized to a large extent. Life Cycle Assessment (LCA) studies indicate the synergistic products are favorable from an environmental perspective. This article has two main aims, where the first is to carry out a LCA and compare three different cement products, involving both linear and synergistic ones to further explore this issue. This has been done from cradle to gate, focusing on climate impact, where the case is a cement production cluster consisting of three plants in Germany. The second aim is to develop and test a simplified LCA model for this production cluster, with the intention to be able to assess additional production alternatives based on the information of a few parameters. The more comprehensive LCA showed that cement products with a high share of byproducts, in this case granulated blast furnace slag from the steel industry, had the best climate performance. The difference between the best (CEM III/B) and worst (CEM I) cement product, regarding global warming potential, was about 66%. A simplified LCA model was developed and the research team could apply it to compare the present production with the situation in 1997 and also with possible future production systems. This simplified LCA model was based on 6 key performance indicators, instead of more than 50 parameters, which was the case for the comprehensive LCA model. For example, the simplified model showed that the CO 2 emission related to a virtual average product of the production cluster was reduced about 49 % in the period from 1997 to 2009. Keywords: cement, clinker, climate change, simplified life cycle assessment (LCA), cement production system 1 Introduction 1.1 Cement and cement production Cement is a very important material for the global construction industry, mainly used as a component in concrete. Cement production is highly energy and material intensive; e.g., causing about 5% of the global CO 2 emissions and substantial emissions of SO 2 , NO X and other pollutants (Van Oss & Padovani 2002; Van Oss & Padovani 2003; EIPPCB 2010). This makes it interesting to study cement production and products from an environmental point of view. The most common form of cement is Portland cement, consisting of a material called clinker to about 95% (Locher 2006). Clinker is formed when the raw material limestone is burned at a high temperature in a cement kiln (Van Oss & Padovani 2002). In this process calcium carbonate decomposes and CO and CO 2 is produced (Worrell et al. 2001). It is called calcination and it is highly
Transcript of Utilizing LCA and key performance indicators to assess ... · -a case study of a cement production...

1
Utilizing LCA and key performance indicators to assess development within the cement industry
-a case study of a cement production cluster in Germany
Roozbeh Feiza, Jonas Ammenberg, Leonard Baas, Mats Eklund, Anton Helgstrand and Richard Marshallb
Linköping University, Department of Management and Engineering, Division of Environmental Technology and Management, Linköping, Sweden.
a Corresponding author: [email protected], +46-13-282754 b CEMEX Research Group AG, Switzerland.
Abstract
Cement is a vital and commonly used construction material that requires large amounts of resources
and causes significant environmental impact. However, there are many different types of cement
products, roughly ranging from traditional products with a rather linear production to more synergistic
alternatives where byproducts are utilized to a large extent. Life Cycle Assessment (LCA) studies
indicate the synergistic products are favorable from an environmental perspective.
This article has two main aims, where the first is to carry out a LCA and compare three different
cement products, involving both linear and synergistic ones to further explore this issue. This has been
done from cradle to gate, focusing on climate impact, where the case is a cement production cluster
consisting of three plants in Germany. The second aim is to develop and test a simplified LCA model
for this production cluster, with the intention to be able to assess additional production alternatives
based on the information of a few parameters.
The more comprehensive LCA showed that cement products with a high share of byproducts, in this
case granulated blast furnace slag from the steel industry, had the best climate performance. The
difference between the best (CEM III/B) and worst (CEM I) cement product, regarding global
warming potential, was about 66%. A simplified LCA model was developed and the research team
could apply it to compare the present production with the situation in 1997 and also with possible
future production systems. This simplified LCA model was based on 6 key performance indicators,
instead of more than 50 parameters, which was the case for the comprehensive LCA model. For
example, the simplified model showed that the CO2 emission related to a virtual average product of the
production cluster was reduced about 49 % in the period from 1997 to 2009.
Keywords: cement, clinker, climate change, simplified life cycle assessment (LCA), cement
production system
1 Introduction
1.1 Cement and cement production
Cement is a very important material for the global construction industry, mainly used as a component
in concrete. Cement production is highly energy and material intensive; e.g., causing about 5% of the
global CO2 emissions and substantial emissions of SO2, NOX and other pollutants (Van Oss &
Padovani 2002; Van Oss & Padovani 2003; EIPPCB 2010). This makes it interesting to study cement
production and products from an environmental point of view.
The most common form of cement is Portland cement, consisting of a material called clinker to about
95% (Locher 2006). Clinker is formed when the raw material limestone is burned at a high
temperature in a cement kiln (Van Oss & Padovani 2002). In this process calcium carbonate
decomposes and CO and CO2 is produced (Worrell et al. 2001). It is called calcination and it is highly

2
important from a climate perspective, since carbon bound in minerals is transformed to CO2 (Chen et
al. 2010). The calcination typically causes about 50% of the total CO2 emissions from cement
production, and a large share of the remaining emissions originates from combustion of the fuels in the
kiln (Deborah N. Huntzinger & Eatmon 2009a). The clinker is then grinded to a fine powder and
blended with some additives.
In addition to Portland cement, there are other types of cement products and several formal
categorization systems to define them. The ASTM standard in the USA and the European cement
standard EN 197-1 are widely used. The latter standard defines five main types of cement (CEM I to
V), where each main type has a few sub-types, ending up with 27 different cement types in total. The
main distinguishing factor between these types is their material content. CEM I has the highest amount
of clinker, corresponding to Portland cement. Other types have lower clinker content and instead
alternative materials are used, referred to as “clinker substitutes”. These materials have clinker-like
properties and thus can partially replace clinker. They are grinded and blended (mixed) in the required
proportions in order to produce different types of cement. Examples of materials used as clinker
substitutes are byproducts such as granulated blast furnace slag1 (GBFS) from the steel industry and
ash from coal incineration. Many types of waste can be used as substitutes to clinker or different fuels
when producing cement and the cement industry has become a useful receiver of industrial and
municipal wastes (Reijnders 2007).
1.2 Life Cycle Assessment of cement
Life Cycle Assessments (LCA) are commonly used to study the environmental impact from cement
industry (H. Lu 2010; Ortiz et al. 2009) and such studies are important to learn more about this
industry and about strategies for reducing the impact. For example, such studies tell us that commonly,
production of Portland cement results in CO2 emissions exceeding 0.9 ton CO2/ton cement and that
each ton might require input of 1.5 tons of raw materials, 3300-4300 MJ of fuel energy and 100-120
kWh of electrical energy (EIPPCB 2010; Nicolas & Jochen 2008; Lynn Price et al. 2010). Further on,
LCA studies can be utilized to assess and compare the environmental performance of the different
types of cement mentioned (Van den Heede & De Belie 2012; Gäbel & Tillman 2005).
However, full scale and detailed LCA studies (in compliance with the ISO 1404x standards) require a
lot of resources (Wenzel et al. 1997). It can be very time consuming, and thus costly, to gather all the
data needed and find case specific information of good quality (ibid.). If the production involves
several cement plants, in the form of an industrial cluster, the task grows. Such projects tend to require
more sophisticated and well-structured LCA approaches, to handle several external links to material
and fuel suppliers while simultaneously having intermediate links between different plants within the
cluster. In many cases it is also desirable to be able to handle development within the industry, such as
changes of technology, fuel and raw materials. But dynamics in the production systems lead to
changes of the Life Cycle Inventory (LCI).
The problems mentioned are of course not specific for LCA studies of cement. The need for simplified
LCA methods is evident in many industrial sectors and different ways of streamlining the LCA
process is commonly mentioned in literature, see (Bretz 1998; Fleischer et al. 2001; Hochschorner &
Finnveden 2003; Mueller et al. 2004; Soriano 2004; Ross & Evans 2002; Sun et al. 2004). There are
several ways of simplifying the LCA process, for example, to:
Exclude some data and/or mainly focus on some key indicators,
Use generic data instead of case specific data,
Exclude some environmental impact categories,
Exclude some parts of the life cycle, and
1 Granulated blast furnace slag is a residue from the production of iron and steel which can be used to substitute
clinker (M.E. Boesch et al. 2009b).

3
Apply qualitative LCA methods.
This paper presents a study that is based on a quantitative, detailed LCA of cement, which is then used
to develop a simplified LCA model applied to assess other alternatives concerning the production
system and the products.
1.3 A studied case
CEMEX is a global manufacturer of building materials operating in more than 50 countries and the
company is one of the largest cement producers in the world. In cooperation, researchers from
Linköping University, Sweden, and staff from CEMEX during a one year project have studied the
cement production within a production system in Germany, consisting of three cement plants.
Together these plants are referred to as the Cluster West.
The overall aim of the project was to contribute to a better understanding of the climate performance
of different ways of producing cement, and different cement products. The knowledge could be used
by CEMEX to more systematically and rationally assess different cement sites and production
approaches, from a climate perspective, thereby, making it easier for the company to analyze different
options for improvements (cf. Gäbel & Tillman 2005 having a similar intention).
1.4 Aim
This paper more specifically aims to assess the global warming potential for clinker and three selected
cement products that were produced within the Cluster West:
CEM I 42,5 (also called Portland cement, around 92% clinker content),
CEM III/A 42,5 (a blended cement type, around 50% clinker content),
CEM III/B 42,5 (a blended cement type, around 27% clinker content).
This has been done in detail for the year of 2009, by conducting a quantitative, comprehensive life
cycle assessment (LCA), applying a “cradle-to-gate perspective” and using the functional unit of 1 ton
of cement product.
In addition, it was to be investigated if a simplified LCA model could be developed and applied to
assess the climate impact for other relevant production alternatives concerning Cluster West and also
for other cement products than the selected ones. This was to be done with a reasonable accuracy
based on a few key performance indicators. For example, such a model could be used to significantly
facilitate an assessment of the climate performance of earlier versions of Cluster West. More
importantly, also possible future versions could be assessed and compared with the situation in 2009
(regarded as the present situation).
2 Methodology
Here the case and the LCA based methodology are presented more in detail. The comprehensive LCA
was carried out as a typical comparative LCA in line with the ISO 14040 and 14044 standards (ISO
14040 2006; ISO 14044 2006).
2.1 CEMEX Cluster West
The studied production system consists of three active cement production plants located in Beckum-
Kollenbach, Dortmund and Schwelgern (Duisburg), in Germany. The first is a cement plant with a
kiln which produces clinker, while the other two can be described as grinding and mixing stations. Products and effluents from one plant are in many cases used as input to another plant, and they
produce several intermediate products and final cement products. An overview of the central material
and energy flows of the production system of CEMEX Cluster West (CCW) in 2009 is given in Figure
1. The inbound flows generally consist of primary and secondary materials, fossil and alternative
fuels, electricity and clinker. The internal flows (vertical arrows in blue color) are clinker, granulated
blast furnace slag (GBFS) and various intermediate products. Furthermore the outbound flows consist

4
of clinker and several final cement products ready to be shipped to the market. However, the focus has
been on clinker, CEM I 42.5, CEM III/A 42.5 and CEM III/B 42.5. All intermediate products (such as
KLMB, HPS-2, HP-B4, EPZ-H, HP-A4, etc.) which are required to produce the selected products are
taken into account in the LCA study, but are not explained or specified in this paper. More information
about Cluster West can be found in (Ammenberg et al. 2011).
Light fuel oil
Animal meal
Tires
Coal
Lignite
Coke gas
Natural gas
Clinker
Refractory waste
Lime sludge
Limestone
Marly Limestone
Additives
Gypsum
GBFS
Clinker
HPS - 2
Bypass dust
CEM I 42,5
KLMB
CEM III B
Bypass dust
HP – B4
EPZ - H
GGBFS - fine
CEM III A
HP – A4
GGBFS - fine
Raw material extraction
Manufacture/upgrading of material
Cement manufacture
(Cradle) (Gate) (Grave)
Bypass dust
Use End-of-life
CCW (2009)
Becku
m-
Ko
llenb
ach
Schw
elgernD
ortm
un
d
Raw materials and energy
Emissions and waste
Use of cement in buildings, bridges etc.
Recovery/recycling/disposal
of used cement
Input fuels
Input materials
Cement products and clinker
Cement products and clinker
Cement products and clinker
Figure 1. Overview of the CEMEX Cluster West in 2009. (Abbreviations such as KLMB, HPS-2, HP-B4, EPZ-H,
HP-A4, etc are referring to names given to different intermediate products)
2.2 Scope and functional unit
In agreement with CEMEX it was decided to focus on the initial parts of the life cycle, from cradle to
gate, including extraction of raw materials, production/upgrading of materials, manufacturing of
cement and transportations within this scope. The use and end-of-life phase are thus excluded, because
it was seen as prioritized and reasonable within the frames of the project to focus on cement and
cement production. A broadened scope focusing on concrete would have been much more complex,
since the cement products (as a part of concrete) are used for many different purposes and are reused
or discarded in many ways. It appears to be a common choice to apply a cradle-to-gate perspectives in
LCA studies of cement (see e.g. Chen et al. 2010; Huntzinger & Eatmon 2009; Michael Elias Boesch
& Stefanie Hellweg 2010; Josa et al. 2004).
The functional unit was defined as 1 ton of cement, which was seen reasonable since the scope does
not include the use phase meaning that the key service delivered by cement is not included. This
choice was also important to be able to realize the aim and assess several cement products with a
broad range of qualities. The choice of functional unit is also in line with several other studies (see
Josa et al. 2004; M.E. Boesch et al. 2009a). However, it is important to keep in mind that different
cement products have a different quality.
2.3 Data collection
Site-specific data was collected for each plant, divided into five categories; input of energy and fuels;
input of materials; input of consumables; output of products; and waste. CEMEX also provided
information about the composition of different cement products and the composition of fuels that were
used, implying that the company has accurately allocated the relevant flows to the cement products. In
5
addition, CEMEX provided data about heat values of fuels, transportation and CO2 emission factors
for incineration of the fuels at Beckum-Kollenbach. The company was able to provide all the data that
the researchers from Linköping University requested. A majority of the data regarded the year of 2009,
considered as the ‘present situation’, since it was the most current data available when the project
started. In addition, some information about the sites concerning the year of 1997 has been used to
estimate emissions from previous production.
A rather extensive input/output tool was created to facilitate the management of the data. It provided
structure and was needed to convert and link the inputs/outputs, originally expressed in annual figures
for each plant, to the functional unit.
CEMEX has mainly provided data about the flows within the cluster as well as inbound and outbound
flows. However, the scope of the LCA study was cradle to gate, meaning that it covered all phases
from the extraction of raw materials to finished cement products at “the gate” of Cluster West.
Therefore, the Ecoinvent LCA database (Ecoinvent 2012) has been used to be able to include the
upstream parts of the life cycle for which CEMEX could not provide the needed information. For
example, data from Ecoinvent was used for animal meal, refuse-derived fuel fluff (RDF-fluff) and
tires.
In this study the environmental impacts associated with infrastructures such as construction of the
cement plant or other supporting infrastructures such as roads, rail roads, electricity networks and
similar processes were not considered. However, a test was performed to estimate the impact of this
exclusion, by using generic information of the Ecoinvent database. It showed that the impact of
including infrastructural processes in the LCA model concerning clinker production increased the
overall CO2 emissions by less than one percent, indicating that the exclusion was reasonable.
To facilitate the choice of generic data and secure good data quality an evaluation method by
Weidema & Wesnæs (1996) was applied. The influence of the generic data sets were tested and for
data of importance the research team made a data quality check in line with the mentioned
methodology, then to decide whether site-specific data should be requested instead.
Several previous LCA studies of cement are based on generic data from LCA databases, as the
primary data source. To calculate the elementary flows regarding the upstream processes almost all
identified LCA studies have utilized LCA databases, especially regarding the emissions related to
upstream processes (Nisbet & Van Geem 1997a; Pade & Guimaraes 2007; M.E. Boesch et al. 2009b;
D.N. Huntzinger et al. 2009; Chen et al. 2010; Michael Elias Boesch & Stefanie Hellweg 2010).
Consequently, the impression is that this project is based on more case specific data than many other
similar studies.
2.4 Allocation
Inbound materials and fuels originating from upstream product systems where they are considered as
waste, have not been accounted any environmental impact in this study. This assumption is based on
the fact that they would have been produced anyway, regardless of being inputs to the Cluster West. In
such cases, it can be seen as reasonable to allocate all the impact to the upstream products system.
Nevertheless, transportation of these materials and fuels has been included and also impact caused by
treatment and upgrading processes in cases they were carried out to make the materials or fuels
suitable for CEMEX. Such examples are:
Animal meal and bone meal (MBM) - a special fraction of slaughterhouse waste.
All RDF-fluff materials - waste fractions from the municipal waste treatment that has been
grinded and mixed together.
Shredded tires - wasted tires are being shredded.
Granulated Blast Furnace Slag (GBFS) - the blast furnace slag has been granulated to be
suitable.

6
For several reasons the GBFS requires special attention. GBFS can be considered a byproduct, since it
in contradiction to the others has not been handled as a waste by definition and it can be bought on a
market. In addition, the amounts of GBFS is much higher than those for other “waste materials” and it
is related to the steel industry contributing to significant environmental impact. Consequently, it is
reasonable to argue that more impact should be allocated to this material than only the minor impact
caused when granulating the slag (i.e. mainly cooling it with water).
In the comprehensive LCA that formed the foundation of the study, only the impact caused by
upgrading was considered. But to complement the picture, economic allocation was carried out for the
GBFS. This means that a portion of the potential climate impact from the upstream product system,
which is the production of pig iron, has been allocated to the GBFS. Generally, the choice of
allocation principles is controversial and can a have large influence on the final results (Reap et al.
2008; Van den Heede & De Belie 2012). In the reviewed LCA studies of cement, allocation is handled
in different ways. Some studies have choices similar to those of this paper (Michael Elias Boesch &
Stefanie Hellweg 2010; Chen et al. 2010), while others use system expansion (Lee & Park 2005) or do
not explain this issue (Nisbet & Van Geem 1997b; Navia et al. 2006; Flower & Sanjayan 2007;
Deborah N. Huntzinger & Eatmon 2009b).
2.5 Simplified LCA model
In addition to the more comprehensive LCA model, focusing on 2009 and the selected products, the
intention was to create and test a simplified model that could be used to analyze other cement products
and dynamics in the production system. The simplified LCA model was developed in a five step
process shown in figure 2. All LCA models were created and calculated using the LCA software
SimaPro, ver.7.3.
1997 2009 future
Comprehensive LCA model
more than 50 input variables
Simplified LCA Model
6 key performance indicators (KPIs)
1
3 54
Product perspective:Comparison of products
CEM I 42,5CEM III/A 42,5CEM III/B 42,5
Production perspective (temporal perspective):Comparison of cement production systems in 1997, 2009, and future
2KPI selection and
definition
Figure 2. Illustration of the main steps of the methodology, going from comprehensive to a simplified LCA model
for analyzing different products as well as production systems.
The first step is the comprehensive LCA model previously described, that was based on a thorough
life cycle inventory. In accordance with the aim, the focus is on 2009 and on a comparison of the
selected products (therefore product perspective in the figure). Step 1 included more than 50 different
input variables.

7
In the second step it was tested if any parameters were of special importance, referred to as Key
Performance Indicators (KPI). If a few such parameters can be found that provide most of the
information needed, the complexity of the problem is reduced significantly without losing too much
accuracy. Such influential parameters concerning the CO2 emissions existed and were identified, see
Figure 3. According to the results of the comprehensive LCA, the main sources of CO2 emissions (or
avoided emissions) were identified as CO2 from combustion of fuels, calcination, production of
electricity, and CO2 emissions which can be avoided by substituting clinker. More information about
the definitions of the selected KPIs is available in Ammenberg et al. (2011).
In step 3 a simplified model of the production system was developed based on KPIs, as shown in the
Figure 3. To test this simplified model, the results of the comprehensive and simplified LCAs for
clinker and the selected products were compared.
Figure 3. A simplified production system and illustration of the simplified LCA model where Cluster West is
modeled based on the key performance indicators and only producing clinker and the virtual Cluster West
portfolio cement.
With this simplified model, only data to calculate the KPIs was needed, which was the case for Cluster
West in 2009 (step 3) and partly for 1997 (step 4), However, to be able to analyze future versions of
the production system (step 5), a more simplified and abstract way to model was required to better
demonstrate the changes in the inventory and in the system. The energy input was modeled as shown
in Figure 4, without specifying each fuel in detail (coal, oil, etc.).
Energy mix
Fuel mix Electricity mix
Renewable (biogenic) fuel mix
Non-renewable fuel mix
Renewable (carbon neutral) electricity mix
Non-renewable electricity mix
Figure 4. Simplified energy parameters used for the calculation of the KPIs.

8
Instead, it was seen as an ‘energy mix’, consisting of a share of a ‘fuel mix’ and an ‘electricity mix’.
Further on, these two parts consisted of a ‘renewable fuel mix’ and a ‘non-renewable fuel mix’, and a
‘renewable electricity mix’ and a ‘non-renewable electricity mix’, respectively. It was also assumed
that the composition of the fuels, and the corresponding emissions from Cluster West in 2009, was
representative for all other assessed time periods as well. However, the share of the renewable fuel
mix of the total fuel mix, and the share of the electricity mix of the total energy mix, could vary. The
same assumption was used for the electricity mix.
In addition, the cement products changes over time and if the performance of the production system
(and its development) is to be evaluated, a simple and representative product is required. To be able to
handle earlier versions and changes of the production system, a representative product was defined. It
can be described as a virtual product called Cluster West portfolio cement, defined as the weighted
average of all the products in Cluster West. For example, the clinker substitution rate of the portfolio
cement was calculated as the weighted average of all products. Based on the previous steps, it seemed
reasonable to model the Cluster West portfolio cement as a product consisting of only clinker, clinker
substitutes (mainly GBFS in this case) and ‘others’ (any other additives being a part of the product).
Important reasons behind this choice were the fact that the clinker production contributed to the
majority of the CO2 emissions and that GBFS was used extensively. Together clinker and clinker
substitutes (mainly GBFS) represented about 90-95% of the total mass of the final product. Step three
transformed the production system into a system that only produced clinker and the virtual Cluster
West portfolio cement - see Figure 3.
Step 4 and 5 were used to get results concerning the Cluster West as it was in 1997 and also to analyze
future developments. To be able to use the simplified LCA model for these production systems,
information about the key performance indicators 1-6 was required that for 1997 was derived from
data about the energy input (fuel and electricity) to calculate the KPI#3-KPI#6.
The results concerning 1997 were thus calculated by changing several of the KPIs according to the
production conditions of 1997. For instance, KPI#1 changed due to a lower rate of clinker substitution
and KPI#4 was changed to reflect that the share of renewable (biogenic) fuels was lower in 1997.
A possible future production system was modeled both qualitatively and quantitatively. The
qualitative modeling is presented in Feiz et al. (2012) and it resulted in a list of relevant options for
improvement. This list formed the basis for deciding about an improved production system that was
modeled quantitatively using the previously described KPIs and the simplified LCA model (meaning
that the KPIs were updated to reflect the possible, future, improved production system).
Since there was no actual data regarding the future scenario, the impact of each individual KPI on the
CO2-performance of the Cluster West was evaluated. This was achieved by performing a sensitivity
analysis on the simplified LCA model of 2009 assuming the inputs of the model were the KPIs and the
output was the CO2-eq emissions. The sensitivity analysis was performed by applying 1%, 5%, 10%
and 20% changes (decrease or increase) on each KPI and calculating the resulting change in the CO2-
eq emissions from the considered product (clinker or portfolio cement). Knowing the sensitivity of the
output (CO2 emissions) related to different KPIs, it was also possible to calculate LCA results for
different versions of the production system.
3 Results and discussion
3.1 Life cycle inventory for 2009
Table 1 shows the required amounts of inputs such as materials, fuels, transportation and electricity for
the production of 1 ton clinker and the selected cement products in 2009.
Table 1. Required amounts of inputs of materials, fuels, transportation and electricity for the production of 1 ton
of different products. These are based on the life cycle inventory (LCI) for Cluster West in 2009 (step 1). Some of
the LCI figures, such as the ones concerning transportation of intermediate products internally within the
cluster, are calculated in the LCA model but are not included in this table.

9
Inbound
materials/fuels/electricity Unit Clinker CEM I 42,5
CEM III/A
42,5
CEM III/B
42,5
Cli
nk
er p
rod
uct
ion
(B
eck
um
-
Ko
llen
bach
)
Animal meal MJ 1098 - - -
Crushed marly limestone Kg 1002 35 - -
Electricity kWh 69 - - -
RDF-Fluff MJ 1440 - - -
High grade limestone Kg 502 - - -
Kiln-coal MJ 968 - - -
Light fuel oil MJ 17 - - -
Lignite MJ 316 - - -
Lime sludge Kg 7 - - -
Rail transport Tkm 26 - - -
Refractory waste Kg 0,5 - - -
Road transport Tkm 32 3.2 - -
Tires MJ 72 - - -
Cem
ent
pro
du
ctio
n (
Bec
ku
m-
Koll
enb
ach
, D
ort
mu
nd
an
d
Sch
wel
ger
n)
Additives Kg - 2 9 -
Bypass dust Kg - 24 0.1 -
Clinker kg - 896 3 -
Clinker meal Kg - - 4 -
Clinker-RA Kg - - - -
Coke gas MJ - - - -
Electricity kWh - 49 6 1
GBFS Kg - - 3 -
GGBFS-fine Kg - - 377 603
Gypsum (normal, 90/10,
REA)
Kg - 45 0.4 -
Natural gas MJ - - 0.0006 -
Other intermediate
products
Kg - - 612 397
Road transport Tkm - - 1.1 -
The majority of direct inputs of raw materials to the Cluster West 2009 were related to the production
of clinker at the Beckum-Kollenbach plant. The direct input of raw materials is significantly smaller
for the rest of the cement products since their main inputs come from intermediate products
manufactured within the cluster. Most of the fuel is burned at the kiln of Beckum-Kollenbach. Only
small amounts of fossil fuels, i.e. natural gas and coke gas, are used for the production of CEM III/A
42.5 and CEM III/B 42.5. Electricity is used for the production of all products, but for different
purposes. Concerning the production of clinker at Beckum-Kollenbach, electricity is mainly used for
the preparation of raw materials. In Schwelgern and Dortmund the use of electricity is primarily due to
the process of milling and blending clinker with GBFS, gypsum and other additives.
Many different intermediate products are produced within the Cluster West. These intermediate
products are used in the production of the studied cement products and therefore have been taken into
consideration. This means that all intermediate products have been modeled in detail, with complete
life cycle data inventories, in the comprehensive LCA (step 1). Table 2 shows compiled information
about the products and intermediate products. It contains information about the composition in terms
of clinker, clinker substitutes (assumed to be GBFS in Cluster West) and other materials (such as
gypsum and other additives).
Table 2. The composition of the studied cement products and intermediate products. Abbreviations such as
EPZ-H, HP-A4 and so on are names given to different intermediate products.
Product/inter-mediate
product Production plant
Clinker
% weight
Clinker substitutes
(GBFS) %weight
Others
%weight
Bypass dust Different sites 0 0 100
CEM I 42,5 Beckum-Kollenbach 90 0 10
CEM III/A 42,5 Dortmund 47 45 8

10
CEM III/B 42,5 Schwelgern 25 70 5
Clinker Beckum-Kollenbach 100 0 0
Clinker meal Beckum-Kollenbach 66 0 34
EPZ-H Dortmund 66 27 7
GBFS Schwelgern 0 100 0
GGBFS-fine Dortmund, Schwelgern 0 100 0
GGBFS-standard Dortmund, Schwelgern 0 100 0
HP-A4 Dortmund 67 23 10
HP-A5 Dortmund 0 27 73
HP-B4 Schwelgern 62 24 14
HPS-1 Beckum-Kollenbach 79 0 21
HPS-2 Beckum-Kollenbach 91 0 9
3.2 Life cycle impact assessment for 2009
The comprehensive LCA from cradle to gate (step 1 in Figure 2) gave the results shown in Table 3.
Within the cement industry benchmarking is often based on figures concerning clinker, where the
global warming potential for Cluster West was found to be 850 kg CO2-eq. This could be compared to
the world average, that according to Moya et al.(2010) is in the range 900-1000 kg CO2-eq per ton.
Table 3. The global warming potential for the selected cement products from Cluster West in 2009 and also the
virtual, average product – Cluster West Portfolio Cement (CCWCP 2009).
Cement
products
Production
plant
Clinker-to-
cement ratio (%)
GBFS-to-
cement
ratio (%)
Other
contents
(%)
Clinker
substitution
rate (%)
Global
warming
potential (kg
CO2-eq/ton)
Clinker Kollenbach 100 0 0 0 850
CEM I 42,5 Kollenbach 90 0 10 10 779
CEM III/A 42,5 Dortmund 47 45 8 53 452
CEM III/B 42,5 Schwelgern 25 70 5 75 265
CCWCP 2009 CCW 40 53 7 60 385
About 88% of the CO2-eq emissions for clinker are linked to the production process of the Beckum-
Kollenbach plant (Table 4), to a large extent explained by the calcination corresponding to about 64%.
The second and third most contributing processes can also be found within the Kollenbach plant - the
incineration of kiln coal and RDF-fluff (silo) that emitted about 10% and 8% respectively. This was
not surprising since relatively large amounts of these fuels are incinerated to produce 1 ton of clinker.
The part of the life cycle where raw materials are extracted, upgraded and transported to the
Kollenbach plant contributed to 12% of CO2-eq emissions for clinker. This was mainly due to the
electricity used for production of clinker and the animal meal that is used as alternative fuel. Each
contributed to about 5% of the total emissions from clinker. Together, the transportation contributed to
less than 0.5% of the total impact for clinker.
Table 4. CO2-eq emissions from the different processes in the life cycle of clinker.
Life cycle phase
Processes Emissions Share
kg CO2-eq / 1 ton clinker %
Raw material extraction
Cradle-to-gate (entrance)
Electricity (German mix) 46 5%
Upgrading of animal meal 39 5%
Kiln coal 12 1%
Transport (road) 3 0,3%
Calcareous marl 2 0,3%
Transport (rail) 1,0 0,1%
Upgrading of RDF-fluff (silo) 1,2 0,1%
Limestone 0,9 0,1%
Refractory waste 0,6 0,1%
Light fuel oil 0,3 0,03%
Lignite 0,2 0,03%
Upgrading of RDF-fluff (kiln) 0,1 0,01%
Upgrading of tire 0,1 0,01%
Upgrading of RDF-fluff (agglomerate) 0,0 0,003%

11
Total raw material extraction phase 106 12%
Production Gate-to-gate
Calcination of raw materials 541 64%
Incineration of kiln coal 89 11%
Incineration of RDF-fluff.silo 71 8%
Incineration of lignite 31 4%
Incineration of tires 4,7 0,6%
Incineration of RDF-fluff.agg 3,2 0,4%
Incineration of RDF-fluff.kiln 2,0 0,2%
Incineration of light fuel oil 1,3 0,2%
Total production phase 744 88%
Total clinker cradle to gate life cycle 850 100%
It is important to remember that these results do not include any allocation of the impact from the
iron/steel industry, via the slag (GBFS), to the cement products. But it is reasonable to see the GBFS
as a byproduct of iron production (not as waste) and therefore allocate some of the impact caused by
iron production to it. An economic allocation was carried out based on a price estimation performed
by Chen et al. (2010a). It suggested that 2.3% percent of the impact of iron production should be
allocated to the GBFS per ton. Some of the results from Table 3 are illustrated in Figure 5, which also
shows the impact of economic allocation based on data about pig iron production from the Ecoinvent
database. Naturally, it only makes a difference for the two products with GBFS content.
850779
452
265
850779
467
289
0
100
200
300
400
500
600
700
800
900
1000
Clinker CEM I 42.5 CEM III/A 42.5 CEM III/B 42.5
No allocation for GBFS
Economic allocation for GBFS
Figure 5. CO2-eq emissions from the comprehensive LCA model, but also showing the impact if economic
allocation is performed allocating 2,3% of the impact from pig iron production to the selected products.
Not surprising, the results in Table 3 and Figure 5 verify that the climate performance clearly differs
between the selected cement products, where less clinker means reduced CO2-eq emissions. For
example, the emissions associated with CEM III B 42,5 only corresponds to 34% of those for
CEM I 42,5 without allocation and about 37% including an allocation as presented. These results are
similar to those of Van den Heede & De Belie (2012) concerning economic allocation, but that study
in addition shows that a mass allocation would lead to very different results – suggesting that it is not
an advantage to utilize GBFS from a climate perspective.
3.3 Key performance indicators
The key performance indicators (KPIs) were shown in Figure 3. Figure 5 provides information about
their values for the Cluster West portfolio cement of 2009.

12
Table 5. The key performance indicators, their units and values for the Cluster West portfolio cement of 2009.
Key Performance Indicator (KPI) Unit 2009 value
KPI#1 Clinker substitution rate % weight 60%
KPI#2 CO2 emissions due to calcination Kg CO2/ton 541
KPI#3 Specific energy consumption (fuel) MJ / ton 3913
KPI#4 Share of renewable (biogenic) fuels % thermal energy 41%
KPI#5 Specific energy consumption (electricity) kWh / ton 69
KPI#6 Share of renewable electricity % electricity 0%
3.4 Validation of the simplified LCA model
As described earlier, a test was performed comparing the results of the simplified model and the
comprehensive LCA model. For this purpose, different products in 2009 were compared, and it
showed that the difference was less than 4% (Figure 6).
0
100
200
300
400
500
600
700
800
900
1000
Clinker CEM I 42.5 CEM III/A 42.5 CEM III/B 42.5 Cluster Westportfolio cement
Comprehensive LCA 2009
Simplified LCA 2009
Interpolated values based on comprehensive LCA 2009
Emis
sio
ns
(kg
CO
2-e
q /
to
n o
f p
rod
uct
)
Figure 6. Comparison of the results of the traditional and simplified LCA approach for the selected cement
products and the simulated CCWCP.
The sensitivity analysis was performed as described to quantify the relation between changes of each
KPI and the results of the LCA (global warming potential as CO2-eq). See Figure 7, where KPIs with
bigger impact have more negative slopes.

13
200
220
240
260
280
300
320
340
360
380
400
0% 2% 4% 6% 8% 10% 12% 14% 16% 18% 20%
Emis
sio
ns
(kg
CO
2-e
q /
to
n o
f p
rod
uct
)
Changes in KPI in the direction of improvement (%)
KPI#1: Clinker substitution rate
KPI#2: CO2 emission due to calcination
KPI#3: Specific energy consumption (fuel)
KPI#4: Share of renewable (biogenic) fuels
KPI#5: Specific energy consumption (electricity)
KPI#6: Share of renewable electricity
Figure 7. The linear relation between changes of KPIs and the output of the LCA model.
The purpose of developing the simplified LCA was to make it possible to consider different conditions
for the production system (i.e. Cluster West in 1997, 2009 and future) without losing too much
accuracy. Having conducted the comprehensive LCA, important results could be generated based on
knowledge about six key performance indicators (KPIs) regarding overall information about materials,
the fuel and electricity mix. The simplified LCA approach was then used for other products and
versions of Cluster West, without collecting large amounts of additional specific Life Cycle Inventory
(LCI) data for those products or production systems.
Clearly, the simplified LCA approach conformed well to the result of the comprehensive LCA
approach. The small difference between the traditional and simplified LCA approach (ranged between
-2% to 2%) is acceptable, since the simplified approach is not intended to be used for exact
calculations of the global warming potential. Its purpose was to simplify LCA modeling of dynamic
developments of a rather complicated production system and to be able to draw overall conclusions
based on a few important parameters (the KPIs), instead of having to carry out a detailed analysis, like
the comprehensive LCA (step 1), for all the changes in the cement production systems.
3.5 Simplified LCA for 1997 and possible future
To assess the historical production system of 1997 (step 4 in Figure 2), the key performance indicators
were altered to reflect that system. For example, the clinker substitution rate, use of alternative fuels
and electrical efficiency were lower. Using the calculated KPIs for 1997, the simplified LCA gave
results as shown in Figure 8.
During the project several future options for development of Cluster West were identified and assessed
(Ammenberg et al. 2011) and for all of them the simplified LCA model could be applied via
translating changes in terms of the KPIs. One possible scenario is that Cluster West continues to
develop similarly to the studied period between 1997 and 2009. Regarding the KPIs, that would mean
(conservatively) about 10% increase of clinker substitution rate (KPI#1), 20% increase of the share of
renewable fuels (KPI#4) and 10% reduction of specific electricity consumption (KPI#5). The results

14
for this scenario for clinker and the virtual cement portfolio product that have been assessed are shown
in Figure 8.
964
850818
753
385
316
0
100
200
300
400
500
600
700
800
900
1000
1997 2009 Future
Clinker Cluster West portfolio cement
Emis
sio
ns
(kg
CO
2-e
q /
to
n)
Figure 8. Global warming potential for clinker and portfolio cement produced at the Cluster West, for 1997,
2009 and a possible future version as described above.
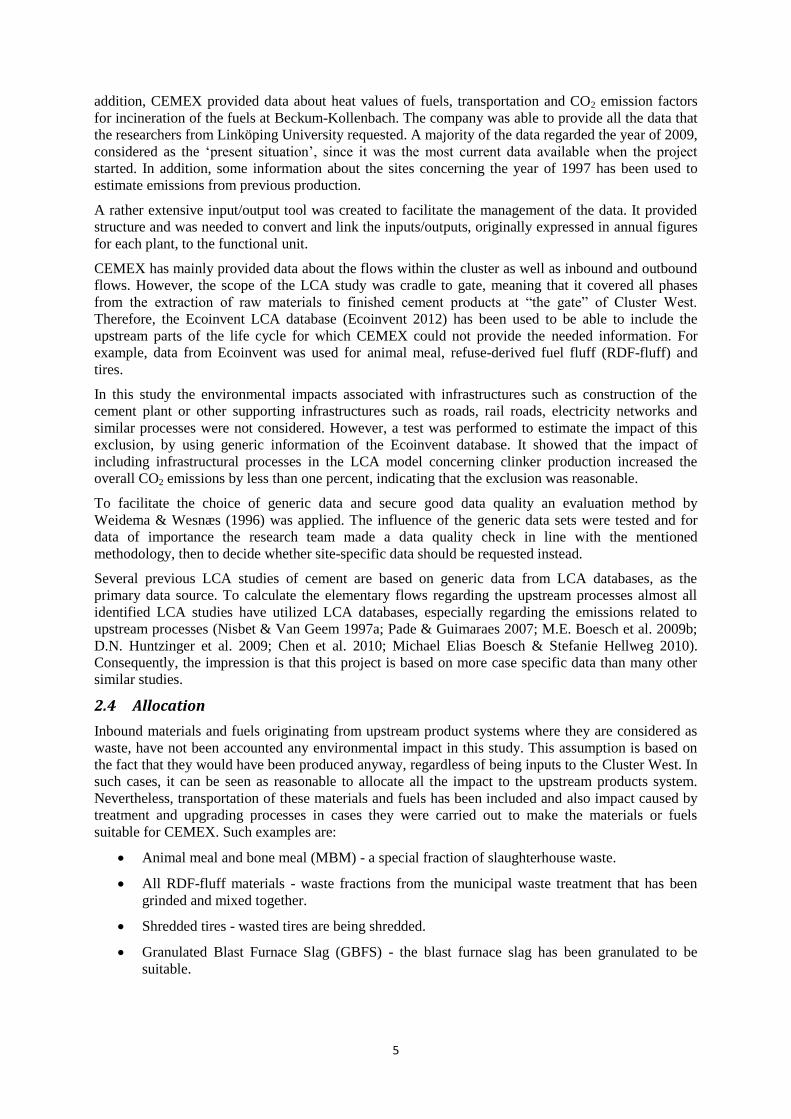
A comparison of the clinker production systems in 1997 and 2009 shows that improvement measures
have has been effectively implemented within the cluster. During the 12 years between 1997 and to
2009 the global warming potential of the virtual portfolio product (the average product) has decreased
by about 368 kg CO2-eq/ton. Most of the measures of relevance for the clinker production can be
characterized as local production efficiency measures at the plant level, for example, increasing the
thermal efficiency of the kiln and decreasing the electrical energy consumption in the production
processes. There are however more important initiatives having a wider scope, comprising flows and
actors outside the production plants. The main reason behind the improvements since 1997 was the
increased production of blended cements within the cluster, where GBFS to a large extent has
substituted clinker. Another important reason is that fossil fuels have been replaced with alternative
fuels, including renewable fuels, since alternative fuels are causing less CO2 emissions.
4 Conclusions
Based on a comprehensive LCA from cradle to gate for 2009, this study showed that CEMEX Cluster
West is producing clinker rather efficiently, in comparison with average cement production in Europe
and many other regions in the World (Japan being one exception). There are several reasons for this,
for example measures within the facilities leading to improved energy efficiency. Another important
explanation is the increased share of alternative fuels, of which a part is renewable.
Shifting focus from the production and clinker to the cement products showed that the Cluster West
cement product portfolio (a virtual average product) is very favorable from a climate perspective. This
is mainly a consequence of using a high share of clinker substitutes, where granulated blast furnace
slag (GBFS) from a steel company is replacing clinker. To illustrate the importance of the production
facilities in relation to the type of cement, an interesting conclusion is that the emissions for clinker
were reduced about 12% in the period from 1997 to 2009 (very much reflecting changes of
technology, fuels, etc.). In the same period the corresponding figure for the portfolio cement was close
to 49%. As expected, less clinker means a lower global warming potential. This impression clearly

15
remained even after an economic allocation concerning the GBFS, where some of the impact from pig
iron production was included.
Based on the comprehensive LCA a much simpler LCA model was developed and applied. This was
possible since six key performance indicators to a large extent decided the results. The simplified
model made it viable to assess older and future versions of Cluster West. Utilizing information from
1997 the key performance indicators were altered to reflect that production system and therefore the
changes from 1997 until 2009 could be analyzed. Similarly, potential improved future versions of
Cluster West could also be assessed.
In addition to the LCA results, the study illustrated how the results from a comprehensive LCA study
can be utilized to create a much simpler model with reasonable accuracy. The model made it possible
to handle dynamics in a complicated production system efficiently. In this case, instead of gathering
information about more than 50 parameters, it was enough to monitor 6 key indicators.
The same approach can be used for other cement production systems and it would be interesting to
explore the possibilities of using similar approaches in other industrial sectors.
5 Acknowledgement
This paper is based on a project funded by the CEMEX Research Group AG Switzerland. The authors
from Environmental Technology and Management at Linköping University are very grateful for this
opportunity to learn more about CEMEX, cement production and its climate impact.
6 References
Ammenberg, J. et al., 2011. Industrial symbiosis for improving the CO2-performance of cement
production, Sweden. Available at: http://liu.diva-
portal.org/smash/get/diva2:474457/FULLTEXT01.
Boesch, M.E., Koehler, A. & Hellweg, S., 2009a. Model for cradle-to-gate life cycle assessment of
clinker production. Environmental Science and Technology, 43(19), pp.7578–7583. Available at:
http://www.scopus.com/inward/record.url?eid=2-s2.0-
70349618648&partnerID=40&md5=28d47789ad980f4fe440ddf7e2d36ae0 [Accessed October
15, 2010].
Boesch, M.E., Koehler, A. & Hellweg, S., 2009b. Model for cradle-to-gate life cycle assessment of
clinker production. Environmental Science and Technology, 43(19), pp.7578–7583. Available at:
http://www.scopus.com/inward/record.url?eid=2-s2.0-
70349618648&partnerID=40&md5=28d47789ad980f4fe440ddf7e2d36ae0 [Accessed October
15, 2010].
Boesch, Michael Elias & Hellweg, Stefanie, 2010. Identifying Improvement Potentials in Cement
Production with Life Cycle Assessment. Environmental Science & Technology. Available at:
http://dx.doi.org/10.1021/es100771k [Accessed November 10, 2010].
Bretz, R., 1998. SETAC LCA Workgroup: Data availability and data quality. The International
Journal of Life Cycle Assessment, 3(3), pp.121–123. Available at:
http://www.springerlink.com/index/H7XH4J1452212R87.pdf [Accessed September 13, 2012].
Chen, C. et al., 2010. LCA allocation procedure used as an incitative method for waste recycling: An
application to mineral additions in concrete. Resources, Conservation and Recycling, 54(12),
pp.1231–1240. Available at: http://www.scopus.com/inward/record.url?eid=2-s2.0-

16
77955850247&partnerID=40&md5=25af03c6fe2082111b620acc329424a9 [Accessed October 8,
2010].
EIPPCB, 2010. Integrated Pollution Prevention and Control (IPPC): Reference document on Best
Available Techniques in the Cement, Lime and Magnesium Oxide manufacturing Industries.
Available at: http://eippcb.jrc.es/reference/cl.html.
Ecoinvent, 2012. List of ecoinvent Reports. Available at:
http://www.ecoinvent.org/documentation/reports/ [Accessed September 14, 2012].
Feiz, Roozbeh, 2011. Improving climate performance of cement production; developing an assessment
framework and applying it to a CEMEX cement production cluster in Germany. Sweden.
Available at: http://liu.diva-portal.org/smash/get/diva2:496645/FULLTEXT01.
Fleischer, G. et al., 2001. LCA Methodology A Semi-Quantitative Method for the Impact Assessment
of Emissions Within a Simplified Life Cycle Assessment. , 6(3), pp.149–156.
Flower, D.J.M. & Sanjayan, J.G., 2007. Green house gas emissions due to concrete manufacture.
International Journal of Life Cycle Assessment, 12(5), pp.282–288. Available at:
http://www.scopus.com/inward/record.url?eid=2-s2.0-
34547580892&partnerID=40&md5=6e642508e0ca65c1e24837b99af98f30 [Accessed November
10, 2010].
Gäbel, K. & Tillman, A.-M., 2005. Simulating operational alternatives for future cement production.
Journal of Cleaner Production, 13(13-14), pp.1246–1257. Available at:
http://www.scopus.com/record/display.url?eid=2-s2.0-
22644431654&origin=inward&txGid=3fOcne2JiqMFHTnljm8kfUR%3a1.
Van den Heede, P. & De Belie, N., 2012. Environmental impact and life cycle assessment (LCA) of
traditional and “green”concretes: Literature review and theoretical calculations. Cement and
Concrete Composites. Available at:
http://www.sciencedirect.com/science/article/pii/S0958946512000054 [Accessed September 13,
2012].
Hochschorner, E. & Finnveden, G., 2003. Evaluation of two simplified life cycle assessment methods.
International Journal of Life Cycle Assessment, 8(3), pp.119–128. Available at:
http://www.scopus.com/record/display.url?eid=2-s2.0-
0038513817&origin=inward&txGid=3fOcne2JiqMFHTnljm8kfUR%3a3.
Huntzinger, D.N. et al., 2009. Carbon dioxide sequestration in cement kiln dust through mineral
carbonation. Environmental Science and Technology, 43(6), pp.1986–1992. Available at:
http://www.scopus.com/inward/record.url?eid=2-s2.0-
64549083173&partnerID=40&md5=26aa5ebab6430aa76a424794a0b840ea [Accessed
November 15, 2010].
Huntzinger, Deborah N. & Eatmon, T.D., 2009a. A life-cycle assessment of Portland cement
manufacturing: comparing the traditional process with alternative technologies. Journal of
Cleaner Production, 17(7), pp.668–675. Available at:
http://www.sciencedirect.com.lt.ltag.bibl.liu.se/science/article/B6VFX-4SWP1TT-
1/2/017ab91eca875d825dfb76028d85907f [Accessed September 4, 2010].
Huntzinger, Deborah N. & Eatmon, T.D., 2009b. A life-cycle assessment of Portland cement
manufacturing: comparing the traditional process with alternative technologies. Journal of

17
Cleaner Production, 17(7), pp.668–675. Available at:
http://www.sciencedirect.com/science/article/pii/S0959652608000826 [Accessed May 26, 2011].
ISO 14040, 2006. Environmental management – Life cycle assessment – Principles and framework.
International Standard Organisation, Geneva, Switzerland.
ISO 14044, 2006. Environmental management – Life cycle assessment – Requirements and
guidelines. International Standard Organisation, Geneva, Switzerland. Available at:
http://www.iso.org/iso/catalogue_detail?csnumber=38498.
Josa, A. et al., 2004. Comparative analysis of available life cycle inventories of cement in the EU.
Cement and Concrete Research, 34(8), pp.1313–1320. Available at:
http://www.sciencedirect.com.lt.ltag.bibl.liu.se/science/article/B6TWG-4BGHB6B-
C/2/3da0a83ce5eaa66e410ade1b97941e1c [Accessed September 4, 2010].
Lee, K.-M. & Park, P.-J., 2005. Estimation of the environmental credit for the recycling of granulated
blast furnace slag based on LCA. Resources, Conservation and Recycling, 44(2), pp.139–151.
Available at: http://www.scopus.com/inward/record.url?eid=2-s2.0-
17444390440&partnerID=40&md5=c37d8efac0c76547366ec25825d5da56 [Accessed October
7, 2010].
Locher, F.W., 2006. Cement: principles of production and use, Verlag Bau+ Technik GmbH.
Lu, H., 2010. Evaluation of Life-Cycle Assessment Studies of Chinese Cement Production:
Challenges and Opportunities.
Mueller, K.G., Lampérth, M.U. & Kimura, F., 2004. Parameterised inventories for life cycle
assessment: Systematically relating design parameters to the life cycle inventory. International
Journal of Life Cycle Assessment, 9(4), pp.227–235. Available at:
http://www.scopus.com/record/display.url?eid=2-s2.0-
3543083879&origin=inward&txGid=3fOcne2JiqMFHTnljm8kfUR%3a5.
Navia, R. et al., 2006. Recycling contaminated soil as alternative raw material in cement facilities:
Life cycle assessment. Resources, Conservation and Recycling, 48(4), pp.339–356.
Nicolas, M. & Jochen, H., 2008. A blueprint for a climate friendly cement industry,
Nisbet, M. & Van Geem, M.G., 1997a. Environmental life cycle inventory of Portland cement and
concrete. World Cement, 28(4), p.3.
Nisbet, M. & Van Geem, M.G., 1997b. Environmental life cycle inventory of Portland cement and
concrete. World Cement, 28(4), p.3.
Ortiz, O., Castells, F. & Sonnemann, G., 2009. Sustainability in the construction industry: A review of
recent developments based on LCA. Construction and Building Materials, 23(1), pp.28–39.
Available at: http://www.scopus.com/inward/record.url?eid=2-s2.0-
54049100446&partnerID=40&md5=a767790a422b0dde54ccfb4c7b90ea45 [Accessed October
15, 2010].
Van Oss, H.G. & Padovani, A.C., 2002. Cement manufacture and the environment - Part I: Chemistry
and technology. Journal of Industrial Ecology, 6(1), pp.89–106. Available at:
http://www.scopus.com/inward/record.url?eid=2-s2.0-

18
0036907657&partnerID=40&md5=bce03840f93f3edf39c45f9cc4a51059 [Accessed September
13, 2010].
Van Oss, H.G. & Padovani, A.C., 2003. Cement manufacture and the environment, Part II:
Environmental challenges and opportunities. Journal of Industrial Ecology, 7(1), pp.93–126.
Available at: http://www.scopus.com/inward/record.url?eid=2-s2.0-
0038480214&partnerID=40&md5=d5fa7a3f58a40fc84a0d7a908577f7ed [Accessed September
13, 2010].
Pade, C. & Guimaraes, M., 2007. The CO2 uptake of concrete in a 100 year perspective. Cement and
Concrete Research, 37(9), pp.1348–1356. Available at:
http://www.scopus.com/inward/record.url?eid=2-s2.0-
34548129297&partnerID=40&md5=e8e3c5ded99cb998fa7458bd414b7fa7 [Accessed November
10, 2010].
Price, Lynn, Hasanbeigi, A. & Lu, Hongyou, 2010. Analysis of energy-efficiency opportunities for the
cement industry in Shandong Province, China: A case study of 16 cement plants. Energy, 35(8),
pp.3461–3473. Available at:
http://www.sciencedirect.com/science/article/pii/S0360544210002549 [Accessed May 25, 2011].
Reap, J. et al., 2008. A survey of unresolved problems in life cycle assessment. Part 2: Impact
assessment and interpretation. International Journal of Life Cycle Assessment, 13(5), pp.374–
388. Available at: http://www.scopus.com/inward/record.url?eid=2-s2.0-
45849094854&partnerID=40&md5=85dac79cbe54001d1eb39c6ffc21aaf8 [Accessed October 8,
2010].
Reijnders, L., 2007. The cement industry as a scavenger in industrial ecology and the management of
hazardous substances. Journal of Industrial Ecology, 11(3), pp.15–25. Available at:
http://www.scopus.com/inward/record.url?eid=2-s2.0-
34548297175&partnerID=40&md5=99dd9a7ed87c5e39c3dbbae57ed81c50 [Accessed
November 15, 2010].
Ross, S. & Evans, D., 2002. Excluding site-specific data from the LCA inventory: How this affects life
cycle impact assessment. International Journal of Life Cycle Assessment, 7(3), pp.141–150.
Available at: http://www.scopus.com/record/display.url?eid=2-s2.0-
0036100534&origin=inward&txGid=3fOcne2JiqMFHTnljm8kfUR%3a7.
Soriano, V.J., 2004. A SIMPLIFIED ASSESSMENT METHODOLOGY TO
ENVIRONMENTALLY- SOUND PRODUCT DESIGN Virginia Jose Soriano. , pp.1–11.
Sun, M., Rydh, C.J. & Kaebernick, H., 2004. Material Grouping for Simplified Product Life Cycle
Assessment. , pp.45–58.
Weidema, B.P. & Wesnæs, M.S., 1996. Data quality management for life cycle inventories—an
example of using data quality indicators. Journal of Cleaner Production, 4(3-4), pp.167–174.
Available at: http://www.sciencedirect.com/science/article/pii/S0959652696000431 [Accessed
October 20, 2011].
Wenzel, H., Hauschild, M. & Alting, L., 1997. Environmental assessment of industrial products-
Volume 1-Tools and case studies. Institute for Product Development, Technical University of
Denmark, Chapmann & Hall.

19
Worrell, E. et al., 2001. Carbon dioxide emissions from the global cement industry. Annual Review of
Energy and the Environment, 26, pp.303–329. Available at:
http://www.scopus.com/inward/record.url?eid=2-s2.0-
0035699480&partnerID=40&md5=fa8be1548e04fa658a2c494800dd0182 [Accessed October 7,
2010].