Utilities Kingston - Appendix G - O'Connor Drive Treated ... · 2008. The site work consisted of...
33
Appendix G Preliminary Geotechnical Investigation Proposed O’Connor Water Reservoir O’Connor Drive, Kingston, ON
Transcript of Utilities Kingston - Appendix G - O'Connor Drive Treated ... · 2008. The site work consisted of...

Appendix G
Preliminary Geotechnical Investigation Proposed O’Connor Water Reservoir
O’Connor Drive, Kingston, ON

PRELIMINARY GEOTECHNICAL INVESTIGATION PROPOSED O’CONNOR WATER RESERVOIR
O’CONNOR DRIVE, KINGSTON, ON
Date: June 23, 2008 Reference: No. T030322-A1

Reference No. 518-T030322-A1 June 23, 2008 Mr. Dan LaLande, P.Eng. J.L. Richards & Associates 203-863 Princess Street Kingston, ON K7L 5N4 RE: Preliminary Geotechnical Investigation Proposed O’Connor Water Reservoir
O’Connor Drive, Kingston, Ontario ________________________ ___________ Dear Mr. LaLande: In accordance with your recent request, we have conducted a preliminary geotechnical investigation at the above-mentioned site and are pleased to present our report. At the time of preparing this report, the type of reservoir, type of foundation and footprint location had not been determined. Once these details have been established, a supplementary geotechnical investigation may be undertaken to compliment this report. We trust this information is to your satisfaction. Please do not hesitate to contact our office should further questions arise. Yours Very Truly, INSPEC-SOL INC.
Janice Nunney, M.Eng., P.Eng. Manager - Kingston JN/br Encl.

Reference No. 20318-T030322-A1 i
TABLE OF CONTENTS
1.0 INTRODUCTION .................................................................................................1
2.0 FIELD AND LABORATORY PROCEDURES .................................................1
3.0 SUMMARY OF FIELD AND LABORATORY RESULTS..............................4
3.1 Subsurface Conditions .................................................................................4 3.2 Groundwater ................................................................................................5
4.0 GEOTECHNICAL DISCUSSION AND RECOMMENDATIONS .................7
4.1 Foundation Design Parameters ....................................................................7 4.2 Seismic Classifications ................................................................................9 4.3 Lateral Earth Pressure..................................................................................9 4.4 Slab on Grade Design Parameters .............................................................10 4.5 Excavation .................................................................................................10 4.6 Backfill/Permanent Drainage.....................................................................11 4.7 Quality Control ..........................................................................................12
5.0 LIMITATION OF THE INVESTIGATION ....................................................14
Table 3: Site Classification Calculations
DRAWINGS
Site Location Plan Plan No.: T030322-A1-1 Site Plan Plan No.: T030322-A1-2 Stratigraphic Section Inverted from MASW Data Plan No.: T030322-A1-3
ENCLOSURES
Borehole Logs, Notes on Borehole and Test Pit Reports Appendix A Caduceon Laboratory Results Appendix B

Reference No. 20318-T030322-A1 1
1.0 INTRODUCTION
The services of Inspec-Sol Inc. (Inspec-Sol) were retained by J.L. Richards & Associates (J.L. Richards) to complete a preliminary geotechnical investigation for the proposed construction of a new water reservoir. The site is located at the northeast corner of O’Connor Drive in Kingston, Ontario, as shown on the attached drawing T030322-A1-1. At the time of preparing this report, the type of reservoir had not yet been finalized and we understand that a concrete box structure or glass-lined steel tank is currently being contemplated. Furthermore, the foundation type and elevation had not been determined. The reservoir is anticipated to have a design capacity between 6 and 13 mega litres. The footprint of the proposed reservoir had not been determined at the time of preparing this report. The purpose of the investigation was to evaluate the subsurface conditions in the vicinity at the site in order to provide preliminary recommendations concerning bearing capacity, foundation design, seismic classification, groundwater conditions and other pertinent subsoil conditions that may affect construction.
2.0 FIELD AND LABORATORY PROCEDURES
2.1 Subsurface Investigation
The subsurface field investigation was conducted under Inspec-Sol’s supervision on May 14, 2008. The site work consisted of observing and logging the advancement of five (5) boreholes at the site. Each of the boreholes were advanced to bedrock, and within two boreholes, the bedrock was cored for a depth of approximately 3 metres. The borehole locations are indicated on the attached drawing T030322-A1-2. Samples were recovered at regular intervals with a conventional 50 mm split barrel sampler driven with an energy of 470 kilojoules using a falling weight. The number of drops with the falling weight to drive the sampler 0.3 m is recorded and shown on the Borehole Logs as SPT or “N” value, in general accordance with ASTM D 1586. When bedrock was encountered in the boreholes, coring of the rock was undertaken, in general accordance with ASTM 2113.

Reference No. 20318-T030322-A1 2
Retrieved samples were logged, labelled and packaged for transport in boxes. The logging included measurement of total core recovery (TCR), rock quality designation (RQD) and discontinuity spacing. All samples obtained in the investigation were sealed into plastic bags, and transported to Inpsec-Sol’s laboratory for detailed inspection and testing. All of the samples were examined in detail by tactile and visual methods by the project manager, and classified according to visual index properties. All retrieved soil samples were analysed for water content. Staff of Inspec-Sol laid out the borehole locations. The completed boreholes were staked by Inspec-Sol and surveyed by Leslie M. Higginson Surveying Ltd. We were provided a site survey of the property, including the borehole locations, and ground surface elevations at each of the borehole locations. The Borehole Logs are provided in Appendix A. Three (3) select soils were submitted to Caduceon Environmental Laboratories for analysis to assess potential soil corrositivity. The laboratory results are provided in Appendix B.
2.2 MASW Survey
Inspec-Sol carried out a Multi Channel Analysis of Surface Waves (MASW) survey at the above noted Site on May 7, 2008. The objective of the survey was to measure the shear wave velocity and its variation within the existing overburden soil and bedrock to a depth of 30 m. In accordance with National Building Code of Canada (2005) and Ontario Building Code (2006) the measured shear wave velocities was used to determine the seismic site classification. The MASW survey line (Line 1) is indicated on the attached drawing T030322-A1-2.
2.2.1 Background
The MASW method is a seismic geophysical technique to estimate the soil stiffness profile. MASW was developed in late 1990’s as an advancement of another seismic technique called spectral analysis of surface waves (SASW), which was in use since early 1960's. MASW

Reference No. 20318-T030322-A1 3
fieldwork is relatively easy and is carried out from ground surface with no disruption to underground utilities. The MASW method has been successfully utilized in various applications such as seismic site characterization according to building codes, dynamic soil parameter estimation, and underground cavity detection. To carry out an MASW test, several transducers (i.e. geophones) are deployed in a line at certain distances from a source. The length of the geophone array (D) determines the deepest investigation depth that can be obtained from the measurements. On the other hand, the distance between the geophones (dx) and the data acquisition-sampling rate (dt) determine the obtained resolution in the analysis. The distance between the source and first receiver (Offset Distance) determines the contamination level of the signals with body waves. A common practice is to choose a source to receiver distance equal to about 20 to 50 percent of the geophone array length. The source should produce enough energy over the desired test frequency range to allow for detection of Rayleigh waves above background noise. A common source is a sledgehammer; though more complicated sources with better control over the generated frequency range are also available commercially. The existing or generated traffic and background noise can also be utilised as a source for investigating deep soil layers. Generally, using a sledgehammer the maximum investigation depth is limited to about 15 m below the existing ground surface (bgs), however using traffic noise or more complicated sources the investigation depth can be increased to more than 30 m bgs. Successful application of MASW method to investigate depths of more than 100 m has also been reported, though these types of applications are not common and are labour and resource intensive.
Theoretically, the MASW test is based on the dispersive behaviour of Rayleigh wave (R-wave) in a layered media. Dispersion of R-wave arises because different frequencies traverse the medium with different velocities. The latter is due to the fact that the penetration depth of R-wave is inversely proportional to its frequency. Thus, higher frequencies travel through shallower strata, and lower frequencies propagate mostly in the deeper layers. For practical purposes, the maximum depth of penetration can be considered to be equal to one wavelength. Therefore each frequency carries the information associated to a specific depth of the medium that it is traversing. The recorded signals by the geophones, which are in time domain, constitute the basis of the calculation of phase velocity profile (dispersion curve) of the site. Subsequently, inversion of the constructed dispersion curve leads to the estimation of the shear wave velocity and shear modulus profile of the medium.

Reference No. 20318-T030322-A1 4
2.2.2 Procedures
The fieldwork of this program was carried out on Wednesday, May 7, 2008. At the time of survey, the ground surface was covered with grass, the surficial soil was in dry to moist condition and the weather condition was sunny to partly cloudy. The test was carried out using a 24 channel seismograph (Geometrics Geode 24 consol #3389), twenty-four 1.5 Hz geophones, and one 24 take-out cable with 5 m spacing. The field data was collected using an IBM T60 laptop and Geometrics single geode OS controller version 9.14.0.0. A line of twenty-four geophones spaced at 1.5 m – total array length of 34.5 m - were used to collect seismic data. A 12 lb sledgehammer hitting a steel base plate was used as an active source with an Offset Distance of 15 m. The vibration generated by a track mounted backhoe running parallel to the geophone array at a distance of between 10 m to 15 m was used as the passive seismic source. In order to obtain a two dimensional profile (2-D) the complete set-up was rolled six (6) times with an interval of 3.0 m (two stations), which resulted in a total investigation line of 49.5 m. Three (3) sets of data were collected at each array location without vertical stacking. For each survey, the ground vibration was recorded for 30 seconds at a sampling rate of one sample per 2 ms.
3.0 SUMMARY OF FIELD AND LABORATORY RESULTS
3.1 Subsurface Conditions
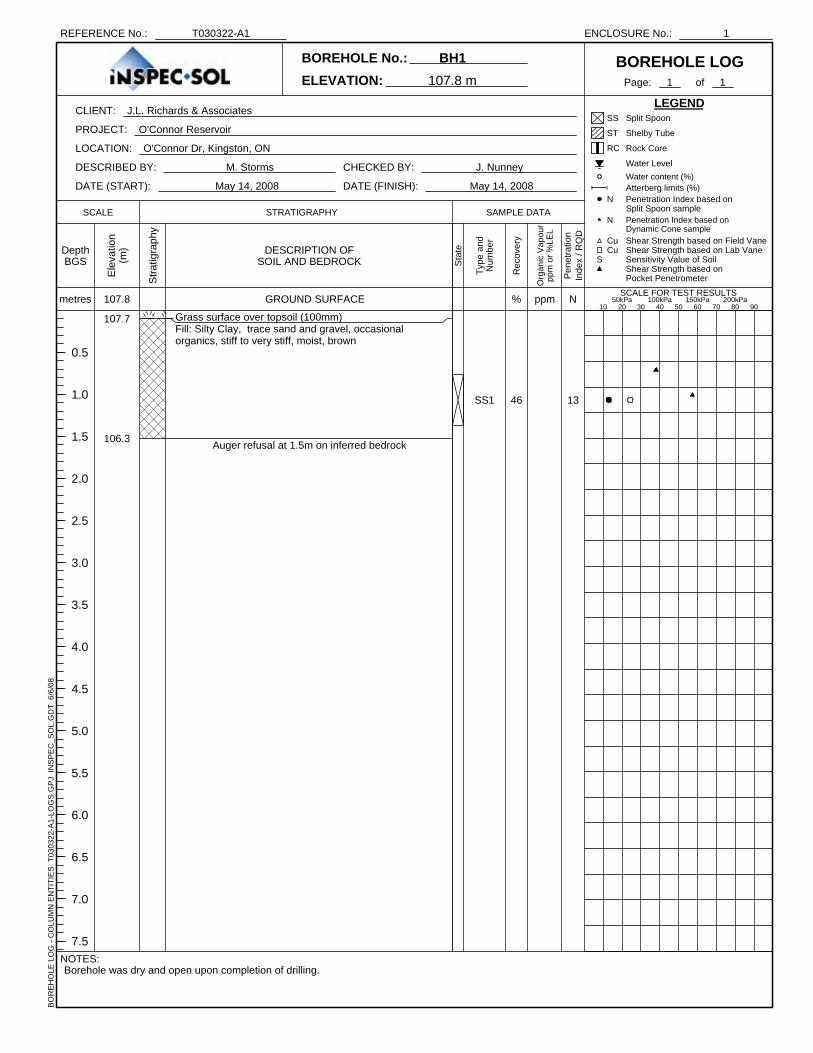
In general, the subsurface conditions consisted of surficial topsoil over earth fill and native, silty clay and clayey silt soils, which in turn overlay shallow limestone bedrock. Surficial topsoil (approximately 100 mm thick) was encountered at ground surface in each of the boreholes. The topsoil measurements should not be used for topsoil stripping calculations. Earth fill was encountered beneath the surficial topsoil in each of the boreholes. The fill extended to a depth of 1.5 to 3.1 metres below existing grades. The fill consisted of silty clay

Reference No. 20318-T030322-A1 5
with trace sand, gravel and organic materials. Based on the SPT and pocket penetrometer values (indicated on the Logs), the silty clay fill has a loose to compact density. Buried topsoil was not observed in the boreholes; however, it is common that a topsoil layer is present at the contact zone between the fill and native soils. A more intrusive investigation, such as test pits, would be required to verify the presence of buried topsoil. Native, undisturbed soils were encountered beneath the fill materials in Boreholes BH2 to BH5. The soils consisted of silty clay and clayey silt soils. Based on the SPT and pocket penetrometer values (indicated on the Logs), the silty clay and clayey silt soils have a stiff to hard consistency. These soils extended to bedrock. Actual or inferred limestone bedrock was encountered within each of the boreholes at depths of 1.5 to 4.5 m below existing grades, or at elevation 106.3 to 101.9 m. The top of rock appears to be generally dipping down towards the southeast corner of the site. A weathered bedrock surface was inferred within BH4, where the bedrock was augered for 0.6 m, prior to auger refusal. The rock was cored in two of the boreholes, BH2 and BH3. Based on observations and measurements of the limestone bedrock, it may be described as very thinly to thinly bedded, and fair to excellent quality (RQD values of 74 to 93%). It should be noted that weathering of the bedrock surface or solution channels might be present in the limestone.
3.2 Groundwater
Groundwater observations were made in each of the boreholes as drilling proceeded. No groundwater or caving of the boreholes was observed during or after the drilling operations. Standpipe piezometers were installed within boreholes BH2 and BH3 to monitor long-term ground water conditions. Groundwater levels were taken on May 27, 2008, approximately two weeks after installation. The groundwater level within boreholes BH2 and BH3 was recorded at elevations 103.1 and 104.1 m, respectively. Due to the low permeability of the limestone bedrock, these levels may not be representative of the long-term ground water levels. Groundwater levels may fluctuate seasonally.

Reference No. 20318-T030322-A1 6
3.3 Soil Corrositivity
Three (3) select soils were submitted to Caduceon Environmental Laboratories for analysis to assess potential soil corrositivity. The laboratory results are provided in Appendix B, and summarized below:
• pH: 6.90 to 7.24 • Resistivity: 1960 to 4130 ohms.cm • Chloride: 9 to 13 μg/g • Sulphate: 40 to 50 μg/g
3.4 MASW Survey
Data analysis including generation of dispersion curve, inversion of the obtained dispersion curves and development of 1-D and 2-D shear wave velocity profile at the Site was carried out using SurfSeis version 2.05. The inversion of the data was carried out using a ten (10)-layer soil velocity model. The dispersion curves and associated inversion data were calculated at six (6) stations each 3.0 m apart and a 2-D shear wave velocity profile was developed by interpolating between the calculated data. During the generation of dispersion curves the collected data with same midpoint stations were stacked. Drawing T030322-A1-3 shows the calculated 2-D velocity profile at the Site. This drawing shows the variation of the shear wave velocity at the Site to a depth of 30 m. The measured shear wave velocities show a surficial soil layer with average shear wave velocities less than 100 m/s up to a depth of about 1.0 m indicating loose to soft condition, underlain by a layer of firm/compact soil layer to a depth of about 3.0 m with shear wave average velocities ranging from 132 m/s to 168 m/s. Below the depth of about 3.0 m to the depth of 16.0 m average shear wave velocities were in the range of 334 m/s to 838 m/s indicating soft rock condition. From 16.0 m to 30 m below ground surface the average shear wave velocities were between 780 m/s to 1150 m/s indicating rock condition. In accordance with the requirements of Ontario Building Code (2006) and National Building Code of Canada (2005), the variation of the measured shear wave velocity versus depth up to 30 m below existing ground elevation was obtained at each station (Attached Table 3). The average shear wave velocity within the upper 30 m of the soil/rock profile was obtained utilizing the averaging scheme introduced in Sentence 4.1.8.4(2) of Commentary J of the NBC (2005) User's Guide. Based on the calculations presented in the attached Table 3, the average

Reference No. 20318-T030322-A1 7
shear wave velocity at the Site is 494 m/s. The latter value was obtained based on measurements along Line 1 at the approximate location depicted in the attached drawing T030322-A1-3.
4.0 GEOTECHNICAL DISCUSSION AND RECOMMENDATIONS
4.1 Foundation Design Parameters
As noted previously, at the time of preparing this report, the type of reservoir had not yet be finalized; a concrete box structure and glass-lined steel tank are currently being contemplated. Furthermore, the foundation type and elevation had not been determined. Recommendations for conventional shallow spread and strip footings for varying elevations are provided. The fill materials at the site are not suitable for the support of foundations. Conventional shallow spread and strip footings may be established on native, silty clay and clayey silt soils, sound limestone bedrock or Engineered Fill. The Ontario and National Building Codes require buildings to be designed using limit states design values of ultimate (ULS) and serviceability (SLS) and to check against allowable bearing values.
Conventional shallow spread and strip footings set on the native, silty clay or clayey silt soil of at least stiff consistency, at the site may be designed for a SLS of 150 kPa, and a ULS of 300 kPa.
Conventional shallow spread and strip footings set on sound limestone bedrock near the soil/bedrock interface may be designed with a ULS pressure of 500 kPa. There is no corresponding SLS value for foundations on bedrock. Settlements under the ULS pressure are expected to be nil. Star drilling to a depth of 1.5 m is required to prove there are no soil seams.
Conventional shallow spread and strip footings set on Engineered Fill may be designed for a SLS of 150 kPa, and a ULS of 300 kPa.
Higher bearing pressures may be available if the structure is set deeper, below the soil/bedrock interface. Further intrusive investigation would be needed to determine the allowable pressures.

Reference No. 20318-T030322-A1 8
A summary of elevations at which these bearing strata were encountered within the boreholes is provided in the table below. Table 1: Elevations of Bearing Strata
Borehole No.
Top of stiff Silty Clay to Clay Silt (SLS = 150 kPa, ULS = 300 kPa)
Top of Limestone Bedrock (ULS = 500 kPa)
BH1 N/a 106.3 m (inferred)* BH2 104.4 m 103.2 m BH3 105.4 m 104.2 m BH4 103.5 m 101.3 m (inferred)* BH5 103.5 m 102.6 m
* Requires further investigation to prove the bearing level. There is a risk that weathering or limestone slabs are present and foundations may require deeper excavation to reach sound rock The Engineered Fill supplied by contractors should be approved by Inspec-Sol prior to delivery to the site. A suitable fill may consist of any material that is free of organics and deleterious materials, well graded and of suitable nominal size, accepted by a Geotechnical Engineer, be environmentally acceptable, and be at a suitable moisture condition such that compaction of at least 100% SPMDD can be achieved. Typical Engineering Fills are granular materials meeting OPSS Granular A or B Type II (subject to gradation). It should be placed in thin lifts (200mm), compacted to 100% SPMDD and should be monitored on a full time basis by Inspec-Sol to ensure consistency, and compactness. The structure must also be designed to resist uplift pressures for the potential buoyancy of the structure relative to the local ground water level. All foundations exposed to freezing conditions must be provided with a minimum of 1.2 metres of earth cover for frost protection, or equivalent insulation. Inspec-Sol recommends that we be retained to review the structural drawings once complete to review for compliance with our recommendations and during construction to verify suitability of subgrade materials.

Reference No. 20318-T030322-A1 9
4.2 Seismic Classifications
According to Table 4.1.8.4.A of NBC (2005) and based on the measured average shear wave velocity of 494 m/s, the Site can be classified as Class C for seismic load calculations. This classification is applicable for the structure being founded on the native soils, bedrock or engineered fill.
4.3 Lateral Earth Pressure
If a below grade concrete structure is selected for the design, below-grade walls with soil backfills should be designed to withstand lateral earth pressures and using the NBC 2005-Part 4, Division B, Commentary K. Hydrostatic pressures should also be added unless there is a permanent perimeter drainage system installed. If granular materials are placed between bedrock or soil and poured concrete walls then the walls should be designed for lateral pressures resulting from the following: backfilled soil, in accordance with the soil properties in Table 1; temporary and permanent vertical loads on the completed ground surface, such as parked
vehicles or permanent fixtures; hydrostatic pressures; and lateral loads due to backfill compaction equipment.
Table 2: Subsurface Parameters
Soil Internal Friction
Unit Weight (kN/m3)
Ka Ko Kp
Compact Granular Backfill (Typical Granular A or B)
32o 21.5 0.31 0.47 3.26
The founding elevation for the reservoir was unknown at the time of preparing this report and whether or not the base of the reservoir will extend below the top of bedrock. Limestone Bedrock typically is considered to be self-supporting, i.e., exerts nil lateral pressures on basement walls. Walls poured directly against the bedrock need only be designed for hydrostatic pressures unless drainage systems are installed. In a seismic event, the lateral pressures are not affected for structures entirely within and poured in contact with rock. If a

Reference No. 20318-T030322-A1 10
structure is in contact with bedrock on one side and soil on the other (i.e., as may be the case at this site with the dipping bedrock), then seismic issues become complex and this would have to be reviewed in detail on an individual basis.
4.4 Slab on Grade Design Parameters
The modulus of subgrade reaction recommended for slab design on engineered fill or native, silty clay or clayey silt soils is 40,000 kN/m3. On the limestone bedrock, the recommended modulus of subgrade reaction is 80,000 kN/m3. Since the elevation of the lowest slab level or base of the structure is not yet determined, its relative position to the local groundwater level is unknown. If the structure is below the local groundwater level, provisions for sub floor drainage will be required to control seepage. The lowest slab must be provided with underfloor drainage layer. This layer is made by placing the slab on a minimum 200 mm layer of 19 mm clear stone (OPSS 1004) compacted by vibration to a dense state. This material serves also as the drainage media for the subfloor drainage system. The slabs should be free floating, and should not be tied into the foundation walls or grade beams. The placement of construction and control joints in the concrete should be in accordance with generally accepted practice. Floor toppings may be impacted by curing and moisture conditions of the concrete. Floor finish manufacturer’s specifications and requirements should be consulted and designers should decide on capillary and vapour barriers relative to intended floor finishes and the impact of such on concrete placement and curing should be taken into account.
4.5 Excavation
All excavations should be completed and maintained in accordance with the Occupational Health and Safety Act (OHSA) requirements. The following recommendations for excavations should be considered to be a supplement to, not a replacement of, the OHSA requirements. The silty clay fill and native soils observed at the site are considered to be Type 2 soils, and bedrock as Type 1 condition, as defined by the OHSA Regulations for Construction.
Reference No. 20318-T030322-A1 11
Excavations into bedrock, if required, are expected to be completed using a combination of blasting techniques or hoe ram type equipment. It is recommended that line drilling take place around the perimeter of the site to allow a relatively “clean break” and encourage a pre-determined shear face. The excavation methods must also prevent disturbance to bedrock at foundation and lowest floor level. Significant groundwater seepage within the overburden is not expected, since the site soils are fine-grained and negligible groundwater seepage was observed during the investigation. The observed groundwater level is at the top of bedrock. Seepage from excavated bedrock faces is anticipated. The anticipated volume of groundwater seepage should be minimal and readily controlled by means of conventional construction dewatering techniques, such as pumping from sumps and or ditches. Greater volumes of seepage may be encountered if excavations are conducted during wet seasonal periods.
4.6 Backfill/Permanent Drainage
Foundation wall backfill and drainage should be in accordance with the Ontario Building Code (OBC) requirements and should include free draining backfill as discussed later. The drainage system is dependant on the foundation and structure type. More specific recommendations can be provided once these details are determined. The backfill placed against foundation walls should be free draining materials, such as the OPSS Granular ‘B’ specifications up to within 0.3m of the ground surface. The upper 0.3m should be a low permeable soil to reduce surface water infiltration. The native clayey silt or silty clay soils at the site would be suitable for use as low permeable soil. Foundation backfill should be placed and compacted as outlined below: Free-draining backfill should be used for the foundation walls. Backfill should be placed and compacted in uniform lift thickness compatible with the
selected construction equipment, but not thicker than 200 mm. Backfill should not be placed in a frozen condition, or placed on a frozen subgrade. For backfill that would underlie the slabs, each lift should be uniformly compacted to at
least 100 percent of the Standard Proctor maximum dry density (SPMDD). For backfill that would underlie paved areas, each lift should be uniformly compacted to at
least 98 percent of the SPMDD.

Reference No. 20318-T030322-A1 12
For backfill that would underlie landscaped areas, each lift should be uniformly compacted to at least 95 percent of the SPMDD. Exterior grades should be sloped away from the foundation wall, and roof drainage
downspouts should be placed so that water flows away from the foundation wall.
4.7 Soil Corrositivity
Based on the results of the chemical analysis of three samples, as attached in Appendix B, the analysis samples indicate 40 to 50 ppm of water soluble sulphates or 0.004 to 0.005 percent. As per Table 3 of CSA A23.1-04 the soils present do not appear to present conditions requiring “S” class concrete mixes. Designers and NACE specialists should review the results in Appendix B for potential to corrosion of buried metal pipes and need for cathodic protection.
4.8 Pavement Sections
In order to prepare the site for the pavement area, it is recommended that the topsoil be stripped and then an evaluation be made of the subgrade by proof rolling. Proof rolling can be done by going over the site with a heavily loaded truck or a heavy pneumatic roller, and should be monitored by a geotechnical engineer or technologist from this office. Any areas where rutting or appreciable deflection are noted should be sub-excavated and replaced with suitable fill. A suitable fill may consist of any material that is free of organics and deleterious materials, accepted by a Geotechnical Engineer, be environmentally acceptable, and be at a suitable moisture condition such that compaction of at least 98% SPMDD can be achieved. The pavement sections in the following table are recommended for areas subjected to light vehicle parking lot and heavy truck traffic.

Reference No. 20318-T030322-A1 13
TABLE 4: Recommended Pavement Sections
SOIL SUBGRADE PAVEMENT LAYER LIGHT
DUTY HEAVY DUTY
HL3 Asphalt 50 mm 50 mm HL8 Asphalt n/r 50 mm Granular A (Crushed Base Course)
150 mm 150 mm
Granular B (Granular Sub-Base)
200 mm 300 mm
Pavement materials and workmanship should conform to the appropriate Ontario Provincial Standard Specifications (OPSS), OPSS 300 Series. All granular base course materials should be compacted to 100% SPMDD. Drainage of the pavement layers is important, and the surface of the subgrade and each layer of the pavement section should be provided with a suitable cross fall to prevent water from ponding on the pavement surface and beneath the pavement layers. Surface water runoff should be directed to storm sewers, or allowed to flow into ditches. Annual or regular maintenance will be required to achieve maximum life expectancy. Generally, the asphalt pavement maintenance will involve crack sealing and repair of local distress.
4.9 Underground Services
Excavations for buried utility construction should be in accordance with Section 4.5. Bedding for buried utilities should be in accordance with the following recommendations: The bedding material should comply with municipal requirements and should consist of a well-
graded granular material, such as material meeting the Granular ‘A’ specification of the Ontario Provincial Standard Specifications 802 Series (OPSS). Use of clear 19 mm stone is not recommended due to the potential for migration of silt and clay material from the surrounding soils. The bedding should be compacted to at least 95 percent of the Standard Proctor maximum dry
density, or to municipal requirements. The recommended bedding thickness should comply with OPSS 802 series.

Reference No. 20318-T030322-A1 14
Cover material should be provided as per the OPSS 802 Series over the top of pipes, to provide protection during backfilling. The cover materials should be adequately compacted to provide support (95% SPMDD) and compaction equipment must not damage the pipes. Backfill for buried utilities should be in accordance with Section 4.6.
4.10 Quality Control
The recommendations provided in this report are based on an adequate level of construction monitoring being conducted during construction of the proposed facilities. Due to the nature of the proposed development, an adequate level of construction monitoring is considered to be as follows: Prior to construction of footings, the exposed foundation subgrade should be examined by a
geotechnical engineer or a qualified technologist acting under the supervision of a geotechnical engineer, to assess whether the subgrade conditions correspond to those encountered in the boreholes, and the recommendations provided in this report have been implemented. Backfilling operations should be conducted in the presence of a qualified technologist to
ensure that proper material is employed and specified compaction is achieved. Placement of concrete reinforcement in foundations and floor slabs should be reviewed
prior to concrete placement. As well, qualified personnel should conduct testing of concrete. Field-testing should be carried out to assess compaction of each lift of the pavement layers,
accompanied by laboratory testing of the granular and asphalt materials.
5.0 LIMITATION OF THE INVESTIGATION
This report is intended solely for the named client and their consultants. The material in this report reflects our best judgement in light of the information available to Inspec-Sol Inc. at the time of preparation. No portion of this report may be used as a separate entity, it is written to be read in its entirety. Any use which a third party makes of this report, or any reliance on or decisions to be made based on it, are the responsibility of such third parties.

Reference No. 20318-T030322-A1 15
The preliminary recommendations made in this report are in accordance with our present understanding of the project. We request that we be permitted to review our recommendations when the drawings and specifications are complete. It is also important to emphasize that a soils investigation is, in fact a random sampling of a site and the comments are based on the results obtained at the locations of the borehole results only and the MASW survey line. It is, therefore, assumed that these results are representative of the subsoil conditions across the site. Should any conditions at the site be encountered which differ from those found at the test locations, we request that we be notified immediately in order to permit a reassessment of our recommendations. We trust that this report is to your satisfaction. Please do not hesitate to contact us, should any further information be required. Yours very truly, INSPEC-SOL INC.
Janice Nunney, M.Eng., P. Eng. Joseph B. Bennett, P. Eng. Manager - Kingston Vice-President Dist: 1) Mr. Dan LaLande (3), by mail
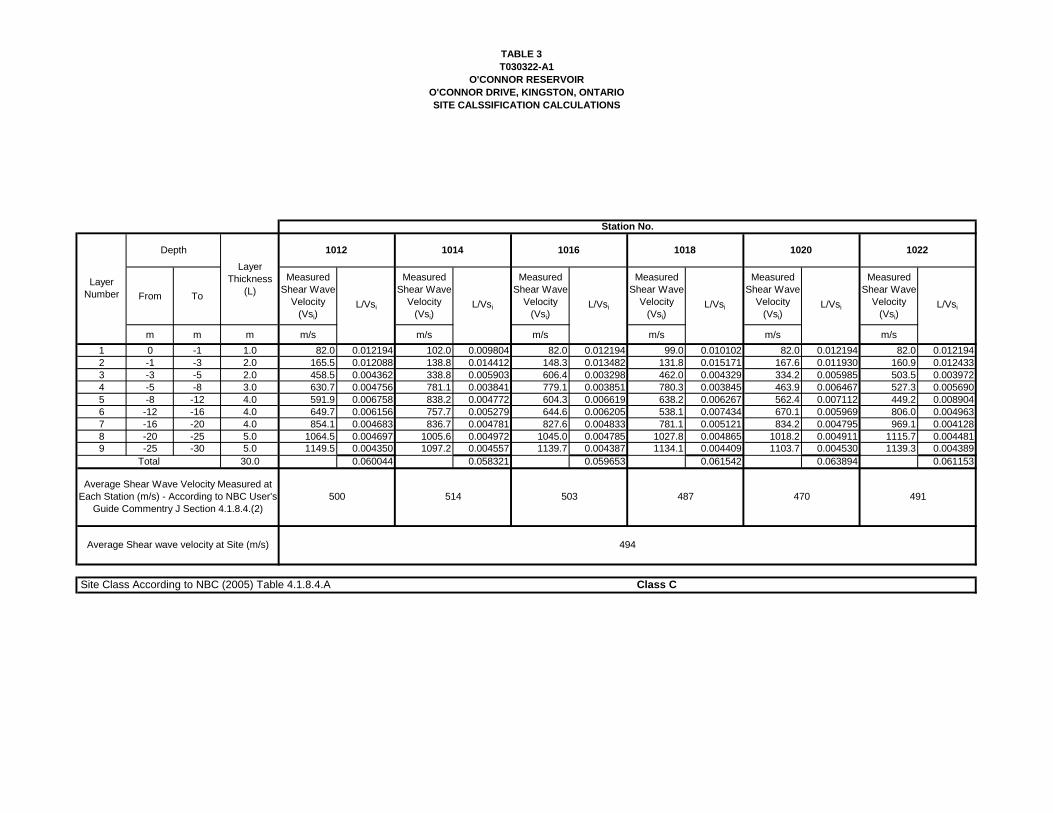
TABLE 3T030322-A1
O'CONNOR RESERVOIRO'CONNOR DRIVE, KINGSTON, ONTARIOSITE CALSSIFICATION CALCULATIONS
From To
Measured Shear Wave
Velocity (Vsi)
Measured Shear Wave
Velocity (Vsi)
Measured Shear Wave
Velocity (Vsi)
Measured Shear Wave
Velocity (Vsi)
Measured Shear Wave
Velocity (Vsi)
Measured Shear Wave
Velocity (Vsi)
m m m m/s m/s m/s m/s m/s m/s
1 0 -1 1.0 82.0 0.012194 102.0 0.009804 82.0 0.012194 99.0 0.010102 82.0 0.012194 82.0 0.0121942 -1 -3 2.0 165.5 0.012088 138.8 0.014412 148.3 0.013482 131.8 0.015171 167.6 0.011930 160.9 0.0124333 -3 -5 2.0 458.5 0.004362 338.8 0.005903 606.4 0.003298 462.0 0.004329 334.2 0.005985 503.5 0.0039724 -5 -8 3.0 630.7 0.004756 781.1 0.003841 779.1 0.003851 780.3 0.003845 463.9 0.006467 527.3 0.0056905 -8 -12 4.0 591.9 0.006758 838.2 0.004772 604.3 0.006619 638.2 0.006267 562.4 0.007112 449.2 0.0089046 -12 -16 4.0 649.7 0.006156 757.7 0.005279 644.6 0.006205 538.1 0.007434 670.1 0.005969 806.0 0.0049637 -16 -20 4.0 854.1 0.004683 836.7 0.004781 827.6 0.004833 781.1 0.005121 834.2 0.004795 969.1 0.0041288 -20 -25 5.0 1064.5 0.004697 1005.6 0.004972 1045.0 0.004785 1027.8 0.004865 1018.2 0.004911 1115.7 0.0044819 -25 -30 5.0 1149.5 0.004350 1097.2 0.004557 1139.7 0.004387 1134.1 0.004409 1103.7 0.004530 1139.3 0.004389
30.0 0.060044 0.058321 0.059653 0.061542 0.063894 0.061153
494
1012 1014 1016
L/Vsi L/Vsi L/Vsi
Depth
487
Site Class According to NBC (2005) Table 4.1.8.4.A
Layer Number
Average Shear Wave Velocity Measured at Each Station (m/s) - According to NBC User's
Guide Commentry J Section 4.1.8.4.(2)
Average Shear wave velocity at Site (m/s)
Total
514 503500
Layer Thickness
(L)
Class C
Station No.
1020
L/Vsi
470
1022
L/Vsi
491
1018
L/Vsi

D R A W I N G S
SITE LOCATION PLAN SITE PLAN
STRATIGRAPHIC SECTION INVERTED FROM MASW DATA


E N C L O S U R E S
BOREHOLE LOGS NOTES ON BOREHOLE AND TEST PIT REPORTS
CADUCEON LABORATORY RESULTS
of 1
LEGEND
ENCLOSURE No.: 1
Borehole was dry and open upon completion of drilling.
DATE (FINISH): May 14, 2008
REFERENCE No.: T030322-A1
SCALE FOR TEST RESULTS10 20 30 40 50 60 70 80 90
ELEVATION: 107.8 m
107.8
Stra
tigra
phy
Ele
vatio
n(m
)DepthBGS
0.5
1.0
1.5
2.0
2.5
3.0
3.5
4.0
4.5
5.0
5.5
6.0
6.5
7.0
7.5
SS1
107.7
106.3
Grass surface over topsoil (100mm)Fill: Silty Clay, trace sand and gravel, occasionalorganics, stiff to very stiff, moist, brown
Auger refusal at 1.5m on inferred bedrock
46
DESCRIBED BY: M. Storms
SAMPLE DATA
Org
anic
Vap
our
ppm
or %
LEL
NOTES:
13
BOREHOLE LOG
SCALE
ppm
BOREHOLE No.: BH1
Cu Shear Strength based on Field VaneCu Shear Strength based on Lab Vane
Shear Strength based onPocket Penetrometer
N Penetration Index based onDynamic Cone sample
N Penetration Index based onSplit Spoon sample
Atterberg limits (%)
SS Split Spoon
Sta
te
S Sensitivity Value of Soil
Water content (%) Water Level
RC Rock Core
Type
and
Num
ber
ST Shelby Tube
STRATIGRAPHY
DESCRIPTION OFSOIL AND BEDROCK
GROUND SURFACE
CHECKED BY: J. Nunney
DATE (START): May 14, 2008
Page: 1
PROJECT: O'Connor Reservoir
CLIENT: J.L. Richards & Associates
metres 150kPa
Pen
etra
tion
Inde
x / R
QD
Rec
over
y
% N 200kPa
LOCATION: O'Connor Dr, Kingston, ON
100kPa50kPa
BO
RE
HO
LE L
OG
- C
OLU
MN
EN
TITI
ES
T03
0322
-A1-
LOG
S.G
PJ
INS
PE
C_S
OL.
GD
T 6
/6/0
8

6.7
5.2
3.7
WL 3.45/27/2008
3.1
Backfill
Bentonite
RC6
5.2
RC7
RC5
SS4
SS3
SS2
SS1
Screenpacked in
Sand
Packed inSand
Borehole terminated at 6.7m inLimestone bedrock
Limestone Bedrock, fair toexcellent quality (RQD 74% to93%), very thinly to thinlybedded
Clayey Silt, trace sand andgravel, very stiff to hard, moist,brown, (glacial till)
Silty Clay, trace sand, mottled,stiff to very stiff, moist, brown
Fill: Silty Clay, trace sand,gravel and organics, stiff, moist,brown
Grass surface over topsoil(100mm)
99.9
103.2
103.6
106.2
104.4
98
93
74
88
21
15
10
100
100
100
96
29
25 9
CHECKED BY: J. Nunney
Cu Shear Strength based on Lab Vane
Shear Strength based onPocket Penetrometer
DATE (START): May 14, 2008
N Penetration Index based onDynamic Cone sample
N Penetration Index based onSplit Spoon sample
Atterberg limits (%)
ST Shelby Tube
Page: 1
GROUND SURFACE
DESCRIPTION OFSOIL AND BEDROCK
STRATIGRAPHY
N
CLIENT: J.L. Richards & AssociatesSS Split Spoon
Pen
etra
tion
Inde
x / R
QD
Rec
over
y
%
BO
RE
HO
LE L
OG
- C
OLU
MN
EN
TITI
ES
T03
0322
-A1-
LOG
S.G
PJ
INS
PE
C_S
OL.
GD
T 6
/6/0
8
200kPa150kPa100kPa
Cu Shear Strength based on Field Vane
metres
LOCATION: O'Connor Dr, Kingston, ON
Sta
te
PROJECT: O'Connor Reservoir
MONITORWELL
50kPa
DESCRIBED BY: M. Storms
DATE (FINISH): May 14, 2008
Borehole was dry and open upon completion of drilling. On May 27, 2008, water level at 3.43m below ground surface.
ENCLOSURE No.: 2
of 1
10 20 30 40 50 60 70 80 90ppm
REFERENCE No.: T030322-A1
Org
anic
Vap
our
ppm
or %
LEL
NOTES:
BOREHOLE No.: BH2 BOREHOLE LOG
SAMPLE DATASCALE
LEGEND
RC Rock Core
0.5
1.0
1.5
2.0
2.5
3.0
3.5
4.0
4.5
5.0
5.5
6.0
6.5
7.0
7.5
S Sensitivity Value of SoilDepthBGS
Water content (%) Water Level
Type
and
Num
ber
Ele
vatio
n(m
)
Stra
tigra
phy
106.6
ELEVATION: 106.6 m
SCALE FOR TEST RESULTS

6.9
5.3
3.6
WL 3.45/27/2008
3.0
Packed inSand
RC6
5.1
Backfill
RC7
Bentonite
RC5
SS4
SS3
SS2
SS1
Screenpacked in
Sand
107.1
Borehole terminated at 6.8m
Limestone Bedrock, goodquality (RQD 75% to 88%), verythinly to thinly bedded
Silty Clay, trace sand androotlets, very stiff, brown
Silty Clay, trace sand androotlets, very stiff, dark brown
Fill: Silty Clay, trace sand,gravel and organics, stiff to verystiff, moist, brown to dark brown
Grass surface over topsoil(100mm)
100.6
104.2
105.4
104.8
100 88
86
75
R
15
10
98
98
33
30
29
12
CHECKED BY: J. Nunney
DATE (START): May 14, 2008
Shear Strength based onPocket Penetrometer
Page: 1
N Penetration Index based onDynamic Cone sample
N Penetration Index based onSplit Spoon sample
Atterberg limits (%)
ST Shelby Tube
SS Split Spoon
Cu Shear Strength based on Field Vane
GROUND SURFACE
DESCRIPTION OFSOIL AND BEDROCK
STRATIGRAPHY
N
CLIENT: J.L. Richards & Associates
Pen
etra
tion
Inde
x / R
QD
Rec
over
y
%
BO
RE
HO
LE L
OG
- C
OLU
MN
EN
TITI
ES
T03
0322
-A1-
LOG
S.G
PJ
INS
PE
C_S
OL.
GD
T 6
/6/0
8
200kPa150kPa100kPa
Cu Shear Strength based on Lab Vane
metres
Sta
te
LOCATION: O'Connor Dr, Kingston, ON
MONITORWELL
PROJECT: O'Connor Reservoir
50kPa
DESCRIBED BY: M. Storms
DATE (FINISH): May 14, 2008
Borehole was dry and open upon completion of drilling. On May 27, 2008 water level at 3.37m below ground surface.
ENCLOSURE No.: 3
of 1
10 20 30 40 50 60 70 80 90ppm
REFERENCE No.: T030322-A1
Org
anic
Vap
our
ppm
or %
LEL
NOTES:
BOREHOLE No.: BH3 BOREHOLE LOG
SAMPLE DATASCALE
LEGEND
S Sensitivity Value of Soil
Water content (%) Water Level
0.5
1.0
1.5
2.0
2.5
3.0
3.5
4.0
4.5
5.0
5.5
6.0
6.5
7.0
7.5
RC Rock Core
DepthBGS
Type
and
Num
ber
Ele
vatio
n(m
)
Stra
tigra
phy
107.5
ELEVATION: 107.5 m
SCALE FOR TEST RESULTS

SS4
BOREHOLE LOG
SAMPLE DATASCALE
SS5
NOTES:
SS3
SS2
SS1
DATE (FINISH): May 14, 2008
Borehole was dry and open upon completion of drilling.
BOREHOLE No.: BH4
R
LEGEND
DESCRIBED BY: M. Storms
ppm
REFERENCE No.: T030322-A1
Org
anic
Vap
our
ppm
or %
LEL
Grass surface over topsoil (100mm)
101.3
101.9
103.5
106.1
Silty Clay, trace rootlets, stiff, moist, dark brown
Inferred bedrock, weathered
9
9
7
7
0
42
25
Fill: Silty Clay, trace sand and gravel, occasionalorganics, firm to stiff, moist, brown
8
ENCLOSURE No.: 4
Auger refusal at 5.2m on inferred bedrock
25
of 1
Water content (%)
BO
RE
HO
LE L
OG
- C
OLU
MN
EN
TITI
ES
T03
0322
-A1-
LOG
S.G
PJ
INS
PE
C_S
OL.
GD
T 6
/6/0
8
200kPa%
Rec
over
y
100kPa50kPa
SS Split Spoon
150kPa
ST Shelby Tube
Atterberg limits (%)N Penetration Index based on
Split Spoon sampleN Penetration Index based on
Dynamic Cone sample
Shear Strength based onPocket Penetrometer
Cu Shear Strength based on Lab VaneCu Shear Strength based on Field Vane
S Sensitivity Value of SoilSta
te
N
Pen
etra
tion
Inde
x / R
QD
Ele
vatio
n(m
)CLIENT: J.L. Richards & Associates
metres
0.5
1.0
1.5
2.0
2.5
3.0
3.5
4.0
4.5
5.0
5.5
6.0
6.5
7.0
7.5
STRATIGRAPHY
Stra
tigra
phy
106.5
ELEVATION: 106.5 m
10 20 30 40 50 60 70 80 90
SCALE FOR TEST RESULTS
DepthBGS
PROJECT: O'Connor Reservoir
Water Level
RC Rock Core
Type
and
Num
ber
LOCATION: O'Connor Dr, Kingston, ON
Page: 1
DATE (START): May 14, 2008
CHECKED BY: J. Nunney
GROUND SURFACE
DESCRIPTION OFSOIL AND BEDROCK

SS3
BOREHOLE LOG
SAMPLE DATASCALE
SS4
NOTES:
SS2
SS1
20
ENCLOSURE No.: 5
DATE (FINISH): May 14, 2008
Borehole was dry and open upon completion of drilling.
BOREHOLE No.: BH5
16
of 1
DESCRIBED BY: M. Storms
ppm
REFERENCE No.: T030322-A1
Org
anic
Vap
our
ppm
or %
LEL
102.6
103.0
103.5
105.2
106.2
6
firm
100
21
38
Grass surface over topsoil (100mm)
Fill: Silty Clay, trace sand, very stiff, moist, brown, graveland topsoil inclusions
Auger refusal at 4.0m on inferred bedrock
trace sand lense
Silty Clay, very stiff to hard, moist, brown
7
LEGEND
Rec
over
y
%
BO
RE
HO
LE L
OG
- C
OLU
MN
EN
TITI
ES
T03
0322
-A1-
LOG
S.G
PJ
INS
PE
C_S
OL.
GD
T 6
/6/0
8
200kPa150kPa50kPaN 100kPa
Cu Shear Strength based on Field Vane
SS Split Spoon
ST Shelby Tube
Atterberg limits (%)N Penetration Index based on
Split Spoon sampleN Penetration Index based on
Dynamic Cone sample
Cu Shear Strength based on Lab Vane
Pen
etra
tion
Inde
x / R
QD
Sta
te
Shear Strength based onPocket Penetrometer
metres
0.5
1.0
1.5
2.0
2.5
3.0
3.5
4.0
4.5
5.0
5.5
6.0
6.5
7.0
7.5
DepthBGS
Ele
vatio
n(m
)
Stra
tigra
phy
106.6
ELEVATION: 106.6 m
10 20 30 40 50 60 70 80 90
SCALE FOR TEST RESULTS
PROJECT: O'Connor Reservoir
Water content (%) Water Level
RC Rock Core
CLIENT: J.L. Richards & Associates
LOCATION: O'Connor Dr, Kingston, ON
S Sensitivity Value of Soil
Page: 1
DATE (START): May 14, 2008
CHECKED BY: J. Nunney
GROUND SURFACE
DESCRIPTION OFSOIL AND BEDROCK
STRATIGRAPHY
Type
and
Num
ber

CLASSIFICATION
1 - 10%10 - 20%20 - 35%35 - 50%
silt
< 2525 - 5050 - 7575 - 90> 90
0 - 44 - 1010 - 3030 - 50> 50
< 250250 - 500500 - 10001000 - 20002000 - 4000
> 4000
< 1212 - 2525 - 50
50 - 100100 - 200
> 200
0,075 to 0,425mm0,425mm to 2,0mm
2,0 to 4,75mm
4,75mm to 19mm19 to 75mm
< 0,002mm0,002 to 0,075mm
0,075 to 4,75mm
4,75 to 75mm
75 to 300mm> 300mm
C
SOIL DESCRIPTION:Each subsoil stratum is described using the following terminology. The relative density of granular soils is determined by the standardpenetration index ("N" value), while the consistency of clayey soils is measured by the value of the undrained shear strength (Cu).
"traces""some"adjective (silty, sandy)"and"
RELATIVE DENSITY OFGRANULAR SOILS
(BLOWS/ft - 300mm)
ClaySiltSand
Gravel
CobblesBoulders
Very looseLooseCompactDenseVery dense
Very softSoftMediumStiffVery stiffHard
UNDRAINED SHEARSTRENGTH (Cu)
(P.S.F.) (kPa)
ROCK QUALITY DESIGNATION
"RQD" (%) VALUE QUALIFICATIVE
SAMPLES:TYPE AND NUMBER
ST: Shelby tubePS: Piston sample (Osterberg)
The type of sample recovered is shown on the log by the abbreviation listed hereafter. The numbering of samples is sequential for each typeof sample.
RQD
RECOVERYThe recovery, shown as a percentage, is the ratio of length of the sample obtained to the distance the sampler was driven/pushed into thesoil.
N: Standard penetration indexR: Refusal to penetration
LABORATORY TESTS:Ip: Plasticity indexWl: Liquid limitWp: Plastic limit
A: Atterberg limitsw: Water contentg: Unit weight CHEM: Chemical analysis
CS: Swedish fall coneC: Consolidation O.V.: Organic vapor
PS-020.01/IA/06-05
sand gravel
clay
Bedrock(limestone)
fill
cobbles &boulders
CONSISTANCY OFCOHESIVE SOILS
TERMINOLOGY
very poorpoorfairgoodexcellent
The "Rock Quality Designation" or "RQD" value, expressed as a percentage, is the ratio of the total length of all core fragments of 4 inches(10cm) or more to the total length of the run.
IN-SITU TESTS:
SS: Split spoonSSE, GSE, AGE: Environnemental sampling
NOTES ON BOREHOLEAND TEST PIT REPORTS
(UNIFIED SYSTEM)
AG: AugerRC: Rock coreGS: Grab sample
k: PermeabilityABS: Absorption (Packer test)
STANDARD PENETRATIONINDEX "N" VALUE
STRATIGRAPHIC LEGEND
organic soil
N : Dynamic cone penetration indexCu: Undrained shear strengthPr: Pressuremeter
H: Hydrometer analysisGSA: Grain size analysis
finemediumcoarse
finecoarse

PS-020.02/IA / 06-05
PROCEDURES FOR IN-SITU TESTING
IN GEOTECHNICS A- Soil Sampling
Soil samples are normally recovered with a split-spoon sampler or a thin-walled Shelby tube. The split spoon is dynamically driven into the ground and takes a remoulded sample of the soil found at depth. A standard penetration test is thereby obtained, and is described in the following paragraph. The Shelby tube is pushed into the ground to obtain undisturbed samples of clay or clayey soils. Rock samples are obtained by drilling a core barrel into the rock formation; the diameter of the recovered sample varies with the size of the drilling bit used.
B- Standard Penetration Test (SPT)
A standard penetration test consists of driving a standard split-spoon sampler into the soil be dropping a 140 lb. weight (63.5 kg) from a height of 30 inches (76 cm). The sampler is driven 18 inches (45 cm) into the soil and the number of blows of the drop weight is recorded for every 6 inches (15 cm) of penetration. The total number of blows for the last 12 inches (30 cm) of penetration is the standard penetration index ("N" value). This value obtained at regular intervals provides vital information from which the density, compressibility and bearing capacity of the various soil horizons can be estimated. The test is however seldom used in clayey soils.
C- Dynamic Penetration Test
A dynamic penetration test (or cone penetration test) is similar to a standard penetration test with the difference that the split-spoon sampler is replaced by a conical point 10 cm2 in area. The number of blows is recorded continuously for every foot of penetration (30 cm) thus obtaining a systematic indication of the relative density of the materials encountered at depth. This test also helps in determining the depth to a dense soil horizon or bedrock.
Note: The presence of large gravel, cobbles or boulders in the subsoil may distort the results of both the standard penetration test
and the dynamic penetration test by giving abnormally high resistance values. When it becomes impossible to drive the cone deeper a refusal ("R") is then recorded.
D- Shear Test
An undrained shear test may be carried out by pushing into the undisturbed soil a vane shear apparatus consisting of a four-bladed vane connected to a rod and by measuring the torque value required to shear the clay. This test may be repeated at regular intervals and the torque values calculated to obtain the undrained shear strength of the clay at each test level. The shear strength profiles permit the calculation of the allowable bearing capacity of the clay. The apparatus used is the "Nilcon" of Scandinavian origin.
E- Permeability Test (Lefranc)
This test consists of determining the coefficient of permeability K of the soil around a permeable lens of known dimensions and which has been formed below the driving shoe. The procedure used is the falling head method. Tests of the Lefranc type are carried out in soils with average granulometry and average permeability.
F- Packer Test
This test is conducted in bedrock by sealing off a section of the borehole with one or two inflatable rubber packers and then pumping water into the isolated section of the hole. The permeability of the rock adjacent to the isolated section of the borehole is measured as a function of the pumping head (pressure) and rate of water loss (absorption) from the sealed-off section over a fixed period of time.
G- Menard Pressuremeter Test
The pressuremeter test developed by Menard (1956) consists of laterally loading the sidewalls of a borehole by dilating a cylindrical probe. The test permits the determination of the modulus EM and the limit pressure pl, which are a measure of the strength of the soil, and enables the calculation of the bearing capacity and settlements for foundations.

O'Connor Reservoir
29-May-08DATE REPORTED:
Caduceon Environmental Laboratories
613-544-2770
285 Dalton Ave Kingston, Ontario, K7K 6Z1
613-544-2001Tel:Fax:
JOB/PROJECT NO.:
Final ReportREPORT No. B08-15444
Inspec-Sol9-626 Cataraqui Woods Dr. Kingston , ON , K7P 1T8
Report To:
Attention: Janice Nunney
21-May-08DATE RECEIVED:
T030322-AlP.O. NUMBER:
WATERWORKS NO.SoilSAMPLE MATRIX:
C.O.C.: 118287
CERTIFICATE OF ANALYSIS
Parameter Units M.D.L.Reference
MethodDate/Site Analyzed
BH 2 SS3 BH 4 SS3 BH 5 SS3Client I.D.:B08-15444-1 B08-15444-2 B08-15444-3Sample I.D.:14-May-08 14-May-08 14-May-08Date Collected:
pH 6.90 7.49 7.24pH Units SM4300H+ 26-May-08/KResistivity 4130 2640 1960ohms·cm 1 SM2513 26-May-08/KChloride 9 13 10µg/g 0.1 SM4110 29-May-08/KSulphate 50 40 40µg/g 1 SM4110 29-May-08/K
Page 1 of 1.
Michelle Dubien Lab Supervisor
Accredited by the Standards Council of Canada and CAEAL for specific tests.The analytical results reported herein refer to the samples as received. Reproduction of this analytical report in full or in part is prohibited without prior written consent from
Caduceon Environmental Laboratories.
M.D.L. = Method Detection LimitLab Supervisor
Michelle Dubien
Site Analyzed=K-Kingston,W-Windsor,O-Ottawa,P-Peterborough,M-Moncton