UT to Billy’s Creek Stream Restoration Final 2006 ...
50
UT to Billy’s Creek Stream Restoration Final 2006 Monitoring Report Monitoring Year One Ecosystem Enhancement Program Project Number 36 Submitted to: NCDENR-Ecosystem Enhancement Program 1652 Mail Service Center Raleigh, NC 27699-1652 Prepared by: URS Corporation – North Carolina 1600 Perimeter Park Drive, Suite 400 Morrisville, NC 27560 Project Designed by: URS Corporation – North Carolina 1600 Perimeter Park Drive, Suite 400 Morrisville, NC 27560 Submitted: January 19, 2007
Transcript of UT to Billy’s Creek Stream Restoration Final 2006 ...

UT to Billy’s Creek Stream Restoration
Final 2006 Monitoring Report
Monitoring Year One
Ecosystem Enhancement Program Project Number 36
Submitted to: NCDENR-Ecosystem Enhancement Program
1652 Mail Service Center
Raleigh, NC 27699-1652
Prepared by: URS Corporation – North Carolina
1600 Perimeter Park Drive, Suite 400
Morrisville, NC 27560
Project Designed by: URS Corporation – North Carolina
1600 Perimeter Park Drive, Suite 400
Morrisville, NC 27560
Submitted: January 19, 2007
36 – UT to Billy’s Creek – MY1 Final Report URS 1/07
i
TABLE OF CONTENTS
1.0 EXECUTIVE SUMMARY/PROJECT ABSTRACT .................................................................... 1
2.0 PROJECT BACKGROUND............................................................................................................ 2
2.1 LOCATION AND SETTING ................................................................................................... 2
2.2 MITIGATION STRUCTURE AND OBJECTIVES ................................................................ 4
2.3 PROJECT HISTORY AND BACKGROUND......................................................................... 4
2.4 MONITORING PLAN VIEW .................................................................................................. 6
3.0 PROJECT CONDITION AND MONITORING RESULTS ........................................................ 9
3.1 VEGETATION ASSESSMENT............................................................................................... 9
3.1.1 Soil Data ....................................................................................................................... 9
3.1.2 Vegetative Problem Areas............................................................................................ 9
3.1.3 Vegetative Problem Areas Plan View ........................................................................ 10
3.1.4 Stem Counts ............................................................................................................... 10
3.1.5 Vegetation Plot Photos ............................................................................................... 10
3.2 STREAM ASSESSMENT ...................................................................................................... 11
3.2.1 Procedural Items......................................................................................................... 11
3.2.1.1 Morphometric Criteria........................................................................................ 11
3.2.1.2 Hydrologic Criteria............................................................................................. 11
3.2.1.3 Bank Stability Assessments................................................................................ 11
3.2.2 Problem Areas Plan View .......................................................................................... 11
3.2.3 Problem Areas Table Summary.................................................................................. 11
3.2.4 Numbered Issues Photo Section ................................................................................. 11
3.2.5 Fixed Photo Station Photos ........................................................................................ 12
3.2.6 Stability Assessment................................................................................................... 12
3.2.7 Quantitative Measures Tables (Morphology and Hydrology).................................... 12
4.0 METHODOLOGY SECTION....................................................................................................... 17
4.1 STREAM METHODOLOGY................................................................................................. 17
4.2 VEGETATION METHODOLOGY ....................................................................................... 17
5.0 REFERENCES................................................................................................................................ 18
FIGURES
Figure 1. Project Vicinity...…………………………………………………...…………….………..3
Figure 2. Monitoring Plan View...…………………………………………………………….....…..7
Figure 3. Vegetation Problem Areas Plan View...……………………………….……Appendix A-II
Figure 4. Stream Problem Areas Plan View…………………………………….…..…Appendix B-I
TABLES
Table I. Project Mitigation Structure and Objectives Table……………………………..……....…4
Table II. Project Activity and Reporting History………………………………………….………...5
Table III. Project Contact Table…………………………………………………………..……....….5
Table IV. Project Background Table…………………………………………………..…………..…6
Table V. Preliminary Soil Data……………………………………………………………………...9
Table VI. BEHI and Sediment Export Estimates……………………………………….…….…….11
Table VII. Categorical Stream Feature Visual Stability Assessment…………………………..……12

36 – UT to Billy’s Creek – MY1 Final Report URS 1/07
ii
Table VIII. Baseline Morphology and Hydraulic Summary……………….……………………..….13
Table IXa. Morphology and Hydraulic Monitoring Summary…………….…………………..….…15
Table IXb. Morphology and Hydraulic Monitoring Summary……………………………..………..16
Table AI. Vegetative Problem Areas……………………………………..……….……Appendix A-I
Table AII. Stem Counts for Each Species Arranged by Plot…………...…….…………Appendix A-I
Table B1. Stream Problem Areas…………………………………………..….……….Appendix B-II
Table BII. Qualitative Visual Morphological Stability Assessment……………...……Appendix B-V
APPENDICES
Appendix A Vegetation Raw Data
I. Vegetation Data Tables
II. Vegetation Problem Areas Plan View
III. Vegetation Problem Area Photos
IV. Vegetation Monitoring Plot Photos
Appendix B Geomorphic Raw Data
I. Stream Problem Areas Plan View
II. Stream Problem Areas Table
III. Representative Stream Problem Area Photos
IV. Stream Photo Station Photos
V. Qualitative Visual Stability Assessment
VI. Annual Overlays of Cross Section Plots
VII. Annual Overlay of Longitudinal Plots
VIII. Pebble Count Frequency Distribution Plots

36 – UT to Billy’s Creek – MY1 Final Report URS 1/07
1
1.0 EXECUTIVE SUMMARY/PROJECT ABSTRACT
URS Corporation – North Carolina (URS) was retained by the North Carolina Ecosystem Enhancement
Program (EEP) to conduct Year One Monitoring at the Unnamed Tributary (UT) to Billy’s Creek Stream
Restoration Project, located northeast of Franklinton in Franklin County, North Carolina. The UT to
Billy’s Creek Stream Restoration Project (hereafter referred to as ‘site’) was designed by URS and
constructed by McQueen Construction, Inc. Construction began on March 16, 2005 and ended on June 8,
2005. Planting began December 6, 2005 and ended on December 19, 2005. Year One Monitoring was
conducted on September 6, 2006.
The project reach is located northeast of Franklinton in a sparsely developed agricultural watershed. The
majority of the agricultural lands are used for cattle pasture. Pre-construction conditions of the UT to
Billy’s Creek included a 1,878 linear foot section of degraded, perennial channel and several ditch-like
tributaries. The upstream portions of the project reach retained an active floodplain area, whereas the
downstream portions were severely incised (4 to 6 feet).
The restoration of the UT to Billy’s Creek was conducted as a Priority I restoration by returning the
channel to an elevation such that the historic floodplain is utilized for above bankfull flows. The
proposed stream classification for the project reach was a meandering E5 channel, with a total length of
2,101 linear feet. Approximately 2.6 acres of buffer were planted along the restored stream channel. A
6.2 acre conservation easement was established on the site.
Overall, the site was observed to be functioning well. Instream structures appeared to be stable, and the
stream has maintained a defined channel. The most notable problem observed was the accumulation of
sediment within the first 100 feet of the project reach. The sediment accumulation is most likely the
result of a 50-year storm event associated with Tropical Storm Alberto that occurred during June of this
year (2006). The Year One Monitoring channel length is 2,025 linear feet.
Storm flows also affected much of the vegetation along the project reach. The strength of the flow had
negative effects on many of the smaller stems planted along the streambank and floodplain. Moreover, the
presence of cattle within the conservation easement after the storm exacerbated vegetation problems along
the project reach. Vegetation weakened by the storm was then trampled and grazed by cattle that entered the
easement through a disabled fence. Cattle trails are present along the entire project reach, on both sides of the
channel. Bare banks and floodplains exist throughout the site, but are concentrated in the downstream
portion.
The planted woody vegetation is doing fair. The strong storm event coupled with the presence of cattle
shortly after planting has negatively impacted the planted individuals. Conditions are expected to improve in
the coming years, assuming cattle remain outside the easement.
Several small Chinese privet (Ligustrum sinense) plants were noted within the conservation easement.
Eradication methods were used to remove privet from the site prior to planting, but seed sources still exist
outside the conservation easement boundary. While these individuals do not constitute a problem area at this
time, the presence and abundance of the species should be monitored.
Recommendations for UT to Billy's Creek include the following: 1) work with land owner and NRCS to
ensure cattle exclusion (e.g. existing wires tightened, additional strands added, bring fence on-line or "live"),
2) treat exotic stems (e.g. privet), and 3) allow time for vegetation to mature and bankfull events to work
sediment through system. Overall, the site is functioning well as above bankfull events are accessing the
floodplain, pools are maintaining, and the pattern is maintaining. Vegetation has been stressed; however,
planted species are present and should continue to mature.
36 – UT to Billy’s Creek – MY1 Final Report URS 1/07
2
2.0 PROJECT BACKGROUND
2.1 LOCATION AND SETTING
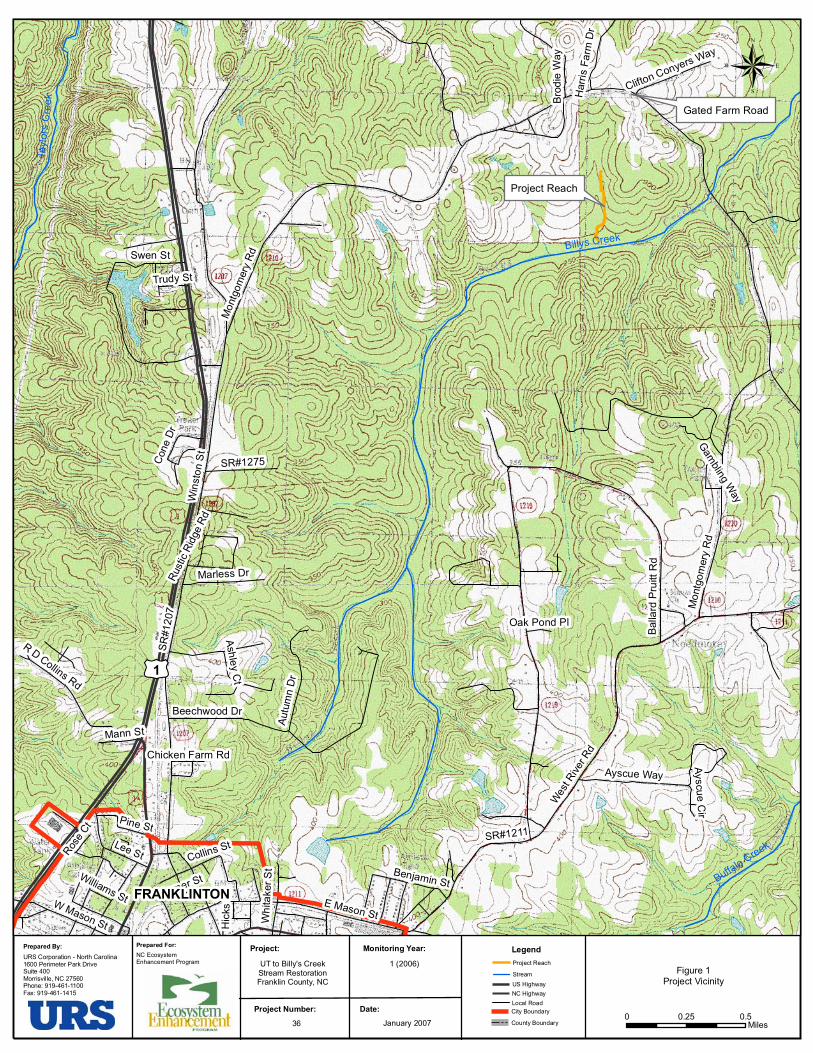
The UT to Billy’s Creek Stream Restoration Project is located northeast of Franklinton in an agricultural
and low density residential watershed (Figure 1). A ridge approximately 800 feet north of Montgomery
Road forms the northern boundary of the project watershed. Montgomery Road runs east-west through
the northern third of the watershed. The watershed is roughly divided in half by the unpaved farm road
that crosses east-west at the northern end of the project reach. Ridges from the northernmost point form
the watershed’s western and eastern edges as they slope down towards Billy’s Creek. The southern end
of the project watershed is at the point where an unpaved farm road crosses the project reach
approximately 300 feet upstream of the confluence with Billy’s Creek.
To travel to the site from the Raleigh-area, take US-1 North towards Franklinton. Turn right on SR 1210
(Montgomery Road). The project reach is located south of Montgomery Road, approximately three miles
east of US 1 to the northeast of Franklinton on property privately held by the Grove family.
UT to Billy's CreekStream RestorationFranklin County, NC
Project:
1 (2006)
Monitoring Year:
Project Number:
36
Prepared For:
NC EcosystemEnhancement Program
URS Corporation - North Carolina1600 Perimeter Park DriveSuite 400Morrisville, NC 27560Phone: 919-461-1100Fax: 919-461-1415
Prepared By:
0 0.50.25Miles
Figure 1Project Vicinity
E Mason St
Swen St
AutumnDr
Ayscue Way
Beechwood Dr
Pine St
BrodieWay
WMason St
Marless Dr
Lee St
WhitakerSt
Collins
St
HarrisFarmDr
Joyner
St
AyscueCir
Clifton
Conye
rs Way
ConeDr
AshleyCt
Trudy St
RoseCt
RusticRidgeRd
Williams St
HicksSt
Benjamin St
Oak Pond Pl
GamblingWayW
instonSt
MontgomeryRd
WestRiverRd
BallardPruittRd
SR#1207
SR#1211
SR#1275
RDCollins
Rd
Mann St
Chicken Farm Rd
MontgomeryRd
£¤1
Billys Creek
TaylorsCreek
BuffaloCreek
®
FRANKLINTON
Project Reach
Date:
January 2007
Gated Farm Road
Legend
Project Reach
Stream
NC Highway
US Highway
City Boundary
County Boundary
Local Road

36 – UT to Billy’s Creek – MY1 Final Report URS 1/07
4
2.2 MITIGATION STRUCTURE AND OBJECTIVES
The project reach is located northeast of Franklinton in a sparsely developed agricultural watershed. The
majority of the agricultural lands are used for cattle pasture. Pre-construction conditions of the UT to
Billy’s Creek included a 1,878 linear foot section of degraded, perennial channel and several ditch-like
tributaries. The upstream portions of the project reach retained an active floodplain area, whereas the
downstream portions were severely incised (4 to 6 feet).
The goals and objectives of the UT to Billy’s Creek Stream Restoration Project were listed in the 2006
Final Mitigation As-Built Report (URS 2006) as:
1. Restore the project reach to a more natural dimension, pattern, and profile so that the stream
will be able to efficiently transport water and sediment loads provided by the watershed;
2. Reconnect the project reach’s channel to its historic floodplain where feasible;
3. Eliminate the excessive sediment contribution to the system by the mass wasting and erosion of
the stream banks along the project reach; and
4. Repair and restore the riparian corridor along the project reach in order to improve habitat and
protect the stream from further erosion.
The restoration of the UT to Billy’s Creek was conducted as a Priority I restoration by returning the
channel to an elevation such that the historic floodplain is utilized for above-bankfull flows. Rock cross
vanes, step pools, rootwads, and plantings were installed to establish and stabilize a profile with riffle and
pool sequences and to provide habitat and stable streambanks. Plantings included live stakes on the
floodplain as well as bare roots throughout the conservation easement.
Table I. Project Mitigation Structure and Objectives Table
UT to Billy’s Creek
EEP Project Number 36
Pro
ject
Seg
men
t o
r
Rea
ch I
D
Mit
iga
tio
n
Ty
pe
Ap
pro
ach
Lin
ear
Fo
ota
ge
Sta
tio
nin
g
Comment
UT to Billy’s Creek R PI
1,878
Pre-resotration
10+00 to
31+30
Includes 2,101 linear feet
per As-Built
R= Restoration PI= Priority I
EI= Enhancement I PII= Priority II
EII= Enhancement II PIII= Priority III
S= Stabilization SS= Stream Bank Stabilization
2.3 PROJECT HISTORY AND BACKGROUND
The UT to Billy’s Creek Stream Restoration was completed in the summer of 2005 and planted in the
winter of 2005. The site was originally secured by the NC Wetlands Restoration Program. The Stream
Restoration Plan was submitted by URS in 2003. The project reach is located on a cattle farm. The
project reach is framed by 30-inch diameter culverts under unpaved farm roads at the north and south
ends and pastured slopes to the east and west. There is at least one intermittent and four or more
ephemeral tributary channels that flow into the project reach. Historically, the ephemeral channels were

36 – UT to Billy’s Creek – MY1 Final Report URS 1/07
5
created to provide drainage within the floodplain. Approximately 600 feet south of the northern end of
the project, the stream ran through an area of fairly active floodplain. Here, wetlands developed in the
relict channels and floodplain adjacent to the main channel. Downstream of the wetland areas, severe
incision (4 to 6 feet) and erosion was occurring following a major grade control point. Downstream of
the grade control, the floodplain and stream system had been modified by the landowner.
Table II. Project Activity and Reporting History
UT to Billy’s Creek
EEP Project Number 36
Activity or Report Scheduled
Completion
Data Collection
Complete
Actual
Completion or
Delivery
Restoration Plan April 15, 2003 NA August 2003
Final Design May 31, 2003 NA August 11, 2004
Construction July 31, 2003 NA June 2005
Planting Fall 2004 NA December 2005
As-Built Report Fall 2005 January 2006 April 2006
Year 1 Monitoring September 2006 September 2006 January 2007
Year 2 Monitoring Fall 2007 -- --
Year 3 Monitoring Fall 2008 -- --
Year 4 Monitoring Fall 2009 -- --
Year 5 Monitoring Fall 2010 -- --
Year + Monitoring Not scheduled -- Not scheduled
Table III. Project Contact Table
UT to Billy’s Creek
EEP Project Number 36
Designer
Primary project design POC
URS Corporation – North Carolina
1600 Perimeter Park Drive, Suite 400
Morrisville, NC 27560
Kathleen McKeithan 919-461-1597
Construction Contractor
Construction contractor POC
McQueen Construction Inc.
619 Patrick Road
Bahama, NC 27503
Harvey McQueen 919-479-4766
Planting Contractor
Planting contractor POC
Carolina Environmental
PO Box 1905
Mt. Airy, NC 27030
Joanne Chetham 336-320-3849
Seeding and Matting Contractor
Seeding contractor POC
Erosion Control Solutions
5508 Peakton Road
Raleigh, NC 27604
N/A – Contact Construction Contractor
Monitoring Performers URS Corporation – North Carolina
1600 Perimeter Park Drive, Suite 400
Morrisville, NC 27560
Stream Monitoring POC – Kathleen McKeithan 919-461-1597
Vegetation Monitoring POC – Susan Shelingoski 919-461-1311

36 – UT to Billy’s Creek – MY1 Final Report URS 1/07
6
Table IV. Project Background Table
UT to Billy’s Creek
EEP Project Number 36
Project County Franklin County
Drainage Area 0.22 square miles
Drainage impervious cover estimate (%) Estimated at < 10%
Stream Order 1st
Physiographic Region Piedmont
Ecoregion Northern Outer Piedmont (45f)
Rosgen Classification of As-Built E5
Dominant soil types Chewacla, Altavista
Reference site ID Unknown
USGS HUC for Project and Reference 03020101
NCDWQ Sub-basin for Project and Reference 03-03-01
NCDWQ classification for Project and Reference WS-IV; NSW
Any portion of any project segment 303d listed? No
Any portion of any project segment upstream of a
303d listed segment?
No
Reasons for 303d listing or stressor N/A
% of project easement fenced 100
2.4 MONITORING PLAN VIEW
See Monitoring Plan View Sheets (2).


36 – UT to Billy’s Creek – MY1 Final Report URS 1/07
9
3.0 PROJECT CONDITION AND MONITORING RESULTS
3.1 VEGETATION ASSESSMENT
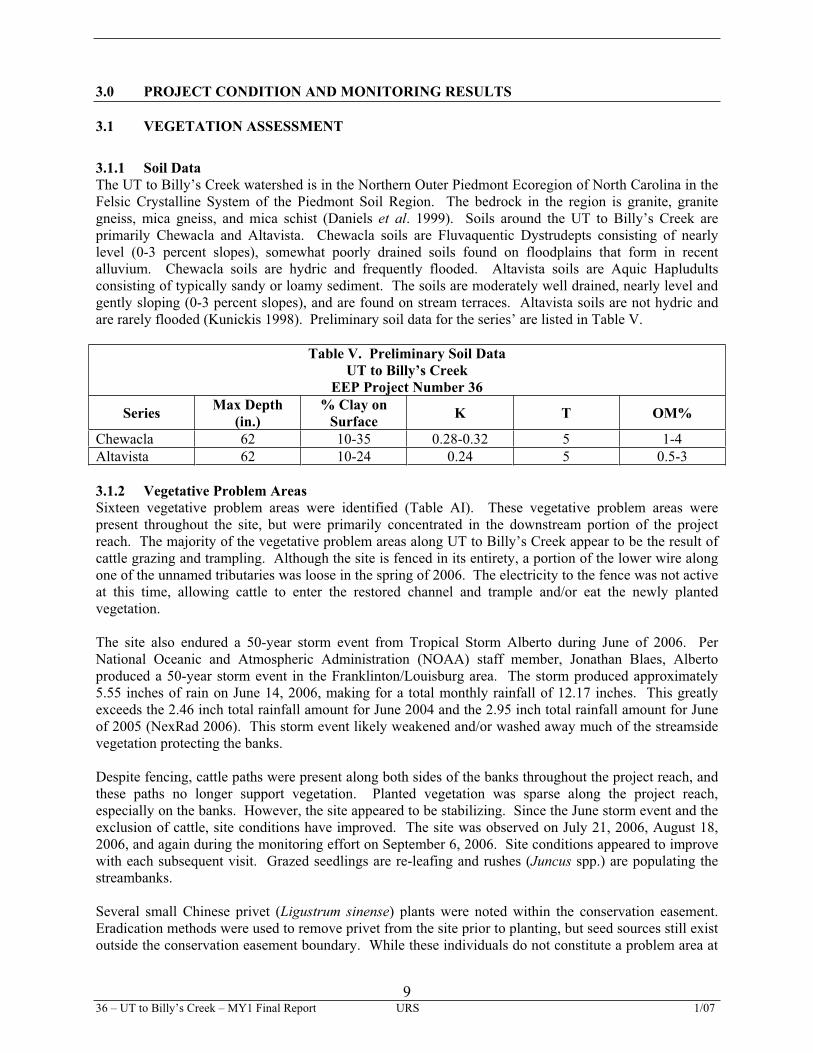
3.1.1 Soil Data
The UT to Billy’s Creek watershed is in the Northern Outer Piedmont Ecoregion of North Carolina in the
Felsic Crystalline System of the Piedmont Soil Region. The bedrock in the region is granite, granite
gneiss, mica gneiss, and mica schist (Daniels et al. 1999). Soils around the UT to Billy’s Creek are
primarily Chewacla and Altavista. Chewacla soils are Fluvaquentic Dystrudepts consisting of nearly
level (0-3 percent slopes), somewhat poorly drained soils found on floodplains that form in recent
alluvium. Chewacla soils are hydric and frequently flooded. Altavista soils are Aquic Hapludults
consisting of typically sandy or loamy sediment. The soils are moderately well drained, nearly level and
gently sloping (0-3 percent slopes), and are found on stream terraces. Altavista soils are not hydric and
are rarely flooded (Kunickis 1998). Preliminary soil data for the series’ are listed in Table V.
Table V. Preliminary Soil Data
UT to Billy’s Creek
EEP Project Number 36
SeriesMax Depth
(in.)
% Clay on
SurfaceK T OM%
Chewacla 62 10-35 0.28-0.32 5 1-4
Altavista 62 10-24 0.24 5 0.5-3
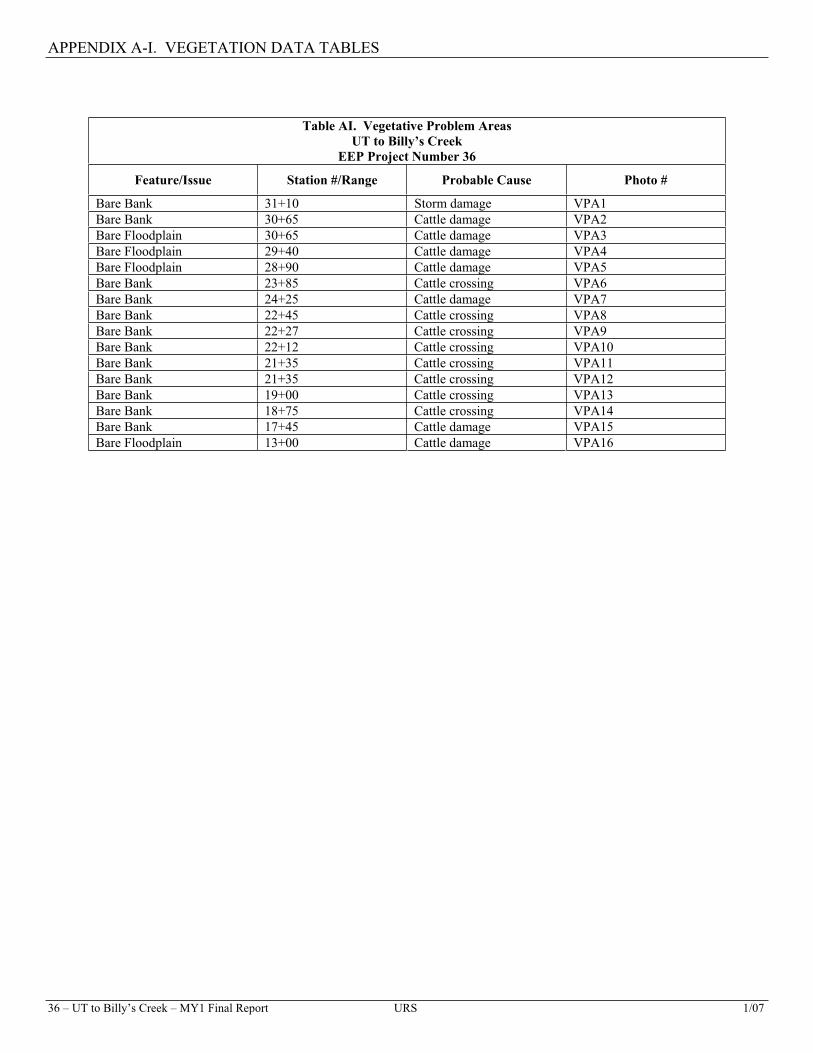
3.1.2 Vegetative Problem Areas
Sixteen vegetative problem areas were identified (Table AI). These vegetative problem areas were
present throughout the site, but were primarily concentrated in the downstream portion of the project
reach. The majority of the vegetative problem areas along UT to Billy’s Creek appear to be the result of
cattle grazing and trampling. Although the site is fenced in its entirety, a portion of the lower wire along
one of the unnamed tributaries was loose in the spring of 2006. The electricity to the fence was not active
at this time, allowing cattle to enter the restored channel and trample and/or eat the newly planted
vegetation.
The site also endured a 50-year storm event from Tropical Storm Alberto during June of 2006. Per
National Oceanic and Atmospheric Administration (NOAA) staff member, Jonathan Blaes, Alberto
produced a 50-year storm event in the Franklinton/Louisburg area. The storm produced approximately
5.55 inches of rain on June 14, 2006, making for a total monthly rainfall of 12.17 inches. This greatly
exceeds the 2.46 inch total rainfall amount for June 2004 and the 2.95 inch total rainfall amount for June
of 2005 (NexRad 2006). This storm event likely weakened and/or washed away much of the streamside
vegetation protecting the banks.
Despite fencing, cattle paths were present along both sides of the banks throughout the project reach, and
these paths no longer support vegetation. Planted vegetation was sparse along the project reach,
especially on the banks. However, the site appeared to be stabilizing. Since the June storm event and the
exclusion of cattle, site conditions have improved. The site was observed on July 21, 2006, August 18,
2006, and again during the monitoring effort on September 6, 2006. Site conditions appeared to improve
with each subsequent visit. Grazed seedlings are re-leafing and rushes (Juncus spp.) are populating the
streambanks.
Several small Chinese privet (Ligustrum sinense) plants were noted within the conservation easement.
Eradication methods were used to remove privet from the site prior to planting, but seed sources still exist
outside the conservation easement boundary. While these individuals do not constitute a problem area at
36 – UT to Billy’s Creek – MY1 Final Report URS 1/07
10
this time, the presence and abundance of the species should be monitored. All vegetative problem area
data are located in Appendix A-I.
3.1.3 Vegetative Problem Areas Plan View
The Vegetative Problem Areas Plan View (Figure 3) is located in Appendix A-II.
3.1.4 Stem Counts Vegetation plots were established per EEP’s September 2005 Monitoring Guidelines (EEP 2005). Five
100-square meter plots (10 meters by 10 meters) were randomly established within the 2.6-acre planted
area. Rebar was used to mark all four corners of the vegetation plots and the southwest corner was
marked with a 10-foot PVC pipe flagged with orange. The remaining three corners were marked with
blue flagging. Planted stems were marked with blue flagging. GPS coordinates were taken for all four
corners. A reference photograph was taken from the southwest corner towards the northeast corner for
each plot.
The new CVS-EEP Protocol for Recording Vegetation (Levels I-II) was used to inventory the plots for
the Year One stem counts. All planted stems were marked with white flagging. Stems found with blue
flagging from the previous year were re-flagged with white, and the blue flagging was removed. Natural
regeneration stems were marked with red flagging and recorded. The results of the stem counts are
summarized in Table AII in Appendix A-I.
3.1.5 Vegetation Plot Photos
Vegetation Monitoring Plot Photos are located in Appendix A-IV.

36 – UT to Billy’s Creek – MY1 Final Report URS 1/07
11
3.2 STREAM ASSESSMENT
3.2.1 Procedural Items
3.2.1.1 Morphometric Criteria
Dimension and profile were sampled at a rate as per the 2003 USACE Stream Mitigation Guidelines
(USACE 2003) as follows:
Dimension: Four permanent cross sections at intervals no greater than 500 feet. Two cross sections are
located in pools and two are located in riffles. The survey includes points measured at all breaks in slope,
including top of bank, bankfull, and thalweg.
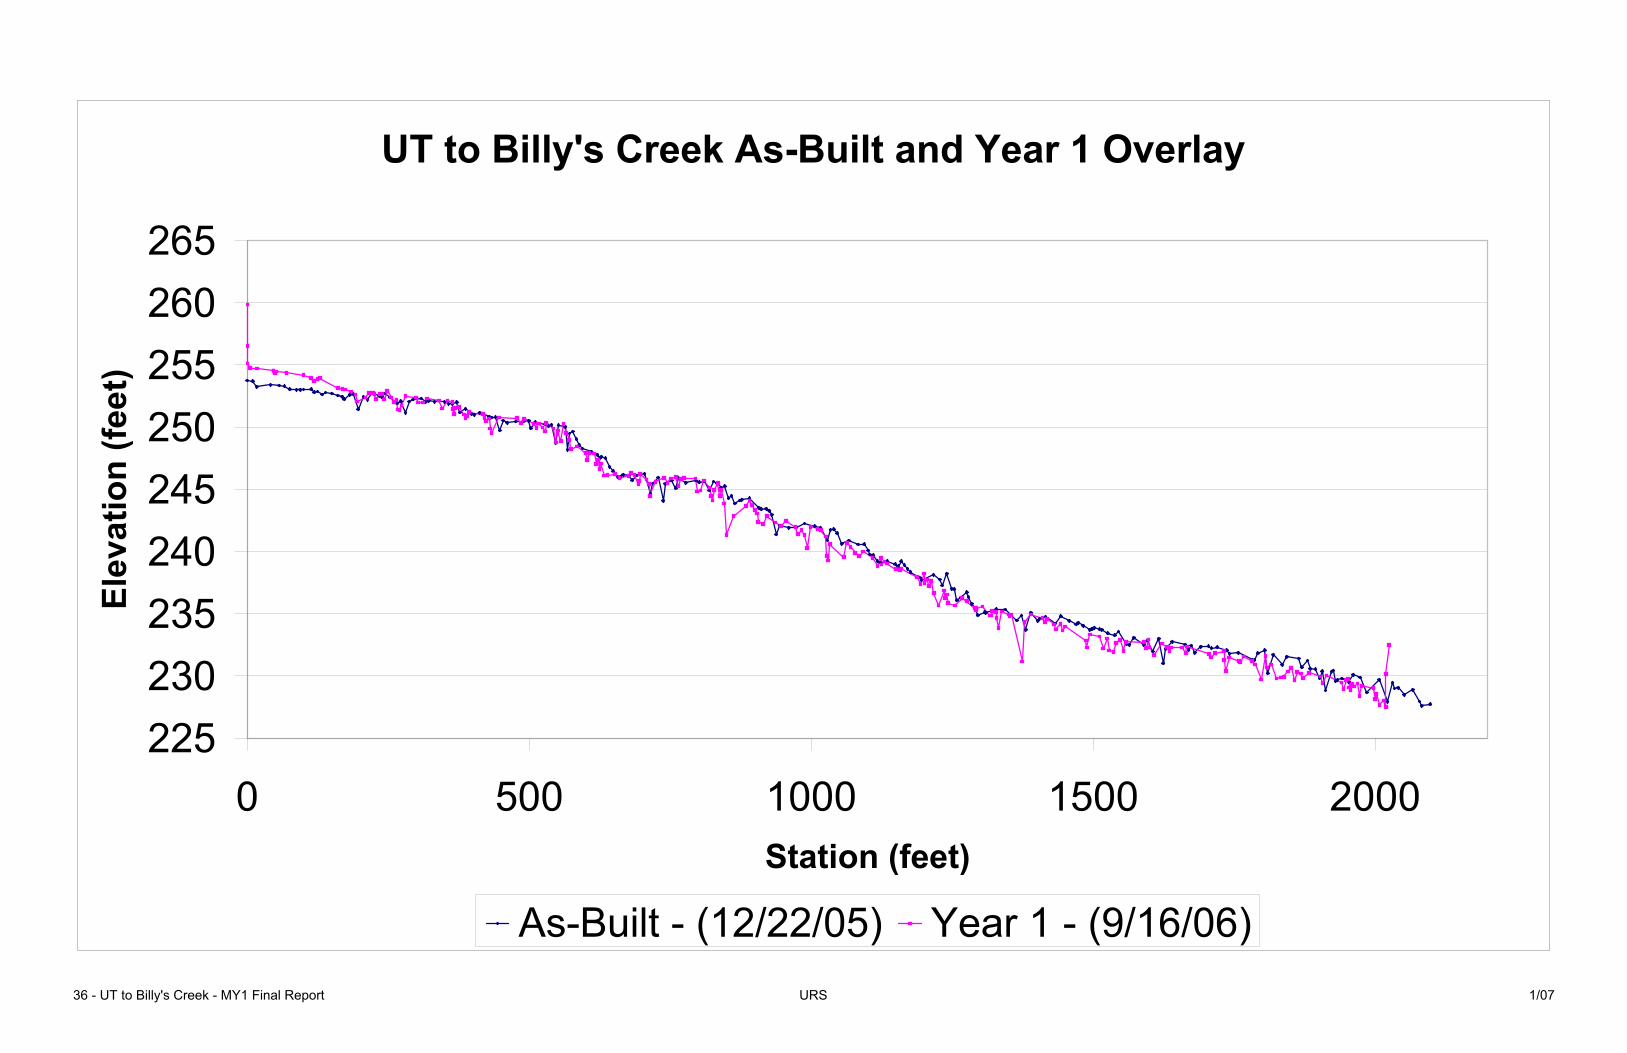
Profile: A longitudinal profile survey of the entire project reach will be surveyed each year. The survey
points include measurements taken beginning at the head of stream features such as riffle, run, glide, and
at the maximum pool depth.
3.2.1.2 Hydrologic Criteria
No flow monitoring devices have been installed at the site. The closest US Geologic Survey (USGS)
gage is located on the Tar River in Louisburg, approximately 10 miles from the site. However, this gage
does not provide comparable data for the project reach. The drainage area for the gage is 427 square
miles. The drainage area for the project reach is 0.22 square miles.
It has been confirmed by NOAA that at least one bankfull event has occurred within the last year
(Tropical Storm Alberto). Per NOAA staff member, Jonathan Blaes, Alberto produced a 50-year storm
event in the Franklinton/Louisburg area. The storm produced approximately 5.55 inches of rain on June
14, 2006, making for a total monthly rainfall of 12.17 inches. This greatly exceeds the 2.46 inch total
rainfall amount for June 2004 and the 2.95 inch total rainfall amount for June of 2005 (NexRad 2006).
3.2.1.3 Bank Stability Assessments
Table VI. BEHI and Sediment Export Estimates
UT to Billy’s Creek
EEP Project Number 36
Time
Point
Segment/
Reach
Linear
Footage Ex
trem
e
Ver
y H
igh
Hig
h
Mo
der
ate
Low
Ver
y L
ow
Sed
imen
t
Exp
ort
ft % ft % ft % ft % ft % ft % Ton/y MY1 Hoof shear @ XS4 20 20 100 0.16
MY1 Remaining channel 4,030 4,030 100 3.3
3.2.2 Problem Areas Plan View
The Stream Problem Areas Plan View is located in Appendix B-I (Figure 4).
3.2.3 Problem Areas Table Summary
Table B1 in Appendix B-II presents Stream Problem Area data.
3.2.4 Numbered Issues Photo Section Representative Stream Problem Area Photos are located in Appendix B-III.

36 – UT to Billy’s Creek – MY1 Final Report URS 1/07
12
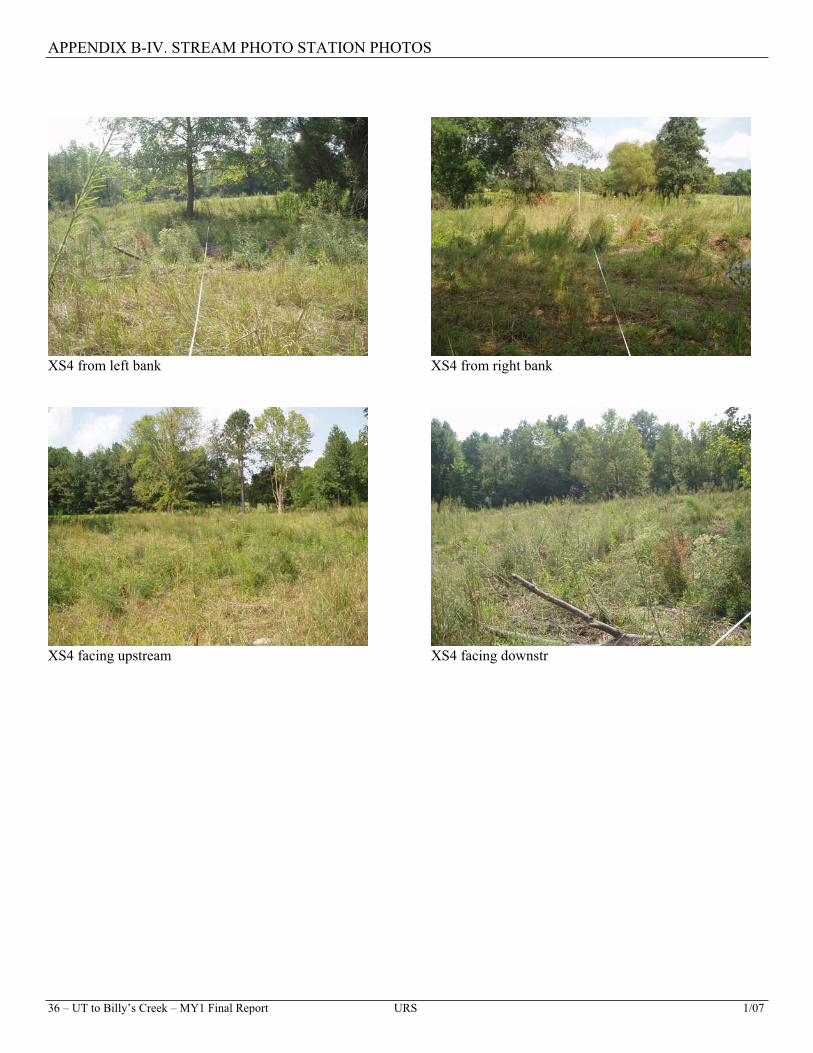
3.2.5 Fixed Photo Station Photos Stream Photo Station Photos are located in Appendix B-IV.
3.2.6 Stability Assessment
Table VII. Categorical Stream Feature Visual Stability Assessment (% Functioning)
UT to Billy’s Creek
EEP Project Number 36
Feature Initial MY-01 MY-02 MY-03 MY-04 MY-05
Riffle 100 97
Pool 100 99
Thalweg 100 97
Meanders 100 100
Bed General 100 97
Vanes / J Hooks 100 100
Wads and Boulders 100 100
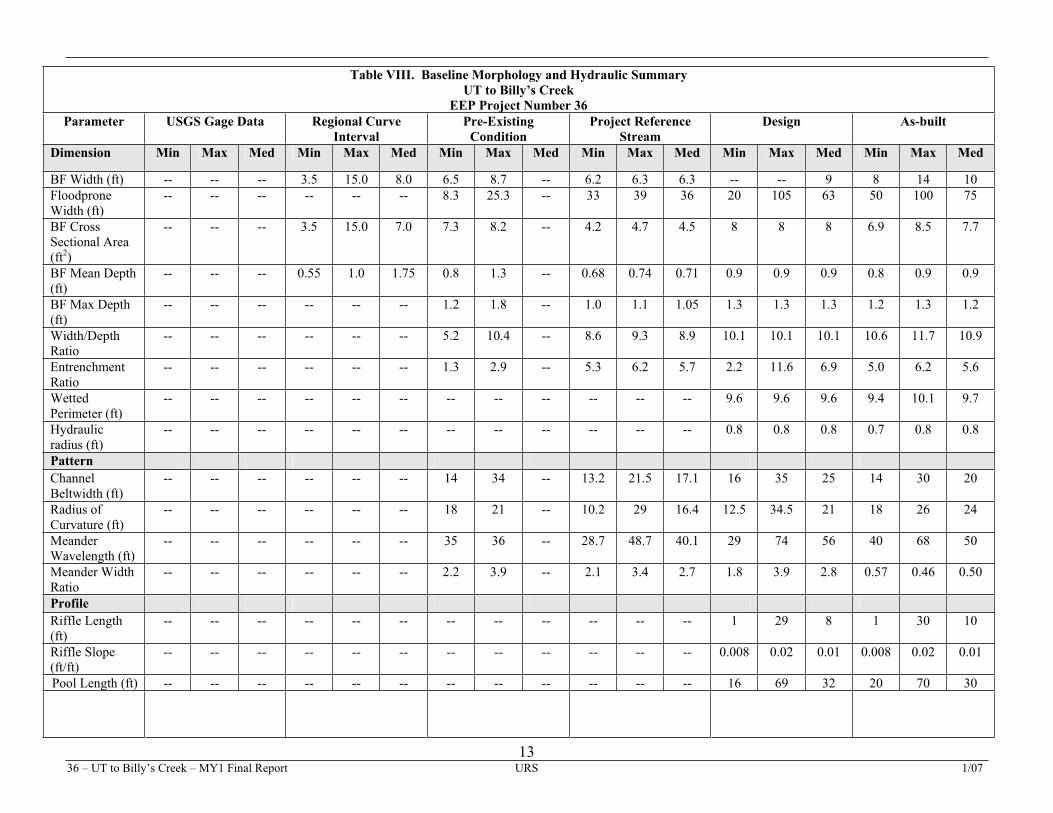
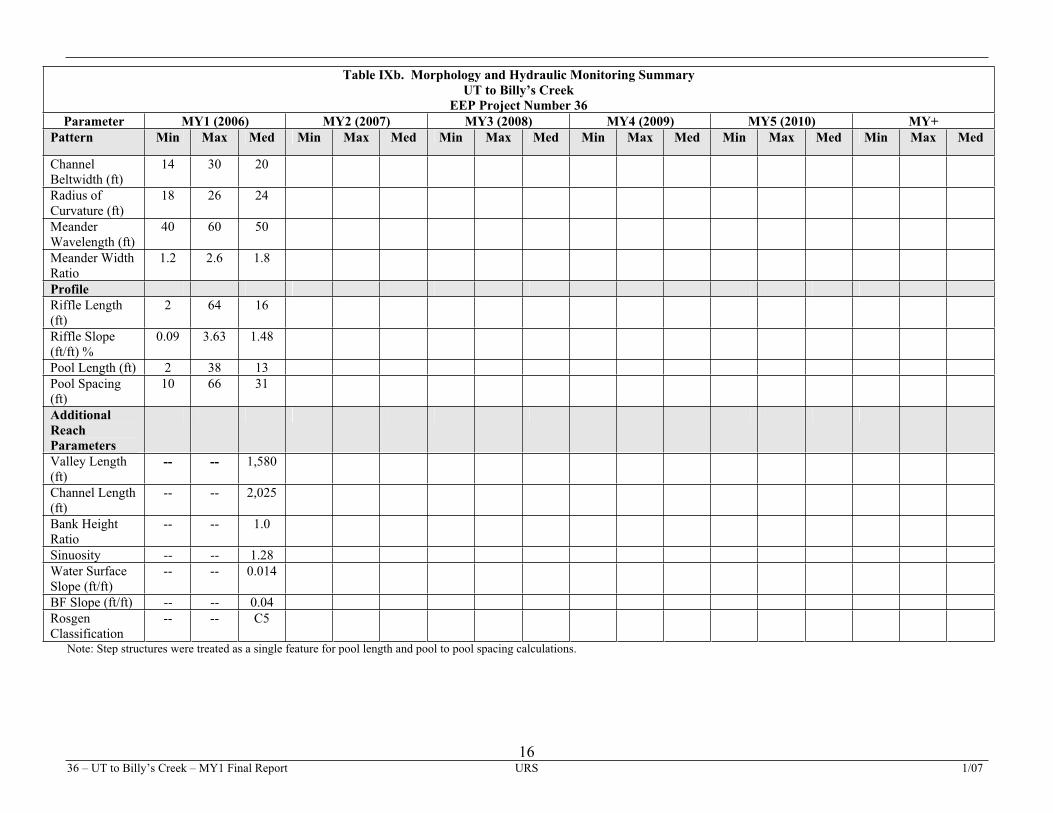
3.2.7 Quantitative Measures Tables (Morphology and Hydrology)
36 – UT to Billy’s Creek – MY1 Final Report URS 1/07
13
Table VIII. Baseline Morphology and Hydraulic Summary
UT to Billy’s Creek
EEP Project Number 36
Parameter USGS Gage Data Regional Curve
Interval
Pre-Existing
Condition
Project Reference
Stream
Design As-built
Dimension Min Max Med Min Max Med Min Max Med Min Max Med Min Max Med Min Max Med
BF Width (ft) -- -- -- 3.5 15.0 8.0 6.5 8.7 -- 6.2 6.3 6.3 -- -- 9 8 14 10
Floodprone
Width (ft)
-- -- -- -- -- -- 8.3 25.3 -- 33 39 36 20 105 63 50 100 75
BF Cross
Sectional Area
(ft2)
-- -- -- 3.5 15.0 7.0 7.3 8.2 -- 4.2 4.7 4.5 8 8 8 6.9 8.5 7.7
BF Mean Depth
(ft)
-- -- -- 0.55 1.0 1.75 0.8 1.3 -- 0.68 0.74 0.71 0.9 0.9 0.9 0.8 0.9 0.9
BF Max Depth
(ft)
-- -- -- -- -- -- 1.2 1.8 -- 1.0 1.1 1.05 1.3 1.3 1.3 1.2 1.3 1.2
Width/Depth
Ratio
-- -- -- -- -- -- 5.2 10.4 -- 8.6 9.3 8.9 10.1 10.1 10.1 10.6 11.7 10.9
Entrenchment
Ratio
-- -- -- -- -- -- 1.3 2.9 -- 5.3 6.2 5.7 2.2 11.6 6.9 5.0 6.2 5.6
Wetted
Perimeter (ft)
-- -- -- -- -- -- -- -- -- -- -- -- 9.6 9.6 9.6 9.4 10.1 9.7
Hydraulic
radius (ft)
-- -- -- -- -- -- -- -- -- -- -- -- 0.8 0.8 0.8 0.7 0.8 0.8
Pattern
Channel
Beltwidth (ft)
-- -- -- -- -- -- 14 34 -- 13.2 21.5 17.1 16 35 25 14 30 20
Radius of
Curvature (ft)
-- -- -- -- -- -- 18 21 -- 10.2 29 16.4 12.5 34.5 21 18 26 24
Meander
Wavelength (ft)
-- -- -- -- -- -- 35 36 -- 28.7 48.7 40.1 29 74 56 40 68 50
Meander Width
Ratio
-- -- -- -- -- -- 2.2 3.9 -- 2.1 3.4 2.7 1.8 3.9 2.8 0.57 0.46 0.50
Profile
Riffle Length
(ft)
-- -- -- -- -- -- -- -- -- -- -- -- 1 29 8 1 30 10
Riffle Slope
(ft/ft)
-- -- -- -- -- -- -- -- -- -- -- -- 0.008 0.02 0.01 0.008 0.02 0.01
Pool Length (ft) -- -- -- -- -- -- -- -- -- -- -- -- 16 69 32 20 70 30

36 – UT to Billy’s Creek – MY1 Final Report URS 1/07
14
Table VIII. Baseline Morphology and Hydraulic Summary
UT to Billy’s Creek
EEP Project Number 36
Parameter USGS Gage Data Regional Curve
Interval
Pre-Existing
Condition
Project Reference
Stream
Design As-built
Dimension Min Max Med Min Max Med Min Max Med Min Max Med Min Max Med Min Max Med
Pool Spacing
(ft)
-- -- -- -- -- -- -- -- 22 11.7 26.7 18 18.1 49.9 31.1 18 50 34
Substrate
d50 (mm) -- -- -- -- -- -- -- -- 1.3 -- -- -- -- -- -- 0.062 0.16 0.11
d84 (mm) -- -- -- -- -- -- -- -- 4 -- -- -- -- -- -- 0.16 0.75 0.53
Additional
Reach
Parameters
Valley Length
(ft)
-- -- -- -- -- -- -- -- 1,580 -- -- -- -- -- 1,580 -- -- 1,580
Channel Length
(ft)
-- -- -- -- -- -- -- -- 1,848 -- -- 108 -- -- 1,969 -- -- 2,101
Bank Height
Ratio
-- -- -- -- -- -- -- -- 2.0 -- -- 1.0 -- -- 1.0 -- -- 1.0
Sinuosity -- -- -- -- -- -- 1.11 1.32 1.17 -- -- 1.2 -- -- 1.25 -- -- 1.33
Water Surface
Slope (ft/ft)
-- -- -- -- -- -- 0.56 1.5 1.03 -- -- 0.8 -- -- 1.19 -- --
BF Slope (ft/ft) -- -- -- -- -- -- -- -- -- -- -- -- -- -- -- -- 0.008
Rosgen
Classification
-- -- -- -- -- -- -- -- E5/
G5c
-- -- E5 -- -- E5 -- -- E5

36 – UT to Billy’s Creek – MY1 Final Report URS 1/07
15
Table IXa. Morphology and Hydraulic Monitoring Summary
UT to Billy’s Creek
EEP Project Number 36
Parameter Cross Section 1
Pool
Cross Section 2
Riffle
Cross Section 3
Pool
Cross Section 4
Riffle
DimensionM
Y1
MY
2
MY
3
MY
4
MY
5
MY
+
MY
1
MY
2
MY
3
MY
4
MY
5
MY
+
MY
1
MY
2
MY
3
MY
4
MY
5
MY
+
MY
1
MY
2
MY
3
MY
4
MY
5
MY
+
BF Width (ft) 29.3 12.9 16.1 9.8
Floodprone
Width (ft)
75.0 75.0 40.0 75.0
BF Cross
Sectional Area
(ft2)
11.5 9.7 9.5 7.2
BF Mean
Depth
0.4 0.8 0.6 0.7
BF Max Depth 1.3 1.4 1.3 1.8
Width/Depth
Ratio
74.6 17.0 27.3 13.3
Entrenchment
Ratio
2.6 5.8 2.5 7.7
Wetted
Perimeter (ft)
29.9 13.3 16.8 10.8
Hydraulic
radius (ft)
0.4 0.7 0.6 0.7
Substrate
d50 (mm) 1.1 1.5 1.4 1.2
d84 (mm) 1.7 8 1.8 1.7
36 – UT to Billy’s Creek – MY1 Final Report URS 1/07
16
Table IXb. Morphology and Hydraulic Monitoring Summary
UT to Billy’s Creek
EEP Project Number 36
Parameter MY1 (2006) MY2 (2007) MY3 (2008) MY4 (2009) MY5 (2010) MY+
Pattern Min Max Med Min Max Med Min Max Med Min Max Med Min Max Med Min Max Med
Channel
Beltwidth (ft)
14 30 20
Radius of
Curvature (ft)
18 26 24
Meander
Wavelength (ft)
40 60 50
Meander Width
Ratio
1.2 2.6 1.8
Profile
Riffle Length
(ft)
2 64 16
Riffle Slope
(ft/ft) %
0.09 3.63 1.48
Pool Length (ft) 2 38 13
Pool Spacing
(ft)
10 66 31
Additional
Reach
Parameters
Valley Length
(ft)-- -- 1,580
Channel Length
(ft)
-- -- 2,025
Bank Height
Ratio
-- -- 1.0
Sinuosity -- -- 1.28
Water Surface
Slope (ft/ft)
-- -- 0.014
BF Slope (ft/ft) -- -- 0.04
Rosgen
Classification
-- -- C5
Note: Step structures were treated as a single feature for pool length and pool to pool spacing calculations.

1736 – UT to Billy’s Creek – MY1 Final Report URS 1/07
4.0 METHODOLOGY SECTION
All monitoring methodologies follow the most current templates and guidelines provided by EEP.
Photographs were taken at high resolution using an Olympus Stylus 4.0 megapixel digital camera. GPS
location information was collected using a Trimble Geo XT handheld mapping grade GPS unit. GPS
locations were collected on both banks of each cross section and on all four corners of each vegetation
plot. Stream and vegetation problem areas were noted in the field on As-Built Plan Sheets.
4.1 STREAM METHODOLOGY
The methods used to generate the data in this report are standard fluvial geomorphology techniques as
described in Applied River Morphology (Rosgen 1996) and related publications from US Forest Service
and the interagency Stream Mitigation Guidelines (USACE 2003). URS’ field morphology survey was
conducted using a Zeiss Level Ni 2 and the data were analyzed and displayed using the Reference Reach
Spreadsheet, Version 4.2L (Mecklenburg 2006). Modified Wolman weighted pebble counts were
conducted in the vicinity of each cross section. Four photographs were taken at all four cross section
locations. A photo was taken from the left bank towards the right bank, one from the right bank towards
the left bank, one facing upstream, and one facing downstream.
4.2 VEGETATION METHODOLOGY
The vegetation problem areas and structural problem areas were noted in the field on the As-bulit plan
sheets. Vegetation monitoring plots were marked in the field by placing rebar at each corner. In addition,
the southwest corner was marked with a ten-foot length of PVC pipe tied with orange flagging. The rebar
at the three other corners was marked with blue flagging. Individual plants in the monitoring plots were
tied with white flagging. Volunteer/natural regeneration stems were marked with red flagging. Plot
inventories were conducted per the 2006 CVS-EEP Protocol for Recording Vegetation (EEP 2006).
Planted woody vegetation and volunteer stems were counted. A photograph of each plot was taken from
the southwest corner, facing the northeast corner.

1836 – UT to Billy’s Creek – MY1 Final Report URS 1/07
5.0 REFERENCES
Daniels, R.B., Buol, S.W., Kleiss, H.J., and C.A Ditzler. 1999. Soil Systems in North Carolina. North
Carolina State University, Soil Science Department. Technical Bulletin 314. January, 1999.
Kunickis, S.H. 1998. Soil Survey of Franklin County, North Carolina. US Department of Agriculture
(USDA), Natural Resources Conservation Service (NRCS).
Mecklenburg, Dan. 2006. The Reference Reach Spreadsheet for Channel Survey Data Management.
Version 4.2L. Ohio Department of Natural Resources.
EEP. 2006. CVS-EEP Protocol for Recording Vegetation. Level 1-2 Plot Sampling Only. Version 4.0.
2006. Michael T. Lee, Robert K. Peet, Steven D. Roberts, Thomas R. Wentworth.
EEP. 2005. Content, Format, and Data Requirements for EEP Monitoring Reports. Version
1.1 (9/16/05). NCDENR, NCEEP. 17pp.
Rosgen, D.L. 1996. Applied River Morphology. Wildland Hydrology, Pagosa Springs, CO.
URS Corporation – North Carolina. 2006. Unnamed Tributary to Billy’s Creek Stream Restoration
Mitigation As-Built Report. April, 2006.
USACE, Wilmington District, US Environmental Protection Agency, NC Wildlife Resources
Commission, and NC Division of Water Quality. 2003. Stream Mitigation Guidelines. April
2003. 26 pp.
Nexrad. 2006. Franklinton History and Almanac Data. http://www.wunderground.com/radar/map.asp.

36 – UT to Billy’s Creek – MY1 Final Report URS 1/07
APPENDIX A
VEGETATION RAW DATA
APPENDIX A-I. VEGETATION DATA TABLES
36 – UT to Billy’s Creek – MY1 Final Report URS 1/07
Table AI. Vegetative Problem Areas
UT to Billy’s Creek
EEP Project Number 36
Feature/Issue Station #/Range Probable Cause Photo #
Bare Bank 31+10 Storm damage VPA1
Bare Bank 30+65 Cattle damage VPA2
Bare Floodplain 30+65 Cattle damage VPA3
Bare Floodplain 29+40 Cattle damage VPA4
Bare Floodplain 28+90 Cattle damage VPA5
Bare Bank 23+85 Cattle crossing VPA6
Bare Bank 24+25 Cattle damage VPA7
Bare Bank 22+45 Cattle crossing VPA8
Bare Bank 22+27 Cattle crossing VPA9
Bare Bank 22+12 Cattle crossing VPA10
Bare Bank 21+35 Cattle crossing VPA11
Bare Bank 21+35 Cattle crossing VPA12
Bare Bank 19+00 Cattle crossing VPA13
Bare Bank 18+75 Cattle crossing VPA14
Bare Bank 17+45 Cattle damage VPA15
Bare Floodplain 13+00 Cattle damage VPA16

APPENDIX A-I. VEGETATION DATA TABLES
36 – UT to Billy’s Creek – MY1 Final Report URS 1/07
Table AII. Stem Counts for Each Species Arranged by Plot
UT to Billy’s Creek
EEP Project Number 36
Species Plots
1 2 3 4 5 Init
ial
To
tals
Yea
r 1
To
tals
Yea
r 2
To
tals
Yea
r 3
To
tals
Yea
r 4
To
tals
Yea
r 5
To
tals
Su
rviv
al
%
Alnus serrulata 11 0 0
Aronia arbutifolia 1 1 4 2 6 100*
Betula nigra 7 1 3 3 2 14 100*
Calicarpa americana 2 0 0
Celtis laevigata 1 2 11 3 27
Cephalanthus occidentalis 3 0 0
Cornus amomum 5 6 8 2 4 15 25 100*
Cornus florida 1 2 1 50
Fraxinus pennsylvanica 1 1 0 2 100*
Liriodendron tulipifera 1 1 1 100
Nyssa sylvatica 2 4 2 50
Quercus falcata 1 1 1 1 5 4 80
Quercus laurifolia 1 9 1 10
Quercus phellos 2 3 1 4 4 14 14 100
Rhus coppalina 2 2 2 4 6 100*
Salix nigra 5 1 2 6 100*
Salix sericea 5 0 0
Sambucus canadensis 2 1 3 16 6 38
Viburnum nudum 3 2 5 5 100 * Instances where Year 1 count exceeds initial count. Many of these individuals were small and suspected to be re-growth from planted stems that appeared dead
during the initial count.

APPENDIX A-II. VEGETATION PROBLEM AREAS PLAN VIEW
36 – UT to Billy’s Creek – MY1 Final Report URS 1/07

k
k
k
k
k
VPA16
VPA1
VPA6
VPA4
VPA15
VPA9
VPA3
VPA5
VPA7
VPA14
VPA10
VPA13
VPA11
VPA2
VPA8
VPA12
XS-2
XS-4
XS-1
XS-3
VP4
VP3
VP5
VP2
VP1
30+00
25+00
20+00
15+00
10+00
UT to Billy's CreekStream RestorationFranklin County, NC
Figure 3Vegetative Problem Areas
Plan View
Monitoring Year:
Project Number:Project:
1 (2006)
36
Date:
January 2007
®
Flow
URS Corporation - North Carolina1600 Perimeter Park Drive
Suite 400Morrisville, NC 27560Phone: 919-461-1100
Fax: 919-461-1415
Prepared By:Prepared For:
NC EcosystemEnhancement Program
0 100 20050Feet
Legend
Problem Area Concern
Problem Area High Concern
Top of Bank
Thalweg
Cross Section
Vegetation Plot
Conservation Easement
k Stations
FEATURE # FEATURE ISSUE STATION # SUSPECTED CAUSE
VPA1 Bare Bank 31+10 Storm damage
VPA2 Bare Bank 30+65 Cattle damage
VPA3 Bare Floodplain 30+65 Cattle damage
VPA4 Bare Floodplain 29+40 Cattle damage
VPA5 Bare Floodplain 28+90 Cattle damage
VPA6 Bare Bank 23+85 Cattle crossing
VPA7 Bare Bank 24+25 Cattle damage
VPA8 Bare Bank 22+45 Cattle crossing
VPA9 Bare Bank 22+27 Cattle crossing
VPA10 Bare Bank 22+12 Cattle crossing
VPA11 Bare Bank 21+35 Cattle crossing
VPA12 Bare Bank 21+35 Cattle crossing
VPA13 Bare Bank 19+00 Cattle crossing
VPA14 Bare Bank 18+75 Cattle crossing
VPA15 Bare Bank 17+45 Cattle damage
VPA16 Bare Floodplain 13+00 Cattle damage

APPENDIX A-III. VEGETATION PROBLEM AREA PHOTOS
36 – UT to Billy’s Creek – MY1 Final Report URS 1/07
VPA1 VPA2
VPA3 VPA4
VPA5 VPA6

APPENDIX A-III. VEGETATION PROBLEM AREA PHOTOS
36 – UT to Billy’s Creek – MY1 Final Report URS 1/07
VPA7 VPA8
VPA9 VPA10
VPA11 VPA12

APPENDIX A-III. VEGETATION PROBLEM AREA PHOTOS
36 – UT to Billy’s Creek – MY1 Final Report URS 1/07
VPA13 VPA14
VPA15 VPA16
Cow path along streambank Cow path in upland zone

APPENDIX A-IV. VEGETATION MONITORING PLOT PHOTOS (06/SEP/06)
36 – UT to Billy’s Creek – MY1 Final Report URS 1/07
Vegetation Plot 1 Vegetation Plot 2
Vegetation Plot 3 Vegetation Plot 4
Vegetation Plot 5

36 – UT to Billy’s Creek – MY1 Final Report URS 1/07
APPENDIX B
GEOMORPHIC RAW DATA

APPENDIX B-I. STREAM PROBLEM AREAS PLAN VIEW
36 – UT to Billy’s Creek – MY1 Final Report URS 1/07

!(
!(
!(
k
k
k
k
k
XS-1
PA1
XS-2
XS-4
XS-3
PA3
PA4
PA
6
PA
6
PA5
PA2
30+00
25+00
20+00
15+00
10+00
UT to Billy's CreekStream RestorationFranklin County, NC
Figure 4.Stream Problem Areas
Plan View
Monitoring Year:
Project Number:Project:
1 (2006)
36
Date:
January 2007
®
Flow
URS Corporation - North Carolina1600 Perimeter Park Drive
Suite 400Morrisville, NC 27560Phone: 919-461-1100
Fax: 919-461-1415
Prepared By:Prepared For:
NC EcosystemEnhancement Program
0 100 20050Feet
Legend
!( Problem Area Concern
Problem Area Concern
!( Problem Area High Concern
Problem Area High Concern
Cross Section
Top of Bank
Thalweg
Conservation Easement
k Stations
Feature
Issue Station Suspected Cause Photo #
Bank scour 28+80 Hoof shear PA1
Bank scour 21+35 Matting issues PA2
Bank scour/
aggradation 19+50
Hoof shear and
sedimentation
PA3-1 and
PA3-2
Abandoned
channel
19+15 to
19+35 Matting issues
PA4-1 and
PA4-2
Engineered
structure 16+08
Scour behind
structure PA5
Sedimentation
10+00 to
12+00 50-year storm event
PA6-1 and
PA6-2

APPENDIX B-II. STREAM PROBLEM AREAS TABLE
36 – UT to Billy’s Creek – MY1 Final Report URS 1/07
Table BI. Stream Problem Areas
UT to Billy’s Creek
EEP Project Number 36
Feature Issue Station Suspected Cause Photo #
Bank scour 28+80* Hoof shear PA1
Bank scour 21+35* Matting issues PA2
Bank scour/aggradation 19+50* Hoof shear and sedimentation PA3-1 and PA3-2
Abandoned channel 19+15 to 19+35 Matting issues PA4-1 and PA4-2
Engineered structure stressed 16+08* Scour behind structure PA5
Sedimentation 10+00 to 12+00 50-year storm event PA6-1 and PA6-2 * Localized problem areas

APPENDIX B-III. REPRESENTATIVE STREAM PROBLEM AREA PHOTOS
36 – UT to Billy’s Creek – MY1 Final Report URS 1/07
PA1 PA2
PA3-1 PA3-2
PA4-1 PA4-2

APPENDIX B-III. REPRESENTATIVE STREAM PROBLEM AREA PHOTOS
36 – UT to Billy’s Creek – MY1 Final Report URS 1/07
PA5 PA6-1
PA6-2

APPENDIX B-IV. STREAM PHOTO STATION PHOTOS
36 – UT to Billy’s Creek – MY1 Final Report URS 1/07
XS1 from left bank XS1 from right bank
XS1 facing upstream XS1 facing downstream
XS2 from left bank XS2 from right bank

APPENDIX B-IV. STREAM PHOTO STATION PHOTOS
36 – UT to Billy’s Creek – MY1 Final Report URS 1/07
XS2 facing upstream XS2 facing downstream
XS3 from left bank XS3 from right bank
XS3 facing upstream XS3 facing downstream
APPENDIX B-IV. STREAM PHOTO STATION PHOTOS
36 – UT to Billy’s Creek – MY1 Final Report URS 1/07
XS4 from left bank XS4 from right bank
XS4 facing upstream XS4 facing downstr

APPENDIX B-V. QUALITATIVE VISUAL STABILITY ASSESSMENT
36 – UT to Billy’s Creek – MY1 Final Report URS 1/07
Table BII. Qualitative Visual Morphological Stability Assessment
UT to Billy’s Creek
EEP Project Number 36
Feature Category Metric (per As-built and reference baselines) (# s
tab
le)
Nu
mb
er
per
form
in
g a
s
Inte
nd
ed
To
tal
nu
mb
er
per
As-
bu
ilt
To
tal
nu
mb
er/f
e
et i
n
un
stab
le
sta
te
% per
form
in s
tab
le
con
dit
ion
Fea
ture
per
form
.
Mea
n o
r
tota
l
Present? 70 72 2 97
Armor stable (no displacement)? 70 72 2 97
Facet grade appears stable? 70 72 2 97
Minimal evidence of embedding/fining? 70 72 2 97
Riffles
Length appropriate? 70 72 2 97
97
Present (not subject to severe aggrad. or migration)? 69 70 1 99
Sufficiently deep (max pool D:mean Bkf >1.6) 69 70 1 99
Pools
Length appropriate? 69 70 1 99
99
Upstream of meander bend (run/inflection) centering? 70 72 2 97 Thalweg
Downstream of meander (glide/inflection) centering? 70 72 2 97
97
Meanders Outer bend in state of limited/controlled erosion? 57 57 0 100
Of those eroding, # w/concomitant point bar formation? NA NA NA NA
Apparent Rc within spec? 57 57 0 100
Sufficient floodplain access and relief? 57 57 0 100
100
Bed General General channel bed aggradation areas (bar formation) 5 NA 0 100
Channel bed degradation–areas of increasing downcutting/headcutting? 1 NA 1 NA
NA
Vanes Free of back or arm scour? 26 26 0 100
Height appropriate? 26 26 0 100
Angle and geometry appear appropriate? 26 26 0 100
Free of piping or other structural failures? 26 26 0 100
100
Wads/ Boulders Free of scour? All NA 0 100
Footing stable? All NA 0 100
100

APPENDIX B-VI. ANNUAL OVERLAYS OF CROSS SECTION PLOTS
36 – UT to Billy’s Creek – MY1 Final Report URS 1/07

UT to Billy's Creek XS 1 (Pool) Overlay
252
253
254
255
256
257
258
0 10 20 30 40 50 60 70 80
Station (feet)
Ele
vati
on
(fe
et)
As-Built - (12/22/05) Year 1 (9/6/06)
UT to Billy's Creek XS 2 (Riffle) Overlay
245
245.5
246
246.5
247
247.5
248
248.5
249
0 10 20 30 40 50 60 70 80
Station (feet)
Ele
va
tio
n (
fee
t)
As-Built - (12/22/05) Year 1 (9/6/06)
36 - UT to Billy's Creek - MY1 Final Report URS 1/07

UT to Billy's Creek XS 3 (Pool) Overlay
234.5
235
235.5
236
236.5
237
237.5
238
238.5
0 10 20 30 40 50
Station (feet)
Ele
va
tio
n (
fee
t)
As-Built - (12/22/05) Year 1 (9/6/06)
UT to Billy's Creek XS 4 (Riffle) Overlay
230.5231
231.5232
232.5233
233.5234
234.5235
0 10 20 30 40 50 60 70 80
Station (feet)
Ele
va
tio
n (
fee
t)
As-Built - (12/22/05) Year 1 (9/6/06)
36 - UT to Billy's Creek - MY1 Final Report URS 1/07

APPENDIX B-VII. ANNUAL OVERLAY OF LONGITUDINAL PLOTS
36 – UT to Billy’s Creek – MY1 Final Report URS 1/07
36 - UT to Billy's Creek - MY1 Final Report URS 1/07
UT to Billy's Creek As-Built and Year 1 Overlay
225
230
235
240
245
250
255
260
265
0 500 1000 1500 2000
Station (feet)
Ele
vati
on
(fe
et)
As-Built - (12/22/05) Year 1 - (9/16/06)

APPENDIX B-VIII. PEBBLE COUNT FREQUENCY DISTRIBUTION PLOTS
36 – UT to Billy’s Creek – MY1 Final Report URS 1/07

Cross Section 1 9/16/2006
2) Weighted Pebble Count
Feature Percent of Reach
Riffle 40 % Run %
Pool 60 % Glide %
Material Size Range (mm) weighted
silt/clay 0 - 0.062 24.0
very fine sand 0.062 - 0.125 1.0
fine sand 0.125 - 0.25 0.0 24%
medium sand 0.25 - 0.5 15.0 s 1%
coarse sand 0.5 - 1 6.0 k 0%
very coarse sand 1 - 2 52.0 15%
very fine gravel 2 - 4 1.0 6%
fine gravel 4 - 6 0.0 e 52%
fine gravel 6 - 8 1.0 k 1%
medium gravel 8 - 11 0.0 4 0%
medium gravel 11 - 16 0.0 1%
coarse gravel 16 - 22 0.0 0%
coarse gravel 22 - 32 0.0 0%
very coarse gravel 32 - 45 0.0 0%
very coarse gravel 45 - 64 0.0 0%
small cobble 64 - 90 0.0 0%
medium cobble 90 - 128 0.0 0%
large cobble 128 - 180 0.0 0%
very large cobble 180 - 256 0.0 0%
small boulder 256 - 362 0.0 0%
small boulder 362 - 512 0.0 0%
medium boulder 512 - 1024 0.0 0%
large boulder 1024 - 2048 0.0 0%
very large boulder 2048 - 4096 0.0 0%
total particle weighted count: 100 6-8 0%
Type
bedrock --------------------- 0.0 D16 0.062 mean 0.3 silt/clay 24%
clay hardpan --------------------- 0.0 D35 0.4 dispersion 9.6 sand 74%
detritus/wood --------------------- 0.0 D50 1.1 skewness -0.44 gravel 2%
artificial --------------------- 0.0 D65 1.3 cobble 0%
total weighted count: 100.0 D84 1.7 boulder 0%
D95 1.9
Note:
Size Distribution
Weighted pebble count by bed features
Size (mm)
Weighted pebble count by bed features UT to Billy's Creek
silt/clay sand gravel cobble boulder
0%
10%
20%
30%
40%
50%
60%
70%
80%
90%
100%
0.01 0.1 1 10 100 1000 10000
particle size (mm)
pe
rce
nt fin
er
tha
n
0%
10%
20%
30%
40%
50%
60%
we
igh
ted
pe
rce
nt o
f pa
rticle
s in
ran
ge
weighted percent Riffle Pool Run Glide # of particles
40% riffle 60% pool
Riffle, Pool, Run, Glide
36 - UT to Billy's Creek - MY1 Final Report URS 1/07
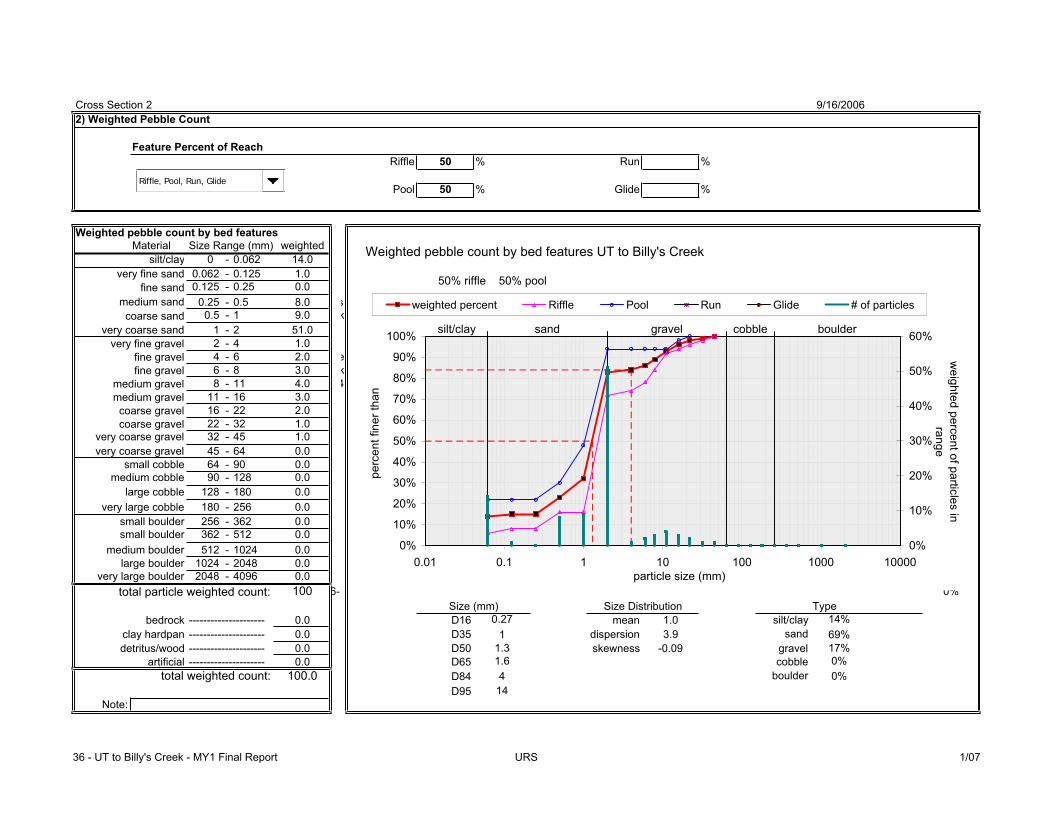
Cross Section 2 9/16/2006
2) Weighted Pebble Count
Feature Percent of Reach
Riffle 50 % Run %
Pool 50 % Glide %
Material Size Range (mm) weighted
silt/clay 0 - 0.062 14.0
very fine sand 0.062 - 0.125 1.0
fine sand 0.125 - 0.25 0.0 14%
medium sand 0.25 - 0.5 8.0 s 1%
coarse sand 0.5 - 1 9.0 k 0%
very coarse sand 1 - 2 51.0 8%
very fine gravel 2 - 4 1.0 9%
fine gravel 4 - 6 2.0 e 51%
fine gravel 6 - 8 3.0 k 1%
medium gravel 8 - 11 4.0 4 2%
medium gravel 11 - 16 3.0 3%
coarse gravel 16 - 22 2.0 4%
coarse gravel 22 - 32 1.0 3%
very coarse gravel 32 - 45 1.0 2%
very coarse gravel 45 - 64 0.0 1%
small cobble 64 - 90 0.0 1%
medium cobble 90 - 128 0.0 0%
large cobble 128 - 180 0.0 0%
very large cobble 180 - 256 0.0 0%
small boulder 256 - 362 0.0 0%
small boulder 362 - 512 0.0 0%
medium boulder 512 - 1024 0.0 0%
large boulder 1024 - 2048 0.0 0%
very large boulder 2048 - 4096 0.0 0%
total particle weighted count: 100 6-8 0%
Type
bedrock --------------------- 0.0 D16 0.27 mean 1.0 silt/clay 14%
clay hardpan --------------------- 0.0 D35 1 dispersion 3.9 sand 69%
detritus/wood --------------------- 0.0 D50 1.3 skewness -0.09 gravel 17%
artificial --------------------- 0.0 D65 1.6 cobble 0%
total weighted count: 100.0 D84 4 boulder 0%
D95 14
Note:
Weighted pebble count by bed features
Size (mm) Size Distribution
Weighted pebble count by bed features UT to Billy's Creek
silt/clay sand gravel cobble boulder
0%
10%
20%
30%
40%
50%
60%
70%
80%
90%
100%
0.01 0.1 1 10 100 1000 10000
particle size (mm)
pe
rce
nt fin
er
tha
n
0%
10%
20%
30%
40%
50%
60%
we
igh
ted
pe
rce
nt o
f pa
rticle
s in
ran
ge
weighted percent Riffle Pool Run Glide # of particles
50% riffle 50% pool
Riffle, Pool, Run, Glide
36 - UT to Billy's Creek - MY1 Final Report URS 1/07

Cross Section 3 9/16/2006
2) Weighted Pebble Count
Feature Percent of Reach
Riffle 60 % Run %
Pool 40 % Glide %
Material Size Range (mm) weighted
silt/clay 0 - 0.062 21.0
very fine sand 0.062 - 0.125 5.0
fine sand 0.125 - 0.25 0.0 21%
medium sand 0.25 - 0.5 0.0 s 5%
coarse sand 0.5 - 1 0.0 k 0%
very coarse sand 1 - 2 71.0 0%
very fine gravel 2 - 4 0.0 0%
fine gravel 4 - 6 2.0 e 71%
fine gravel 6 - 8 1.0 k 0%
medium gravel 8 - 11 0.0 4 2%
medium gravel 11 - 16 0.0 1%
coarse gravel 16 - 22 0.0 0%
coarse gravel 22 - 32 0.0 0%
very coarse gravel 32 - 45 0.0 0%
very coarse gravel 45 - 64 0.0 0%
small cobble 64 - 90 0.0 0%
medium cobble 90 - 128 0.0 0%
large cobble 128 - 180 0.0 0%
very large cobble 180 - 256 0.0 0%
small boulder 256 - 362 0.0 0%
small boulder 362 - 512 0.0 0%
medium boulder 512 - 1024 0.0 0%
large boulder 1024 - 2048 0.0 0%
very large boulder 2048 - 4096 0.0 0%
total particle weighted count: 100 6-8 0%
Type
bedrock --------------------- 0.0 D16 0.062 mean 0.3 silt/clay 21%
clay hardpan --------------------- 0.0 D35 1.1 dispersion 11.2 sand 76%
detritus/wood --------------------- 0.0 D50 1.3 skewness -0.49 gravel 3%
artificial --------------------- 0.0 D65 1.5 cobble 0%
total weighted count: 100.0 D84 1.8 boulder 0%
D95 2
Note:
Weighted pebble count by bed features
Size (mm) Size Distribution
Weighted pebble count by bed features UT to Billy's Creek
silt/clay sand gravel cobble boulder
0%
10%
20%
30%
40%
50%
60%
70%
80%
90%
100%
0.01 0.1 1 10 100 1000 10000
particle size (mm)
pe
rce
nt fin
er
tha
n
0%
10%
20%
30%
40%
50%
60%
70%
80%
we
igh
ted
pe
rce
nt o
f pa
rticle
s in
ran
ge
weighted percent Riffle Pool Run Glide # of particles
60% riffle 40% pool
Riffle, Pool, Run, Glide
36 - UT to Billy's Creek - MY1 URS 1/07

Cross Section 4 9/16/2006
2) Weighted Pebble Count
Feature Percent of Reach
Riffle 70 % Run %
Pool 30 % Glide %
Material Size Range (mm) weighted
silt/clay 0 - 0.062 25.8
very fine sand 0.062 - 0.125 1.5
fine sand 0.125 - 0.25 0.0 26%
medium sand 0.25 - 0.5 0.0 s 2%
coarse sand 0.5 - 1 13.0 k 0%
very coarse sand 1 - 2 58.3 0%
very fine gravel 2 - 4 0.0 13%
fine gravel 4 - 6 0.0 e 58%
fine gravel 6 - 8 0.0 k 0%
medium gravel 8 - 11 0.0 4 0%
medium gravel 11 - 16 1.5 0%
coarse gravel 16 - 22 0.0 0%
coarse gravel 22 - 32 0.0 2%
very coarse gravel 32 - 45 0.0 0%
very coarse gravel 45 - 64 0.0 0%
small cobble 64 - 90 0.0 0%
medium cobble 90 - 128 0.0 0%
large cobble 128 - 180 0.0 0%
very large cobble 180 - 256 0.0 0%
small boulder 256 - 362 0.0 0%
small boulder 362 - 512 0.0 0%
medium boulder 512 - 1024 0.0 0%
large boulder 1024 - 2048 0.0 0%
very large boulder 2048 - 4096 0.0 0%
total particle weighted count: 100 6-8 0%
Type
bedrock --------------------- 0.0 D16 0.062 mean 0.3 silt/clay 26%
clay hardpan --------------------- 0.0 D35 0.76 dispersion 9.6 sand 73%
detritus/wood --------------------- 0.0 D50 1.1 skewness -0.44 gravel 2%
artificial --------------------- 0.0 D65 1.3 cobble 0%
total weighted count: 100.0 D84 1.7 boulder 0%
D95 1.9
Note:
Weighted pebble count by bed features
Size (mm) Size Distribution
Weighted pebble count by bed features UT to Billy's Creek
silt/clay sand gravel cobble boulder
0%
10%
20%
30%
40%
50%
60%
70%
80%
90%
100%
0.01 0.1 1 10 100 1000 10000
particle size (mm)
pe
rce
nt fin
er
tha
n
0%
10%
20%
30%
40%
50%
60%
70%
we
igh
ted
pe
rce
nt o
f pa
rticle
s in
ran
ge
weighted percent Riffle Pool Run Glide # of particles
70% riffle 30% pool
Riffle, Pool, Run, Glide
36 - UT to Billy's Creek - MY1 Final Report URS 1/07