
UT Knoxville Climate Action Plan11
53
The University of Tennessee, Knoxville Climate Action Plan Version 1.0 January 26, 2010
Transcript of UT Knoxville Climate Action Plan11
The University of Tennessee, Knoxville
Climate Action Plan
Version 1.0 January 26, 2010
UT Knoxville Climate Action Plan 1
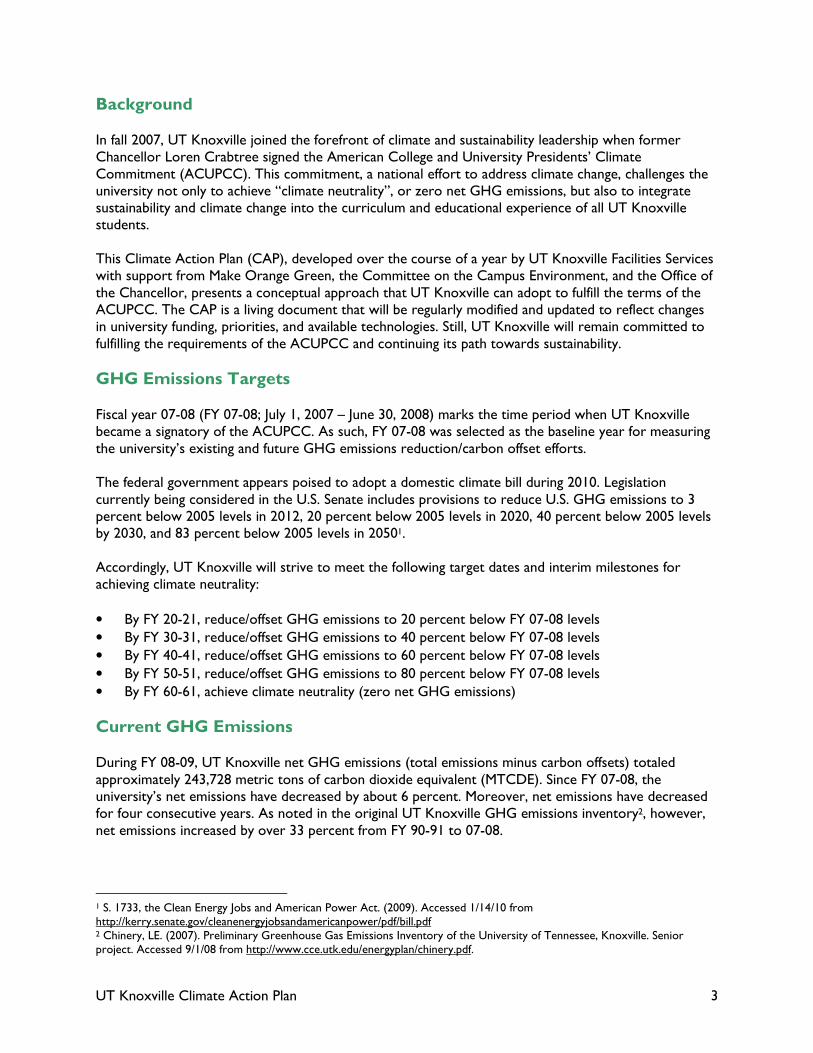
The University of Tennessee aspires to serve as a model of environmental stewardship and integrity and to follow principles of good environmental conservation, waste reduction, and design on its Knoxville campus. The faculty, staff, administration, and students will strive to increase awareness of environmental problems and will promote sound environmental practices. UTK will encourage consideration of environmental impacts in all decisions made by university faculty, staff, and students. The university will ensure full compliance with existing environmental laws and regulations and will seek to lead the community in developing beneficial laws and regulations. In its daily operations, UTK will attempt to conserve energy and to promote the use of renewable energy sources at the same time that it champions waste reduction, reuse, recycling, and composting. University growth will occur in ways that respect the surrounding human and natural communities. UTK will cooperate with other local, national, and international organizations to promote sound environmental policies.
-- University of Tennessee, Knoxville Environmental Policy (Promulgated April 22, 2004)

UT Knoxville Climate Action Plan 2
Table of Contents Background..........................................................................................................................................................................3 GHG Emissions Targets...................................................................................................................................................3 Current GHG Emissions..................................................................................................................................................3 Campus Growth Scenarios .............................................................................................................................................4 Projected GHG Emissions...............................................................................................................................................5 GHG Emissions Mitigation...............................................................................................................................................5 Funding Sources .................................................................................................................................................................7 Education & Outreach......................................................................................................................................................9 Next Steps...........................................................................................................................................................................9 Appendix A - Project Summaries.................................................................................................................................10
Project 1: Replace building transformers - multiple buildings ..........................................................................10 Project 2: Upgrade interior lighting - multiple buildings ....................................................................................12 Project 3: Replace windows - Dabney/Buehler & Nielsen Physics..................................................................13 Project 4: Upgrade chilled water plant & HVAC controls - multiple buildings............................................14 Project 5: Upgrade exterior lighting - multiple locations ..................................................................................16 Project 6: Upgrade HVAC, lighting and plumbing - Austin Peay & Alumni Memorial................................17 Project 7: Replace windows - Austin Peay & Alumni Memorial ......................................................................18 Project 8: Purchase additional green power.........................................................................................................20 Project 9: Design & install on-campus photovoltaic system.............................................................................21 Project 10: Upgrade interior lighting - Veterinary Teaching Library ..............................................................23 Project 11: Replace roofs - Alumni Memorial & HPER......................................................................................24 Project 12: Design new buildings to use 20% less electricity per SF than existing buildings ....................25 Project 13: Reduce electricity use per SF in existing buildings to 10% below FY 07-08 average............28 Project A1: Launch energy managers program....................................................................................................29 Project A2: Compost 100% of green waste .........................................................................................................31 Project A3: Meet 20% fleet fuel needs with alternative fuels ...........................................................................32 Project A4: Run natural gas-powered turbine generator 24-7 ........................................................................33 Project A5: Install smart power strips in residence halls ..................................................................................35 Project A6: Reduce SOV commuting miles per year to 25% below FY 07-08 levels .................................36 Project A7: Divert 30% of waste from landfill by FY 20-21..............................................................................37 Project A8: Use portion of 'Green Fee' to launch major energy efficiency project ...................................40 Project A9: Reinvest savings from ARRA projects into major energy efficiency project..........................41 Project A10: Assume FY 20-21 purchased electricity is 50% nuclear, hydro and renewables.................42 Project S1: Use only natural gas to produce campus steam with current boilers ......................................44 Project S2: Same as S1, but produce 50,000 lbs per hr of campus steam using biomass..........................45
Appendix B - UT Knoxville Sustainability Courses .................................................................................................48
UT Knoxville Climate Action Plan 3
Background In fall 2007, UT Knoxville joined the forefront of climate and sustainability leadership when former Chancellor Loren Crabtree signed the American College and University Presidents’ Climate Commitment (ACUPCC). This commitment, a national effort to address climate change, challenges the university not only to achieve “climate neutrality”, or zero net GHG emissions, but also to integrate sustainability and climate change into the curriculum and educational experience of all UT Knoxville students. This Climate Action Plan (CAP), developed over the course of a year by UT Knoxville Facilities Services with support from Make Orange Green, the Committee on the Campus Environment, and the Office of the Chancellor, presents a conceptual approach that UT Knoxville can adopt to fulfill the terms of the ACUPCC. The CAP is a living document that will be regularly modified and updated to reflect changes in university funding, priorities, and available technologies. Still, UT Knoxville will remain committed to fulfilling the requirements of the ACUPCC and continuing its path towards sustainability.
GHG Emissions Targets Fiscal year 07-08 (FY 07-08; July 1, 2007 – June 30, 2008) marks the time period when UT Knoxville became a signatory of the ACUPCC. As such, FY 07-08 was selected as the baseline year for measuring the university’s existing and future GHG emissions reduction/carbon offset efforts. The federal government appears poised to adopt a domestic climate bill during 2010. Legislation currently being considered in the U.S. Senate includes provisions to reduce U.S. GHG emissions to 3 percent below 2005 levels in 2012, 20 percent below 2005 levels in 2020, 40 percent below 2005 levels by 2030, and 83 percent below 2005 levels in 20501. Accordingly, UT Knoxville will strive to meet the following target dates and interim milestones for achieving climate neutrality:
• By FY 20-21, reduce/offset GHG emissions to 20 percent below FY 07-08 levels
• By FY 30-31, reduce/offset GHG emissions to 40 percent below FY 07-08 levels
• By FY 40-41, reduce/offset GHG emissions to 60 percent below FY 07-08 levels
• By FY 50-51, reduce/offset GHG emissions to 80 percent below FY 07-08 levels
• By FY 60-61, achieve climate neutrality (zero net GHG emissions)
Current GHG Emissions During FY 08-09, UT Knoxville net GHG emissions (total emissions minus carbon offsets) totaled approximately 243,728 metric tons of carbon dioxide equivalent (MTCDE). Since FY 07-08, the university’s net emissions have decreased by about 6 percent. Moreover, net emissions have decreased for four consecutive years. As noted in the original UT Knoxville GHG emissions inventory2, however, net emissions increased by over 33 percent from FY 90-91 to 07-08.
1 S. 1733, the Clean Energy Jobs and American Power Act. (2009). Accessed 1/14/10 from http://kerry.senate.gov/cleanenergyjobsandamericanpower/pdf/bill.pdf 2 Chinery, LE. (2007). Preliminary Greenhouse Gas Emissions Inventory of the University of Tennessee, Knoxville. Senior project. Accessed 9/1/08 from http://www.cce.utk.edu/energyplan/chinery.pdf.

UT Knoxville Climate Action Plan 4
Purchased electricity is by far the largest source (49 percent) of GHG emissions at UT Knoxville (Figure 1). Other significant emissions sources include the steam plant (25 percent of all emissions), faculty/staff and student commuting (14 percent), electricity transmission and distribution (T&D) losses (5 percent), and solid waste (3 percent). Emissions from university fleet, refrigerants, and air travel together comprised only about 4 percent of FY 08-09 emissions. It is important to note that the GHG emissions reported here represent only a partial picture of the university’s contribution to global climate change. For example, emissions resulting from the manufacturing and transportation of purchased goods have not been estimated. In addition, emissions sources over which the Office of the Chancellor has no direct control, such as UT Athletics Department travel, are not accounted for in the plan.
25%
49%
14%
3%5%
4%
Steam
Plant
Purchased
Electricity
Commuting Solid
Waste
T&D
Losses
Other
Figure 1. UT Knoxville 2008-09 GHG Emissions by Source
Campus Growth Scenarios To provide a baseline for evaluating potential GHG emissions mitigation (reduction/offset) efforts, UT Knoxville’s future emissions were estimated under two scenarios of future growth: the ‘Business As Usual’ Scenario and the ‘Growth Cap Scenario’. The following assumptions are made under the Business As Usual scenario: 1. Building space will increase as anticipated to 17.4 million gross square feet (SF) by FY 20-21 2. Building space will increase by 192,131 SF per year3 from FY 21-22 through FY 60-61 3. Emissions will grow linearly with building space (as SF increases, so will emissions) 4. Purchased electricity will come from the same fuel mix as in FY 08-09 5. University facilities and equipment will operate as efficiently as in FY 08-09 6. Commuting habits, energy use per SF, and waste output per SF will be the same as in FY 08-09 7. Emissions reduction/offset efforts in place during FY 08-09 will continue 8. No further emissions reduction/offset efforts will occur beyond the status quo for FY 08-09
3 From FY 90-91 through FY 08-09, campus building space increase on average 192,131 per year.
UT Knoxville Climate Action Plan 5
For the Growth Cap Scenario, assumptions 1 and 3-8 above still apply. However, assumption 2 is replaced with the assumption that campus would experience zero net growth after FY 20-21. That is, beyond FY 20-21 new building SF would always replace existing building SF so that the net increase in SF is zero.
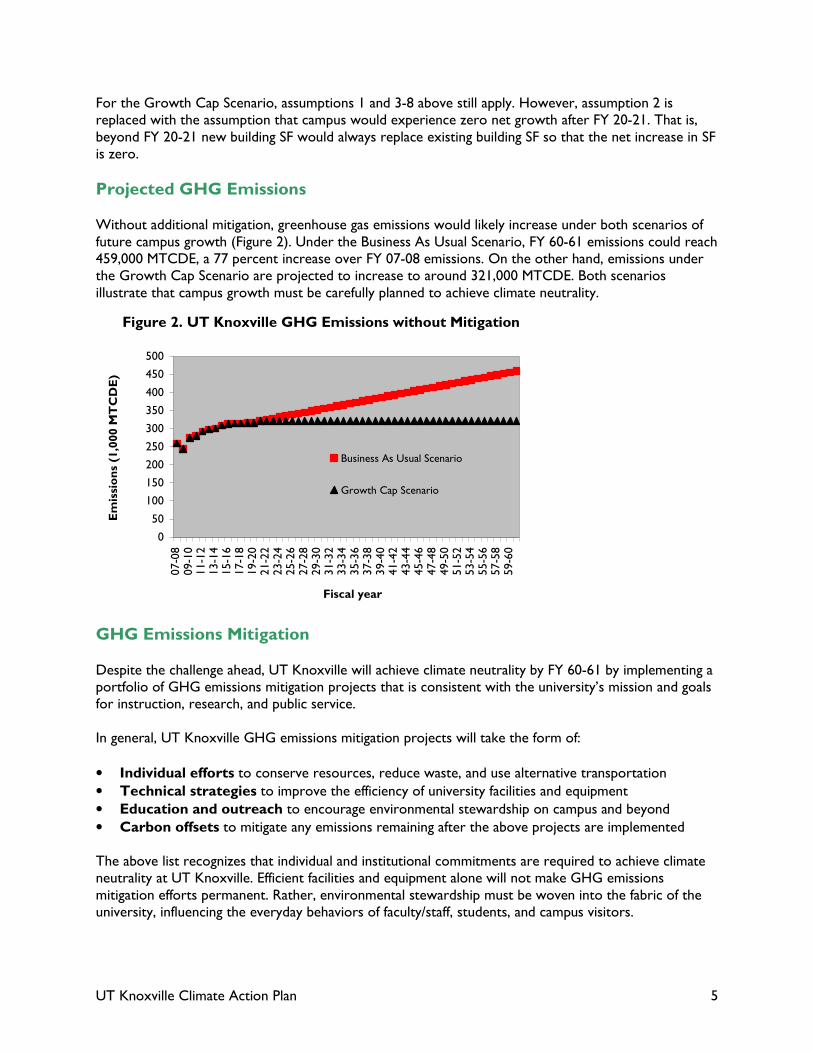
Projected GHG Emissions Without additional mitigation, greenhouse gas emissions would likely increase under both scenarios of future campus growth (Figure 2). Under the Business As Usual Scenario, FY 60-61 emissions could reach 459,000 MTCDE, a 77 percent increase over FY 07-08 emissions. On the other hand, emissions under the Growth Cap Scenario are projected to increase to around 321,000 MTCDE. Both scenarios illustrate that campus growth must be carefully planned to achieve climate neutrality.
0
50
100
150
200
250
300
350
400
450
500
07-08
09-10
11-12
13-14
15-16
17-18
19-20
21-22
23-24
25-26
27-28
29-30
31-32
33-34
35-36
37-38
39-40
41-42
43-44
45-46
47-48
49-50
51-52
53-54
55-56
57-58
59-60
Fiscal year
Emissions (1,000 MTCDE)
Business As Usual Scenario
Growth Cap Scenario
Figure 2. UT Knoxville GHG Emissions without Mitigation
GHG Emissions Mitigation Despite the challenge ahead, UT Knoxville will achieve climate neutrality by FY 60-61 by implementing a portfolio of GHG emissions mitigation projects that is consistent with the university’s mission and goals for instruction, research, and public service. In general, UT Knoxville GHG emissions mitigation projects will take the form of:
• Individual efforts to conserve resources, reduce waste, and use alternative transportation
• Technical strategies to improve the efficiency of university facilities and equipment
• Education and outreach to encourage environmental stewardship on campus and beyond
• Carbon offsets to mitigate any emissions remaining after the above projects are implemented The above list recognizes that individual and institutional commitments are required to achieve climate neutrality at UT Knoxville. Efficient facilities and equipment alone will not make GHG emissions mitigation efforts permanent. Rather, environmental stewardship must be woven into the fabric of the university, influencing the everyday behaviors of faculty/staff, students, and campus visitors.

UT Knoxville Climate Action Plan 6
Table 1. Conceptual Portfolio of UT Knoxville GHG Emissions Reduction Projects
Probable Projects Start FY
Expected Lifetime (years)
Total Costs ($)
Total Savings ($)
NPV ($)
IRR (%)
Total Emissions Reduction (MTCDE)
1: Replace building transformers - multiple buildings 10-11 30 1,000,000 951,708 (540,625) <0 4,004
2: Upgrade interior lighting - multiple buildings 10-11 10 6,200,000 8,857,143 981,213 9.0% 64,527
3: Replace windows - Dabney/Buehler & Nielsen Physics 10-11 30 1,000,000 600,000 (677,179) <0 5,837
4: Upgrade chilled water plant & HVAC controls - multiple buildings 10-11 20 6,100,000 12,200,000 1,882,046 8.9% 118,690
5: Upgrade exterior lighting - multiple locations 10-11 20 1,000,000 2,857,143 869,332 15.6% 20,815
6: Upgrade HVAC, lighting and plumbing - Austin Peay & Alumni Memorial 10-11 15 1,500,000 2,250,000 134,796 6.5% 16,392
7: Replace windows - Austin Peay & Alumni Memorial 10-11 30 1,500,000 900,000 (1,015,768) <0 8,756
8: Purchase additional green power 09-10 12 828,000 0 (603,868) -- 15,197
9: Design & install on-campus photovoltaic system 09-10 24 400,000 198,589 (270,713) <0 887
10: Upgrade interior lighting - Veterinary Teaching Library 10-11 10 75,000 107,143 11,870 9.0% 781
11: Replace roofs - Alumni Memorial & HPER 10-11 20 1,350,000 139,196 (1,263,207) <0 937
12: Design new buildings to use 20% less electricity per SF than existing buildings 10-11 11 0 812,247 650,130 -- 38,356
13: Reduce electricity use per SF in existing buildings to 10% below FY 07-08 average 09-10 12 0 29,639,177 21,371,277 -- 175,978
Possible Projects A1: Launch energy managers program
10-11 11 4,620,000 31,709,568 19,987,697 -- 257,081
A2: Compost 100% of green waste 10-11 11 10,950 0 (8,269) -- 3,422
A3: Meet 20% fleet fuel demand with alternative fuels 10-11 11 4,097,023 3,404,290 (496,582) -- 6,493
A4: Run natural gas-fired turbine generator 24-7 10-11 11 44,354,166 32,026,631 (9,460,782) -- 6,268
A5: Install smart power strips in residence halls 10-11 2 76,707 166,544 85,872 -- 1,213
A6: Reduce car commuting miles per year to 25% below FY 07-08 average 10-11 11 ??? ??? ??? ??? 52,018
A7: Divert 30% of waste from landfill by FY 20-21 10-11 11 726,000 2,569,147 1,278,391 -- 20,327
A8: Use portion of 'Green Fee' to launch major energy efficiency project 20-21 10 4,421,834 4,421,834 (836,690) 0.0% 21,412
A9: Reinvest savings from ARRA projects into major energy efficiency project 40-41 10 0 28,755,189 23,314,195 -- 83,345
A10: Assume FY 20-21 purchased electricity is 50% nuclear, hydro and renewables 20-21 ??? ??? 0 ??? -- 31,218 /yr
S1: Use only natural gas to produce campus steam with current boilers 10-21 11 16,322,683 11,000,000 (4,583,661) <0 57,807
S2: Same as S1, but produce 50,000 lbs per hr of campus steam using biomass 10-21 11 15,246,144 62,387,878 35,256,699 -- 282,071

UT Knoxville Climate Action Plan 7
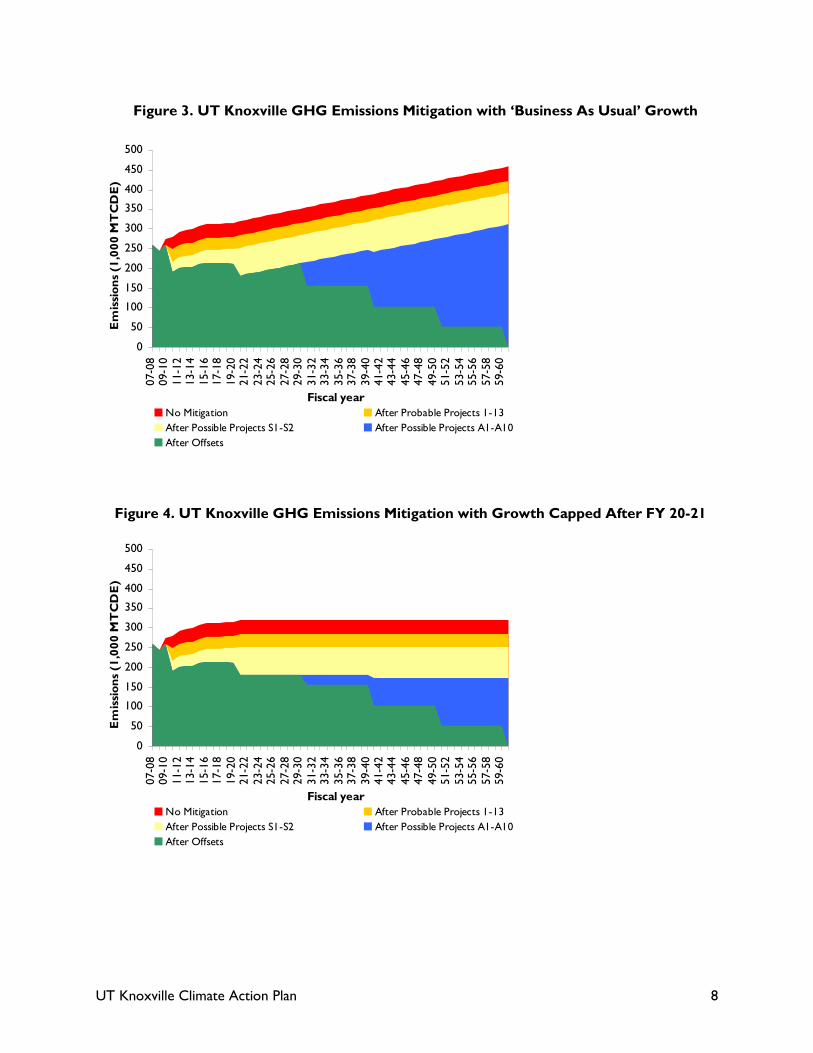
A conceptual portfolio of UT Knoxville GHG emissions reduction projects is shown on the preceding page (Table 1). The portfolio lists ‘probable’ and ‘possible’ projects that, if implemented, would help the university achieve climate neutrality by FY 60-61 (see Appendix A for a summary of each project). Probable projects are initiatives that can be implemented at no additional cost or have been proposed for existing sources of funding in FY 09-10. Conversely, possible projects are not yet funded and would require support from the campus community and, in some cases, changes to university policy to be implemented. Included in the list of ‘possible’ projects are two scenarios for reducing GHG emissions from the campus steam plant. Presently, the plant has two coal-fired boilers, two natural gas-fired boilers, and one boiler that can be fired with either coal or natural gas. Under project S1, only natural gas would be used to produce campus steam with the current boilers. For project S2, steam would be generated using only natural gas and biomass. If implemented, projects S1 and S2 would significantly reduce GHG emissions from the steam plant. However, the university has not ruled out the possibility of burning coal at the steam plant. The Facilities Services Department has contracted with an engineering firm to develop a financially acceptable plan for reducing GHG emissions from steam plant operations. To a large degree, the effectiveness of GHG emissions mitigation efforts will be dictated by future campus growth. Assuming ‘Business As Usual’ growth, the conceptual portfolio of projects (Table 1) would reduce net emissions projected for FY 60-61 by 147,000 MTCDE (Figure 3). Nevertheless, FY 60-61 emissions would actually be 17 percent above the FY 07-08 level (259,000 MTCDE) under this scenario. If the price of carbon offsets is $30 per MTCDE4, and no further emissions reduction projects occur beyond those listed in the portfolio, it would cost about $9.4 million per year to sustain climate neutrality in FY 60-61 and subsequent years. Greenhouse gas emissions efforts are more cost effective under the Growth Cap Scenario, where zero net campus growth is assumed to take place after FY 20-21 (Figure 4). With this scenario, unmitigated emissions would not increase above the level projected for FY 20-21 (321,000 MTCDE). If implemented, the conceptual portfolio would reduce net emissions to approximately 174,000 MTCDE by FY 60-61. Assuming once again that the price of carbon offsets is $30 per MTCDE, and that no further emissions reduction projects occur beyond those listed in the portfolio, climate neutrality could be attained at a cost of $5.2 million per year from FY 60-61 onward.
Funding Sources Funding for GHG emissions mitigation projects and education/outreach efforts will come from a combination of sources. Probable mitigation projects 1-11 will most likely be supported by the American Recovery and Reinvestment Act (ARRA) and the environmental portion of the student Facilities Fee (‘Green Fee’), which currently generates $875,000 per year for on- and off-campus environmental initiatives. Projects 12-13 can be implemented at no additional cost to the university by continuing highly successful ‘Switch Your Thinking’ energy conservation campaign, and by striving to meet or exceed the requirements of the UT Knoxville Sustainable Building Policy, which specifies that campus renovation and construction projects that cost more than $5 million to meet the minimum standard for LEED certification.
4 The Congressional Budget Office (CBO), a nonpartisan agency that analyzes the fiscal impacts of proposed legislation, predicts that the price of GHG allowances under an EPA cap-and-trade program would be $30 per MTCDE in 2019. For more information, see http://www.cbo.gov/ftpdocs/108xx/doc10864/s1733.pdf
UT Knoxville Climate Action Plan 8
0
50
100
150
200
250
300
350
400
450
50007-08
09-10
11-12
13-14
15-16
17-18
19-20
21-22
23-24
25-26
27-28
29-30
31-32
33-34
35-36
37-38
39-40
41-42
43-44
45-46
47-48
49-50
51-52
53-54
55-56
57-58
59-60
Fiscal year
Emissions (1,000 MTCDE)
No Mitigation After Probable Projects 1-13
After Possible Projects S1-S2 After Possible Projects A1-A10
After Offsets
Figure 3. UT Knoxville GHG Emissions Mitigation with ‘Business As Usual’ Growth
Figure 4. UT Knoxville GHG Emissions Mitigation with Growth Capped After FY 20-21
0
50
100
150
200
250
300
350
400
450
500
07-08
09-10
11-12
13-14
15-16
17-18
19-20
21-22
23-24
25-26
27-28
29-30
31-32
33-34
35-36
37-38
39-40
41-42
43-44
45-46
47-48
49-50
51-52
53-54
55-56
57-58
59-60
Fiscal year
Emissions (1,000 MTCDE)
No Mitigation After Probable Projects 1-13
After Possible Projects S1-S2 After Possible Projects A1-A10
After Offsets

UT Knoxville Climate Action Plan 9
Possible mitigation projects A1, A5, and A7 pay for themselves within 1-4 years and would thus represent wise investments for the university. Additional projects can be financed by reinvesting cost savings from existing (funded) mitigation efforts into a revolving loan fund. Possible project A9 demonstrates the power of this approach: by reinvesting the cumulative $29 million in savings accrued over 30 years from ARRA energy efficiency projects into a revolving loan fund, the university can finance a major energy efficiency project that will further reduce campus energy costs by millions of dollars. At $30 per MTCDE, carbon offsets are an expensive way to achieve climate neutrality. Rather than purchase offsets on the market, UT Knoxville can earn carbon offsets by lending its expertise in energy efficiency and energy conservation to the local community. This concept has been successful at Brown University, where officials launched a $350,000 low-income energy conservation assistance program in greater Providence. The GHG emissions reduced by this off-campus project (through energy saved in participating households) can be claimed by the university as carbon offsets.
Education & Outreach A key component of the ACUPCC is that climate change and sustainability be integrated into the curriculum and educational experience of all students. Over the past several years, UT Knoxville faculty and staff have contributed to this objective by:
• Developing general education courses about climate change and sustainability (see Appendix B)
• Requiring Architecture students to design a LEED building as part of a fourth-year studio project
• Launching UTZero, which challenges students to design zero net energy buildings
• Establishing VENTURE, a living learning community that examines models of sustainable business
• Incorporating sustainability concepts into all College of Architecture and Design courses
• Establishing a minor in sustainability within the Environmental Studies program
• Offering a 12-hour graduate concentration/certificate in sustainable design
• Submitting a proposal to establish a major in sustainability within the College of Arts & Sciences
• Creating STAIR, an interdisciplinary program in sustainability within the College of Engineering
Next Steps This CAP is the first comprehensive attempt to mitigate campus GHG emissions as such represents a major turning point for sustainability efforts at UT Knoxville. The plan provides a foundation for achieving climate neutrality, while educating students and the general public about the importance of sustainability and climate neutrality. As required by the ACUPCC, UT Knoxville will make the CAP publicly available by providing it to the Association for the Advancement of Sustainability in Higher Education (AASHE) for posting and dissemination. As in previous years, an annual GHG emissions inventory will also be submitted to AASHE. Lastly, the university will publish updates to the plan every two years. All members of the UT Knoxville community must play their part in achieving climate neutrality. By demonstrating the merits of environmental stewardship, the faculty/staff, students, and campus visitors can help to ensure that the university remains a high-quality institution with programs and initiatives that prepare students to thrive in a global economy. Achieving climate neutrality is a challenging goal but one that UT Knoxville can and will meet in the years ahead.

UT Knoxville Climate Action Plan 10
Appendix A - Project Summaries This section summarizes the costs, savings and GHG emissions reductions associated with projects in the conceptual portfolio (Table 1). Net Present Value (NPV) is the value today of current and future cash flows related to a project. Internal Rate of Return (IRR) is the average expected return per year over life of project. The following assumptions apply to each project unless otherwise indicated in the project summary:
• O&M costs/savings and depreciation costs are negligible over the lifetime of a project
• Any upfront costs are incurred at the beginning of Year 0 (i.e., before the project starts)
• After Year 0, costs/savings are incurred at the end of the year
• NPV calculations are based on a 5 percent discount rate Project 1: Replace building transformers - multiple buildings Description This project would replace transformers in Perkins Hall, Andy Holt Tower, Communications, Humanities and McClung Tower. Financial Analysis
• Assume that expected lifetime of the transformers would be 30 years.
• Assume that purchased electricity cost will increase each year by $0.0037per kWh, the average annual increase for FY 00-01 thru FY 08-09.
• From July 09 thru Nov 09 purchased electricity cost on average $0.0701 per kWh. So, assume that Year 0 (FY 10-11) purchased electricity will cost $0.0701 + $0.0037 = $0.0738 per kWh.
• Assume that total electricity use in Perkins Hall, Andy Holt Tower, Communications, Humanities and McClung Tower is 16.8 kWh per SF, the FY 08-09 average for campus buildings.
• Assume that transformers would reduce electricity use in these buildings by 3%.
• These buildings represent 3.3% of all campus building space in FY 08-09.
• So, assume that project would reduce total campus electricity use by 3.3% x 3% = 0.1%.
• Total campus electricity use in FY 08-09 was 248,231,135 kWh.
• Thus, assume that project would reduce campus electricity use by 0.1% x 248,231,135 = 248,219 kWh per year.
• Annual savings ($) = annual electricity savings (kWh) x purchased electricity cost ($ per kWh)
Year Costs
Assumed Purchased Electricity Rate
($/kWh) Savings Net Cash Flow
0 $1,000,000 $0.0738 $18,321 ($981,679)
1 $0.0775 $19,245 $19,245
2 $0.0813 $20,170 $20,170
3 $0.0850 $21,094 $21,094
4 $0.0887 $22,018 $22,018

UT Knoxville Climate Action Plan 11
5 $0.0924 $22,943 $22,943
6 $0.0962 $23,867 $23,867
7 $0.0999 $24,791 $24,791
8 $0.1036 $25,716 $25,716
9 $0.1073 $26,640 $26,640
10 $0.1110 $27,564 $27,564
11 $0.1148 $28,488 $28,488
12 $0.1185 $29,413 $29,413
13 $0.1222 $30,337 $30,337
14 $0.1259 $31,261 $31,261
15 $0.1297 $32,186 $32,186
16 $0.1334 $33,110 $33,110
17 $0.1371 $34,034 $34,034
18 $0.1408 $34,959 $34,959
19 $0.1446 $35,883 $35,883
20 $0.1483 $36,807 $36,807
21 $0.1520 $37,732 $37,732
22 $0.1557 $38,656 $38,656
23 $0.1595 $39,580 $39,580
24 $0.1632 $40,505 $40,505
25 $0.1669 $41,429 $41,429
26 $0.1706 $42,353 $42,353
27 $0.1744 $43,277 $43,277
28 $0.1781 $44,202 $44,202
29 $0.1818 $45,126 $45,126
TOTAL $1,000,000 $951,708 ($48,292)
NPV: ($540,625)
IRR: <0
Emissions Reduction
• Emissions reduction from this project would result from electricity savings.
• According to the Clean Air-Cool Planet Campus Carbon Calculator (“GHG emissions calculator”)5, reducing purchased electricity by 248,219 kWh per year would lower emissions as follows:
1. Purchased electricity emissions reduction: 121.5 MTCDE per year 2. T&D emissions reduction: 12.0 MTCDE per year 3. Total reduction: 133.5 MTCDE per year
• Thus, over the 30-year expected lifetime of the building transformers, GHG emissions would be reduced by 30 x 133.5 = 4,004 MTCDE.
5 The Clean Air-Cool Planet Campus Carbon Calculator is the leading tool for assessing campus greenhouse gas emissions among ACUPCC signatory institutions. A copy of the FY 08-09 UT Knoxville GHG emissions inventory is available to the public at http://acupcc.aashe.org.
UT Knoxville Climate Action Plan 12
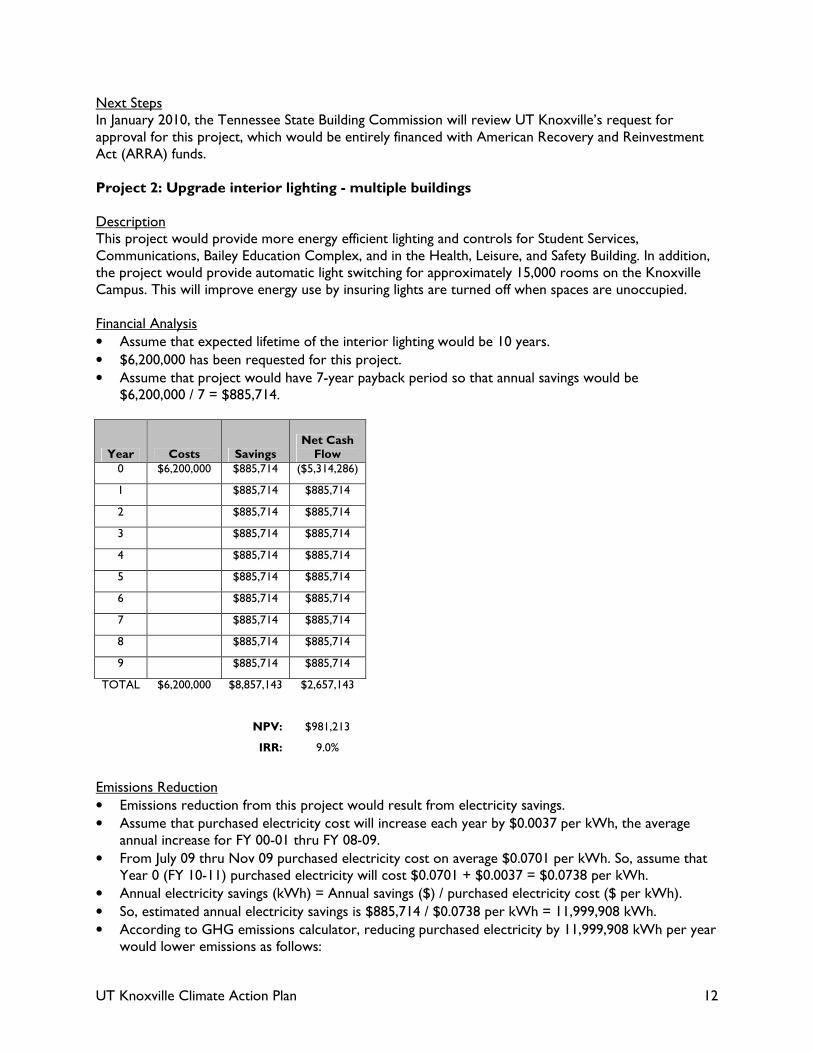
Next Steps In January 2010, the Tennessee State Building Commission will review UT Knoxville’s request for approval for this project, which would be entirely financed with American Recovery and Reinvestment Act (ARRA) funds. Project 2: Upgrade interior lighting - multiple buildings Description This project would provide more energy efficient lighting and controls for Student Services, Communications, Bailey Education Complex, and in the Health, Leisure, and Safety Building. In addition, the project would provide automatic light switching for approximately 15,000 rooms on the Knoxville Campus. This will improve energy use by insuring lights are turned off when spaces are unoccupied. Financial Analysis
• Assume that expected lifetime of the interior lighting would be 10 years.
• $6,200,000 has been requested for this project.
• Assume that project would have 7-year payback period so that annual savings would be $6,200,000 / 7 = $885,714.
Year Costs Savings Net Cash Flow
0 $6,200,000 $885,714 ($5,314,286)
1 $885,714 $885,714
2 $885,714 $885,714
3 $885,714 $885,714
4 $885,714 $885,714
5 $885,714 $885,714
6 $885,714 $885,714
7 $885,714 $885,714
8 $885,714 $885,714
9 $885,714 $885,714
TOTAL $6,200,000 $8,857,143 $2,657,143
NPV: $981,213
IRR: 9.0%
Emissions Reduction
• Emissions reduction from this project would result from electricity savings.
• Assume that purchased electricity cost will increase each year by $0.0037 per kWh, the average annual increase for FY 00-01 thru FY 08-09.
• From July 09 thru Nov 09 purchased electricity cost on average $0.0701 per kWh. So, assume that Year 0 (FY 10-11) purchased electricity will cost $0.0701 + $0.0037 = $0.0738 per kWh.
• Annual electricity savings (kWh) = Annual savings ($) / purchased electricity cost ($ per kWh).
• So, estimated annual electricity savings is $885,714 / $0.0738 per kWh = 11,999,908 kWh.
• According to GHG emissions calculator, reducing purchased electricity by 11,999,908 kWh per year would lower emissions as follows:

UT Knoxville Climate Action Plan 13
1. Purchased electricity emissions reduction: 5,873.1 MTCDE per year 2. T&D emissions reduction: 579.5 MTCDE per year 3. Total reduction: 6,452.7 MTCDE per year
• Thus, over the 10-year expected lifetime of the interior lighting, GHG emissions would be reduced by 10 x 6,452.7 = 64,527 MTCDE
Next Steps Same as for Project 1. Project 3: Replace windows - Dabney/Buehler & Nielsen Physics Description This project would replace leaky single-pane windows at Dabney/Buehler and at Nielsen Physics with more energy efficient windows. Financial Analysis
• Assume that expected lifetime of the windows would be 30 years.
• $1,000,000 has been requested for this project.
• Assume that project would have 50-year payback period so that annual savings would be $1,000,000 / 50 = $20,000.
Year Costs Savings Net Cash Flow
0 $1,000,000 $20,000 ($980,000)
1 $20,000 $20,000
2 $20,000 $20,000
3 $20,000 $20,000
4 $20,000 $20,000
5 $20,000 $20,000
6 $20,000 $20,000
7 $20,000 $20,000
8 $20,000 $20,000
9 $20,000 $20,000
10 $20,000 $20,000
11 $20,000 $20,000
12 $20,000 $20,000
13 $20,000 $20,000
14 $20,000 $20,000
15 $20,000 $20,000
16 $20,000 $20,000
17 $20,000 $20,000
18 $20,000 $20,000
19 $20,000 $20,000
20 $20,000 $20,000

UT Knoxville Climate Action Plan 14
21 $20,000 $20,000
22 $20,000 $20,000
23 $20,000 $20,000
24 $20,000 $20,000
25 $20,000 $20,000
26 $20,000 $20,000
27 $20,000 $20,000
28 $20,000 $20,000
29 $20,000 $20,000
TOTAL $1,000,000 $600,000 ($400,000)
NPV: ($677,179)
IRR: <0
Emissions Reduction
• Emissions reduction from this project would result from steam savings.
• Assume that cost of steam produced at steam plant will increase each year by $0.455 per MMBtu, the average annual increase for 2000-01 thru 2008-09.
• Dec 09 produced steam cost $10.695 per MMBtu so assume Year 0 (FY 10-11) produced steam will cost $10.695 + $0.455 = $11.150 per MMBtu.
• Annual steam savings (MMBtu) = Annual savings ($) / produced steam cost ($ per MMBtu).
• So, estimated annual steam savings is $20,000 / $11.150 per MMBtu = 1,794 MMBtu.
• According to GHG emissions calculator, reducing produced steam by 1,794 MMBtu per year would lower emissions by 194.6 MTCDE per year.
• Thus, over the 30-year expected lifetime of the windows, GHG emissions would be reduced by 30 x 194.6 = 5,837.2 MTCDE.
Next Steps Same as for Project 1. Project 4: Upgrade chilled water plant & HVAC controls - multiple buildings Description This project would extend DDC controls further into buildings such as HPER, SMC, Nielsen Physics, Ellington Plant Sciences and AA where we only have DDC systems installed as far as the air handling and heating equipment. Extended DDC controls will capture room thermostats and some VAV box controllers. The project would also replace pneumatic controls in the Jane & David Bailey Education Complex with DDC, and replace original base DDC controllers at SERF. Further, the project would upgrade chilled water plant control systems at Dabney/Buehler/SERF, Claxton, Stokely Management, Plant Biotechnology, and Music to improve efficiency and reliability of regional chilled water plants on campus.

UT Knoxville Climate Action Plan 15
Financial Analysis
• Assume that expected lifetime of the HVAC controls would be 20 years.
• $6,100,000 has been requested for this project.
• Assume that project would have 10-year payback period so that annual savings would be $6,100,000 / 10 = $610,000.
Year Costs Savings Net Cash Flow
0 $6,100,000 $610,000 ($5,490,000)
1 $610,000 $610,000
2 $610,000 $610,000
3 $610,000 $610,000
4 $610,000 $610,000
5 $610,000 $610,000
6 $610,000 $610,000
7 $610,000 $610,000
8 $610,000 $610,000
9 $610,000 $610,000
10 $610,000 $610,000
11 $610,000 $610,000
12 $610,000 $610,000
13 $610,000 $610,000
14 $610,000 $610,000
15 $610,000 $610,000
16 $610,000 $610,000
17 $610,000 $610,000
18 $610,000 $610,000
19 $610,000 $610,000
TOTAL $6,100,000 $12,200,000 $6,100,000
NPV: $1,882,046
IRR: 8.9%
Emissions Reduction
• Emissions reduction from this project would result from steam savings.
• Assume that cost of steam produced at steam plant will increase each year by $0.455 per MMBtu, the average annual increase for 2000-01 thru 2008-09.
• Dec 09 produced steam cost $10.695 per MMBtu so assume Year 0 (FY 10-11) produced steam will cost $10.695 + $0.455 = $11.150 per MMBtu.
• Annual steam savings (MMBtu) = Annual savings ($) / produced steam cost ($ per MMBtu).
• So, estimated annual steam savings is $610,000 / $11.150 per MMBtu = 54,706 MMBtu.
• According to GHG emissions calculator, reducing produced steam by 54,706 MMBtu per year would lower emissions by 5,934.5 MTCDE per year.

UT Knoxville Climate Action Plan 16
• Thus, over the 20-year expected lifetime of the HVAC controls, GHG emissions would be reduced by 20 x 5,934.5 = 118,689.7 MTCDE.
Next Steps Same as for Project 1. Project 5: Upgrade exterior lighting - multiple locations Description Starting with the Ayres Hill area, this project would upgrade exterior lighting and controls to establish a standard that will improve safety and efficiency of the system. Financial Analysis
• Assume that expected lifetime of the exterior lighting would be 15 years.
• $1,000,000 has been requested for this project.
• Assume that project would have 7-year payback period so that annual savings would be $1,000,000 / 7 = $142,857.
Year Costs Savings Net Cash Flow
0 $1,000,000 $142,857 ($857,143)
1 $142,857 $142,857
2 $142,857 $142,857
3 $142,857 $142,857
4 $142,857 $142,857
5 $142,857 $142,857
6 $142,857 $142,857
7 $142,857 $142,857
8 $142,857 $142,857
9 $142,857 $142,857
10 $142,857 $142,857
11 $142,857 $142,857
12 $142,857 $142,857
13 $142,857 $142,857
14 $142,857 $142,857
15 $142,857 $142,857
16 $142,857 $142,857
17 $142,857 $142,857
18 $142,857 $142,857
19 $142,857 $142,857
TOTAL $1,000,000 $2,857,143 $1,857,143
NPV: $869,332
UT Knoxville Climate Action Plan 17
IRR: 15.6%
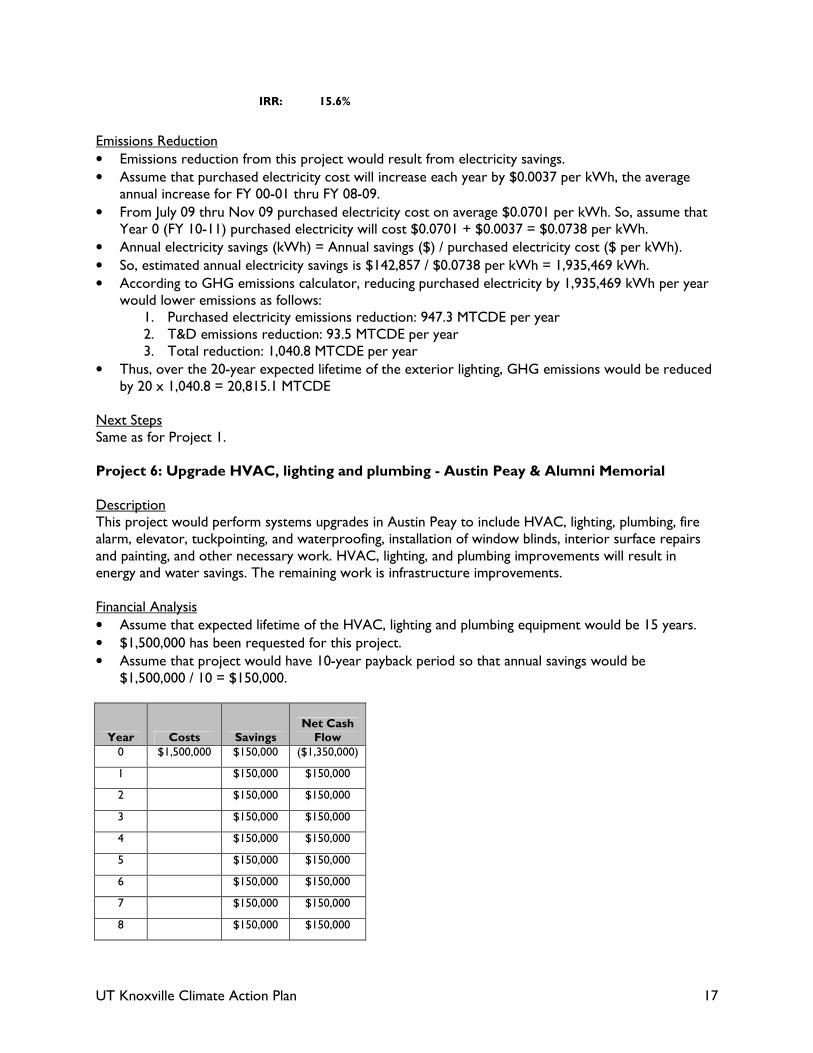
Emissions Reduction
• Emissions reduction from this project would result from electricity savings.
• Assume that purchased electricity cost will increase each year by $0.0037 per kWh, the average annual increase for FY 00-01 thru FY 08-09.
• From July 09 thru Nov 09 purchased electricity cost on average $0.0701 per kWh. So, assume that Year 0 (FY 10-11) purchased electricity will cost $0.0701 + $0.0037 = $0.0738 per kWh.
• Annual electricity savings (kWh) = Annual savings ($) / purchased electricity cost ($ per kWh).
• So, estimated annual electricity savings is $142,857 / $0.0738 per kWh = 1,935,469 kWh.
• According to GHG emissions calculator, reducing purchased electricity by 1,935,469 kWh per year would lower emissions as follows:
1. Purchased electricity emissions reduction: 947.3 MTCDE per year 2. T&D emissions reduction: 93.5 MTCDE per year 3. Total reduction: 1,040.8 MTCDE per year
• Thus, over the 20-year expected lifetime of the exterior lighting, GHG emissions would be reduced by 20 x 1,040.8 = 20,815.1 MTCDE
Next Steps Same as for Project 1. Project 6: Upgrade HVAC, lighting and plumbing - Austin Peay & Alumni Memorial Description This project would perform systems upgrades in Austin Peay to include HVAC, lighting, plumbing, fire alarm, elevator, tuckpointing, and waterproofing, installation of window blinds, interior surface repairs and painting, and other necessary work. HVAC, lighting, and plumbing improvements will result in energy and water savings. The remaining work is infrastructure improvements. Financial Analysis
• Assume that expected lifetime of the HVAC, lighting and plumbing equipment would be 15 years.
• $1,500,000 has been requested for this project.
• Assume that project would have 10-year payback period so that annual savings would be $1,500,000 / 10 = $150,000.
Year Costs Savings Net Cash Flow
0 $1,500,000 $150,000 ($1,350,000)
1 $150,000 $150,000
2 $150,000 $150,000
3 $150,000 $150,000
4 $150,000 $150,000
5 $150,000 $150,000
6 $150,000 $150,000
7 $150,000 $150,000
8 $150,000 $150,000

UT Knoxville Climate Action Plan 18
9 $150,000 $150,000
10 $150,000 $150,000
11 $150,000 $150,000
12 $150,000 $150,000
13 $150,000 $150,000
14 $150,000 $150,000
TOTAL $1,500,000 $2,250,000 $750,000
NPV: $134,796
IRR: 6.5%
Emissions Reduction
• Emissions reduction from this project would result from electricity savings.
• Assume that purchased electricity cost will increase each year by $0.0037 per kWh, the average annual increase for FY 00-01 thru FY 08-09.
• From July 09 thru Nov 09 purchased electricity cost on average $0.0701 per kWh. So, assume that Year 0 (FY 10-11) purchased electricity will cost $0.0701 + $0.0037 = $0.0738 per kWh.
• Annual electricity savings (kWh) = Annual savings ($) / purchased electricity cost ($ per kWh).
• So, estimated annual electricity savings is $150,000 / $0.0738 per kWh = 2,032,243 kWh.
• According to GHG emissions calculator, reducing purchased electricity by 2,032,243 kWh per year would lower emissions as follows:
1. Purchased electricity emissions reduction: 994.6 MTCDE per year 2. T&D emissions reduction: 98.1 MTCDE per year 3. Total reduction: 1,092.8 MTCDE per year
• Thus, over the 15-year expected lifetime of the HVAC, lighting and plumbing equipment, GHG emissions would be reduced by 15 x 1,092.8 = 16,391.9 MTCDE
Next Steps Same as for Project 1. Project 7: Replace windows - Austin Peay & Alumni Memorial Description This project would replace older windows on Austin Peay and Alumni Memorial Building with more energy efficient windows. Financial Analysis
• Assume that expected lifetime of the windows would be 30 years.
• $1,500,000 has been requested for this project.
• Assume that project would have 50-year payback period so that annual savings would be $1,500,000 / 50 = $30,000.
Year Costs Savings Net Cash Flow
0 $1,500,000 $30,000 ($1,470,000)
1 $30,000 $30,000

UT Knoxville Climate Action Plan 19
2 $30,000 $30,000
3 $30,000 $30,000
4 $30,000 $30,000
5 $30,000 $30,000
6 $30,000 $30,000
7 $30,000 $30,000
8 $30,000 $30,000
9 $30,000 $30,000
10 $30,000 $30,000
11 $30,000 $30,000
12 $30,000 $30,000
13 $30,000 $30,000
14 $30,000 $30,000
15 $30,000 $30,000
16 $30,000 $30,000
17 $30,000 $30,000
18 $30,000 $30,000
19 $30,000 $30,000
20 $30,000 $30,000
21 $30,000 $30,000
22 $30,000 $30,000
23 $30,000 $30,000
24 $30,000 $30,000
25 $30,000 $30,000
26 $30,000 $30,000
27 $30,000 $30,000
28 $30,000 $30,000
29 $30,000 $30,000
TOTAL $1,500,000 $900,000 ($600,000)
NPV: ($1,015,768)
IRR: <0
Emissions Reduction
• Emissions reduction from this project would result from steam savings.
• Assume that cost of steam produced at steam plant will increase each year by $0.455 per MMBtu, the average annual increase for 2000-01 thru 2008-09.
• Dec 09 produced steam cost $10.695 per MMBtu so assume Year 0 (FY 10-11) produced steam will cost $10.695 + $0.455 = $11.150 per MMBtu.
• Annual steam savings (MMBtu) = Annual savings ($) / produced steam cost ($ per MMBtu).
• So, estimated annual steam savings is $30,000 / $11.150 per MMBtu = 2,690 MMBtu.

UT Knoxville Climate Action Plan 20
• According to GHG emissions calculator, reducing produced steam by 2,690 MMBtu per year would lower emissions by 291.9 MTCDE per year.
• Thus, over the 30-year expected lifetime of the windows, GHG emissions would be reduced by 30 x 291.9 = 8,755.8 MTCDE.
Next Steps Same as for Project 1. Project 8: Purchase additional green power Description This project would increase the university’s green power purchase from TVA/KUB from 2.5% to 3.6% of purchased electricity effective 1/1/10. Financial Analysis
• For first half of FY 09-10, university purchased 3,500 blocks of green power per month (includes ISSE, Green Fee and general operating fund purchases).
• For second half of 09-10, university would increase purchase by 1,500 blocks per month so that total green power purchase is 5,000 blocks per month.
• At $4 per block, it would cost 1,500 x $4 = $6,000 per month to increase green power purchase to 5,000 blocks per month.
• So additional cost during FY 09-10 would be 6 months x $6,000 per month = $36,000.
• Every year thereafter, additional cost would be 12 months x $6,000 per month = $72,000.
• No savings would be associated with this project.
Year FY Costs Savings Net Cash Flow
0 2009-10 $36,000 $0 ($36,000)
1 2010-11 $72,000 $0 ($72,000)
2 2011-12 $72,000 $0 ($72,000)
3 2012-13 $72,000 $0 ($72,000)
4 2013-14 $72,000 $0 ($72,000)
5 2014-15 $72,000 $0 ($72,000)
6 2015-16 $72,000 $0 ($72,000)
7 2016-17 $72,000 $0 ($72,000)
8 2017-18 $72,000 $0 ($72,000)
9 2018-19 $72,000 $0 ($72,000)
10 2019-20 $72,000 $0 ($72,000)
11 2020-21 $72,000 $0 ($72,000)
TOTAL $828,000 $0 ($828,000)
NPV: ($603,868)
IRR: --

UT Knoxville Climate Action Plan 21
Carbon Offsets
• Under this project, green power purchase would increase by 1,500 blocks starting second half of FY 09-10.
• Each block of green power generates 150 kWh of energy.
• So, during Year 0 (FY 09-10), project would generate 1,500 blocks per month x 6 months x 150 kWh per block = 1,350,000 kWh of green power.
• Every year thereafter, project would generate 1,500 blocks per month x 12 months x 150 kWh per block = 2,700,000 kWh of green power.
• According to GHG emissions calculator, purchasing 1,350,000 kWh and 2,700,000 kWh of green power would lower emissions by 660.7 MTCDE and 1,321.5 MTCDE, respectively.
• Thus, from FY 09-10 thru FY 20-21, project would reduce GHG emissions by 660.7 MTCDE + (11 x 1,321.5 MTCDE) = 15,196.9 MTCDE.
Next Steps This project would be supported with funds generated by the Green Fee. Approval from the Facilities Oversight Committee is needed before the project may proceed. Project 9: Design & install on-campus photovoltaic system Description This project would setup a revolving funding for designing and installing a large photovoltaic system on campus. The committee which recommends how to spend Green Fee funds has suggested to start with four years at $100,000 per year, then to re-evaluate. The first $100,000 would be used to evaluate sites, and install a system(s), if possible. Financial Analysis
• Assume that expected lifetime of the photovoltaic system would be 20 years.
• Assume that energy generated by photovoltaic system would be consumed on campus as electricity rather than sold back to TVA as carbon offsets.
• Assume $400,000 total budget would be sufficient to site, purchase and install a 50 kW photovoltaic system6
• Per TVA, a 10 kW PV system located in the Tennessee Valley will generate approximately 16,500 kWh of energy per year7. So, assume that a 50 kW system would generate 5 x 16,500 = 82,500 kWh of energy per year.
• Assume system is in operation by end of fourth year of project.
• Assume that purchased electricity cost will increase each year by $0.0037per kWh, the average annual increase for FY 00-01 thru FY 08-09.
• From July 09 thru Nov 09 purchased electricity cost on average $0.0701 per kWh. So, assume that Year 4 (FY 13-14) purchased electricity will cost $0.0701 + (4 years x $0.0037 increase per year) = $0.0850 per kWh.
• Annual savings ($) = annual electricity savings (kWh) x purchased electricity cost ($ per kWh)
6 Similar $400,000 50 kW photovoltaic systems are described in the Chatham University Climate Action Plan 2009 and WildCAP: The University of New Hampshire’s Climate Action Plan. Both accessed 12/12/09 from http://acupcc.aashe.org. 7 See http://www.tva.gov/greenpowerswitch/solar_faq.htm.

UT Knoxville Climate Action Plan 22
Financial Analysis
Year Costs
Assumed Purchased Electricity Rate
($/kWh) Savings Net Cash Flow
0 $100,000 $0.0701 $0 ($100,000)
1 $100,000 $0.0738 $0 ($100,000)
2 $100,000 $0.0775 $0 ($100,000)
3 $100,000 $0.0813 $0 ($100,000)
4 $0.0850 $7,011 $7,011
5 $0.0887 $7,318 $7,318
6 $0.0924 $7,625 $7,625
7 $0.0962 $7,933 $7,933
8 $0.0999 $8,240 $8,240
9 $0.1036 $8,547 $8,547
10 $0.1073 $8,854 $8,854
11 $0.1110 $9,161 $9,161
12 $0.1148 $9,469 $9,469
13 $0.1185 $9,776 $9,776
14 $0.1222 $10,083 $10,083
15 $0.1259 $10,390 $10,390
16 $0.1297 $10,698 $10,698
17 $0.1334 $11,005 $11,005
18 $0.1371 $11,312 $11,312
19 $0.1408 $11,619 $11,619
20 $0.1446 $11,926 $11,926
21 $0.1483 $12,234 $12,234
22 $0.1520 $12,541 $12,541
23 $0.1557 $12,848 $12,848
TOTAL $400,000 $198,589 ($201,411)
NPV: ($270,713)
IRR: <0
Emissions Reduction
• Emissions reduction from this project would result from 82,500 kWh in electricity savings.
• Assume electricity savings would begin in the fifth year of the project, after system is operation.
• According to GHG emissions calculator, reducing purchased electricity by 82,500 kWh per year would lower emissions as follows:
1. Purchased electricity emissions reduction: 40.4 MTCDE per year

UT Knoxville Climate Action Plan 23
2. T&D emissions reduction: 4.0 MTCDE per year 3. Total reduction: 44.4 MTCDE per year
• Thus, over the 20-year expected lifetime of the photovoltaic system, GHG emissions would be reduced by 20 x 44.4 MTCDE = 887.2 MTCDE
Next Steps Same as for Project 8. Project 10: Upgrade interior lighting - Veterinary Teaching Library Description This project would replace high wattage lighting with lower wattage lighting saving electricity directly, and air conditioning from the lower heat production. Financial Analysis
• Assume that expected lifetime of the interior lighting would be 10 years.
• $75,000 has been requested for this project.
• Assume that project would have 7-year payback period so that annual savings would be $75,000 / 7 = $10,714.
Year Costs Savings
Net Cash Flow
0 $75,000 $10,714 ($64,286)
1 $10,714 $10,714
2 $10,714 $10,714
3 $10,714 $10,714
4 $10,714 $10,714
5 $10,714 $10,714
6 $10,714 $10,714
7 $10,714 $10,714
8 $10,714 $10,714
9 $10,714 $10,714
TOTAL $75,000 $107,143 $32,143
NPV: $11,870
IRR: 9.0%
Emissions Reduction
• Emissions reduction from this project would result from electricity savings.
• Assume that purchased electricity cost will increase each year by $0.0037 per kWh, the average annual increase for FY 00-01 thru FY 08-09.
• From July 09 thru Nov 09 purchased electricity cost on average $0.0701 per kWh. So, assume that Year 0 (FY 10-11) purchased electricity will cost $0.0701 + $0.0037 = $0.0738 per kWh.
• Annual electricity savings (kWh) = Annual savings ($) / purchased electricity cost ($ per kWh).
• So, estimated annual electricity savings is $10,714 / $0.0738 per kWh = 145,160 kWh.

UT Knoxville Climate Action Plan 24
• According to GHG emissions calculator, reducing purchased electricity by 145,160 kWh per year would lower emissions as follows:
1. Purchased electricity emissions reduction: 71.0 MTCDE per year 2. T&D emissions reduction: 7.0 MTCDE per year 3. Total reduction: 78.1 MTCDE per year
• Thus, over the 10-year expected lifetime of the interior lighting, GHG emissions would be reduced by 10 x 78.1 MTCDE = 781 MTCDE
Next Steps Same as for Project 8. Project 11: Replace roofs - Alumni Memorial & HPER Description This project would replace leaking roof systems on Alumni Memorial Building and the HPER building. Emissions Reduction (note: financial analysis follows)
• Emissions reduction from this project would result from steam savings.
• Per DOE, substituting 1,000 SF of cool white roofing for standard gray roofing provides a one-time (not annual) offset of about 10 MTCDE8.
• Emissions reduction listed in the table below is spread out over the assumed 20-year lifetime of the roofs.
Assumed Roof Life (years)
AMB Roof Area (SF)
HPER Roof Area (SF)
Total Roof Area
(SF)
One-Time
Emissions Reduction (MTCDE)
Total Annual Emissions Reduction (MTCDE)
20 33,013 60,654 93,667 936.7 46.8
Financial Analysis
• $1,350,000 has been requested for this project.
• Assume that using cool white roofing material would not add to project cost.
• According to GHG emissions calculator, a 46.8 MTCDE reduction in emissions is equivalent to reducing steam production by 449.75 MMBtu per year.
• Assume that cost of steam produced at steam plant will increase each year by $0.455 per MMBtu, the average annual increase for 2000-01 thru 2008-09.
• Dec 09 produced steam cost $10.695 per MMBtu so assume Year 0 (FY 10-11) produced steam will cost $10.695 + $0.455 = $11.150 per MMBtu.
• Annual savings ($) = Annual steam savings (MMBtu) x produced steam cost ($ per MMBtu).
8 Ronnen, L. (2009). Cool Roof Q & A (draft). Lawrence Berkeley National Laboratory. Accessed 10/1/09 from http://coolcolors.lbl.gov/assets/docs/fact-sheets/Cool-roof-Q%2BA.pdf.

UT Knoxville Climate Action Plan 25
Year Costs
Assumed Steam Rate
($/MMBtu) Savings Net Cash Flow
0 $1,350,000 11.15 $5,015 ($1,344,985)
1 11.61 $5,220 $5,220
2 12.06 $5,424 $5,424
3 12.52 $5,629 $5,629
4 12.97 $5,834 $5,834
5 13.43 $6,039 $6,039
6 13.88 $6,243 $6,243
7 14.34 $6,448 $6,448
8 14.79 $6,653 $6,653
9 15.25 $6,857 $6,857
10 15.70 $7,062 $7,062
11 16.16 $7,267 $7,267
12 16.61 $7,472 $7,472
13 17.07 $7,676 $7,676
14 17.52 $7,881 $7,881
15 17.98 $8,086 $8,086
16 18.43 $8,290 $8,290
17 18.89 $8,495 $8,495
18 19.34 $8,700 $8,700
19 19.80 $8,905 $8,905
TOTAL $1,350,000 $139,196 ($1,210,804)
NPV: ($1,263,207)
IRR: <0
Next Steps Same as for Project 1. Project 12: Design new buildings to use 20% less electricity per SF than existing buildings Description This project would design and construct new buildings from FY 2010-11 onward to use 20 percent less electricity per SF than the average for buildings in existence during FY 2007-08. The project is supported by the UT Knoxville Sustainable Building Policy, which specifies that construction and renovation projects costing over $5 million will meet the minimum standards for Leadership in Energy and Environmental Design (LEED) certification.
UT Knoxville Climate Action Plan 26
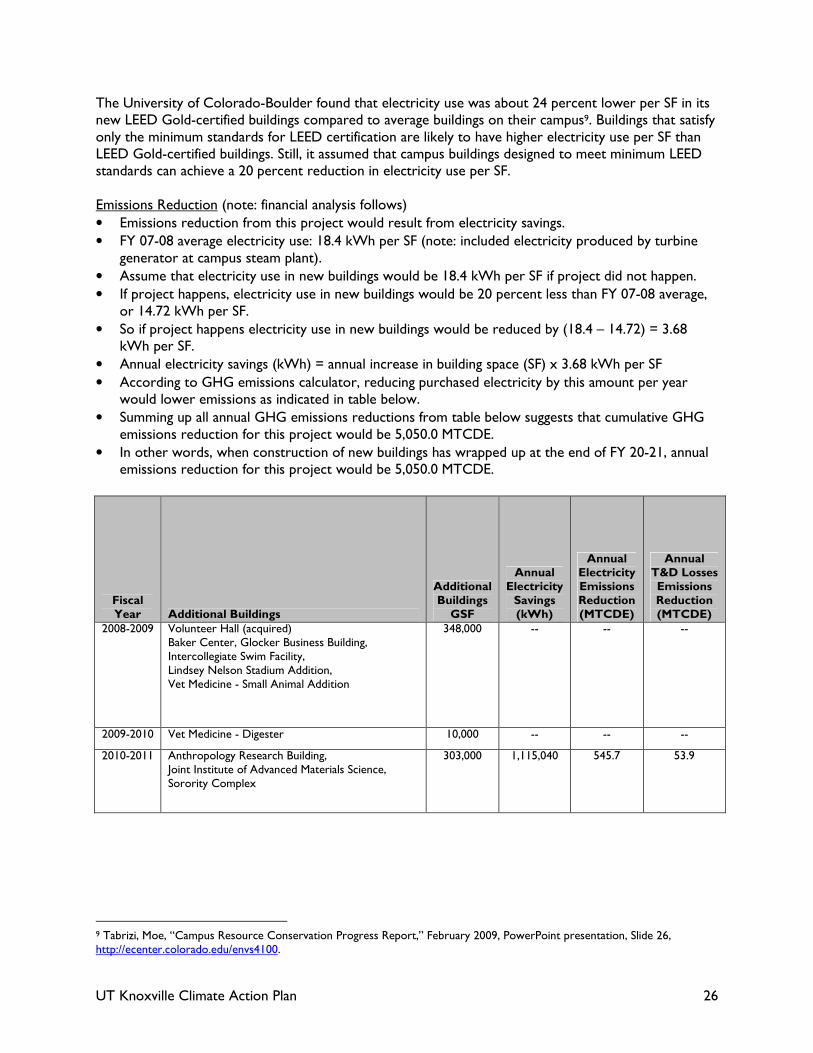
The University of Colorado-Boulder found that electricity use was about 24 percent lower per SF in its new LEED Gold-certified buildings compared to average buildings on their campus9. Buildings that satisfy only the minimum standards for LEED certification are likely to have higher electricity use per SF than LEED Gold-certified buildings. Still, it assumed that campus buildings designed to meet minimum LEED standards can achieve a 20 percent reduction in electricity use per SF. Emissions Reduction (note: financial analysis follows)
• Emissions reduction from this project would result from electricity savings.
• FY 07-08 average electricity use: 18.4 kWh per SF (note: included electricity produced by turbine generator at campus steam plant).
• Assume that electricity use in new buildings would be 18.4 kWh per SF if project did not happen.
• If project happens, electricity use in new buildings would be 20 percent less than FY 07-08 average, or 14.72 kWh per SF.
• So if project happens electricity use in new buildings would be reduced by (18.4 – 14.72) = 3.68 kWh per SF.
• Annual electricity savings (kWh) = annual increase in building space (SF) x 3.68 kWh per SF
• According to GHG emissions calculator, reducing purchased electricity by this amount per year would lower emissions as indicated in table below.
• Summing up all annual GHG emissions reductions from table below suggests that cumulative GHG emissions reduction for this project would be 5,050.0 MTCDE.
• In other words, when construction of new buildings has wrapped up at the end of FY 20-21, annual emissions reduction for this project would be 5,050.0 MTCDE.
Fiscal Year Additional Buildings
Additional Buildings GSF
Annual Electricity Savings (kWh)
Annual Electricity Emissions Reduction (MTCDE)
Annual T&D Losses Emissions Reduction (MTCDE)
2008-2009 Volunteer Hall (acquired) Baker Center, Glocker Business Building, Intercollegiate Swim Facility, Lindsey Nelson Stadium Addition, Vet Medicine - Small Animal Addition
348,000 -- -- --
2009-2010 Vet Medicine - Digester 10,000 -- -- --
2010-2011 Anthropology Research Building, Joint Institute of Advanced Materials Science, Sorority Complex
303,000 1,115,040 545.7 53.9
9 Tabrizi, Moe, “Campus Resource Conservation Progress Report,” February 2009, PowerPoint presentation, Slide 26, http://ecenter.colorado.edu/envs4100.
UT Knoxville Climate Action Plan 27
2011-2012 Civil & Industrial Engineering Building, McKenzie-Lawson Addition, Min Kao Electrical & Computer Engineering Building, Music Building, Student Health, Vet Medicine - Large Animal Addition
679,000 2,498,720 1,223.0 120.7
2012-2013 Audiology & Speech Pathology Clinics, Field House, Strong Hall
290,000 1,067,200 522.3 51.5
2013-2014 Earth & Planetary Sciences Renovation, University Center, UTIA Office Building
135,000 496,800 243.1 24.0
2014-2015 Academic Facility (Stokely Site), Forestry Building, Parking Garage - Stokely Site
440,000 1,619,200 792.5 78.2
2015-2016 Parking Garage - Cherokee Campus, Research Facility
305,000 1,122,400 549.3 54.2
2016-2017 Fraternity Renovations & Additions 30,000 110,400 54.0 5.3
2017-2018 -- 0 0 0.0 0.0
2018-2019 College of Nursing Addition, Walters Life Sciences Addition
70,000 257,600 126.1 12.4
2019-2020 -- 0 0 0.0 0.0
2020-2021 Clarence Brown Theatre & Performance Complex, Jessie Harris Addition, Perkins Hall Addition
300,000 1,104,000 540.3 53.3
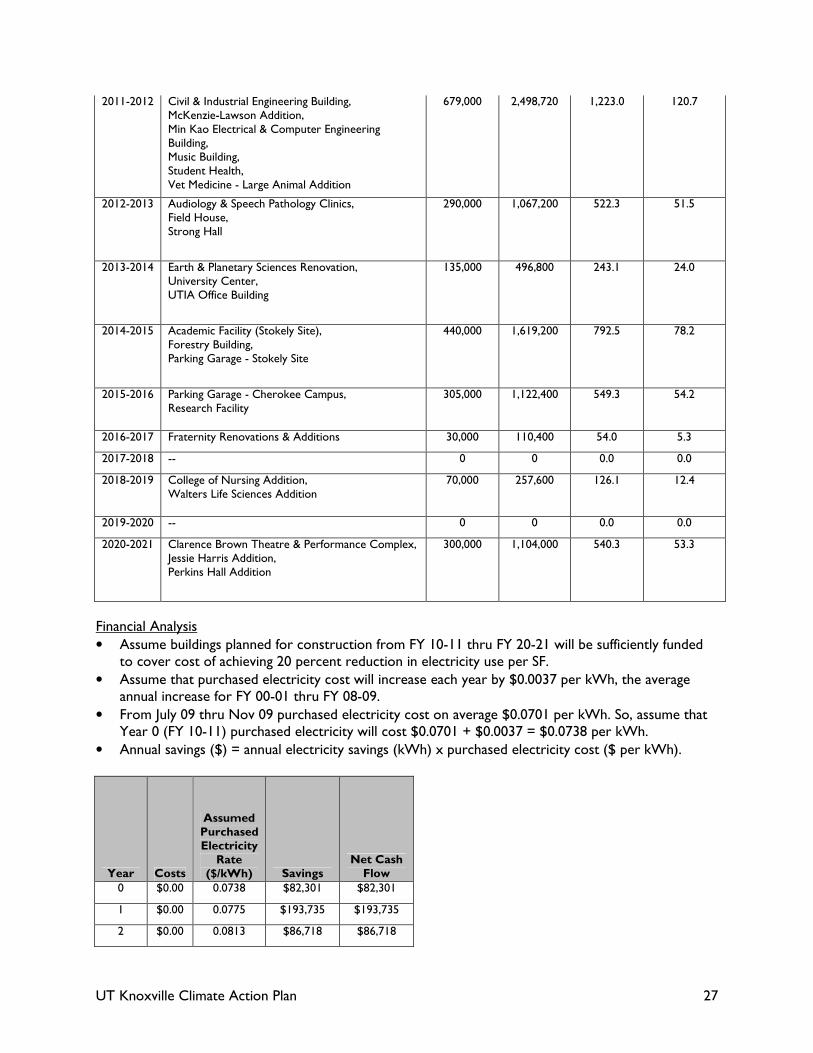
Financial Analysis
• Assume buildings planned for construction from FY 10-11 thru FY 20-21 will be sufficiently funded to cover cost of achieving 20 percent reduction in electricity use per SF.
• Assume that purchased electricity cost will increase each year by $0.0037 per kWh, the average annual increase for FY 00-01 thru FY 08-09.
• From July 09 thru Nov 09 purchased electricity cost on average $0.0701 per kWh. So, assume that Year 0 (FY 10-11) purchased electricity will cost $0.0701 + $0.0037 = $0.0738 per kWh.
• Annual savings ($) = annual electricity savings (kWh) x purchased electricity cost ($ per kWh).
Year Costs
Assumed Purchased Electricity Rate
($/kWh) Savings Net Cash Flow
0 $0.00 0.0738 $82,301 $82,301
1 $0.00 0.0775 $193,735 $193,735
2 $0.00 0.0813 $86,718 $86,718

UT Knoxville Climate Action Plan 28
3 $0.00 0.0850 $42,219 $42,219
4 $0.00 0.0887 $143,631 $143,631
5 $0.00 0.0924 $103,742 $103,742
6 $0.00 0.0962 $10,615 $10,615
7 $0.00 0.0999 $0 $0
8 $0.00 0.1036 $26,687 $26,687
9 $0.00 0.1073 $0 $0
10 $0.00 0.1110 $122,597 $122,597
TOTAL $0.00 $812,246.66 $812,246.66
NPV: $650,130
IRR: --
Next Steps If buildings are constructed as planned, assume no additional steps would be necessary (i.e., by default, buildings would be designed to use 20 percent less electricity per SF). Project 13: Reduce electricity use per SF in existing buildings to 10% below FY 07-08 average Description For campus buildings in existence as of FY 09-10, this project would reduce electricity use per SF to 16.56 kWh per SF, i.e. 10 percent below the average electricity use per SF observed in FY 07-08. Emissions Reduction (note: financial analysis follows)
• Emissions reduction from this project would result from electricity savings.
• FY 07-08 average electricity use: 18.4 kWh per SF (note: included electricity produced by turbine generator at campus steam plant).
• Assume that electricity use in existing buildings would be 18.4 kWh per SF if project did not happen.
• If project happens, electricity use in existing buildings would be 10 percent less than FY 07-08 average, or 16.56 kWh per SF.
• So if project happens electricity use in existing buildings would be reduced by (18.4 – 16.56) = 1.84 kWh per SF.
• Annual electricity savings (kWh) = FY 09-10 building space (SF) x 1.84 kWh per SF = 27,271,851 kWh
• According to GHG emissions calculator, reducing purchased electricity by 27,271,851 kWh per year would lower emissions as follows:
4. Purchased electricity emissions reduction: 13,347.7 MTCDE per year 5. T&D emissions reduction: 1,317.1 MTCDE per year Total reduction: 14,664.8 MTCDE per year
• Thus, from FY 09-10 thru FY 20-21, GHG emissions would be reduced by 12 x 14,664.8 MTCDE = 175,977.6 MTCDE

UT Knoxville Climate Action Plan 29
Financial Analysis
• Assume project could be implemented at no additional cost to university by indefinitely extending the highly successful ‘Switch Your Thinking’ campus energy conservation campaign.
• Assume that purchased electricity cost will increase each year by $0.0037 per kWh, the average annual increase for FY 00-01 thru FY 08-09.
• From July 09 thru Nov 09 purchased electricity cost on average $0.0701 per kWh. So, assume that Year 0 (FY 09-10) purchased electricity will cost $0.0701 per kWh.
• Annual savings ($) = annual electricity savings (27,271,851 kWh) x purchased electricity cost ($ per kWh).
Year Costs
Assumed Purchased Electricity Rate
($/kWh) Savings Net Cash Flow
0 $0.00 $0.0701 $1,911,384 $1,911,384
1 $0.00 $0.0738 $2,012,938 $2,012,938
2 $0.00 $0.0775 $2,114,492 $2,114,492
3 $0.00 $0.0813 $2,216,046 $2,216,046
4 $0.00 $0.0850 $2,317,600 $2,317,600
5 $0.00 $0.0887 $2,419,154 $2,419,154
6 $0.00 $0.0924 $2,520,709 $2,520,709
7 $0.00 $0.0962 $2,622,263 $2,622,263
8 $0.00 $0.0999 $2,723,817 $2,723,817
9 $0.00 $0.1036 $2,825,371 $2,825,371
10 $0.00 $0.1073 $2,926,925 $2,926,925
11 $0.00 $0.1110 $3,028,479 $3,028,479
TOTAL $0.00 $29,639,177.10 $29,639,177.10
NPV: $21,371,277
IRR: --
Next Steps Project would require continued support from the campus community for energy conservation. Project A1: Launch energy managers program Description This project would hire and train six staff to conduct weekly energy audits of campus buildings and educate building occupants about conservation and efficiency efforts. Program would be modeled after highly successful similar initiative at Oklahoma State University.

UT Knoxville Climate Action Plan 30
Emissions Reduction (note: financial analysis follows)
• Emissions reduction from this project would result from electricity savings.
• Assume same reduction as that observed at Oklahoma State University: 23,371 MTCDE per year or 257,081 MTCDE if project is implemented from FY 10-11 thru FY 20-21.
Financial Analysis
• According to GHG emissions calculator, a 23,371 MTCDE reduction in emissions is equivalent to reducing annual electricity use by 31,188,851 kWh.
• Assume that purchased electricity cost will increase each year by $0.0037 per kWh, the average annual increase for FY 00-01 thru FY 08-09.
• From July 09 thru Nov 09 purchased electricity cost on average $0.0701 per kWh. So, assume that Year 0 (FY 10-11) purchased electricity will cost $0.0701 + $0.0037 = $0.0738 per kWh.
• Assume that all costs and savings are incurred at end of year.
• Assume no salary or benefit increases occur from FY 10-11 thru FY 20-21.
• Annual savings ($) = annual electricity savings (31,188,851 kWh) x purchased electricity cost ($ per kWh).
Year Costs
Assumed Purchased Electricity Rate
($/kWh) Savings Net Cash Flow
0 $420,000 $0.0738 $2,302,000 $1,882,000
1 $420,000 $0.0775 $2,418,138 $1,998,138
2 $420,000 $0.0813 $2,534,275 $2,114,275
3 $420,000 $0.0850 $2,650,413 $2,230,413
4 $420,000 $0.0887 $2,766,550 $2,346,550
5 $420,000 $0.0924 $2,882,688 $2,462,688
6 $420,000 $0.0962 $2,998,826 $2,578,826
7 $420,000 $0.0999 $3,114,963 $2,694,963
8 $420,000 $0.1036 $3,231,101 $2,811,101
9 $420,000 $0.1073 $3,347,238 $2,927,238
10 $420,000 $0.1110 $3,463,376 $3,043,376
TOTAL $4,620,000 $31,709,568 $27,089,568
NPV: $19,987,697
IRR: --
Next Steps Must secure funding before project can be implemented.

UT Knoxville Climate Action Plan 31
Project A2: Compost 100% of green waste Description This project would compost 100 percent of leaves, wood debris, wood pallets and other 'green waste' collected from campus grounds. Assume project would be implemented simultaneously with Project A2: Compost 100% of green waste. Financial Analysis
• Assume total green waste stays same thru FY 20-21
• FY 08-09 non-construction and demolition (C&D) solid waste total = 8,292.2 tons; related emissions = 1,990.8 MTCDE
• FY 08-09 on-campus composting = 77 tons; related emissions reduction = 29.5 MTCDE
• Per UT Knoxville Environmental Coordinator Jay Price, assume green waste composting would reduce non-C&D solid waste by 6 percent (497.72 tons) to 7,794.48 tons
• Accordingly, composting off-campus composting would increase by 497.72 tons to 574.72 tons
• In FY 09-10 off-campus green waste composting costs $2 / ton more than non-C&D solid waste to haul and dispose. Assume that FY 10-11 cost differential is same.
• Assume that all costs and savings are incurred at end of year.
Year Costs Savings Net Cash Flow
0 $995 $0 ($995)
1 $995 $0 ($995)
2 $995 $0 ($995)
3 $995 $0 ($995)
4 $995 $0 ($995)
5 $995 $0 ($995)
6 $995 $0 ($995)
7 $995 $0 ($995)
8 $995 $0 ($995)
9 $995 $0 ($995)
10 $995 $0 ($995)
TOTAL $10,949.84 $0.00 ($10,949.84)
NPV: ($8,269)
IRR: --
Emissions Reduction
• Emissions reduction from this project would result from waste reduction.
• Note: GHG emissions calculator only accounts for on-campus composting emissions.
• Assume off-campus composting emissions same as on-campus composting emissions b/c off-campus composting facility is within 2 miles of the university.
• Emissions associated with 7,794.48 tons of non-C&D solid waste: 1,871.3 MTCDE (note: 1/2 of this waste assumed to be flared, the other half assumed to be used for electric generation)
• Emissions reduction associated with 574.72 tons of on-campus composting: 221.1 MTCDE

UT Knoxville Climate Action Plan 32
• Total emissions reduced = 1,990.8 - 1,871.3 + 221.1 - 29.5 = 311.1 MTCDE
• Thus, from FY 10-11 thru FY 20-21, GHG emissions would be reduced by 11 x 311.1 MTCDE = 3,422.1 MTCDE
Next Steps Must secure funding and staffing support before project can be implemented. Project A3: Meet 20% fleet fuel needs with alternative fuels Description This project would increase use of E85 (85% ethanol/15% gasoline) fuel so that E85 and B20 (20% biodiesel/80% petroleum diesel) comprise 20 percent of university’s fleet fuel use. Emissions Reduction (note: financial analysis follows)
• Emissions reduction from this project would result from gasoline savings.
• In FY 08-09: 1. Fleet gasoline use = 400,000 gallons 2. Fleet diesel use = 3,787 gallons 3. Fleet B20 use = 1,940 gallons 4. Fleet E85 use = 0 gallons
Total fleet fuel use = 405,727 gallons; emissions = 3,625.1 MTCDE
• % fleet alternative fuels = 1,940 / 405,727 = 0.5%
• Assume that diesel fuel use (low-sulfur diesel and B20) will not increase until cold-weather problems with B20 are resolved.
• To get % alternative fuels at 20 percent, how much gasoline should be replaced with E85 (e)? 0.2 = (1,940 + e) / 405,727; e = 79,205.4 gallons
• Because a gallon of ethanol contains less energy than a gallon of gasoline, E85 flex fuel vehicles typically get about 20-30% fewer MPGs10
• So assume an additional 25% gallons of E85 must be purchased to meet gasoline demand.
• That is, assume fleet E85 use = 79,205.4 x 1.25 = 99,006.75 gallons
• Thus to achieve 20 percent alt fuels for fleet need the following: 1. Fleet gasoline = 400,000 - 79,205.4 = 320,794.6 gallons 2. Fleet diesel use = 3,787 gallons (unchanged) 3. Fleet B20 use = 1,940 gallons (unchanged) 4. Fleet E85 use = 99,006.75 gallons
• If this were the case, emissions would be 3,034.8 MTCDE
• Emissions would be reduced by 3,625.1 - 3,034.8 = 590.3 MTCDE
• Thus, FY 10-11 to FY 20-21 emission reduction would be 11 x 590.3 = 6493.3 MTCDE. Financial Analysis
• To achieve 20 percent alt fuels for fleet need to increase E85 by 99,006.75 gallons and decrease gasoline by 79,205.4 gallons - see calculations in Emissions Reduction sections.
• Assume costs ($/gallon) of gasoline will increase by 11.4% per year, the average annual increase in price for regular conventional retail gasoline in the Central Atlantic region from 2000 thru 200911.
• Assume that cost of E85 will likewise increase by 11.4% per year.
10 U.S. Department of Energy. Flex Fuel Vehicles Information Sheet. Accessed 11/1/09 from http://www.fueleconomy.gov/feg/flextech.shtml. 11 U.S. Department of Energy. Energy Information Administration. Retail gasoline historical prices. Accessed 11/15/09 from http://www.eia.doe.gov/oil_gas/petroleum/data_publications/wrgp/mogas_history.html.

UT Knoxville Climate Action Plan 33
• On 12-29-09: Knoxville area gasoline w/ taxes cost $2.34 per gallon (source: gasbuddy.com) and E85 w/ taxes cost $2.27 (source: e85prices.com).
• University is exempt from federal and state gas taxes (~$0.41 per gallon in Jan 2010).
• So assume Year 0 (FY 10-11) costs would be as follows: gasoline (2.34- 0.41) x 1.114 = $2.15 per gallon; E85 (2.27- 0.41) x 1.114 = $2.07 per gallon.
Year
Assumed E85 Rate
($/gallon) Costs
Assumed Gasoline Rate
($/gallon) Savings Net Cash Flow
0 2.07 $204,944 $2.15 $170,292 ($34,652)
1 2.31 $228,308 $2.40 $189,705 ($38,603)
2 2.57 $254,335 $2.67 $211,331 ($43,003)
3 2.86 $283,329 $2.97 $235,423 ($47,906)
4 3.19 $315,628 $3.31 $262,261 ($53,367)
5 3.55 $351,610 $3.69 $292,159 ($59,451)
6 3.96 $391,693 $4.11 $325,465 ($66,228)
7 4.41 $436,346 $4.58 $362,568 ($73,778)
8 4.91 $486,090 $5.10 $403,901 ($82,189)
9 5.47 $541,504 $5.68 $449,946 ($91,559)
10 6.09 $603,236 $6.33 $501,239 ($101,996)
TOTAL $4,097,023 $3,404,290 ($692,733)
NPV: ($496,582)
IRR: --
Next Steps A 12,000-gallon E85 underground storage tank is being installed on campus in 2010. Per Mike Moneymaker, flex fuel vehicles in university fleet will be fueled up exclusively with E85. It is unknown whether additional steps would be necessary to achieve 20 percent alternative fuel use. Project A4: Run natural gas-powered turbine generator 24-7 Description This project would run the existing 5 MW natural gas-fired turbine generator at the campus steam plant at full capacity. Total electricity use would not change, as turbine generator electricity would be consumed on campus while purchased electricity would decrease by the same amount. However, because burning natural gas produces about half the carbon emissions as burning coal; and, because coal makes up about 50% of TVA/KUB’s fuel mix, the project would reduce GHG emissions resulting from campus electricity use. Emissions Reduction (note: financial analysis follows)
• Per UT Knoxville Capital Projects Manager Terry Ledford, at full capacity 5 MW turbine generator can produce 3,750 kW x 24 hours/day x 350 days per year = 31,500,000 kWh per year
• In FY2008-09:

UT Knoxville Climate Action Plan 34
1. Turbine generator electricity = 77,021 kWh; natural gas = 2,449 MMBtu; resulting emissions = 64.8 MTCDE.
2. Purchased electricity = 248,154,114 kWh; emissions = 121,454.5 MTCDE.
3. FY 08-09 emissions from Scope 2 T&D Losses = 11,984.7 MTCDE
• Had the generator run at full capacity, turbine generator electricity would be 77,021 + 31,500,000 = 31,577,021 kWh.
• Also, purchased electricity would be 248,154,114 - 31,500,000 = 216,654,114 kWh.
• Based on past estimates of turbine generator emissions, approximately 449,604 MMBtu natural gas would be required to generate 31,577,021 kWh with the turbine.
• When this data (449,604 MMBtu natural gas - turbine / 31,577,021 kWh produced - turbine / 216,654,114 kWh purchased electricity) is input into GHG emissions calculator the following emissions would be produced:
1. Purchased electricity = 106,037.4 MTCDE 2. Turbine generator electricity = 16,433.4 MTCDE 3. Scope 2 T&D Losses = 10,463.4 MTCDE
• Total emissions reduced = purchased electricity MTCDE reduction + T&D losses reduction - turbine generator electricity MTCDE increase = (121,454.5 - 106,037.4) + (11,984.7 - 10,463.4) - (16,433.4 - 64.8) = 15417.1 + 1521.3 - 16,368.6 = 569.8 MTCDE.
• Thus, FY 10-11 to FY 20-21 emission reduction would be 11 x 569.8 = 6,267.8 MTCDE. Financial Analysis
• Assume that purchased electricity cost will increase each year by $0.0037 per kWh, the average annual increase for FY 00-01 thru FY 08-09.
• From July 09 thru Nov 09 purchased electricity cost on average $0.0701 per kWh. So, assume that Year 0 (FY 10-11) purchased electricity will cost $0.0701 + $0.0037 = $0.0738 per kWh.
• Assume that all costs and savings are incurred at end of year.
• If turbine produced 31,500,000 kWh, purchased electricity would decrease by 31,500,000 kWh. At same time, natural gas used in turbine would need to increase by 449,604- 2,449 = 447,115 MMBtu, or 4,466,831 therms (see calculations in Emissions Reduction section).
• Per Terry Ledford, Dec 09 natural gas rate = $0.80 per therm.
• The average increase in natural gas rate for 2000-01 thru 2008-09 is -$0.0043 per therm.
• Assume that natural gas rate will increase on average by 2% per year - the average rate of inflation in the U.S for 1990-91 thru 2008-0912.
• So, assume Year 0 (FY 10-11) natural gas rate is 0.8 x 1.02=$0.816 per therm.
Year
Assumed NG Rate
($/therm) Costs
Assumed Purchased Electricity Rate
($/kWh) Savings Net Cash Flow
0 0.8160 $3,644,934.10 0.0738 $2,325,018 ($1,319,916)
1 0.8323 $3,717,832.78 0.0775 $2,442,317 ($1,275,516)
2 0.8490 $3,792,189.43 0.0813 $2,559,615 ($1,232,574)
12 See NASA's Gross Domestic Product Deflator Inflation Calculator at http://cost.jsc.nasa.gov/inflateGDP.html.

UT Knoxville Climate Action Plan 35
3 0.8659 $3,868,033.22 0.0850 $2,676,914 ($1,191,119)
4 0.8833 $3,945,393.89 0.0887 $2,794,213 ($1,151,181)
5 0.9009 $4,024,301.76 0.0924 $2,911,512 ($1,112,790)
6 0.9189 $4,104,787.80 0.0962 $3,028,811 ($1,075,977)
7 0.9373 $4,186,883.56 0.0999 $3,146,110 ($1,040,774)
8 0.9561 $4,270,621.23 0.1036 $3,263,408 ($1,007,213)
9 0.9752 $4,356,033.65 0.1073 $3,380,707 ($975,326)
10 0.9947 $4,443,154.32 0.1110 $3,498,006 ($945,148)
TOTAL $44,354,165.74 $32,026,631 ($12,327,535)
NPV: ($9,460,782)
IRR: --
Next Steps Must secure funding before project can be implemented. Project A5: Install smart power strips in residence halls Description This project would provide ‘smart’ power strips to students living in campus residence halls. Smart strips can save energy by reducing phantom load, or electricity that is consumed by electronics when they are in ‘standby’ mode. With smart strips, peripheral electronics such as printers and external hard drives automatically shut off when a control device (e.g., computer) is powered down. Financial Analysis
• Assume that expected lifetime of smart strips would be 2 years, the length of the product warranty.
• Provide one smart strip per occupied room.
• Assume campus residence halls have 90 percent occupancy; for fall 2009, this meant approximately 3,200 occupied rooms.
• FY 08-09 bulk pricing for smart strips: $23.04 per strip.
• Assume 2 percent inflation in pricing per year, so that Year 0 (FY 10-11) cost would be $23.04 x 1.02 x 1.02= $23.97 per strip.
Year Costs
Assumed Purchased Electricity Rate
($/kWh) Savings
Net Cash Flow
0 $76,706.61 $0.0738 $83,272 $6,565
1 $0.00 $0.0775 $83,272 $83,272
TOTAL $76,706.61 $166,544 $89,837
NPV: $85,872
IRR: --

UT Knoxville Climate Action Plan 36
Emissions Reduction
• Emissions reduction from this project would result from electricity savings.
• Assume that residence hall rooms have following computer system setup: 1. Speakers: 3 watts 2. 19" LCD Monitor: 1 watt 3. Scanner: 3 watts 4. External DVD burner: 3 watts 5. Laser Printer: 7 watts 6. USB hub: 5 watts
• Under this setup, strips will save approximately 1.56 kWh per strip per day13.
• Assume that campus residence halls are open and occupied 226 days (290 days of classes - 64 holidays or other recesses) per year.
• Annual electricity savings = 1.56 kWh/day x 226 days per year x 3,200 smart strips = 1,128,192 kWh per year.
• According to GHG emissions calculator, reducing purchased electricity by 1,128,192 kWh per year would lower emissions as follows:
1. Purchased electricity emissions reduction: 552.2 MTCDE per year 2. T&D emissions reduction: 54.5 MTCDE per year 3. Total reduction: 606.7 MTCDE per year
• Thus, FY 10-11 to FY 11-12 emission reduction would be 2 x 606.7 = 1,213.4 MTCDE. Next Steps Must secure funding before project can be implemented. Project A6: Reduce SOV commuting miles per year to 25% below FY 07-08 levels Description This project would use a combination of policies and programs to encourage alternatives to single occupant vehicle (SOV) commuting among UT Knoxville faculty, staff and students. Financial Analysis The costs and benefits of this project depend on the approach that is selected. Project costs might include lost parking permit revenues or increased staffing expenses (e.g., if an alternative transportation coordinator is hired). The project could also reduce costs associated with maintaining, repairing and constructing parking spaces for fewer cars on campus. Emissions Reduction
• FY 07-08 proportion of total emissions from SOV commuting = 0.1313
• FY 20-21 predicted total emissions = 324,116 MTCDE
• Assume FY 20-21 total emissions from SOV commuting = 324,116 x 0.1313 = 42,556.4 MTCDE (i.e., same pct of SOV commuting would occur in FY 20-21 as is the case in 07-08)
• Based on past estimates of SOV commuting emissions, approximately 89,761,371 SOV commuting miles would generate 42,556.4 MTCDE.
• A 25 percent reduction in SOV commuting would mean 0.25 x 89,761,371 = 22,440,343 fewer SOV commuting miles in FY 20-21.
13 Source: http://www.treehugger.com/files/2007/05/smart_strip_con.php.

UT Knoxville Climate Action Plan 37
• According to GHG emissions calculator, reducing SOV commuting miles by 22,440,343 would lower emissions by 9,633 MTCDE.
• Because project relies on behavioral changes, assume it would need to be phased in over several years.
• Assume that project would decrease SOV commuting miles traveled by 2 percent per year from FY 10-11 thru FY 19-20, then 5 percent in FY 20-21.
Project Year
Fiscal Year
Target Auto VMT Reduction
(%)
Total Annual Emissions Reduction (MTCDE)
0 2010-11 2 770.6
1 2011-12 4 1,541.3
2 2012-13 6 2,311.9
3 2013-14 8 3,082.6
4 2014-15 10 3,853.2
5 2015-16 12 4,623.8
6 2016-17 14 5,394.5
7 2017-18 16 6,165.1
8 2018-19 18 6,935.8
9 2019-20 20 7,706.4
10 2020-21 25 9,633.0
TOTAL
REDUCTION 52,018.2
Next Steps Must formulate approach and secure funding before project can be implemented. Project A7: Divert 30% of waste from landfill by FY 20-21 Description This project would increase recycling and composting as necessary to ensure that 30 percent of all campus waste (including C&D waste) is diverted from the landfill. Assume project would be implemented simultaneously with Project A2: Compost 100% of green waste. Emissions Reduction (note: financial analysis follows)
• Per UT Knoxville Environmental Coordinator Jay Price, in FY 08-09 campus recycling composting and solid waste totals were as follows:
1. Recycling = 1007.9 tons 2. Composting = 77 tons 3. CH4 Recovery and Flaring (Non-C&D) Waste = 4,146 tons (32.8% of all waste). 4. CH4 Recovery and Electric Generation (Non-C&D) Waste = 4,146 tons (32.8% of all
waste). 5. No CH4 Recovery (C&D) Waste = 4,355 tons (34.4% of all waste).

UT Knoxville Climate Action Plan 38
• Waste diversion rate = (recycling + composting) / (recycling + composting + non-C&D waste + C&D waste).
• Thus, FY 08-09 waste diversion rate = (1,007.9 + 77) / (1,007.9 + 77 + 4,146 + 4,146 + 4,355) = 1,084.9/13,731.9 = 7.9 %.
• In FY 08-09, waste represented 2.9% of total emissions.
• Under both campus growth scenarios (‘Business As Usual’ and ‘Growth Cap’), FY 20-21 emissions are projected to be 324,116 MTCDE.
• Assume FY 20-21 waste emissions would be 324,116 x 0.029 = 9,399.4 MTCDE
• According to GHG emissions calculator, roughly 16,069 tons of waste would produce 9,399.4 MTCDE emissions.
• So assume FY 20-21 waste total would be 16,069 tons.
• To achieve 30% waste diversion rate would mean that 0.3*16,069 = 4,820.7 tons of FY 20-21 waste must be composted or recycled.
• Assume that project A2 happens so that on-campus composting increases to 574.72 tons per year.
• Then recycling would have to increase to 4,820.7 - 574.72 = 4,245.98 tons per year to achieve 30% waste diversion rate.
• If 4,245.98 tons of waste was recycled, and 574.72 tons of waste was composted, then 16,069 – 4,820.7 = 11,248.3 fewer tons of waste would be sent to the landfill in FY 20-21.
• Based on FY 08-09 waste percentages (see above) assume that, in FY 20-21, a 30% diversion rate would mean:
1. 32.8% of this 11,248.3 tons of waste (3,689.4 tons) is CH4 Recovery and Flaring (Non-C&D) waste.
2. 32.8% (3,689.4 tons) is CH4 Recovery and Electric Generation (Non-C&D) waste. 3. 34.4% (3,869.4 tons) is No CH4 Recovery (C&D) waste.
• According to GHG emissions calculator, total emissions resulting from this waste would be 6,362 MTCDE.
• Thus, a 30% diversion rate by FY 20-21 would mean 9,399.4 - 6362 = 3,037 MTCDE fewer emissions per year by FY 20-21.
• Because project relies on behavioral changes, assume it would need to be phased in over several years.
• Assume that project would increase waste diversion rate by 2 percent per year from FY 10-11 thru FY 20-21.
Project Year Fiscal Year
Target Diversion Rate (%)
Annual Emissions Reduction
0 2010-11 0.10 443.5
1 2011-12 0.12 853.4
2 2012-13 0.14 1,131.4
3 2013-14 0.16 1,356.3
4 2014-15 0.18 1,692.3
5 2015-16 0.20 1,982.6
6 2016-17 0.22 2,173.8
7 2017-18 0.24 2,354.2
8 2018-19 0.26 2,560.8

UT Knoxville Climate Action Plan 39
9 2019-20 0.28 2,741.4
11 2020-21 0.30 3,037.3
TOTAL 20,327.1
Financial Analysis
• Assume that all costs and savings are incurred at end of year.
• Per Jay, in FY 08-09, UT Knoxville paid $62.68 per ton to send campus waste (C&D and non-C&D) to the landfill.
• Assuming 2% inflation in waste hauling fees, charge in Year 0 (FY 10-11) of project would be $62.68 x 1.02 x 1.02 = $65.21 per ton.
• Jay estimates that two extra recycling staff would be needed to achieve 30 percent waste diversion rate. Currently, wages and benefits for recycling staff positions total to about $33,000 per staff per year.
• Assume that recycling staff wages and benefits do not increase during project implementation period.
• Also, assume that no additional equipment or supplies would be necessary to implement project.
• Thus, project would cost 2 x $33,000 = $66,000 per year.
• Annual savings ($) = annual diverted waste (tons) x annual waste hauling fee.
Year Costs Savings Net Cash Flow
0 66,000 99,744 33,744
1 66,000 123,951 57,951
2 66,000 148,449 82,449
3 66,000 173,564 107,564
4 66,000 201,087 135,087
5 66,000 229,409 163,409
6 66,000 257,564 191,564
7 66,000 286,599 220,599
8 66,000 317,170 251,170
9 66,000 348,399 282,399
10 66,000 383,211 317,211
TOTAL 726,000 2,569,147 1,843,147
NPV: $1,278,391
IRR: --
Next Steps Must secure funding and staffing support before project can be implemented.

UT Knoxville Climate Action Plan 40
Project A8: Use portion of 'Green Fee' to launch major energy efficiency project Description This project would allocate all but $200,000 in unreserved funds from the Green Fee toward a major campus energy efficiency project in FY 20-21. Financial Analysis
• Assume Green Fee raises same amount of funds ($875,000) as in FY 09-10; i.e. no change in student enrollment or in-state/out-of-state student breakdown.
• Assume that committee which recommends how to spend Green Fee funds would want to continue green power purchase at FY 10-11 level thru 20-21.
• Assume green power purchase price would remain at $4 per 150 kWh block.
• If project were to be approved, then approximately $4,421,834 would be available in FY 20-21 for major campus energy efficiency project - see table below.
Proposed Use of Unreserved Funds
FY Anticipated
Reserved - Green Power
Reserved - Solar Array
Reserved -
Other Unreserved
Reserve $200K for Other
Reserve for Energy Efficiency Project
09-10 $875,000 $180,000 $100,000 $463,166 $131,834 $0 $131,834
10-11 $875,000 $216,000 $100,000 $0 $559,000 $200,000 $359,000
11-12 $875,000 $216,000 $100,000 $0 $559,000 $200,000 $359,000
12-13 $875,000 $216,000 $100,000 $0 $559,000 $200,000 $359,000
13-14 $875,000 $216,000 $0 $0 $659,000 $200,000 $459,000
14-15 $875,000 $216,000 $0 $0 $659,000 $200,000 $459,000
15-16 $875,000 $216,000 $0 $0 $659,000 $200,000 $459,000
16-17 $875,000 $216,000 $0 $0 $659,000 $200,000 $459,000
17-18 $875,000 $216,000 $0 $0 $659,000 $200,000 $459,000
18-19 $875,000 $216,000 $0 $0 $659,000 $200,000 $459,000
19-20 $875,000 $216,000 $0 $0 $659,000 $200,000 $459,000
Total $6,421,834 $2,000,000 $4,421,834
• Assume that expected lifetime of energy efficiency equipment would be 10 years.
• Assume that project would have 10-year payback period so that annual savings would be $4,421,834 / 10 = $442,183.
Project Year Costs Savings
Net Cash Flow
0 $4,421,834 $442,183 ($3,979,651)
1 $442,183 $442,183
2 $442,183 $442,183
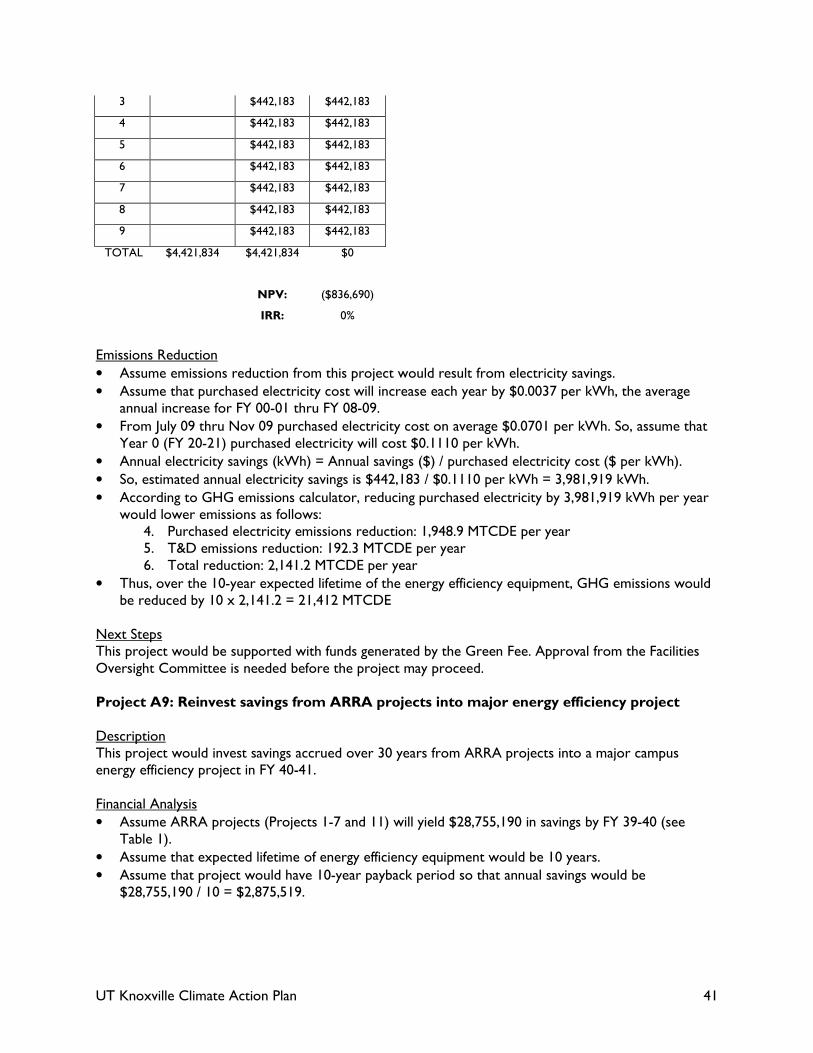
UT Knoxville Climate Action Plan 41
3 $442,183 $442,183
4 $442,183 $442,183
5 $442,183 $442,183
6 $442,183 $442,183
7 $442,183 $442,183
8 $442,183 $442,183
9 $442,183 $442,183
TOTAL $4,421,834 $4,421,834 $0
NPV: ($836,690)
IRR: 0%
Emissions Reduction
• Assume emissions reduction from this project would result from electricity savings.
• Assume that purchased electricity cost will increase each year by $0.0037 per kWh, the average annual increase for FY 00-01 thru FY 08-09.
• From July 09 thru Nov 09 purchased electricity cost on average $0.0701 per kWh. So, assume that Year 0 (FY 20-21) purchased electricity will cost $0.1110 per kWh.
• Annual electricity savings (kWh) = Annual savings ($) / purchased electricity cost ($ per kWh).
• So, estimated annual electricity savings is $442,183 / $0.1110 per kWh = 3,981,919 kWh.
• According to GHG emissions calculator, reducing purchased electricity by 3,981,919 kWh per year would lower emissions as follows:
4. Purchased electricity emissions reduction: 1,948.9 MTCDE per year 5. T&D emissions reduction: 192.3 MTCDE per year 6. Total reduction: 2,141.2 MTCDE per year
• Thus, over the 10-year expected lifetime of the energy efficiency equipment, GHG emissions would be reduced by 10 x 2,141.2 = 21,412 MTCDE
Next Steps This project would be supported with funds generated by the Green Fee. Approval from the Facilities Oversight Committee is needed before the project may proceed. Project A9: Reinvest savings from ARRA projects into major energy efficiency project Description This project would invest savings accrued over 30 years from ARRA projects into a major campus energy efficiency project in FY 40-41. Financial Analysis
• Assume ARRA projects (Projects 1-7 and 11) will yield $28,755,190 in savings by FY 39-40 (see Table 1).
• Assume that expected lifetime of energy efficiency equipment would be 10 years.
• Assume that project would have 10-year payback period so that annual savings would be $28,755,190 / 10 = $2,875,519.

UT Knoxville Climate Action Plan 42
Project Year Costs Savings
Net Cash Flow
0 $0 $2,875,519 $2,875,519
1 $2,875,519 $2,875,519
2 $2,875,519 $2,875,519
3 $2,875,519 $2,875,519
4 $2,875,519 $2,875,519
5 $2,875,519 $2,875,519
6 $2,875,519 $2,875,519
7 $2,875,519 $2,875,519
8 $2,875,519 $2,875,519
9 $2,875,519 $2,875,519
TOTAL $0 $28,755,189 $28,755,189
NPV: $23,314,194.56
IRR: --
Emissions Reduction
• Assume emissions reduction from this project would result from electricity savings.
• Assume that purchased electricity cost will increase each year by $0.0037 per kWh, the average annual increase for FY 00-01 thru FY 08-09.
• From July 09 thru Nov 09 purchased electricity cost on average $0.0701 per kWh. So, assume that Year 0 (FY 40-41) purchased electricity will cost $0.1855 per kWh.
• Annual electricity savings (kWh) = Annual savings ($) / purchased electricity cost ($ per kWh).
• So, estimated annual electricity savings is $2,875,519 / $0.1855 per kWh = 15,499,506 kWh.
• According to GHG emissions calculator, reducing purchased electricity by 15,499,506 kWh per year would lower emissions as follows:
1. Purchased electricity emissions reduction: 7,585.9 MTCDE per year 2. T&D emissions reduction: 748.6 MTCDE per year 3. Total reduction: 8,334.5 MTCDE per year
• Thus, over the 10-year expected lifetime of the energy efficiency equipment, GHG emissions would be reduced by 10 x 8,334.5 = 83,345 MTCDE
Next Steps Project would require tracking energy savings of ARRA projects, which will become easier once additional electric meters and water meters have been installed on campus. More importantly, however, project would require policy change that permits university to reserve savings from energy efficiency projects for funding additional energy efficiency projects. Project A10: Assume FY 20-21 purchased electricity is 50% nuclear, hydro and renewables Description This project assumes that the fuel mix used by TVA/KUB to produce UT Knoxville’s purchased electricity will be 50% nuclear, hydro and renewables by FY 20-21, when GHG regulations proposed under S. 1733, the Clean Energy Jobs and American Power Act. (2009) would take effect.

UT Knoxville Climate Action Plan 43
Financial Analysis
• Costs, which will be embedded in electricity rates, are unknown at this time.
• No savings are anticipated, thus net cash flows will be negative.
• Expected lifetime of project is unknown, as it is unclear if and for how TVA/KUB would stick with this fuel mix.
Emissions Reduction
• Assume emissions reduction from this project would result from change in purchased electricity fuel mix.
• Assume that fuel mix used by TVA/KUB to produce UT Knoxville’s purchased electricity will be 50% nuclear, hydro and renewables by FY 20-21.
• In reporting their annual fuel mix, TVA listed natural gas and diesel together as "combustion turbine"; assume that half of this combustion turbine fuel comes from natural gas and the other half comes from diesel (i.e., fuel oil #2).
• Accordingly, TVA's FY 08-09 power supply consisted of 46.02% coal, 31.79% nuclear, 6.84% hydro, 1.04% natural gas, 1.04% diesel, and 0.02% renewables14.
• Thus, TVA’s current power supply is 31.79% + 6.84% = 38.64% nuclear, hydro and renewables. To increase this to 50%, TVA must increase these fuel sources by 50-38.64 = 11.36%.
• TVA's use of hydropower didn’t increase much in past decade (average 6.54% of fuel mix).
• The TVA 2009 Annual Report suggests that some coal plants might close to meet proposed federal regulations. And, TVA expects to add to its nuclear capacity in the years leading up to FY 20-21.
• Assume that TVA’s renewables will not significantly increase between FY 09-10 thru FY 20-21 (note: this is a worst case scenario; TVA could very well increase its use of renewables)
• If this is the case, then nuclear, hydro and renewables will represent 50% of the TVA power supply only by decreasing coal use and increasing nuclear use.
• Under this scenario, by FY 20-21 purchased electricity will come from 46.02-11.36% = 34.66% coal, 31.79% + 11.36% = 43.15% nuclear, 6.84% hydro, 1.04% natural gas, 1.04% diesel, and 0.02% renewables.
• According to GHG emissions calculator, FY 08-09 purchased electricity emissions with this hypothetical fuel mix (50% nuclear, hydro and renewables) would be 97,682 MTCDE.
• Actual FY 08-09 purchased electricity emissions: 121,454 MTCDE.
• Thus, purchased electricity emissions would be (97,682 – 121,454) / 87,682 =19.6% lower if FY 08-09 fuel mix was 50% nuclear, hydro and renewables.
• Assume that in FY 20-21, under both scenarios for future campus growth, purchased electricity emissions will make up same percentage (49%) of total emissions as it does in FY 08-09.
• Projected total emissions for FY 20-21 under both growth scenarios: 324,116 MTCDE.
• Assume that 49% of these emissions (159,494 MTCDE) will be attributable to purchased electricity.
• If this is the case, then a fuel mix consisting of 50% nuclear, hydro and renewables would result in purchased electricity emissions being reduced by 0.196 x 159,494 = 31,218 MTCDE per year starting in FY 20-21.
Next Steps None. The university has no control over the TVA/KUB power supply.
14 2009 TVA Form 10-K Annual Report. Accessed 1/6/10 from http://investor.shareholder.com/tva/secfiling.cfm?filingID=1376986-09-113.

UT Knoxville Climate Action Plan 44
Project S1: Use only natural gas to produce campus steam with current boilers Description This scenario would retrofit two coal-fired boilers at the campus steam plant to allow all boilers to burn natural gas instead of coal. Financial Analysis
• Cost of retrofitting boilers to burn natural gas is unknown; the following analysis only examines cost/savings of switching fuels (from coal to natural gas)
• Assume expected lifetime for project would be FY 10-11 thru 20-21 even though actual lifetime could extend beyond this period.
• Assume that all costs and savings are incurred at end of year.
• Natural gas rates have fluctuated greatly over the past decade; thus, assume that future rates will increase at the same pace as inflation, typically two percent per year in the U.S.
• Per UT Knoxville Capital Projects Manager Terry Ledford, natural gas used at steam plant cost $0.80 per therm in December 2009. So, assume that Year 0 (FY 10-11) natural gas will cost $0.80 x 1.02 = $0.8160 per therm.
• Also per Terry Ledford, Dec 2009 coal rate = $163 per ton. Assume coal rate will increase by $11.45/ton each year - the average increase for FY 00-01 thru FY 08-09. So assume Year 0 (FY 10-11) cost is $163 + $11.45=$174.45 per ton.
• Campus steam plant produces: 1. 18,805 lb steam per ton of coal; and, 2. 0.5987 lb steam per cubic foot of natural gas
• Note: To convert between CFT and therms, divide CFT by 97.087
• From FY 96-97 thru FY 08-09, campus steam plant produced on average 462,671,345 lbs of steam from coal per year.
• Producing this amount of steam requires or would require: 1. 462,671,345 / 18,805 = 24,604 tons coal per year; or, 2. (462,671,345 / 0.5987) / 97.087 = 7,959,892 therms natural gas per year
• Annual project cost ($) = annual natural gas rate ($ / therm) x natural gas usage (7,959,892 therms)
• Annual project savings ($) = annual coal rate ($ / ton) x coal usage (24,604 tons)
Cost to produce steam
Year Fiscal Year
Assumed Coal Rate ($/ton)
Assumed NG Rate
($/therm) From Coal
From NG*
Difference (Cost - Use Only NG)
Savings - Use Only NG
Net Cash Flow
0 2010-11 174.45 0.8160 $4,292,323 $6,495,272 $2,202,949 $1,000,000 ($1,202,949)
1 2011-12 185.91 0.8323 $4,574,157 $6,625,177 $2,051,020 $1,000,000 ($1,051,020)
2 2012-13 197.36 0.8490 $4,855,991 $6,757,681 $1,901,690 $1,000,000 ($901,690)
3 2013-14 208.82 0.8659 $5,137,825 $6,892,834 $1,755,009 $1,000,000 ($755,009)
4 2014-15 220.27 0.8833 $5,419,659 $7,030,691 $1,611,032 $1,000,000 ($611,032)
5 2015-16 231.73 0.9009 $5,701,493 $7,171,305 $1,469,811 $1,000,000 ($469,811)
6 2016-17 243.18 0.9189 $5,983,328 $7,314,731 $1,331,403 $1,000,000 ($331,403)
7 2017-18 254.64 0.9373 $6,265,162 $7,461,025 $1,195,864 $1,000,000 ($195,864)
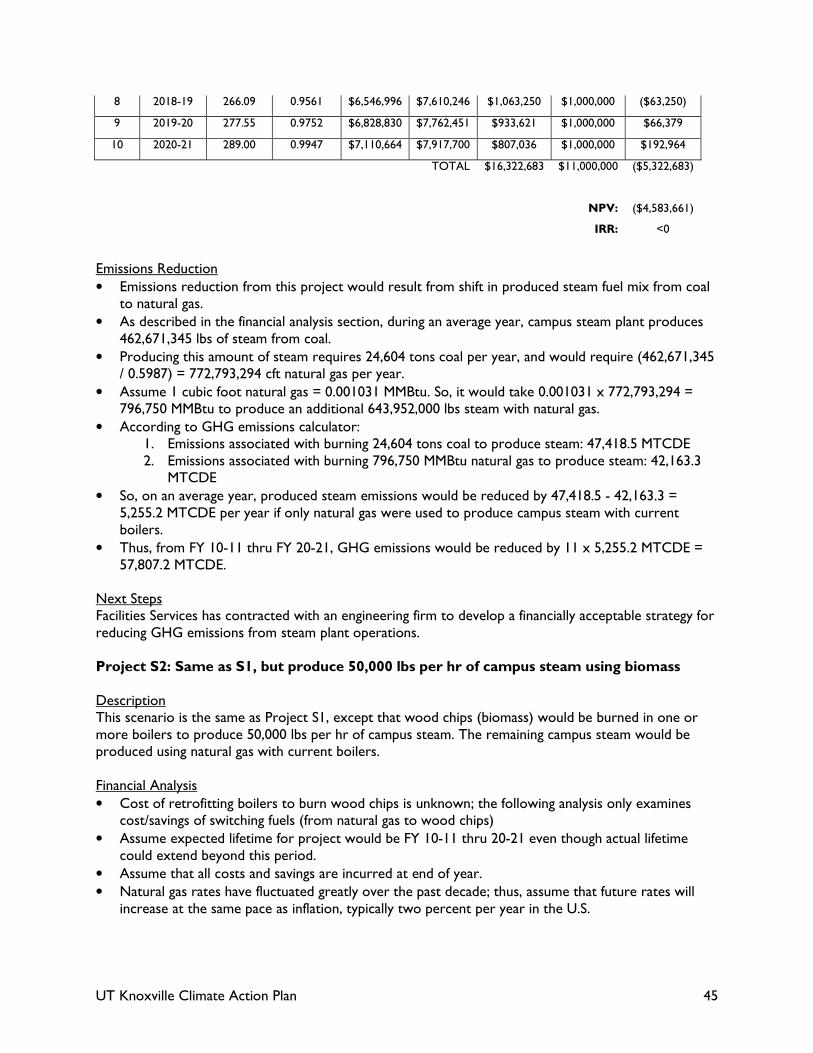
UT Knoxville Climate Action Plan 45
8 2018-19 266.09 0.9561 $6,546,996 $7,610,246 $1,063,250 $1,000,000 ($63,250)
9 2019-20 277.55 0.9752 $6,828,830 $7,762,451 $933,621 $1,000,000 $66,379
10 2020-21 289.00 0.9947 $7,110,664 $7,917,700 $807,036 $1,000,000 $192,964
TOTAL $16,322,683 $11,000,000 ($5,322,683)
NPV: ($4,583,661)
IRR: <0
Emissions Reduction
• Emissions reduction from this project would result from shift in produced steam fuel mix from coal to natural gas.
• As described in the financial analysis section, during an average year, campus steam plant produces 462,671,345 lbs of steam from coal.
• Producing this amount of steam requires 24,604 tons coal per year, and would require (462,671,345 / 0.5987) = 772,793,294 cft natural gas per year.
• Assume 1 cubic foot natural gas = 0.001031 MMBtu. So, it would take 0.001031 x 772,793,294 = 796,750 MMBtu to produce an additional 643,952,000 lbs steam with natural gas.
• According to GHG emissions calculator: 1. Emissions associated with burning 24,604 tons coal to produce steam: 47,418.5 MTCDE 2. Emissions associated with burning 796,750 MMBtu natural gas to produce steam: 42,163.3
MTCDE
• So, on an average year, produced steam emissions would be reduced by 47,418.5 - 42,163.3 = 5,255.2 MTCDE per year if only natural gas were used to produce campus steam with current boilers.
• Thus, from FY 10-11 thru FY 20-21, GHG emissions would be reduced by 11 x 5,255.2 MTCDE = 57,807.2 MTCDE.
Next Steps Facilities Services has contracted with an engineering firm to develop a financially acceptable strategy for reducing GHG emissions from steam plant operations. Project S2: Same as S1, but produce 50,000 lbs per hr of campus steam using biomass Description This scenario is the same as Project S1, except that wood chips (biomass) would be burned in one or more boilers to produce 50,000 lbs per hr of campus steam. The remaining campus steam would be produced using natural gas with current boilers. Financial Analysis
• Cost of retrofitting boilers to burn wood chips is unknown; the following analysis only examines cost/savings of switching fuels (from natural gas to wood chips)
• Assume expected lifetime for project would be FY 10-11 thru 20-21 even though actual lifetime could extend beyond this period.
• Assume that all costs and savings are incurred at end of year.
• Natural gas rates have fluctuated greatly over the past decade; thus, assume that future rates will increase at the same pace as inflation, typically two percent per year in the U.S.

UT Knoxville Climate Action Plan 46
• Per UT Knoxville Capital Projects Manager Terry Ledford, natural gas used at steam plant cost $0.80 per therm in December 2009. So, assume that Year 0 (FY 10-11) natural gas will cost $0.80 x 1.02 = $0.8160 per therm.
• Assume wood chips can be obtained for $25 per ton in 2009. Then, assuming that cost of wood chips will increase on average by two percent per year, Year 0 (FY 10-11) wood chips will cost $25 x 1.02 = $25.50 per ton.
• Campus steam plant produces 0.5987 lb steam per cubic foot of natural gas (see Project S1 summary).
• Assuming that boilers operate 10 months per year, 50,000 lbs per hr of steam is 365,250,000 lbs/year.
• This would require: 609,995,181 cft, 6,282,975 therms, or 628,905 MMBtu natural gas per year.
• Per ORNL15, wood fuel (air dry, 20% moisture) has 0.0064 MMBtu per lb.
• Thus producing 50,000 lbs/hr of campus steam using biomass would require 98,266,411 lbs or 49,133 tons of wood fuel (air dry, 20% moisture).
• Annual project cost ($) = annual wood chips cost ($ / ton) x wood chips usage (49,133 tons)
• Annual project savings ($) = annual natural gas rate ($ / therm) x natural gas usage (6,282,975 therms)
Costs to produce 50,000 lbs/hr of steam
Year Fiscal Year
Assumed NG Rate
($/therm)
Assumed Wood Chips Rate ($/ton) From NG
From Wood Chips
Net Cash Flow Use Wood Chips vs. NG)
0 2010-11 0.8160 $25.50 $5,126,907 $1,252,897 3,874,011
1 2011-12 0.8323 $26.01 $5,229,446 $1,277,955 3,951,491
2 2012-13 0.8490 $26.53 $5,334,035 $1,303,514 4,030,521
3 2013-14 0.8659 $27.06 $5,440,715 $1,329,584 4,111,131
4 2014-15 0.8833 $27.60 $5,549,530 $1,356,176 4,193,354
5 2015-16 0.9009 $28.15 $5,660,520 $1,383,299 4,277,221
6 2016-17 0.9189 $28.72 $5,773,731 $1,410,965 4,362,765
7 2017-18 0.9373 $29.29 $5,889,205 $1,439,185 4,450,021
8 2018-19 0.9561 $29.88 $6,006,989 $1,467,968 4,539,021
9 2019-20 0.9752 $30.47 $6,127,129 $1,497,328 4,629,801
10 2020-21 0.9947 $31.08 $6,249,672 $1,527,274 4,722,397
TOTAL $62,387,878 $15,246,144 47,141,734
NPV: 35,256,699
IRR: --
Emissions Reduction
• Emissions reduction from this project would result from shift in produced steam fuel mix from natural gas to wood chips.
• According to GHG emissions calculator:
15 U.S. Department of Energy. Oak Ridge National Laboratory (ORNL). Bioenergy Conversion Factors. Accessed 12/15/09 from http://bioenergy.ornl.gov/papers/misc/energy_conv.html.

UT Knoxville Climate Action Plan 47
1. Emissions associated with burning 628,905 MMBtu natural gas to produce steam: 33,281.1 MTCDE.
2. Emissions associated with burning 49,133 tons wood chips to produce steam: 7,638.3 MTCDE.
• So, on an average year, produced steam emissions would be reduced by 33,281.1- 7,638.3 = 25,642.8 MTCDE per year if wood chips were used to produce 50,000 lbs per hr of campus steam.
• Thus, from FY 10-11 thru FY 20-21, GHG emissions would be reduced by 11 x 25,642.8 MTCDE = 282,070.8 MTCDE.
Next Steps Facilities Services has contracted with an engineering firm to develop a financially acceptable strategy for reducing GHG emissions from steam plant operations.

UT Knoxville Climate Action Plan 48
Appendix B - UT Knoxville Sustainability Courses The following list shows a sample of sustainability-themed undergraduate courses offered at UT Knoxville during 2009-10. An updated and complete list of such courses can be obtained through the Office of the University Registrar16. (AGEC) Agricultural Economics (047) • AGEC 201 - Economics of the Global Food and Fiber System • AGEC 315 - Agricultural and Environmental Law • AGEC 445 - Economics of Biomass for Renewable Energy • AGEC 470 - Natural Resource Economics • AGEC 471 - Applied Policy Analysis for Environmental and Natural Resource Management (ANTH) Anthropology (122) • ANTH 415 - Environmental Anthropology (ARCH) Architecture (133) • ARCH 232 - Introduction to Architectural Technology • ARCH 271 - Architectural Design I: Place • ARCH 341 - Environmental Control Systems I • ARCH 342 - Environmental Control Systems II • ARCH 346 - Principles of Environmental Control II • ARCH 412 - Non-Western and Indigenous Architecture • ARCH 431 - Structural and Mechanical Applications • ARCH 471 - Architectural Design V: Integration • ARCH 486 - Advanced Architectural Design: Sustainable Architecture (BCMB) Biochemistry and Cellular and Molecular Biology (188) • BCMB 321 - Introductory Plant Physiology (BIOL) Biology (190) • BIOL 102 - Humankind in the Biotic World • BIOL 112 - General Botany • BIOL 250 - General Ecology (BSE) Biosystems Engineering (196) • BSE 221 - Mass and Energy in Biosystems • BSE 416 - Environmental Hydrology (BSET) Biosystems Engineering Technology (194)
16 See UT Knoxville Office of the University Registrar online course description webpage, http://catalog.utk.edu/content.php?catoid=1&navoid=104

UT Knoxville Climate Action Plan 49
• BSET 326 - GIS/GPS Applications in Agriculture and Environmental Science • BSET 414 - CAD Applications to Biosystems Engineering Technology • BSET 474 - Environmental Instrumentation and Monitoring (CBE) Chemical and Biomolecular Engineering (223) • CBE 475 - Applied Microbiology and Bioengineering • CBE 501 - STAIR Graduate Seminar • CBE 590 - Fundamentals of Sustainable Technology (CE) Civil Engineering (254) • CE 381 - Environmental Engineering I • CE 391 - Water Resources Engineering I • CE 481 - Environmental Engineering II • CE 482 - Environmental Engineering Laboratory • CE 486 - Air and Waste Management • CE 490 - Water Resources Applications (EEB) Ecology and Evolutionary Biology (278) • EEB 309 - Biology of Human Affairs • EEB 404 - Ecosystem Ecology • EEB 421 - Community Ecology • EEB 495 - Evolutionary Ecology (ECON) Economics (283) • ECON 322 - The Global Economy: Trade and Development • ECON 362 - Environmental and Natural Resource Policy • ECON 463 - Environmental Economics (EPP) Entomology and Plant Pathology (341) • EPP 313 - Plant Pathology (ESS) Environmental and Soil Sciences (345) • ESS 120 - Soils and Civilizations • ESS 324 - Soil and Water Conservation • ESS 334 - Soil Nutrient Management and Fertilizers • ESS 434 - Environmental Soil Chemistry • ESS 444 - Environmental Soil Physics • ESS 454 - Environmental Soil Biology • ESS 462 - Environmental Climatology • ESS 493 - Problems in Environmental and Soil Sciences (FORS) Forestry (396) • FORS 415 - Forest Conservation Workshop

UT Knoxville Climate Action Plan 50
(FWF) Forestry, Wildlife and Fisheries (398) • FWF 250 - Conservation • FWF 416 - Planning and Management of Forest, Wildlife and Fisheries Resources (GEOG) Geography (415) • GEOG 131 - Geography of the Natural Environment I • GEOG 132 - Geography of the Natural Environment II • GEOG 345 - Population and Environment • GEOG 410 - Global Positioning Systems and Geographic Data • GEOG 432 - Dendrochronology • GEOG 434 - Climatology • GEOG 436 - Water Resources • GEOG 442 - Urban Social Geography • GEOG 451 - The Global Economy • GEOG 439 - Plant Geography of North America (GEOL) Geology (424) • GEOL 101 - The Dynamic Earth • GEOL 102 - Earth, Life, and Time • GEOL 103 - The Earth's Environments • GEOL 104 - Exploring the Planets • GEOL 107 - Honors: The Dynamic Earth • GEOL 108 - Honors: Earth, Life, and Time • GEOL 202 - Earth as an Ecosystem: Modern Problems and Solutions • GEOL 203 - Sustainability: Reducing Our Impact on Planet Earth • GEOL 204 - Geology of National Parks • GEOL 208 - Honors: Earth as an Ecosystem: Modern Problems and Solutions • GEOL 334 - Meteorology • GEOL 340 - Earth Sedimentary Processes • GEOL 370 - Earth Structure and Geophysics • GEOL 425 - Data Analysis for Geoscientists • GEOL 433 - The Land-Surface System • GEOL 434 - Climatology • GEOL 450 - Process Geomorphology • GEOL 455 - Basic Environmental Geology • GEOL 456 - Global Climate Change • GEOL 459 - Introduction to Oceanography • GEOL 470 - Applied Geophysics (GLBS) Global Studies (440) • GLBS 250 - Introduction to Global Studies • GLBS 393 - Global Justice and Human Rights • GLBS 482 - Special Topics in Global Cinema (HSP) Haslam Scholars Program (446)

UT Knoxville Climate Action Plan 51
• HSP 268 - Perspectives on Globalization (IB) International Business (583) • IB 419 - International Environment and Management (IE) Industrial Engineering (556) • IE 304 - Introduction to Human Factors Engineering (JREM) Journalism and Electronic Media (592) • JREM 451 - Environmental Writing (MICR) Microbiology (684) • MICR 209 - Global Medicine and Emerging Infectious Diseases (MSE) Materials Science and Engineering (638) • MSE 470 - Environmental Degradation of Materials (MUCO) Musicology (706) • MUCO 290 - Soundscapes: Exploring Music in a Changing World (NURS) Nursing (720) • NURS 432 - Health Promotion and Maintenance Strategies in the Community (PHIL) Philosophy (745) • PHIL 245 - Environmental Ethics • PHIL 400 – Intergenerational Ethics • PHIL 445 - Advanced Environmental Ethics (PLSC) Plant Sciences (791) • PLSC 210 - Horticulture: Principles and Practices • PLSC 250 - World Food and Fiber Plant Production • PLSC 341 - Integrated Turfgrass Management and Environmental Benefits • PLSC 421 - Native Plants in the Landscape • PLSC 465 - Biofuel Crop Ecology (POLS) Political Science (801) • POLS 471 - International Political Economy (SOWK) Social Work (905)

UT Knoxville Climate Action Plan 52
• SOWK 314 - Human Behavior and the Social Environment (SOCI) Sociology (915) • SOCI 110 - Social Justice and Social Change • SOCI 260 - Introduction to the Study of Environmental Issues • SOCI 360 - Environment and Resources • SOCI 442 - Comparative Poverty and Development • SOCI 446 - The Modern World System • SOCI 460 - Urban Ecology • SOCI 465 - Social Values and the Environment (WFS) Wildlife and Fisheries Science (993) • WFS 301 - Ecology and Management of Wildlife Health • WFS 323 - Human Dimensions of Wildlife and Fisheries • WFS 433 - Amphibian Ecology and Conservation