Knoxville Trade Slides
28
description
Knoxville divergence trading strategy
Transcript of Knoxville Trade Slides


What’s Divergence? Indicator vs. Price
Pretty Little Liars
(Price LIES! Who else would say that?)

Duane from Colorado 2 trades per day
tracking every trade MAKE YOUR OWN RULES!
What days to avoid What systems you “approve” What your max # of trades is
Economic News Hours of the day you trade

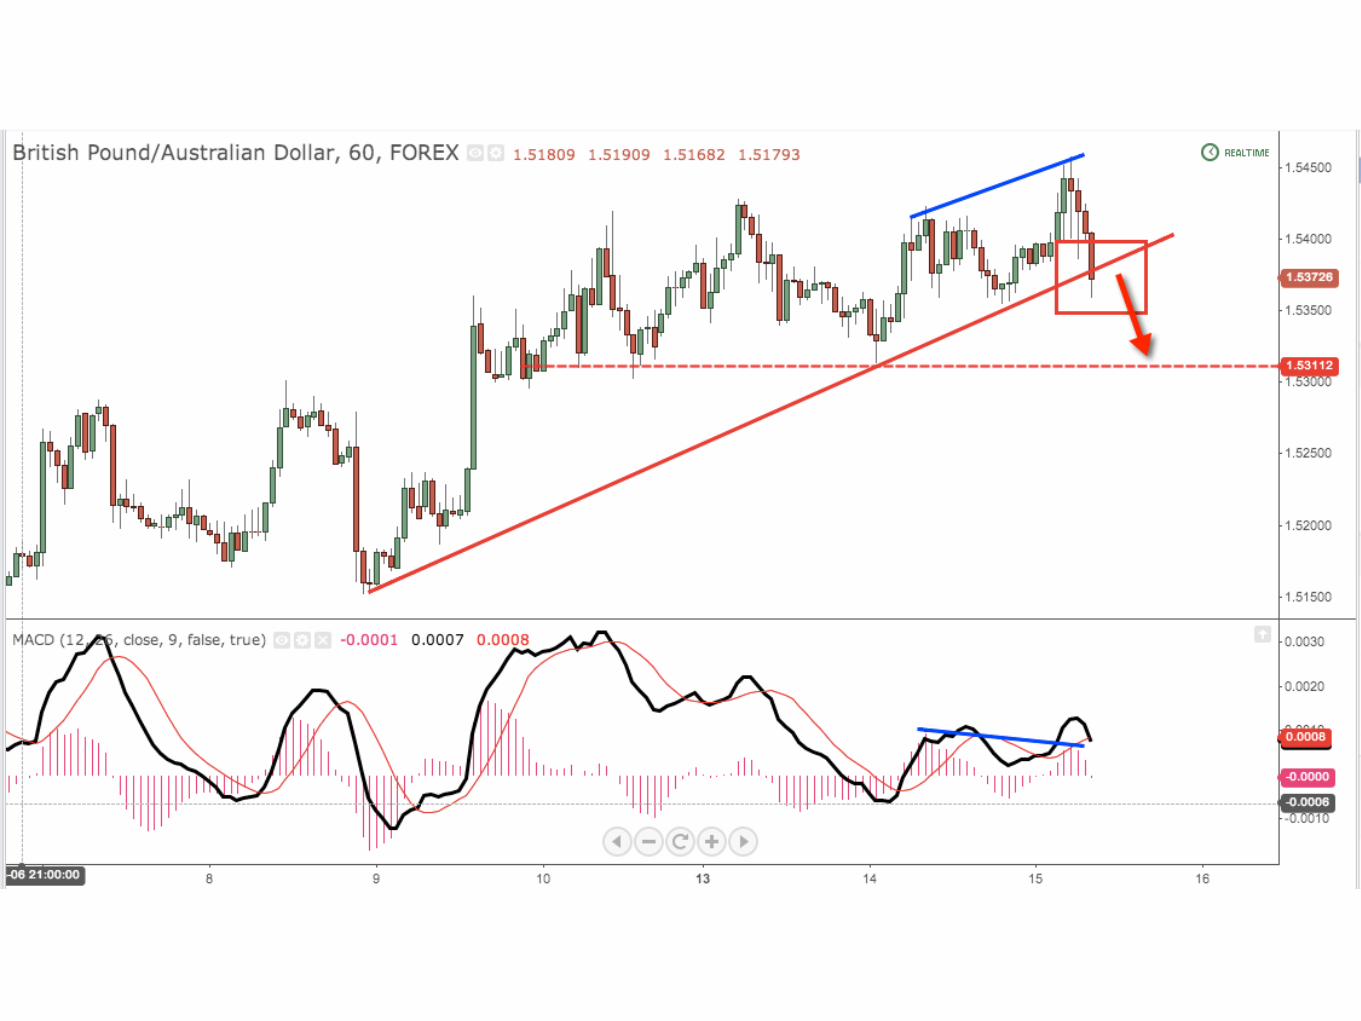
Standard Divergence GBP/AUD 5m chart:
MACD set to 12, 26, 9


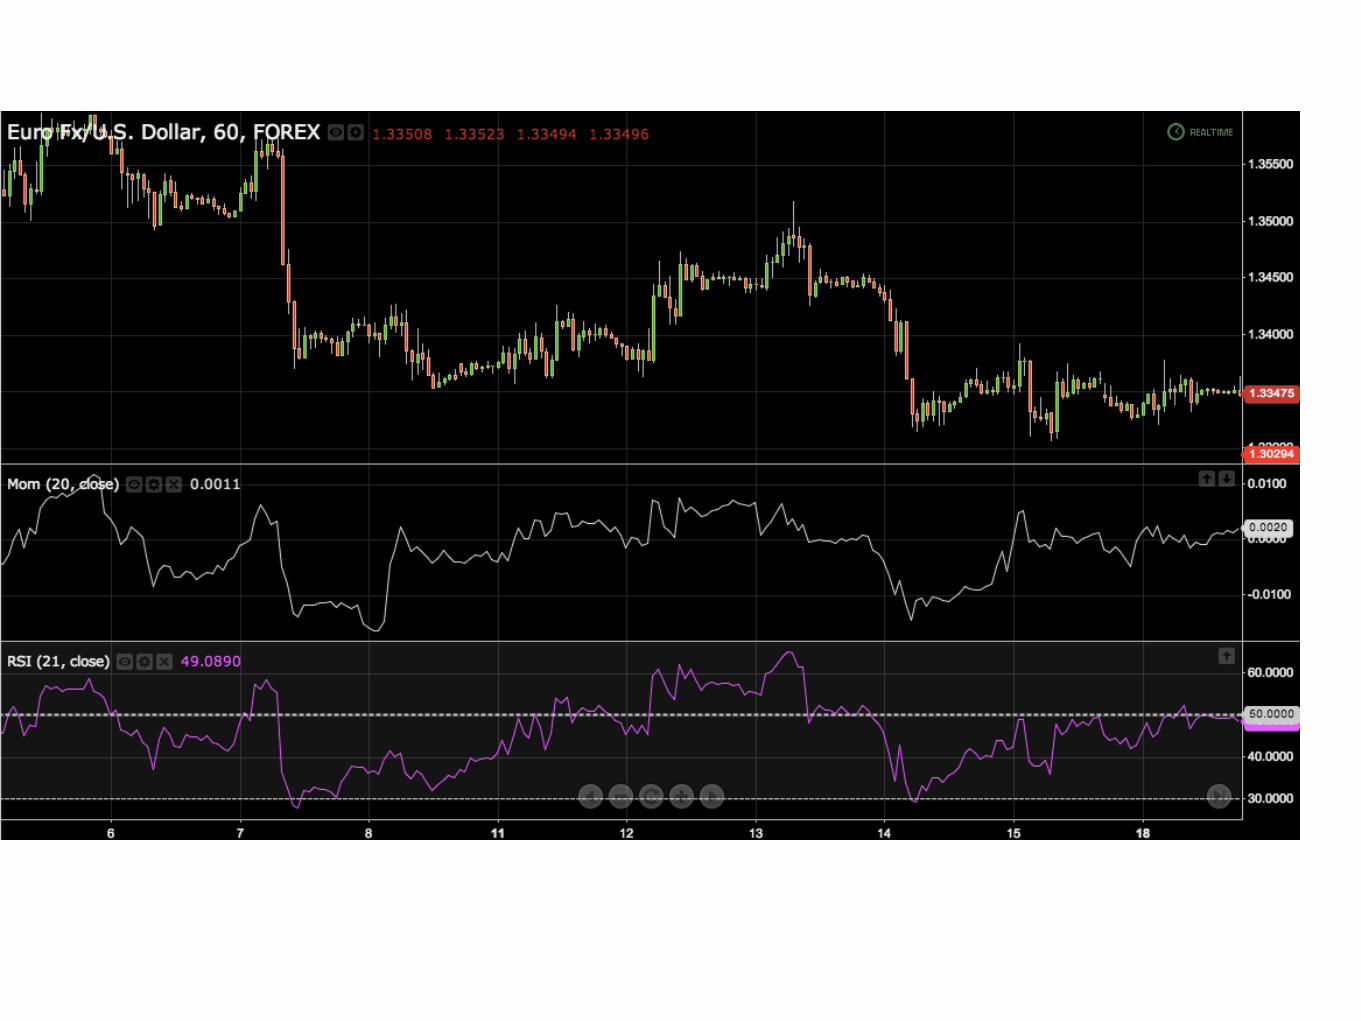
Knoxville Divergence Price Disagrees with:
Momentum (20)
Entry Occurs:
RSI (21) Falls Below 50 mark

Knoxville Divergence Stop-Loss
Below recent low (20 pips) Above recent high (20 pips)
Profit Target
RSI (21) reaches OB(70), OS(30) Or Recent High/Low

Divergence Works: Timeframes:
5m charts on any fx, futures
60/240m charts for stocks
Longer time frames are smoother, like Palmolive skin


Test your skills! Can you spot divergence on the
following charts?