
Using the Oregon Statewide Integrated Model for the Oregon Freight Plan Analysis Prepared for the...
19
Using the Oregon Statewide Integrated Using the Oregon Statewide Integrated Model for the Oregon Freight Plan Model for the Oregon Freight Plan Analysis Analysis Prepared for the TRB SHRP2 Symposium: Innovation in Freight Demand Modeling and Data September 14, 2010 Presented by Tara Weidner Parsons Brinckerhoff
-
Upload
primrose-laureen-hubbard -
Category
Documents
-
view
216 -
download
0
Transcript of Using the Oregon Statewide Integrated Model for the Oregon Freight Plan Analysis Prepared for the...

Using the Oregon Statewide Using the Oregon Statewide Integrated Model for the Integrated Model for the Oregon Freight Plan AnalysisOregon Freight Plan Analysis
Prepared for the TRB SHRP2 Symposium: Innovation in Freight
Demand Modeling and DataSeptember 14, 2010
Presented by Tara WeidnerParsons Brinckerhoff

Presentation HighlightsPresentation Highlights
• Describe Freight Plan analysis• Overview of the Statewide Integrated Model• Reporting model results• Conclusions

Oregon Freight PlanOregon Freight Plan
• First statewide freight plan• Scope of analysis was well matched
to SWIM2 model• ODOT modeling staff served role as
internal consultants• PB modeling staff served as
extension of ODOT staff while continuing model development

StateWide Integrated ModelStateWide Integrated Model (SWIM2) (SWIM2)
ActivityLogsums
Employmentby Industry
Construction$Totals
LaborFlows$
Aggregate/EquilibriumMicro-simulationNext Time Period Feedback
Production Totals
SpaceInventory
TravelTime/Costs
OD Trip TablesTravelTime/Costs
Space PricesOccupied Space
Demand
Mode ChoiceLogsums
HH Labor
Commodity Flows$(internal, import, export)
ECONOMY
LANDDEVELOPMENT
SYNTHETICPOPULATION
ALLOCATION
TRANSPORT
ASSIGNMENT
Person Goods External
SPATIAL

Oregon StateWide Integrated Oregon StateWide Integrated Model (SWIM2) as Forecast ToolModel (SWIM2) as Forecast Tool
• SWIM2 result of 10-year program• SWIM2 integrates the dynamic interactions
of land use, the economy and transportation infrastructure
• SWIM2 is a peer reviewed model • SWIM1 used successfully on several
statewide analyses

Freight Plan Analysis PurposeFreight Plan Analysis Purpose
• Forecast range of likely economic conditions to gain understanding of effects on freight movement– Illustrate variation in statewide and regional
activity and commodity flows– Provide information to support development
of freight strategies

Analytical Approach Analytical Approach
• Use scenarios to evaluate range of possible futures Reference: “business-as-usual” (2.0% CAGR)Optimistic: more economic growth (2.7%)Pessimistic: less economic growth (1.2%)High Transportation Costs: Pessimistic scenario
with 3-fold increase in variable operating costs
• 3 month original schedule

Reporting Out Model ResultsReporting Out Model Results
• Lots of output (80GB/scenario)
• SWIM VIZ:– Single multi-year database (3 GB/scenario)– Visualization tool
• Database approach great – allowed access to data without keeping the large set of files associated with run
• Simultaneous VIZ tool development, and freight-plan specific graphics and performance metrics

SWIM SWIM VIZVIZToolTool
1) Query
2) Tables
3) Visuals

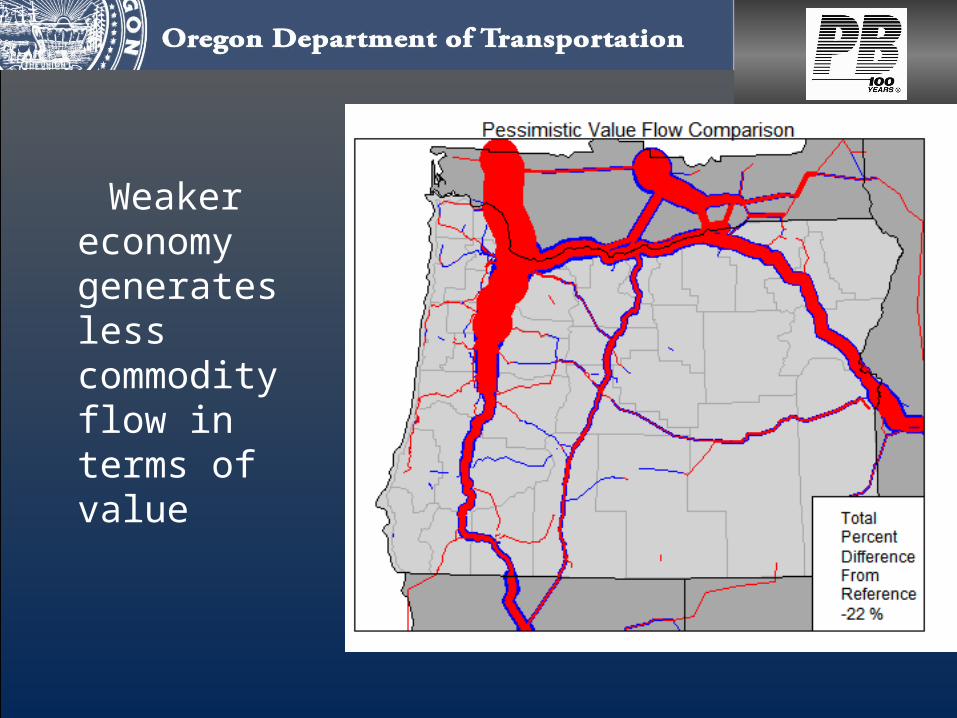
Commodity Tree MapCommodity Tree Map

Significant commodity movement will flow on Oregon’s highway system

Stronger economy generates more commodity flow in terms of value
Stronger economy generates more commodity flow in terms of tons
Weaker economy generates less commodity flow in terms of tons
Weaker economy generates less commodity flow in terms of value

14
Variation by commodity type…
-1.0% 0.0% 1.0% 2.0% 3.0% 4.0% 5.0% 6.0% 7.0% 8.0%
ClayMineralStone
FoodorKindredProducts
ForestorWood
MachineryInstTranspMetals
OtherMisc
PetrolCoalChem
PulpPaper
All Commodities
Statewide Commodity ProductionCAGR 2012-2027
Pessimist
Reference
Optimist
15
Variation by industry sector…
0.0% 1.0% 2.0% 3.0% 4.0% 5.0% 6.0% 7.0%
Ag, Mining, Food
Electronics, Durables, Construction
Forestry, Wood
Gov't, Education, Biz Services,Accommodations
Health
Paper, NonDurables
Retail, Personal Service, Communication
All Industries
Statewide Compound Average Growth Rate 2012-2027
Pessimist
Reference
Optimist

16
Variation by region…
0.0% 1.0% 2.0% 3.0% 4.0% 5.0% 6.0%
ACT1 NW
ACT10 SW
ACT11 SE
ACT12 Lane
ACT2 Portland
ACT3 NE
ACT4 Scentral
ACT5 RV
ACT6 Lower JD
ACT7 Central
ACT8 SW
ACT9 CascadesW
Oregon
All Industry Compound Average Growth Rate 2012-2027
Pessimist
Reference
Optimist

17
Truck Tour CharacteristicsTruck Tour Characteristics
17
Figure X. Average Truck Tour Travel Distance
300
350
400
450
2009 2012 2015 2018 2021 2024 2027
year
mile
s
Reference
High Cost
Optimistic
Pessimistic
Truck tours get shorter because of congestion, but more trucks are needed to transport freight, further contributing to congestion.
Figure X. Average Truck Tour Travel Time
600
650
700
750
800
850
2009 2012 2015 2018 2021 2024 2027
year
min
ute
s
Reference
High Cost
Optimistic
Pessimistic

ConclusionConclusion
• SWIM2 model added value to state freight policy
• Integrated model allowed view of commodity flows (tons and value) and truck trip/tours by scenario
• Visualization database and tools key to mining volume of output and discerning complex responses

For more information…For more information…
Oregon Freight Plan: http://www.oregon.gov/ODOT/TD/FREIGHT/FREIGHT_PLAN.shtml
Becky KnudsonOregon DOT, Planning Analysis [email protected]
Tara WeidnerParsons [email protected]


![Moving Forward: Insights and Actions from the SHRP2 ...shrp2.transportation.org/Documents/Capacity/Freight Data Workshop… · D] }µ ]UE Áz} lUZZ} / ov Uv t] }v ]vX }v W:uo ol]](https://static.fdocuments.us/doc/165x107/5f61ef31fab12d1fff1cd183/moving-forward-insights-and-actions-from-the-shrp2-shrp2-data-workshop-d.jpg)


