Using Standardized Formative Assessments to …...Using Standardized Formative Assessments to...
101
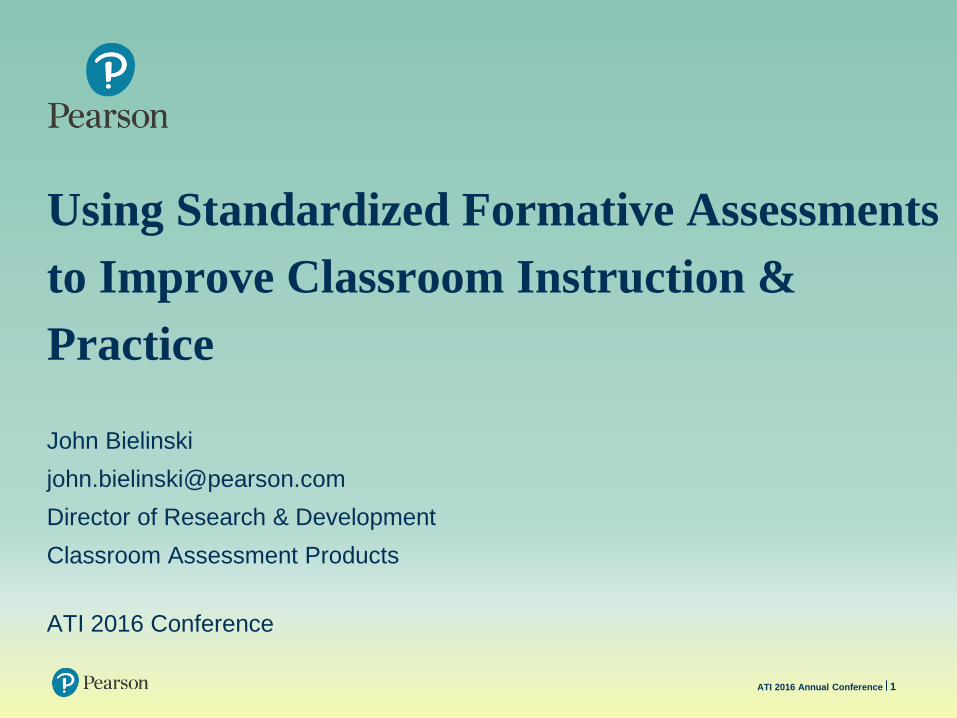
Using Standardized Formative Assessments to Improve Classroom Instruction & Practice John Bielinski [email protected] Director of Research & Development Classroom Assessment Products ATI 2016 Conference 1 ATI 2016 Annual Conference
Transcript of Using Standardized Formative Assessments to …...Using Standardized Formative Assessments to...
Using Standardized Formative Assessments
to Improve Classroom Instruction &
Practice
John Bielinski
Director of Research & Development
Classroom Assessment Products
ATI 2016 Conference
1ATI 2016 Annual Conference

Summary
Expert teachers combine professional judgment from the myriad personal
interactions with students and objective performance data to tailor
instruction to the needs of the students.
Most schools use standardized assessments (SA) to make decisions
about programs and students; but, most classroom teachers have not
been adequately trained on how to make effective use of those results,
and many do not trust SA.
This presentation provides a glimpse into the process of standardization
and how to use and interpret scores from SA. Participants will learn about
the factors that influence quality SA development and apply an
interpretive framework to make an action plan using actual student data
2Standardized Formative Assessment
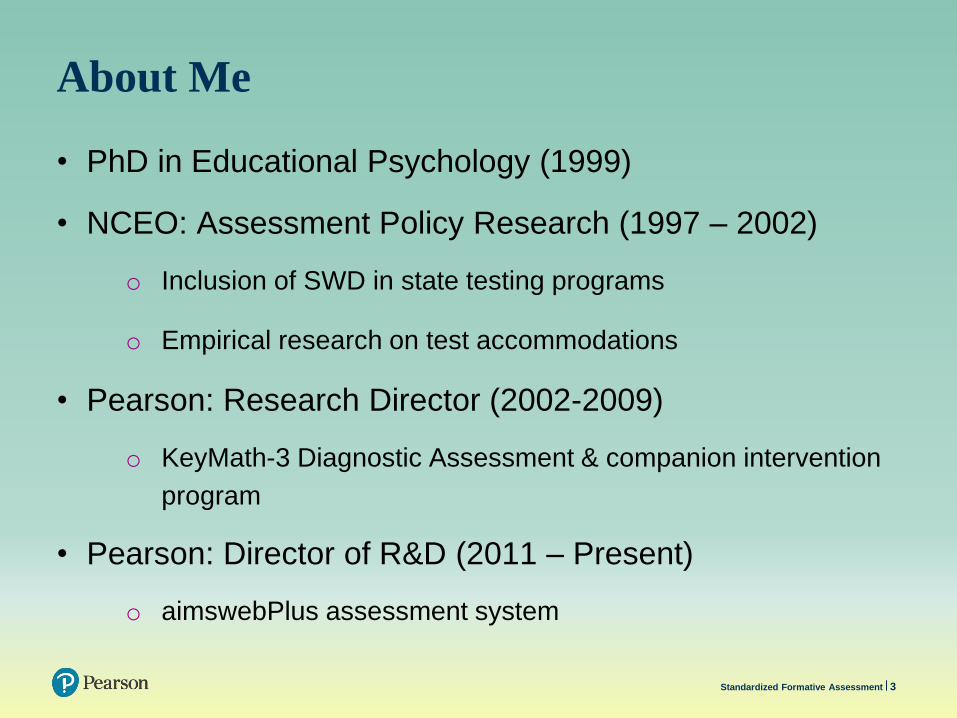
About Me
• PhD in Educational Psychology (1999)
• NCEO: Assessment Policy Research (1997 – 2002)
o Inclusion of SWD in state testing programs
o Empirical research on test accommodations
• Pearson: Research Director (2002-2009)
o KeyMath-3 Diagnostic Assessment & companion intervention
program
• Pearson: Director of R&D (2011 – Present)
o aimswebPlus assessment system
3Standardized Formative Assessment

What is meant by standardization and why
do we do it?
How do standardized assessments (SA)
differ from classroom assessment?
What is your perspective on the usefulness
of SA for educators?
What do I need to know about SA to put it
to work for me?
4Standardized Formative Assessment

5Presentation Title Arial Bold 7 pt
Scientific Law
a statement of fact, deduced from observation, to
the effect that a particular natural or scientific
phenomenon always occurs if certain conditions are
present.
Natural Laws (e.g., Physics) are pervasive
Laws of human behavior are virtually non-existent
Learning requires attention
Individuals differ on all human behaviors
6Presentation Title Arial Bold 7 pt
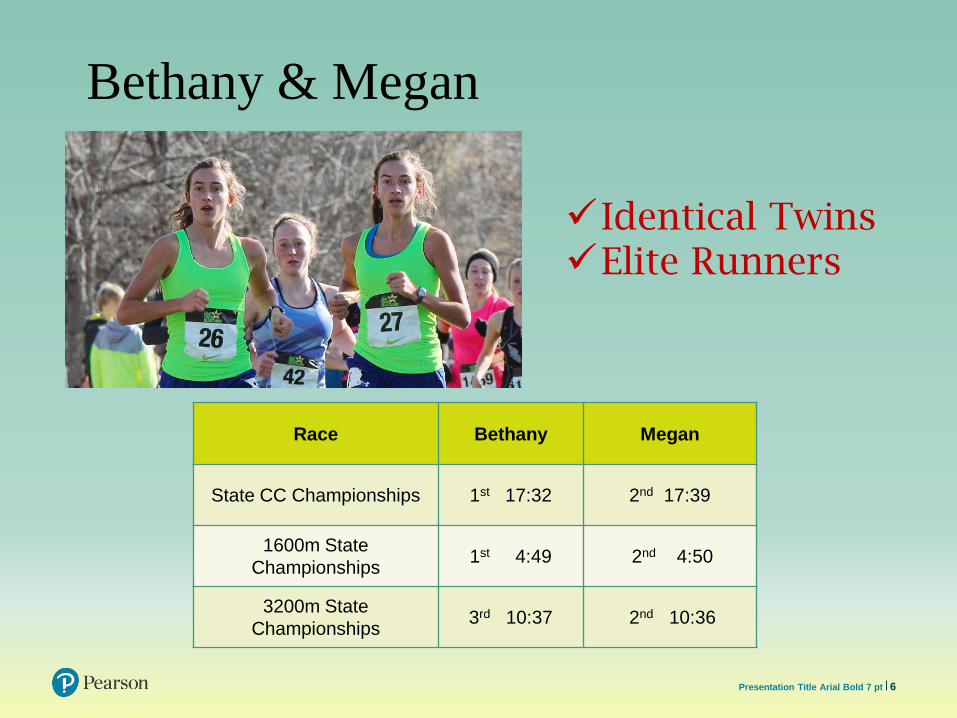
Bethany & Megan
Identical TwinsElite Runners
Race Bethany Megan
State CC Championships 1st 17:32 2nd 17:39
1600m State
Championships1st 4:49 2nd 4:50
3200m State
Championships3rd 10:37 2nd 10:36

7Presentation Title Arial Bold 7 pt
Bob & Steve
BrothersElite Runners
Race Bob Steve
3200 m (HS) 9:16.9 9:16.6
Marathon 2:08:24 (AR) 2:42:16

8Presentation Title Arial Bold 7 pt
The content and task interactions in
standardized assessments
are constrained by cost, time, and infrastructure
must take into account individual differences in student experiences, interests, and capabilities

9Presentation Title Arial Bold 7 pt

10Presentation Title Arial Bold 7 pt

11Presentation Title Arial Bold 7 pt
Number Comparison administered to adults

12Presentation Title Arial Bold 7 pt
Number Comparison administered to Grade 3

13Presentation Title Arial Bold 7 pt
Number Comparison administered to Spring Grade 1

14Presentation Title Arial Bold 7 pt
Number Comparison administered to Fall Grade 1
15Presentation Title Arial Bold 7 pt
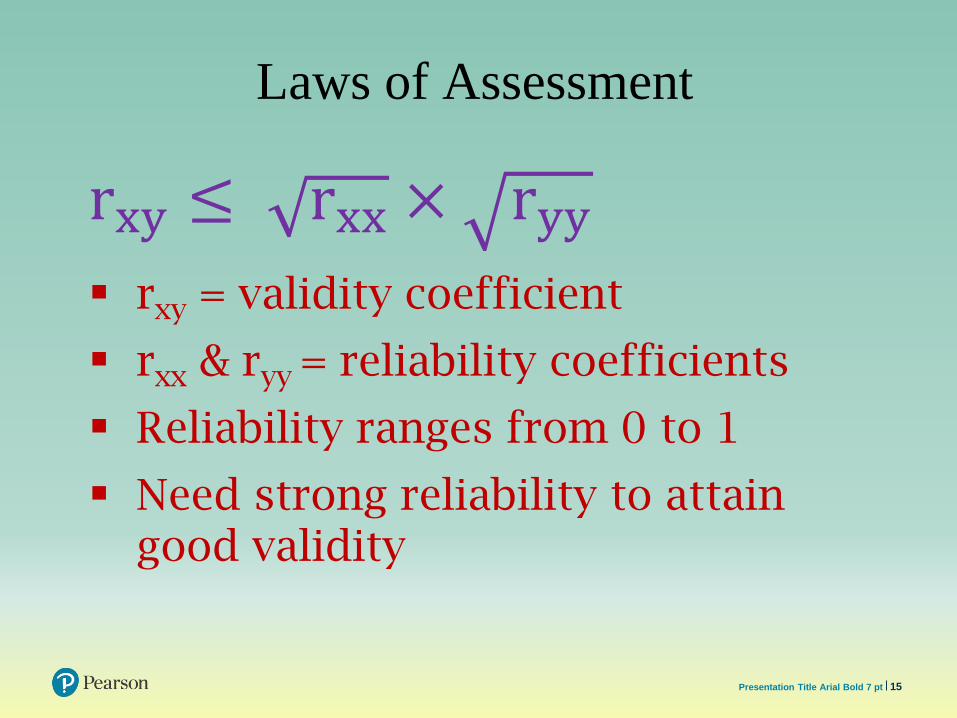
Laws of Assessment
rxy ≤ rxx × ryy rxy = validity coefficient
rxx & ryy = reliability coefficients
Reliability ranges from 0 to 1
Need strong reliability to attain good validity

16Presentation Title Arial Bold 7 pt
Reliability increases with the number of positively correlated observations
Toward a Common
Understanding of
Assessment
18Presentation Title Arial Bold 7 pt
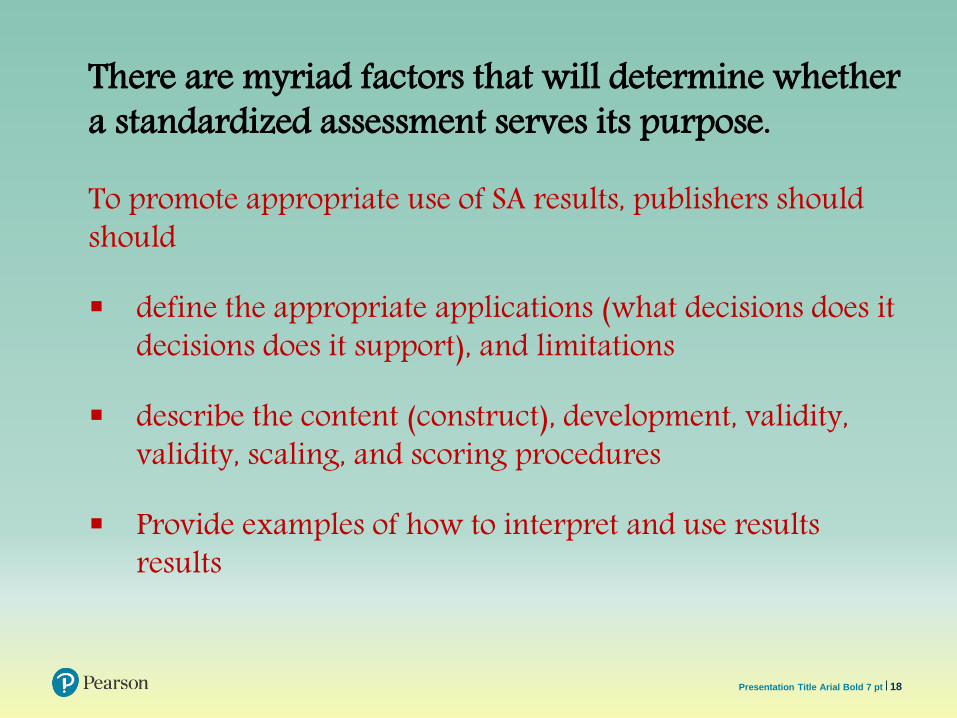
There are myriad factors that will determine whether a standardized assessment serves its purpose.
To promote appropriate use of SA results, publishers shouldshould
define the appropriate applications (what decisions does it decisions does it support), and limitations
describe the content (construct), development, validity, validity, scaling, and scoring procedures
Provide examples of how to interpret and use resultsresults

19Presentation Title Arial Bold 7 pt
AND
Consumers of SA results need training training and professional development on what the scores mean scores mean and how to use the results
20Presentation Title Arial Bold 7 pt
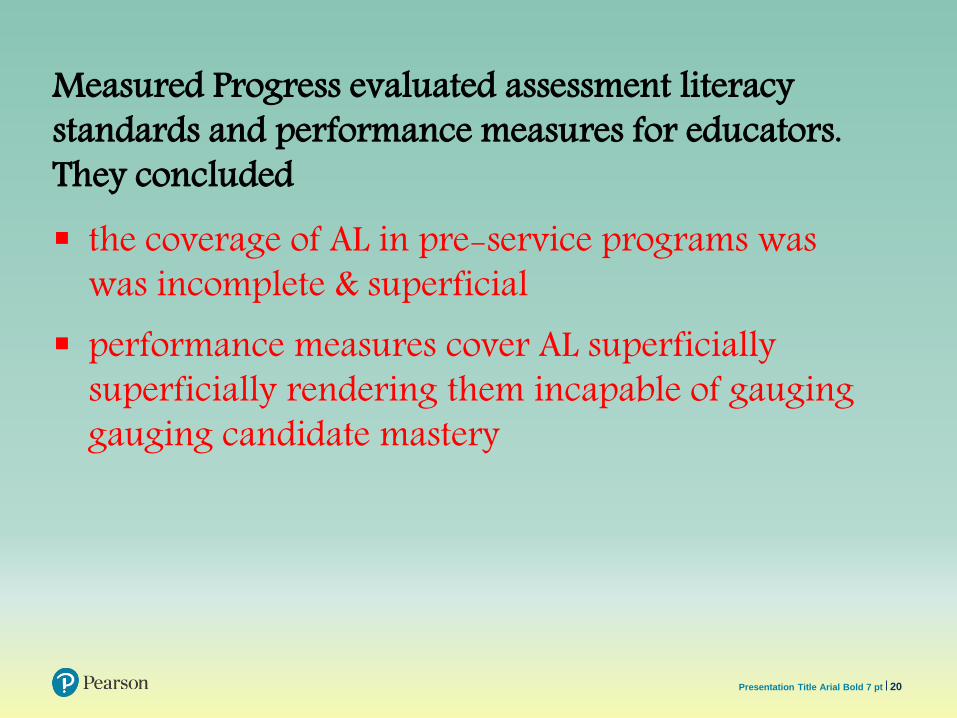
Measured Progress evaluated assessment literacy standards and performance measures for educators. They concluded the coverage of AL in pre-service programs was
was incomplete & superficial performance measures cover AL superficially
superficially rendering them incapable of gauging gauging candidate mastery
21Presentation Title Arial Bold 7 pt
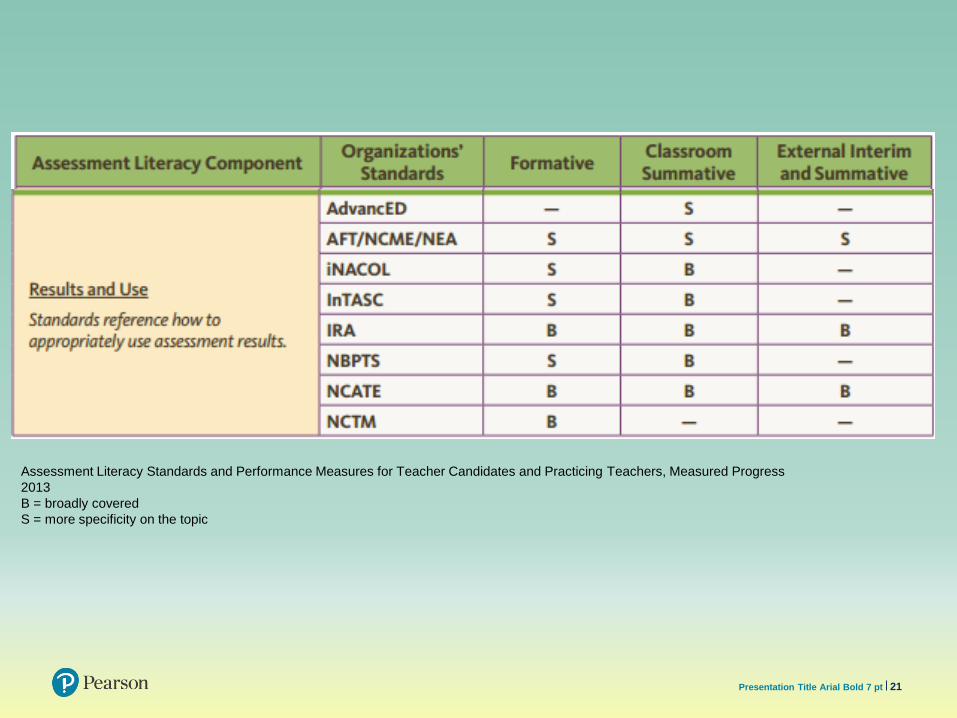
Assessment Literacy Standards and Performance Measures for Teacher Candidates and Practicing Teachers, Measured Progress
2013
B = broadly covered
S = more specificity on the topic
22Presentation Title Arial Bold 7 pt
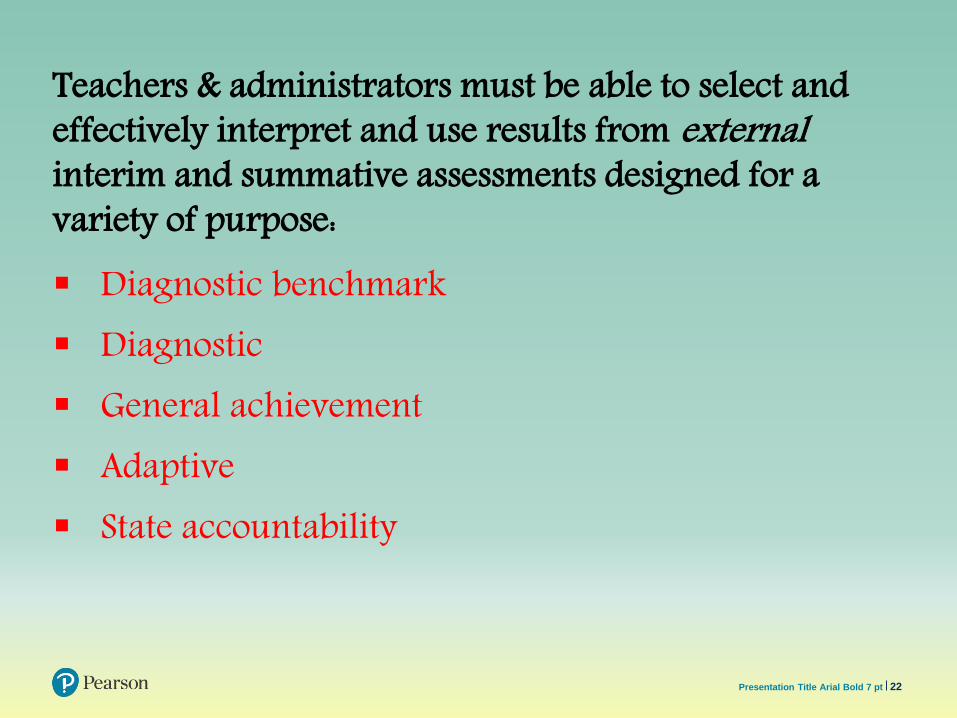
Teachers & administrators must be able to select and effectively interpret and use results from external interim and summative assessments designed for a variety of purpose: Diagnostic benchmark Diagnostic General achievement Adaptive State accountability
23Presentation Title Arial Bold 7 pt
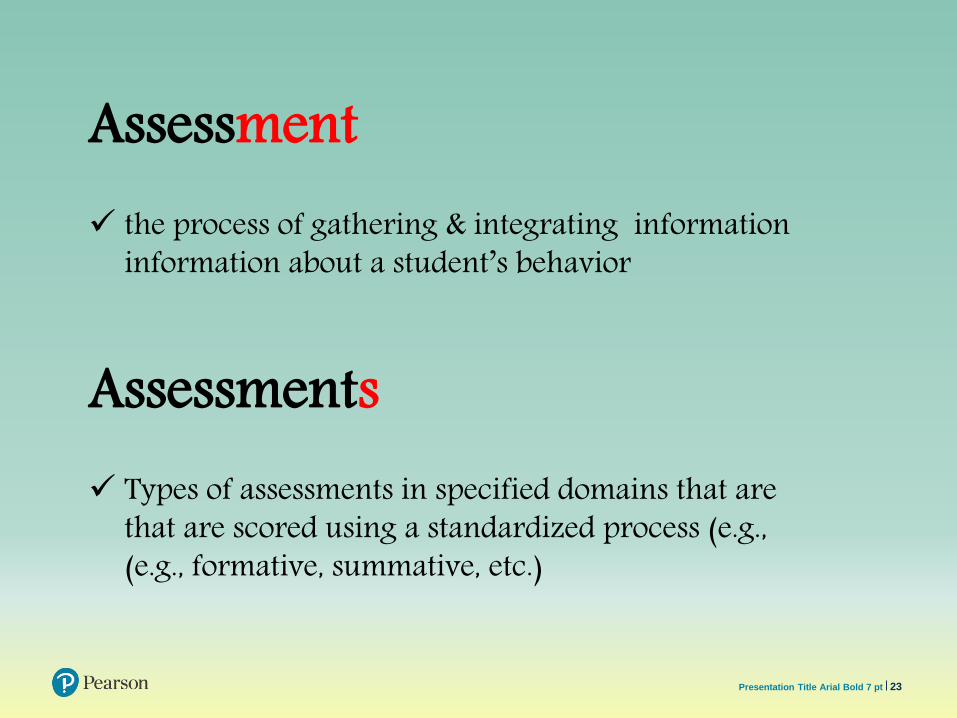
Assessment the process of gathering & integrating information
information about a student’s behavior
Assessments Types of assessments in specified domains that are
that are scored using a standardized process (e.g., (e.g., formative, summative, etc.)

24Presentation Title Arial Bold 7 pt
Formative ongoing assessment of student learning to provide feedback
feedback to improve teaching and shape subsequent student subsequent student learning
Summative evaluate student learning at the end of instruction
Interim (benchmark) periodic evaluation of student progress toward learning
learning targets
Diagnostic evaluation of student knowledge and skills to determine
determine areas of strength and weakness

Presentation Title Arial Bold 7 pt
Questions during
Instruction
End of
Unit QuizInterim
(district testing)
End of
Course Test
Adju
stin
g I
nstr
uctio
n
What Students Know and Can Do
Low Info High Info
Lo
w In
foH
igh
In
fo
State
Tests

26Presentation Title Arial Bold 7 pt
Formative
State
SummativeClassroom
Interim
Diagnostic
50 million students in US

27Presentation Title Arial Bold 7 pt
State
Summative
Diagnostic
50 million students in US
Classroom
FormativeInterim

Formative Assessment
‒ Assess understanding in real time
‒ Assess engagement
‒ Adapt instruction
‒ Involve students
‒ Classroom or student-centered
‒ Informal or formal
‒ Embedded in instruction
‒ Rubrics, percent correct, letter grade
28Presentation Title Arial Bold 7 pt
Teacher-Developed Standardized
Purpose
Qualities
Scores
‒ Assess understanding
‒ Compare to benchmark(s)
‒ Determine risk
‒ Adapt instruction
‒ Grade-centered
‒ Formal
‒ Distinct event
‒ Number correct, scale score
‒ Percentiles
‒ Performance levels

29Presentation Title Arial Bold 7 pt
Assessment Utility Rating
ApproachAssessment
Type
Instructional
Utility
Program
Evaluation
Formative
Interim
Summative
Formative
Interim
Summative
Teacher
Standardized
• Rate the three types of assessment on their utility to
guide instructional planning and to evaluate programs
• Scale: 1 (very low), 10 (very high)

30Presentation Title Arial Bold 7 pt
Assessment Utility Results
Standardization
32Presentation Title Arial Bold 7 pt

33Presentation Title Arial Bold 7 pt
The STANDARDS
Foundations
Validity (25 stds)
Reliability (20 stds)
Fairness (20 stds)
Operations (e.g., scoring, administration, interpretation)
Testing Applications

34Presentation Title Arial Bold 7 pt
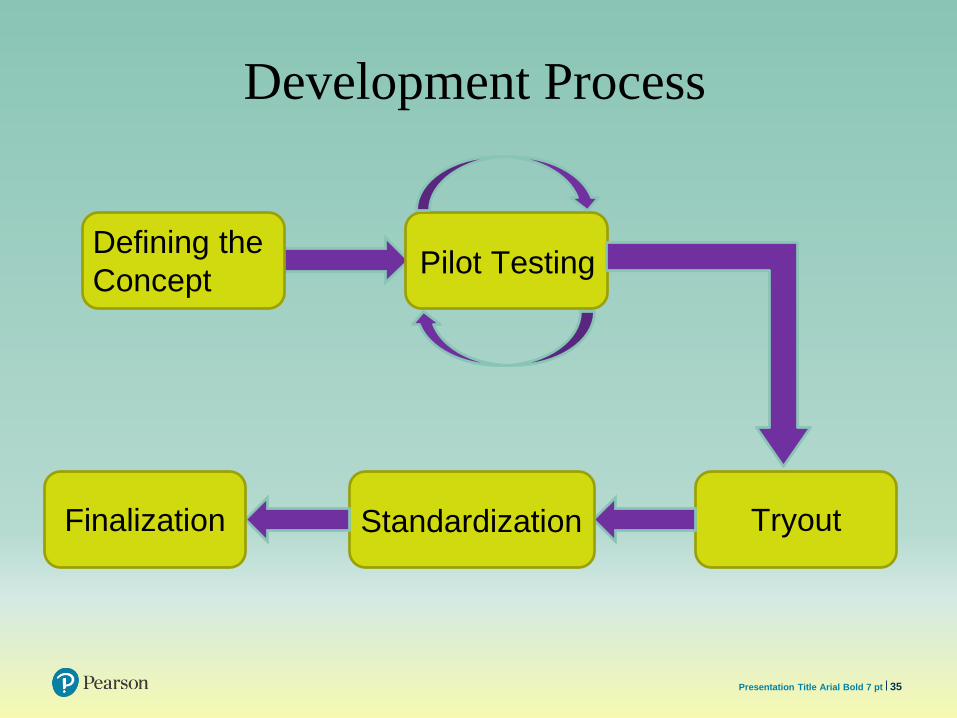
High quality standardized assessment
development
Begins with a clear description how the results
will be used AND requires
high quality item development (text, art,
interactions)
trying it out on target population
strong validation evidence to support
claims/uses
35Presentation Title Arial Bold 7 pt
Development Process
Defining the
ConceptPilot Testing
TryoutStandardizationFinalization

36
Build an assessment system that:
• Accurately determines levels of academic risk
• Assesses current learning standards
• Supports differentiated instruction
• Can be used for RtI/MTSS
• Provides data for program planning &
resource allocation
37
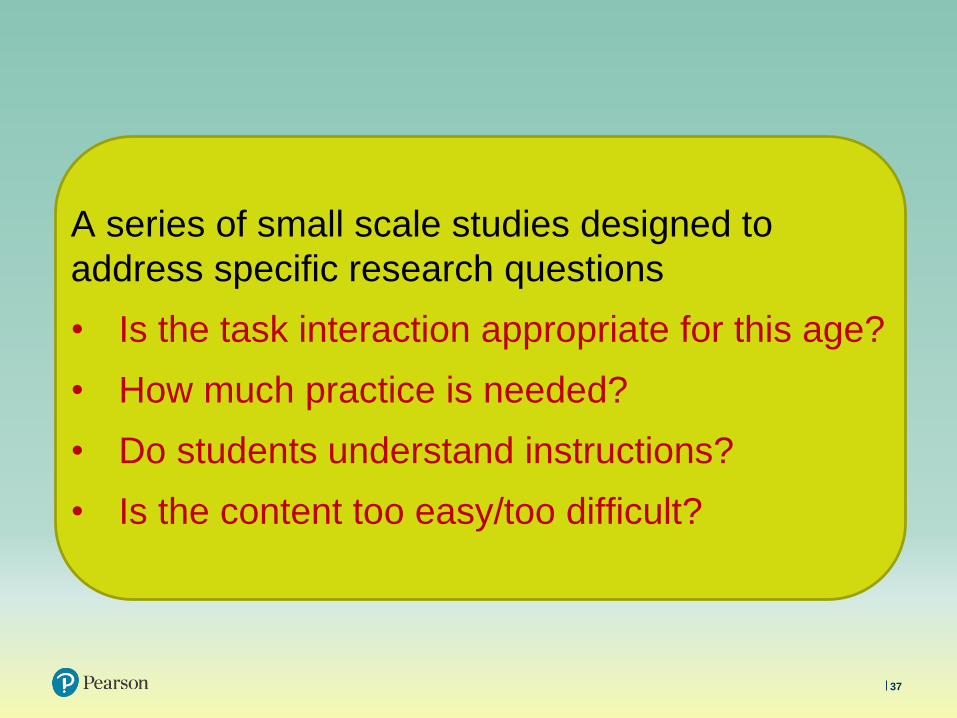
A series of small scale studies designed to
address specific research questions
• Is the task interaction appropriate for this age?
• How much practice is needed?
• Do students understand instructions?
• Is the content too easy/too difficult?

38
A large-scale study designed to assess item
characteristics & build final forms
• Item Difficulty & Reliability
• Item Bias & Differential Item Functioning
• Refine item pool as necessary
• Build test forms

39
A large-scale study with a diverse and nationally
representative sample designed to
• Finalize scoring rules & create the score scale
• Generate norms (e.g., national percentiles)
• Evaluate validity & reliability

40
Prepare the product for launch
• Finalize system UI, logic, and reporting
features
• Complete supporting guides (e.g., directions
for administration, technical manual, etc.)
• Beta test

aimswebPlusTM Math
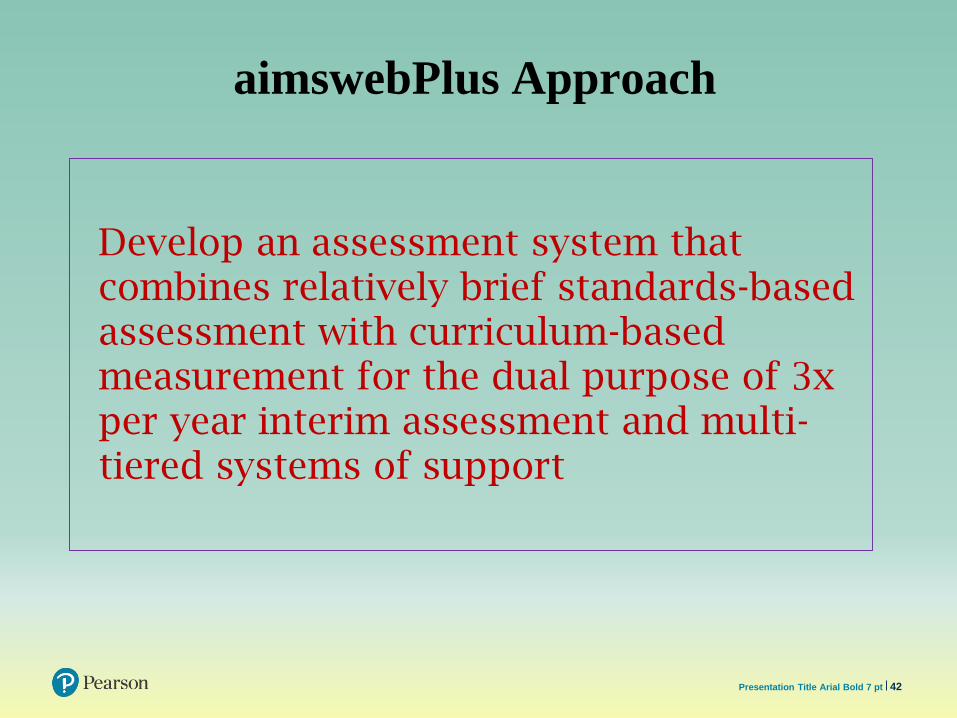
42Presentation Title Arial Bold 7 pt
aimswebPlus Approach
Develop an assessment system that combines relatively brief standards-based assessment with curriculum-based measurement for the dual purpose of 3x per year interim assessment and multi-tiered systems of support

43Presentation Title Arial Bold 7 pt
Improve predictive validity
Enhance diagnostic utility
Maintain or improve sensitivity to growth
Go fully digital
Keep administration time brief
Product Goals

44Presentation Title Arial Bold 7 pt
Predict overall math achievement
Provide information for instructional planning (individual students & classrooms)
Are delivered online
Are brief
Are sensitive to growth
How to design math CBM that:
45Presentation Title Arial Bold 7 pt
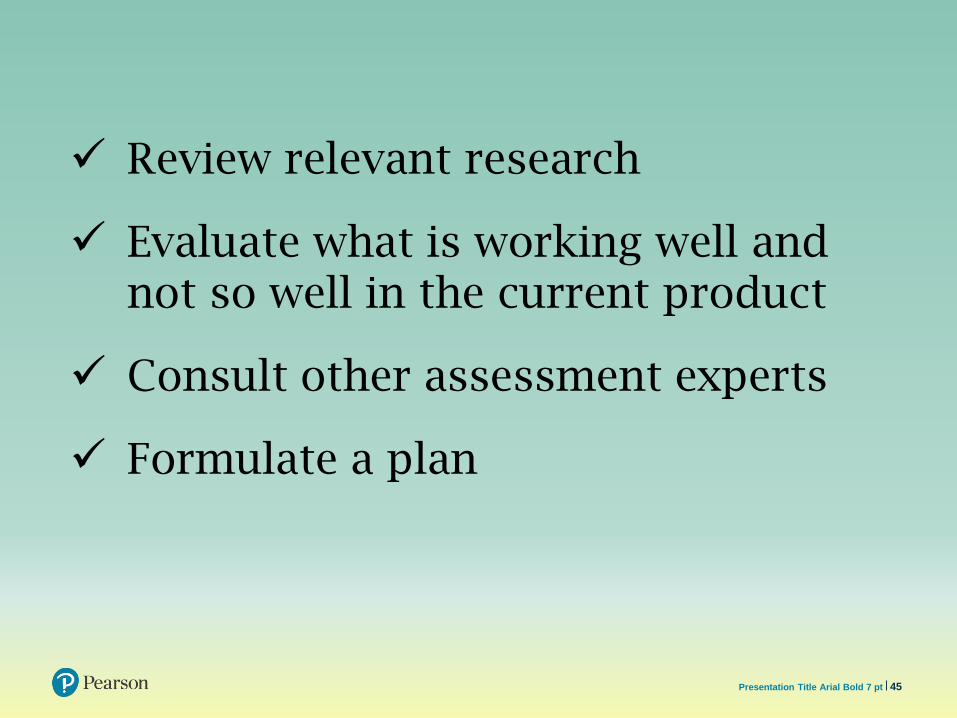
Review relevant research
Evaluate what is working well and not so well in the current product
Consult other assessment experts
Formulate a plan
46Presentation Title Arial Bold 7 pt
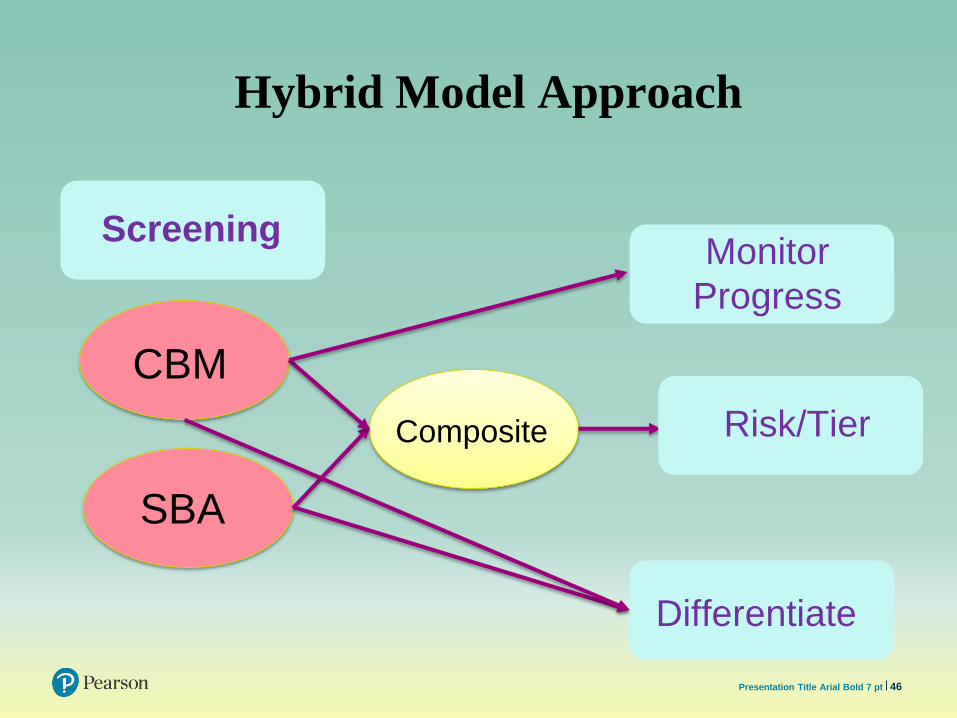
Hybrid Model Approach
CBM
SBA
Composite
Monitor
Progress
Differentiate
Risk/Tier
Screening
47Presentation Title Arial Bold 7 pt
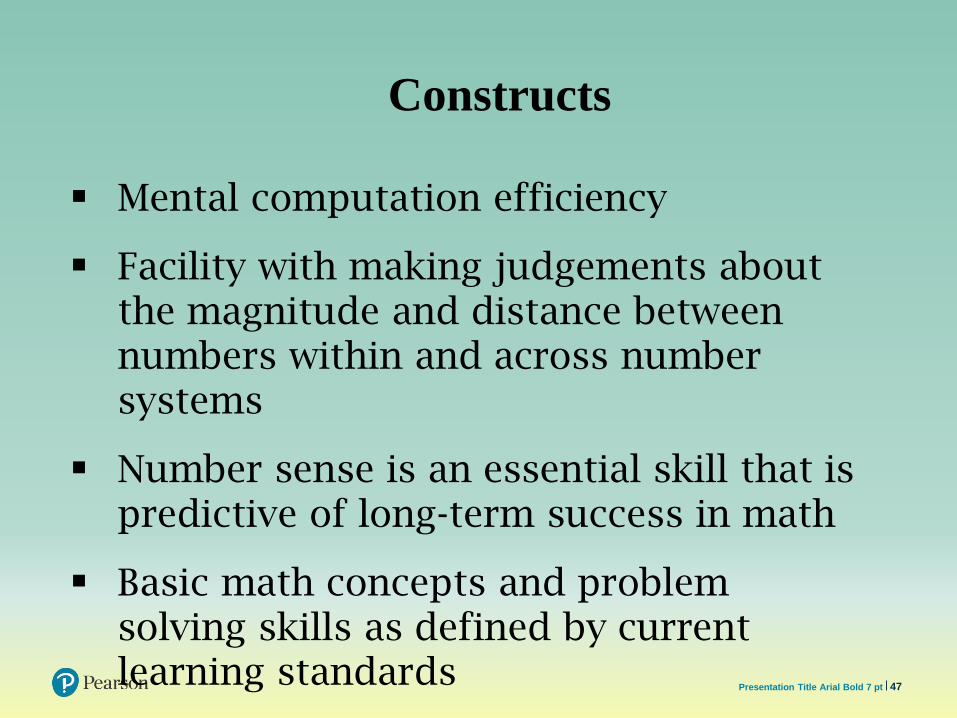
Mental computation efficiency
Facility with making judgements about the magnitude and distance between numbers within and across number systems
Number sense is an essential skill that is predictive of long-term success in math
Basic math concepts and problem solving skills as defined by current learning standards
Constructs
48Presentation Title Arial Bold 7 pt
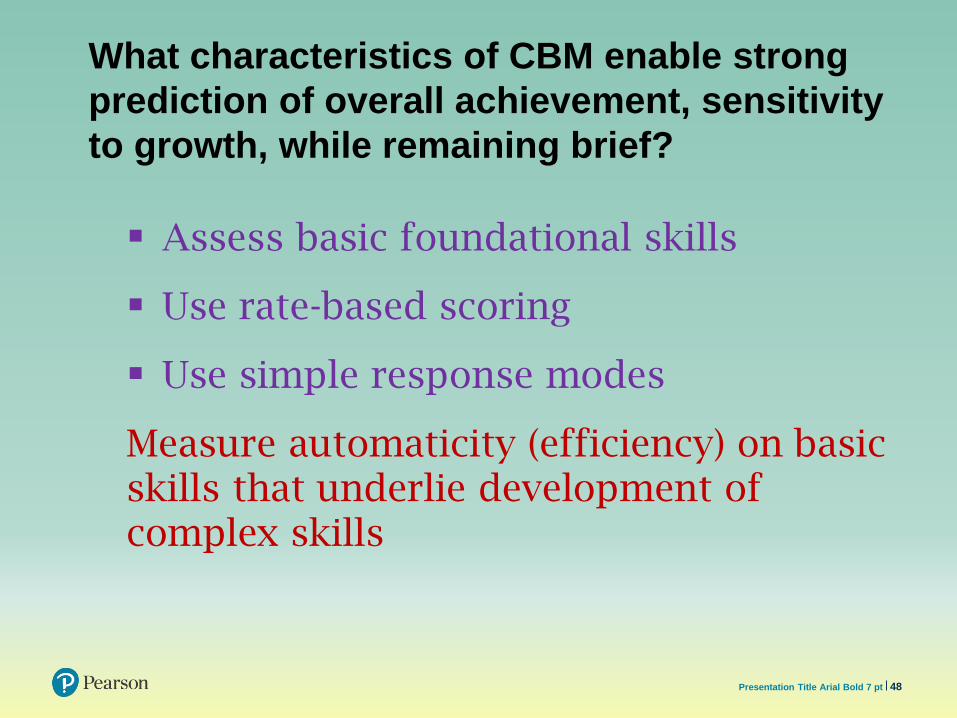
What characteristics of CBM enable strong
prediction of overall achievement, sensitivity
to growth, while remaining brief?
Assess basic foundational skills
Use rate-based scoring
Use simple response modes
Measure automaticity (efficiency) on basic skills that underlie development of complex skills
49Presentation Title Arial Bold 7 pt
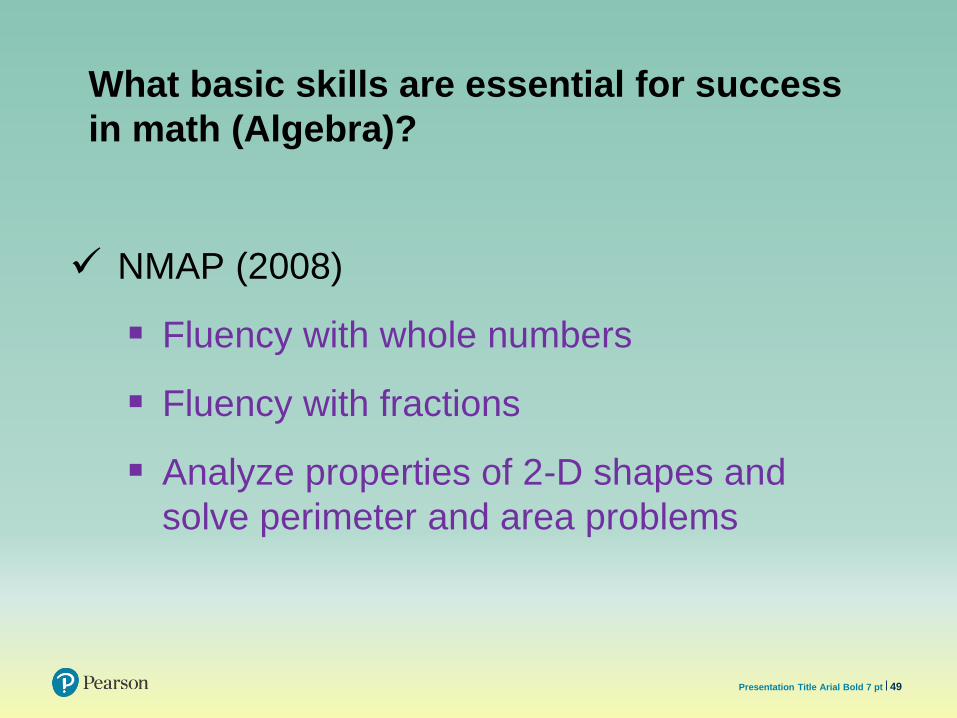
What basic skills are essential for success
in math (Algebra)?
NMAP (2008)
Fluency with whole numbers
Fluency with fractions
Analyze properties of 2-D shapes and
solve perimeter and area problems
50Presentation Title Arial Bold 7 pt
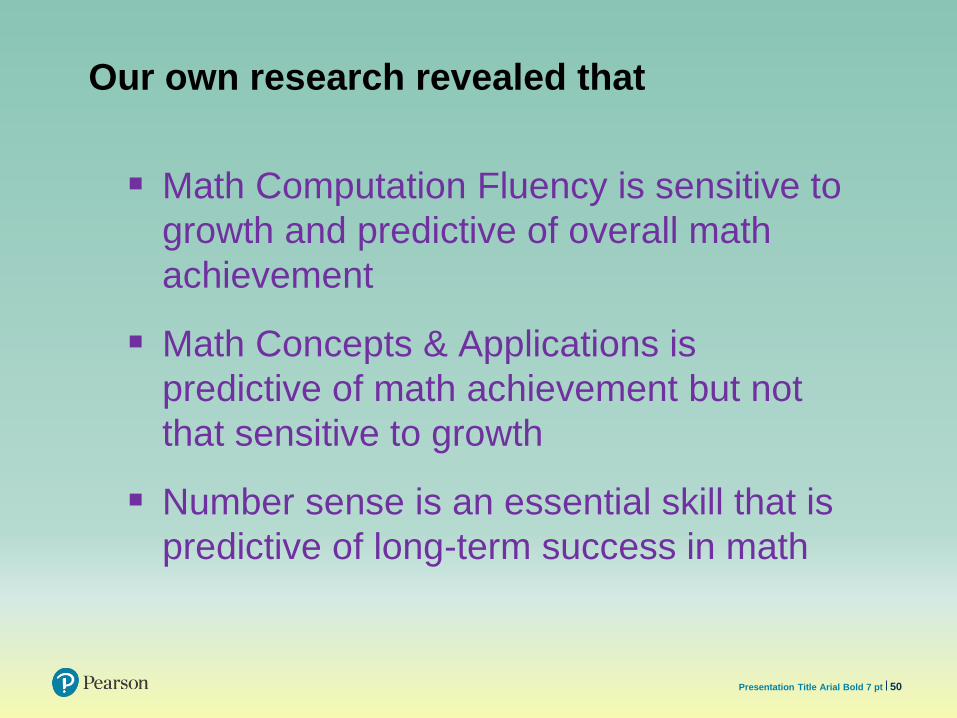
Our own research revealed that
Math Computation Fluency is sensitive to
growth and predictive of overall math
achievement
Math Concepts & Applications is
predictive of math achievement but not
that sensitive to growth
Number sense is an essential skill that is
predictive of long-term success in math
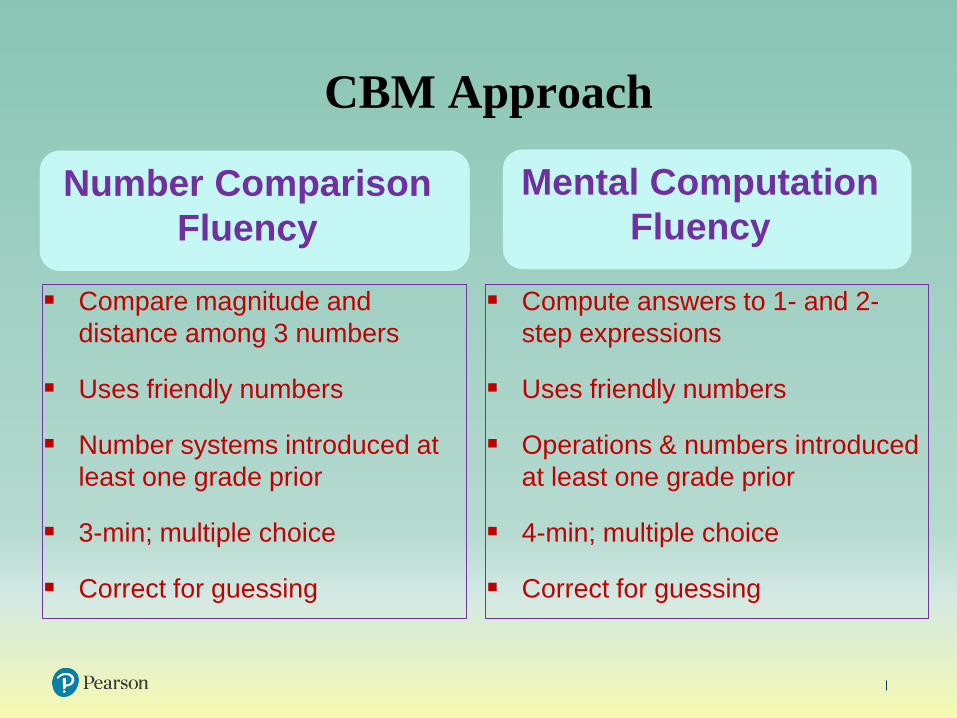
CBM Approach
Mental Computation
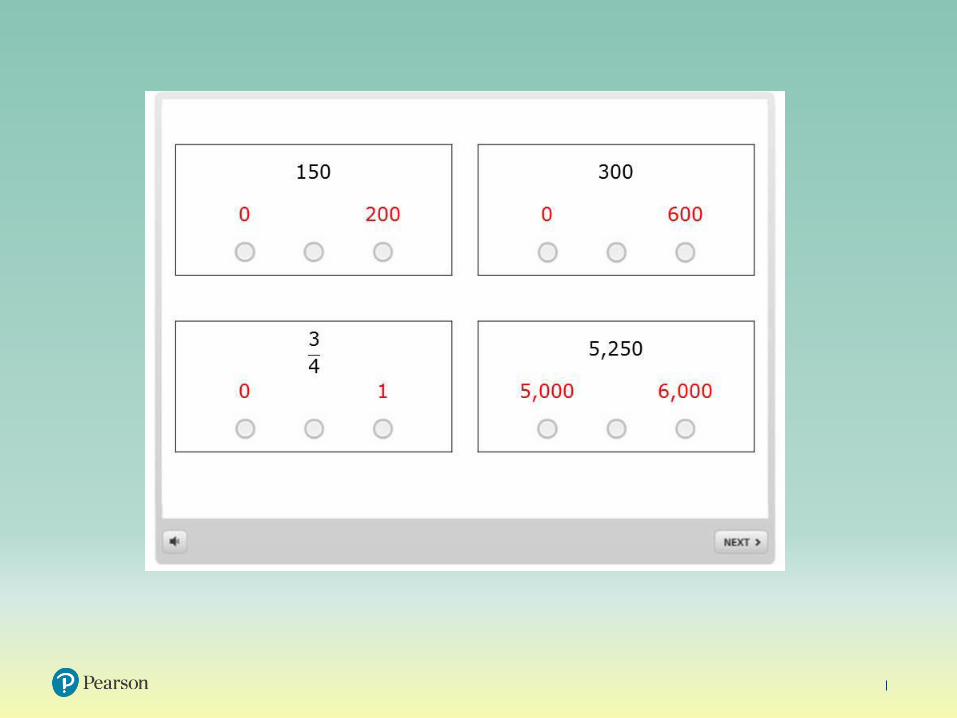
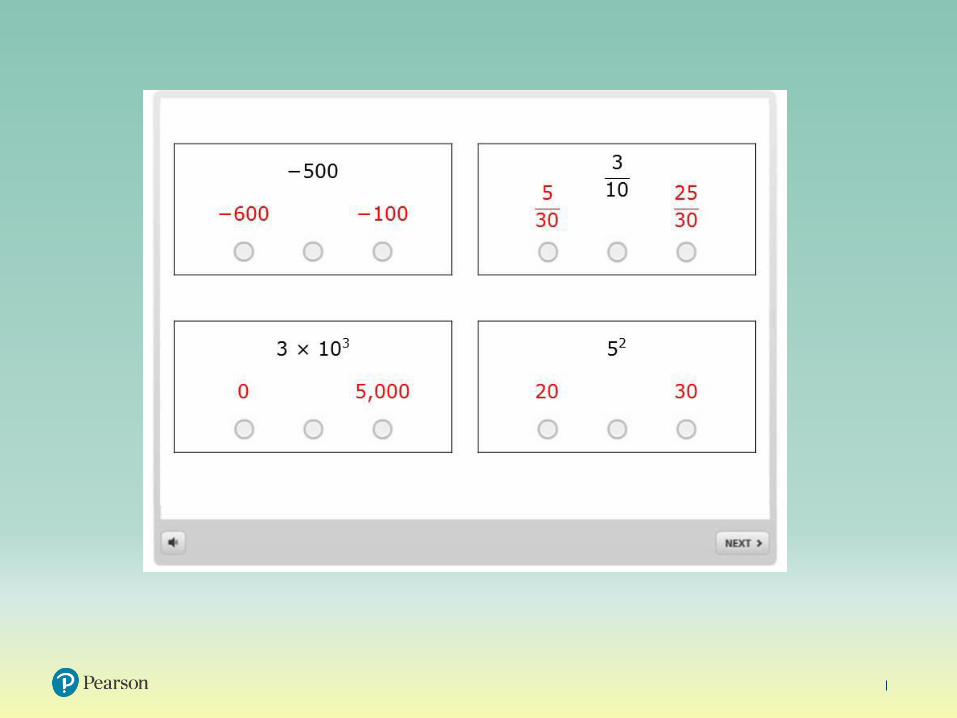
FluencyNumber Comparison
Fluency
Compute answers to 1- and 2-
step expressions
Uses friendly numbers
Operations & numbers introduced
at least one grade prior
4-min; multiple choice
Correct for guessing
Compare magnitude and
distance among 3 numbers
Uses friendly numbers
Number systems introduced at
least one grade prior
3-min; multiple choice
Correct for guessing
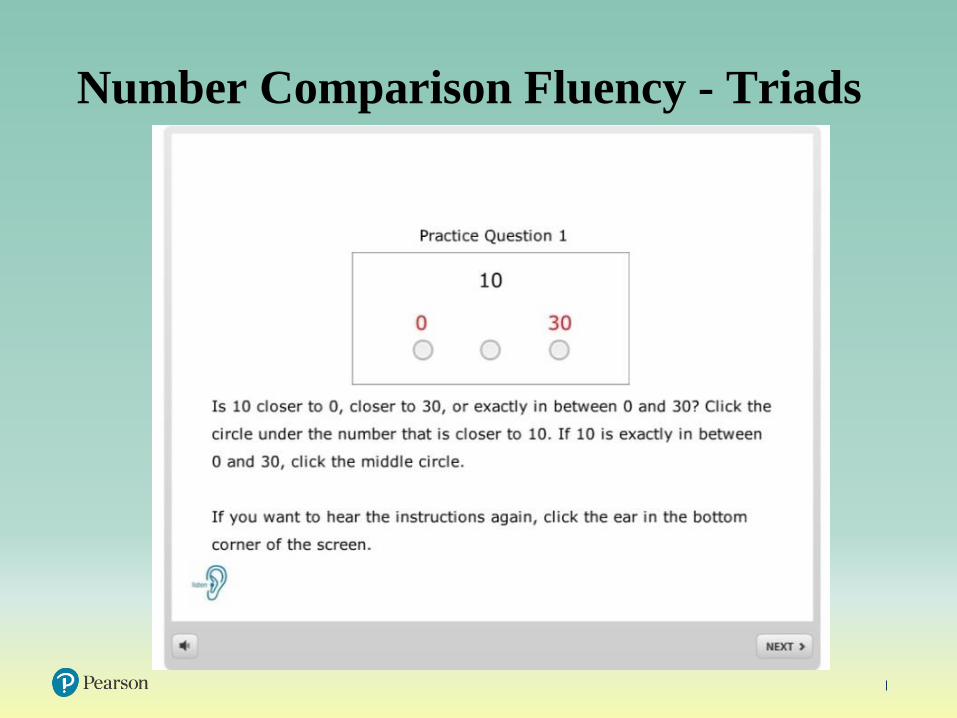
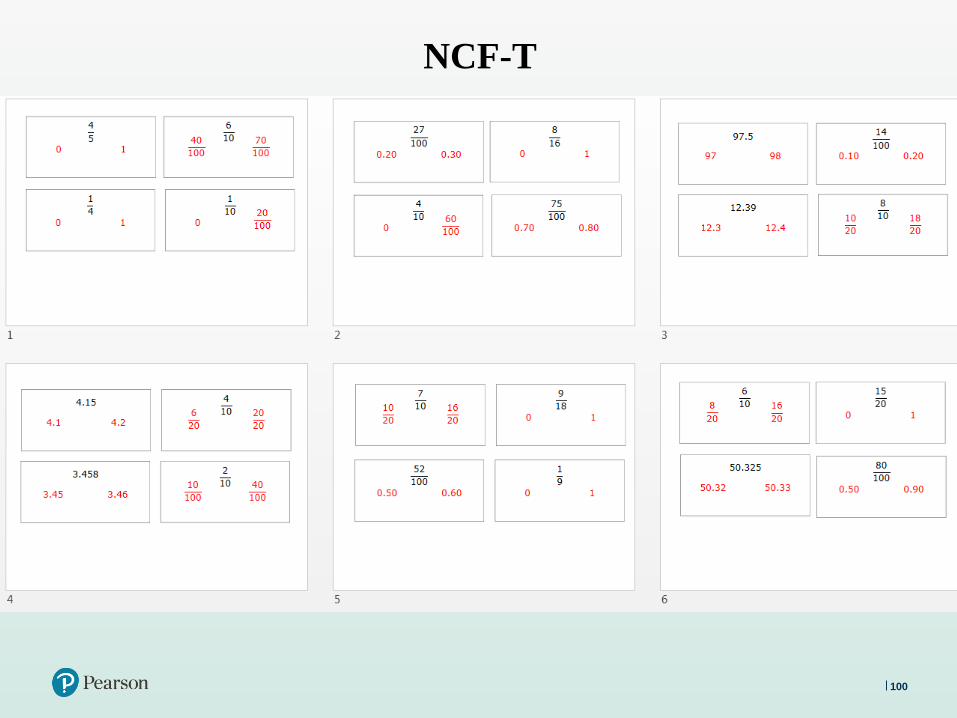
Number Comparison Fluency - Triads


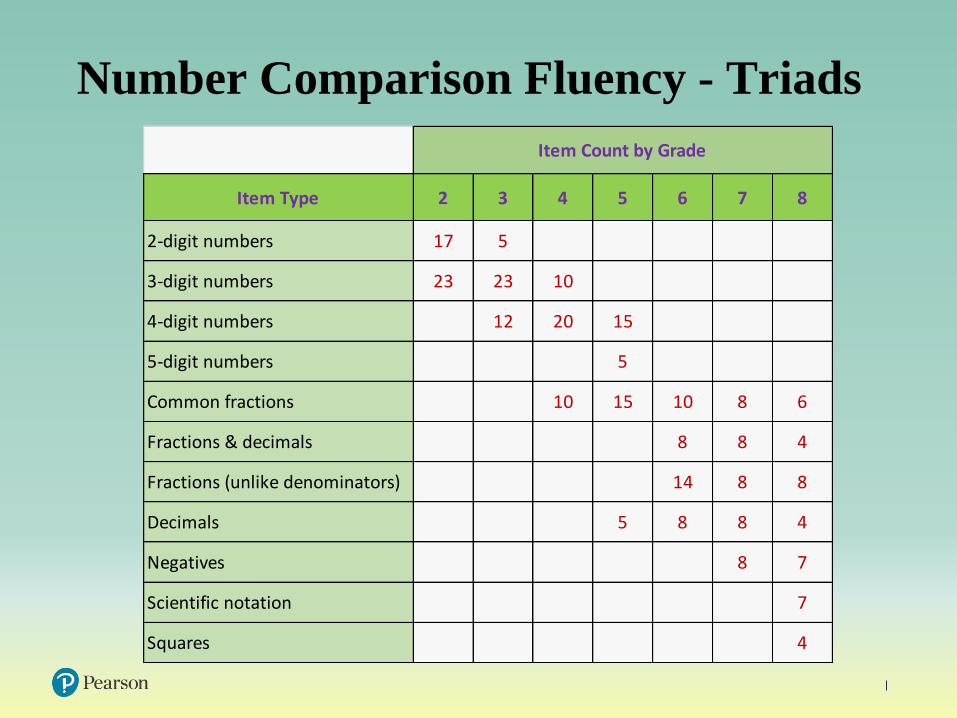
Number Comparison Fluency - Triads
Item Type 2 3 4 5 6 7 8
2-digit numbers 17 5
3-digit numbers 23 23 10
4-digit numbers 12 20 15
5-digit numbers 5
Common fractions 10 15 10 8 6
Fractions & decimals 8 8 4
Fractions (unlike denominators) 14 8 8
Decimals 5 8 8 4
Negatives 8 7
Scientific notation 7
Squares 4
Item Count by Grade

Mental Computation Fluency
60Presentation Title Arial Bold 7 pt


Mental Computation Fluency 2 3 4 5 6 7 8
Add, subtract 2- & 3-digit numbers 42
Add, subtract 3- & 4-digit numbers 26
Multiply 1-digit with 2- or 3-digit 16 9
Divide 3-digit by 1-digit 6
Add, subtract 4- & 5-digit numbers 27 16
Multiply & divide 2- and 3-digit numbers 8 9
Add, subtract fractions with like denominators 6 3
Order of operations 6 12 12
Add and subtract fractions with unlike denominators 6 10 10 10
Multiply decimals by whole numbers 8 5 4
Whole number divided by a fraction 4 6
1- and 2- step solve for y 11 16
Add, subtract with negatives numbers 6
Item Count by Grade
Mental Computation Fluency

Concepts and Applications
Assess conceptual knowledge and problem solving ability that reflects grade level learning standards
Students get as much time as they need
Multiple-choice items
Audio


CCSS Domain 2 3 4 5 6 7 8
Operations & Algebraic Thinking 17 30 22 15 4 -- --
Equations & Expressions -- -- -- -- 21 24 43
Functions -- -- -- -- -- -- 7
Number: Base 10 30 14 12 23 6 -- --
Number: Fractions -- 12 25 25 4 -- --
Number Systems -- -- -- -- 27 17 7
Ratios & Proportions -- -- -- -- 9 20 1
Measurement & Data 33 25 18 12 -- -- --
Statistics & Probability -- -- -- -- 6 12 14
Geometry 10 8 12 16 12 18 17
Items per Form 30 30 30 30 30 30 30
Item Count by Grade
Concepts and Applications

Framework for
Instructional Planning

Framework for Instructional Planning
Level of
InterpretationStudent Group
Composite• Risk (low, moderate, high)
• Performance levels
• Percent of students at risk or
by performance level
Measure
• Variability (pattern) by measure
• Fluency vs depth of knowledge
• Percent correct
• Group average by measure
• NSF vs CA
Skill Area • Profile by strand or skill area• Performance level distribution
by skill area (BA, A, AA)
Item • Correct/incorrect by item • Percent correct by item

72Presentation Title Arial Bold 7 pt
Composite
NSF
(NCF + MCF)
CA
Composite
• Broadest indicator of
overall performance
• Most reliable score
• Best predictor of end-
of-year performance

73Presentation Title Arial Bold 7 pt
Predictive Validity
74Presentation Title Arial Bold 7 pt
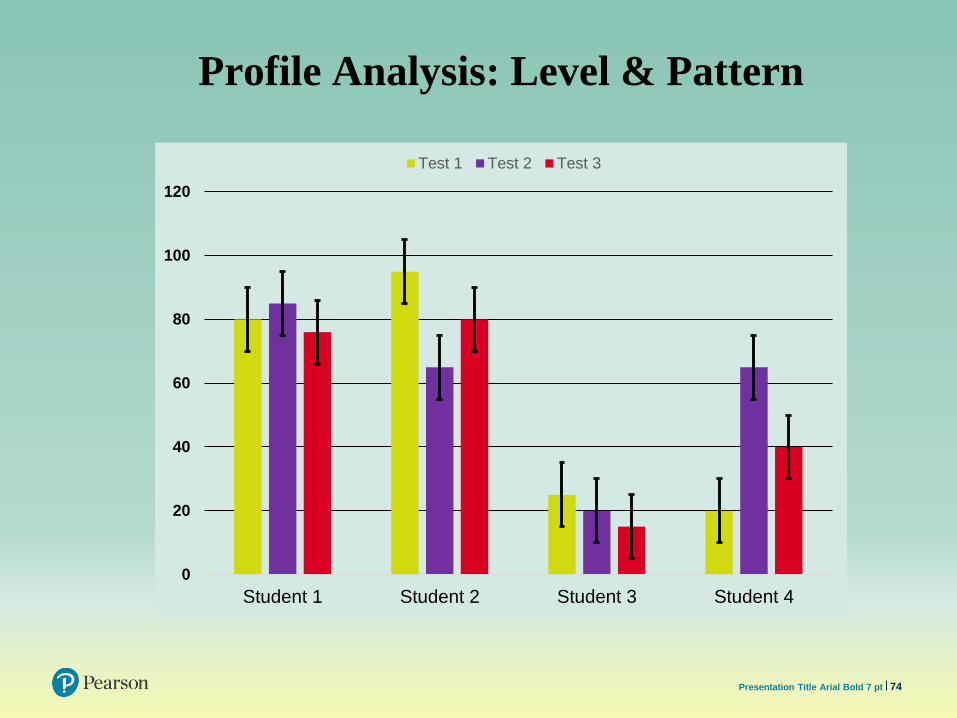
Profile Analysis: Level & Pattern
0
20
40
60
80
100
120
Student 1 Student 2 Student 3 Student 4
Test 1 Test 2 Test 3

75Presentation Title Arial Bold 7 pt
Content
NCF-T MCF CA
• Efficiency comparing
numbers within and
across number
systems
• Timed, 3 min
• 40 items
• One grade below
grade level
• Efficiency mentally
computing
• Timed, 4 min
• 42 items
• One grade below
grade level
• Conceptual
knowledge and
problem solving
skills
• Untimed, 30 items
• Mostly on-grade
level; basic to
advanced skills

Level of
InterpretationInterpretation Questions
Composite
NCF-T
MCF
CA
• Is the student at risk? If yes, how serious?
• Is performance fluent (>= 30 correct, >90% accuracy)
• Is accuracy low (<65%), moderate (65-90), high (>90)
• Are there skill area deficits?
• Does student demonstrate basic competency (total score >
10, with >65% accuracy)?
• Is performance fluent (>= 30 correct, >90% accuracy)
• Is accuracy low (<65%), moderate (65-90), high (>90)
• Are there skill area deficits?
• Does student demonstrate basic competency (total score >
10, with >65% accuracy)?
• Did the student show mastery (>85% correct)
• Is the student at or above the average range
• Are there skill area deficits?
Interpreting Results:
Case Studies

Student 1, Grade 6: Math Profile
0
10
20
30
40
50
60
70
80
90
100
Composite NSF CA NCF-T MCF
National P
erc
entile
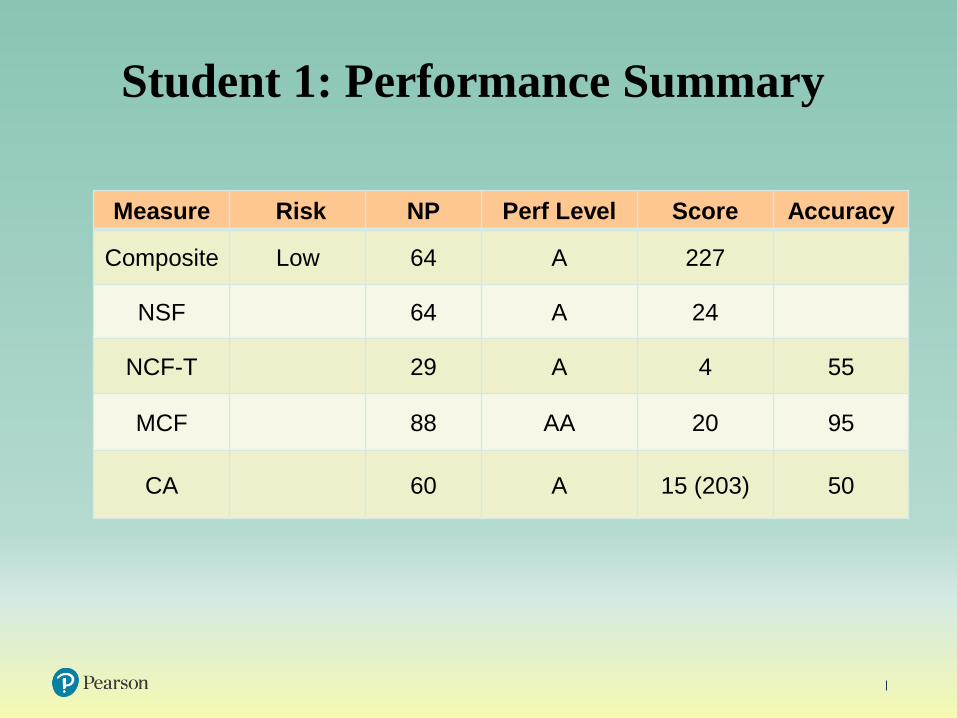
Student 1: Performance Summary
Measure Risk NP Perf Level Score Accuracy
Composite Low 64 A 227
NSF 64 A 24
NCF-T 29 A 4 55
MCF 88 AA 20 95
CA 60 A 15 (203) 50

Student 1: S-W by Skill Area
CA (60th %ile) NCF-T (29th %ile) MCF (88th %ile)
DomainPerf
LevelSkill # Corr # Att. Skill # Corr # Att.
EE ACommon
Fractions (10)3 3
Add & subtract
fractions (13)7 7
NS WFraction &
Decimals (8)1 3 Order of Oper. (12) 4 5
RP AUnlike
Denominator (14)1 3
Mult. & Div.
2- & 3-digits (9)5 5
SP -- Decimals (8) 1 2Mult. Decimals by
whole #s (8)5 5
Geo S

0
10
20
30
40
50
60
70
80
90
100
Composite NSF CA NCF-T MCF
National P
erc
entile
• Is the student at risk? If yes, how serious?
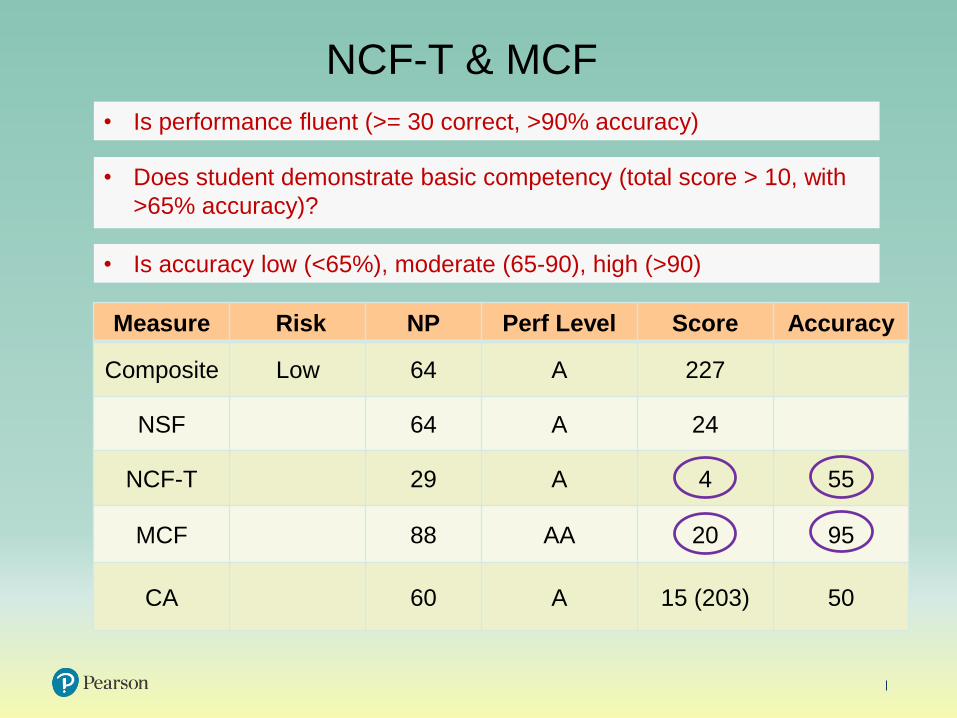
Measure Risk NP Perf Level Score Accuracy
Composite Low 64 A 227
NSF 64 A 24
NCF-T 29 A 4 55
MCF 88 AA 20 95
CA 60 A 15 (203) 50
• Is performance fluent (>= 30 correct, >90% accuracy)
• Is accuracy low (<65%), moderate (65-90), high (>90)
• Does student demonstrate basic competency (total score > 10, with
>65% accuracy)?
NCF-T & MCF

CA (60th %ile) NCF-T (29th %ile) MCF (88th %ile)
DomainPerf
LevelSkill # Corr # Att. Skill # Corr # Att.
EE ACommon
Fractions (10)3 3
Add & subtract
fractions (13)7 7
NS WFraction &
Decimals (8)1 3 Order of Oper. (12) 4 5
RP AUnlike
Denominator (14)1 3
Mult. & Div.
2- & 3-digits (9)5 5
SP -- Decimals (8) 1 2Mult. Decimals by
whole #s (8)5 5
Geo S
• Are there skill area deficits?
NCF-T & MCF

Measure Risk NP Perf Level Score Accuracy
Composite Low 64 A 227
NSF 64 A 24
NCF-T 29 A 4 55
MCF 88 AA 20 95
CA 60 A 15 (203) 50
• Did the student show mastery (>85% correct)
• Is the student at or above the average range
Concepts & Applications

• Are there skill area deficits?
CA (60th %ile) NCF-T (29th %ile) MCF (88th %ile)
DomainPerf
LevelSkill # Corr # Att. Skill # Corr # Att.
EE ACommon
Fractions (10)3 3
Add & subtract
fractions (13)7 7
NS WFraction &
Decimals (8)1 3 Order of Oper. (12) 4 5
RP AUnlike
Denominator (14)1 3
Mult. & Div.
2- & 3-digits (9)5 5
SP -- Decimals (8) 1 2Mult. Decimals by
whole #s (8)5 5
Geo S
Concepts & Applications
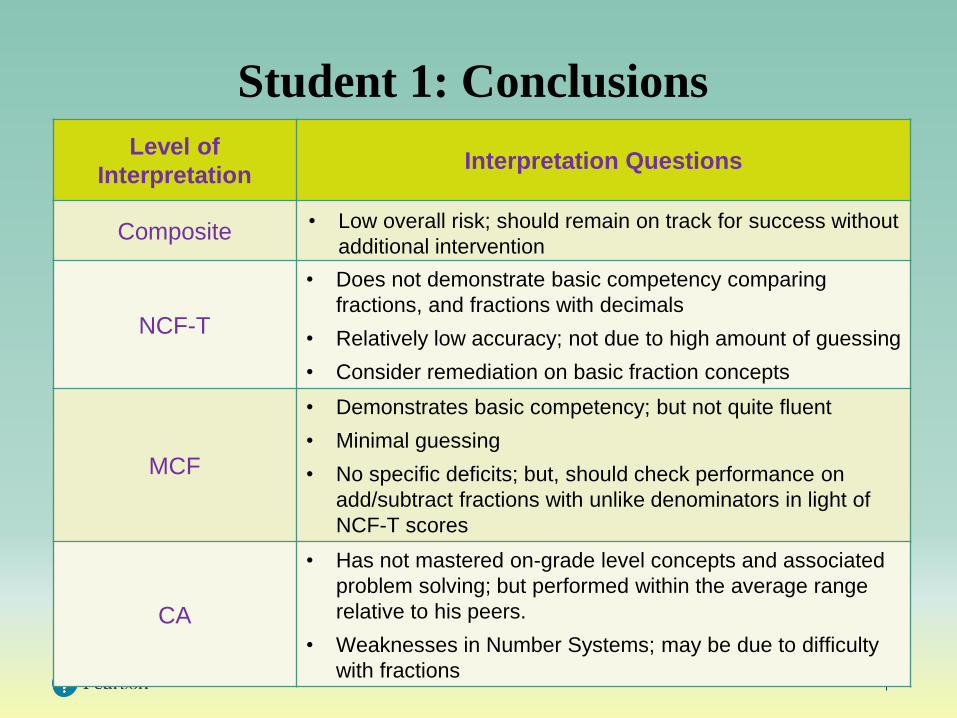
Student 1: Conclusions
Level of
InterpretationInterpretation Questions
Composite
NCF-T
• Does not demonstrate basic competency comparing
fractions, and fractions with decimals
• Relatively low accuracy; not due to high amount of guessing
• Consider remediation on basic fraction concepts
MCF
• Demonstrates basic competency; but not quite fluent
• Minimal guessing
• No specific deficits; but, should check performance on
add/subtract fractions with unlike denominators in light of
NCF-T scores
CA
• Has not mastered on-grade level concepts and associated
problem solving; but performed within the average range
relative to his peers.
• Weaknesses in Number Systems; may be due to difficulty
with fractions
• Low overall risk; should remain on track for success without
additional intervention

Level of
InterpretationInterpretation Questions
Composite
NCF-T
MCF
CA
• Is the student at risk? If yes, how serious?
• Is performance fluent (>= 30 correct, >90% accuracy)
• Is accuracy low (<65%), moderate (65-90), high (>90)
• Are there skill area deficits?
• Does student demonstrate basic competency (total score >
10, with >65% accuracy)?
• Is performance fluent (>= 30 correct, >90% accuracy)
• Is accuracy low (<65%), moderate (65-90), high (>90)
• Are there skill area deficits?
• Does student demonstrate basic competency (total score >
10, with >65% accuracy)?
• Did the student show mastery (>85% correct)
• Is the student at or above the average range
• Are there skill area deficits?

Student 2: S-W by Skill Area
0
10
20
30
40
50
60
70
80
90
100
Composite NSF CA NCF-T MCF
Na
tion
al P
erc
en
tile

Student 2: Performance Summary
Measure Risk NP Perf Level Score Accuracy
Composite Low 46 A 225
NSF 24 BA 14
NCF-T 40 A 10 50
MCF 15 BA 4 83
CA 73 A 17 (211) 57

Student 2: S-W by Skill Area
CA (73rd %ile) NCF-T (40th %ile) MCF (15th %ile)
DomainPerf
LevelSkill # Corr # Att. Skill # Corr # Att.
EE ACommon
Fractions (10)6 10
Add & subtract
fractions (13)2 3
NS SFraction &
Decimals (8)5 14 Order of Oper. (12) 2 2
RP AUnlike
Denominator (14)6 8
Mult. & Div.
2- & 3-digits (9)1 1
SP S Decimals (8) 3 8Mult. Decimals by
whole #s (8)0 0
Geo A

Level of
InterpretationInterpretation Questions
Composite
NCF-T
MCF
CA
0
10
20
30
40
50
60
70
80
90
100
Composite NSF CA NCF-T MCF
National P
erc
entile
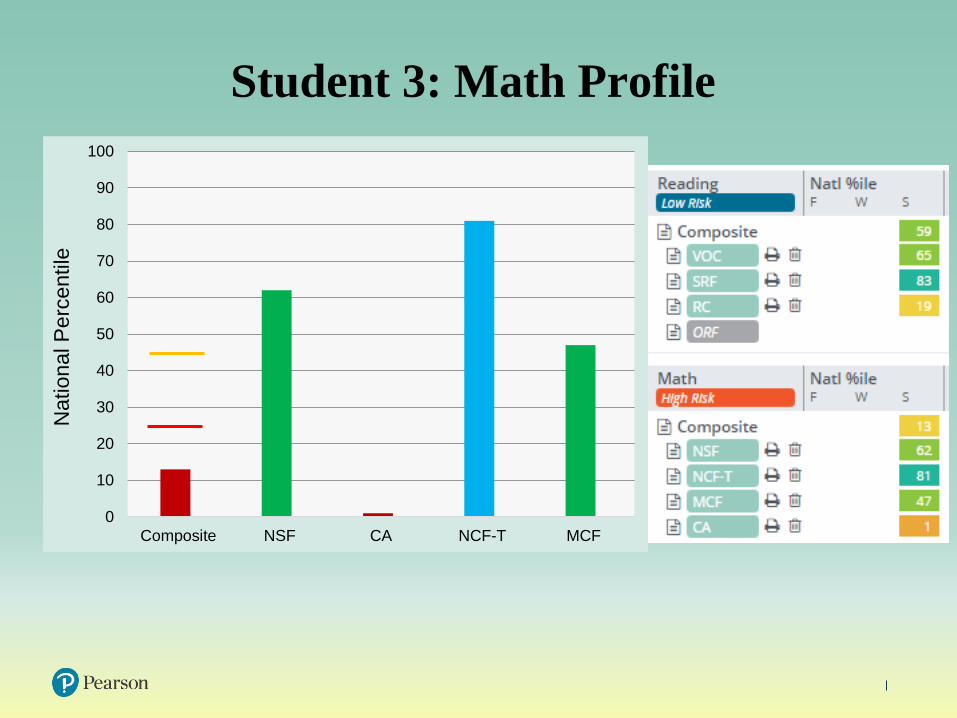
Student 3: Math Profile

Student 3: Performance Summary
Measure Risk NP Perf Level Score Accuracy
Composite High 13 BA 193
NSF 62 A 38
NCF-T 81 AA 24 78
MCF 47 A 14 76
CA 1 WBA 3 (155) 10
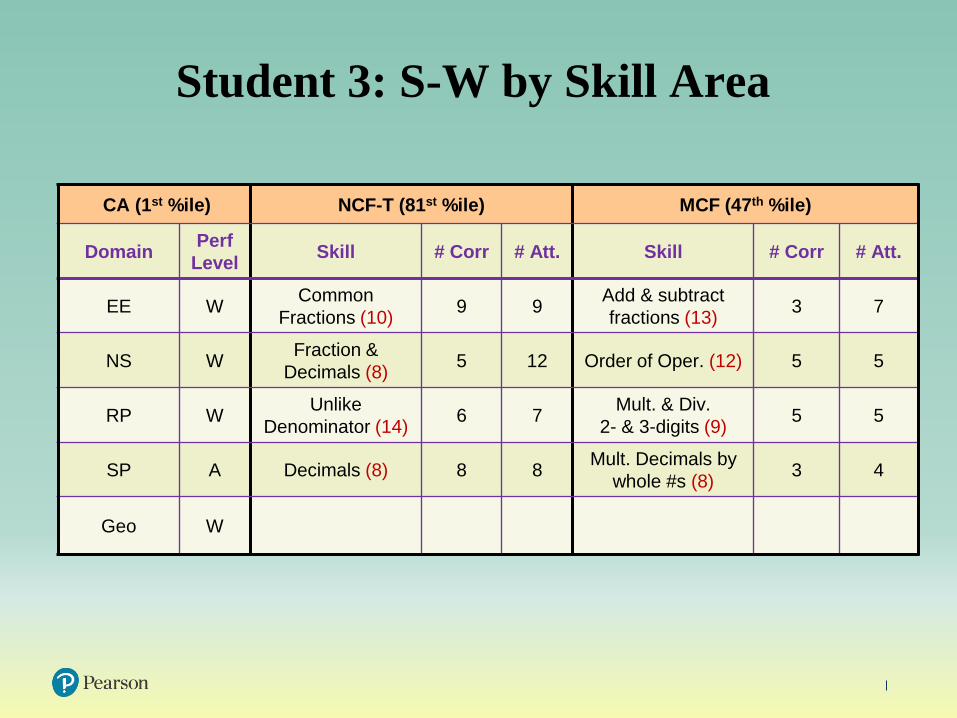
Student 3: S-W by Skill Area
CA (1st %ile) NCF-T (81st %ile) MCF (47th %ile)
DomainPerf
LevelSkill # Corr # Att. Skill # Corr # Att.
EE WCommon
Fractions (10)9 9
Add & subtract
fractions (13)3 7
NS WFraction &
Decimals (8)5 12 Order of Oper. (12) 5 5
RP WUnlike
Denominator (14)6 7
Mult. & Div.
2- & 3-digits (9)5 5
SP A Decimals (8) 8 8Mult. Decimals by
whole #s (8)3 4
Geo W
Level of
InterpretationInterpretation Questions
Composite
NCF-T
MCF
CA

Student 2: Conclusions
Level of
InterpretationInterpretation Questions
Composite• Overall risk is at the low to moderate cut point. Consider
intervention (e.g., more practice, small group work, etc.)
NCF-T
• Demonstrates basic competency comparing numbers within and
across number systems
• Low accuracy (50%); possibly rushed to answer every question
• May struggle with decimals
MCF
• Does not demonstrates basic competency
• Minimal guessing; but attempted few items
• Low performance across the board; should check performance
on easier content to establish mental computation ability
CA
• Has not mastered on-grade level concepts and associated
problem solving
• In average range for this grade; thus, appears to be on-track with
conceptual understanding and problem solving skill
• Weaknesses solving word problems involving rate & ratio

Student 3: ConclusionsLevel of
InterpretationInterpretation Questions
Composite
• Spring performance places student at high risk. Without intensive
intervention, student not likely to be successful in 7th grade.
• Leverage good NSF, possibly mix in practice on fluency skills as
a motivator
NCF-T
• Demonstrates basic competency comparing numbers within and
across number systems, with moderate accuracy
• Perfect scores on problems involving fractions with like
denominators, and comparing decimals.
• Struggles comparing decimals and fractions, and fractions with
unlike denominators
MCF• Demonstrates basic competency; with moderate accuracy
• No apparent strengths or weaknesses
CA
• Knowledge of concepts and problem solving skills are very poor
• General weaknesses across the board.
• Poor reading skills may partially explain poor performance,
especially on word problems


Concepts & Applications Topics
99
100
NCF-T

101
MCF