Using Stage- and Slit-Scanning to Improve Contrast and ... inverted selective plane illumination ......
14
Using Stage- and Slit-Scanning to Improve Contrast and Optical Sectioning in Dual-View Inverted Light Sheet Microscopy (diSPIM) ABHISHEK KUMAR 1,* , RYAN CHRISTENSEN 1 , MIN GUO 1 , PANOS CHANDRIS 1 , WILLIAM DUNCAN 1 , YICONG WU 1 , ANTHONY SANTELLA 2 , MARK MOYLE 3 , PETER W. WINTER 1 , DANIEL COLO ´ N-RAMOS 3 , ZHIRONG BAO 2 , AND HARI SHROFF 1 1 Section on High Resolution Optical Imaging, National Institute of Biomedical Imaging and Bioengineering, National Institutes of Health, Bethesda, Maryland 20892-7710; 2 Developmental Biology Program, Sloan-Kettering Institute, New York, New York 10065; and 3 Program in Cellular Neuroscience, Neurodegeneration, and Repair, Department of Cell Biology, Yale University, New Haven, Connecticut 06511 Abstract. Dual-view inverted selective plane illumination microscopy (diSPIM) enables high-speed, long-term, four- dimensional (4D) imaging with isotropic spatial resolution. It is also compatible with conventional sample mounting on glass coverslips. However, broadening of the light sheet at distances far from the beam waist and sample-induced scat- tering degrades diSPIM contrast and optical sectioning. We describe two simple improvements that address both issues and entail no additional hardware modifications to the base diSPIM. First, we demonstrate improved diSPIM sectioning by keeping the light sheet and detection optics stationary, and scanning the sample through the stationary light sheet (rather than scanning the broadening light sheet and detec- tion plane through the stationary sample, as in conventional diSPIM). This stage-scanning approach allows a thinner sheet to be used when imaging laterally extended samples, such as fixed microtubules or motile mitochondria in cell monolayers, and produces finer contrast than does conven- tional diSPIM. We also used stage-scanning diSPIM to obtain high-quality, 4D nuclear datasets derived from an uncompressed nematode embryo, and performed lineaging analysis to track 97% of cells until twitching. Second, we describe the improvement of contrast in thick, scattering specimens by synchronizing light-sheet synthesis with the rolling, electronic shutter of our scientific complementary metal-oxide-semiconductor (sCMOS) detector. This ma- neuver forms a virtual confocal slit in the detection path, partially removing out-of-focus light. We demonstrate the applicability of our combined stage- and slit-scanning- methods by imaging pollen grains and nuclear and neuronal structures in live nematode embryos. All acquisition and analysis code is freely available online. Introduction Fluorescence microscopy has proved to be a valuable tool for live-cell imaging (Fischer et al., 2011), due to its excel- lent combination of contrast and specificity. Among the many fluorescence techniques available, light sheet fluores- cence microscopy (LSFM) stands out for its speed (Huisken and Stainier, 2009) and low phototoxicity (Stelzer, 2015)— advantages that directly benefit volumetric, time-lapse (4- dimensional (4D)) imaging (Winter and Shroff, 2014). By illuminating the focal plane with a thin sheet of light and synchronously sweeping the sheet and focus through the Received 19 February 2016; accepted 16 June 2016. * To whom correspondence should be addressed. E-mail: abhishk@ gmail.com Abbreviations: CCCP, carbonyl cyanide m-chlorophenyl hydrazine; CMOS, complementary metal-oxide-semiconductor; diSPIM, dual-view, inverted, selective plane illumination microscopy; FOV: field of view; GFP, green fluorescent protein; iSPIM, inverted selective plane illumina- tion microscopy; LSFM, light-sheet fluorescence microscopy; MEMS, micro-electro-mechanical systems; m.f.p., minutes post-fertilization; MIPAV, Medical Image Processing, Analysis, and Visualization; MTG, Mitotracker Green; PSF, point spread function; ROI, region of interest; SBR, signal-to-background ratio; sCMOS, scientific complementary metal- oxide-semiconductor; TMRE, tetramethylrhodamine ethyl ester; U2OS, human osteosarcoma cell line; 4D, four-dimensional. Reference: Biol. Bull. 231: 26 –39. (August 2016) © 2016 Marine Biological Laboratory 26
Transcript of Using Stage- and Slit-Scanning to Improve Contrast and ... inverted selective plane illumination ......

Using Stage- and Slit-Scanning to Improve Contrastand Optical Sectioning in Dual-View Inverted Light
Sheet Microscopy (diSPIM)
ABHISHEK KUMAR1,*, RYAN CHRISTENSEN1, MIN GUO1, PANOS CHANDRIS1,WILLIAM DUNCAN1, YICONG WU1, ANTHONY SANTELLA2, MARK MOYLE3,
PETER W. WINTER1, DANIEL COLON-RAMOS3, ZHIRONG BAO2, AND HARI SHROFF1
1Section on High Resolution Optical Imaging, National Institute of Biomedical Imaging andBioengineering, National Institutes of Health, Bethesda, Maryland 20892-7710; 2Developmental Biology
Program, Sloan-Kettering Institute, New York, New York 10065; and 3Program in CellularNeuroscience, Neurodegeneration, and Repair, Department of Cell Biology, Yale University, New
Haven, Connecticut 06511
Abstract. Dual-view inverted selective plane illuminationmicroscopy (diSPIM) enables high-speed, long-term, four-dimensional (4D) imaging with isotropic spatial resolution.It is also compatible with conventional sample mounting onglass coverslips. However, broadening of the light sheet atdistances far from the beam waist and sample-induced scat-tering degrades diSPIM contrast and optical sectioning. Wedescribe two simple improvements that address both issuesand entail no additional hardware modifications to the basediSPIM. First, we demonstrate improved diSPIM sectioningby keeping the light sheet and detection optics stationary,and scanning the sample through the stationary light sheet(rather than scanning the broadening light sheet and detec-tion plane through the stationary sample, as in conventionaldiSPIM). This stage-scanning approach allows a thinnersheet to be used when imaging laterally extended samples,
such as fixed microtubules or motile mitochondria in cellmonolayers, and produces finer contrast than does conven-tional diSPIM. We also used stage-scanning diSPIM toobtain high-quality, 4D nuclear datasets derived from anuncompressed nematode embryo, and performed lineaginganalysis to track 97% of cells until twitching. Second, wedescribe the improvement of contrast in thick, scatteringspecimens by synchronizing light-sheet synthesis with therolling, electronic shutter of our scientific complementarymetal-oxide-semiconductor (sCMOS) detector. This ma-neuver forms a virtual confocal slit in the detection path,partially removing out-of-focus light. We demonstrate theapplicability of our combined stage- and slit-scanning-methods by imaging pollen grains and nuclear and neuronalstructures in live nematode embryos. All acquisition andanalysis code is freely available online.
Introduction
Fluorescence microscopy has proved to be a valuable toolfor live-cell imaging (Fischer et al., 2011), due to its excel-lent combination of contrast and specificity. Among themany fluorescence techniques available, light sheet fluores-cence microscopy (LSFM) stands out for its speed (Huiskenand Stainier, 2009) and low phototoxicity (Stelzer, 2015)—advantages that directly benefit volumetric, time-lapse (4-dimensional (4D)) imaging (Winter and Shroff, 2014). Byilluminating the focal plane with a thin sheet of light andsynchronously sweeping the sheet and focus through the
Received 19 February 2016; accepted 16 June 2016.* To whom correspondence should be addressed. E-mail: abhishk@
gmail.comAbbreviations: CCCP, carbonyl cyanide m-chlorophenyl hydrazine;
CMOS, complementary metal-oxide-semiconductor; diSPIM, dual-view,inverted, selective plane illumination microscopy; FOV: field of view;GFP, green fluorescent protein; iSPIM, inverted selective plane illumina-tion microscopy; LSFM, light-sheet fluorescence microscopy; MEMS,micro-electro-mechanical systems; m.f.p., minutes post-fertilization;MIPAV, Medical Image Processing, Analysis, and Visualization; MTG,Mitotracker Green; PSF, point spread function; ROI, region of interest;SBR, signal-to-background ratio; sCMOS, scientific complementary metal-oxide-semiconductor; TMRE, tetramethylrhodamine ethyl ester; U2OS,human osteosarcoma cell line; 4D, four-dimensional.
Reference: Biol. Bull. 231: 26–39. (August 2016)© 2016 Marine Biological Laboratory
26

sample, excitation is parallelized, improving speed and sig-nal-to-noise ratio (Winter and Shroff, 2014). In LSFM,out-of-focus light is largely absent, improving contrastthrough “optical sectioning” and photobleaching and pho-todamage are confined to the vicinity of the focal plane,enabling long-term 4D imaging. Together, these features aidin the investigation of developmental biology throughoutembryogenesis (Huisken et al., 2004; Keller et al., 2008,2010; Wu et al., 2011), brain-activity mapping in intactorganisms (Ahrens et al., 2013), cardiac function in modelorganisms (Mickoleit et al., 2014), and the dynamics ofprotein distributions within single cells (Planchon et al.,2011; Wu et al., 2013).
One application of LSFM that is particularly suited to thestudy of single cells or small embryos (e.g., those of thenematode Caenorhabditis elegans) is dual-view invertedselective plane illumination microscopy (diSPIM) (Wuet al., 2013; Kumar et al., 2014). In diSPIM, two perpen-dicular objective lenses alternately exchange roles in excit-ing and detecting fluorescence from the sample. The result-ing volumes are registered and deconvolved to yield imageswith isotropic resolution down to �330 nm. Moreover,diSPIM is compatible with “conventional” sample mountssuch as glass coverslips. Thus, many biological samples canbe prepared as they would be for wide-field or confocalimaging, and imaged easily on the diSPIM.
However, diSPIM performance—especially in laterallyextended or scattering samples—can be further optimized.Because the light sheets in diSPIM are synthesized from aGaussian beam, at distances far from the beam waist thesheet broadens and optical sectioning degrades, reducingcontrast. A related problem is the lack of physical sectioning(pinholing) present in the latest diSPIM implementation.Because the entire image is collected on a wide-field areadetector (camera), scattered emission light in thick, denselylabeled samples can easily contaminate the desired in-focussignal. We describe simple modifications to the diSPIM thataddress both problems; these are based on two previousinnovations (Santi et al., 2009; Baumgart and Kubitscheck,2012). First, we show that scanning the sample through astationary light sheet allows us to use the “thin” part of thesheet (i.e., near the beam waist) (Santi et al., 2009), thusimproving contrast in laterally extended samples such asmonolayers of single cells affixed to glass coverslips. Sec-ond, we combine the slit-scanning capability of an elec-tronic scientific complementary metal-oxide-semiconductor(sCMOS) camera with the scanning illumination used increating the light sheet to achieve partial confocal imaging(Baumgart and Kubitscheck, 2012). Both methods improvediSPIM performance in extended, thick, or densely labeledsamples, as we show by imaging a variety of fixed and livebiological samples, including microtubules and mitochon-dria in single-cell monolayers, and nuclei and neuronalstructures in nematode embryos.
Materials and Methods
Microscope
We used a previously described fiber-coupled, dual-viewinverted selective plane illumination microscope (diSPIM)(Kumar et al., 2014) to perform all imaging experiments.The instrument was unchanged, except that the firmware forthe two scientific complementary metal-oxide-semiconduc-tor (sCMOS) detectors was upgraded to support the recentlydeveloped “light-sheet mode” offered by the manufacturer(Hamamatsu Corporation, Bridgewater, NJ). Imaging ex-periments were performed while the sample was excited atwavelengths of either 488 nm, 561 nm, or both; 488-nm,long-pass, and 561-nm notch filters (cat. nos. LP02-488 andNF03-561E-25; Semrock, Inc., Rochester, NY) were usedto block laser light from the detectors.
Stage-scanning
In conventional diSPIM (Kumar et al., 2014), low nu-merical aperture (NA) illumination is introduced via oneobjective lens to create a sheet (scanned in the “y-axis”direction (“y”); Fig. 1c), and the sheet and detection focalplane are coswept through the sample (in the “z-axis” di-rection (“z”); Fig. 1c) to create an imaging volume (Fig. 1a).This process is repeated, switching the role of illuminationand detection objective lenses. Registration and joint decon-volution are subsequently applied to fuse the two views,improving resolution isotropy (Fig. 1d). In stage-scanningmode, low NA illumination is still scanned in “y” to createa light sheet, but the sheet and detection plane are main-tained at a fixed position during acquisition and the motor-ized sample stage is translated in the z� direction (i.e.,direction in which the stage is scanned; z is the directionalong which the objective lens is scanned. Hence, the z� andz directions are at 45 degrees to each other) to obtain avolume (Fig. 1c). When acquiring volumetric data in thismode, successive imaging planes translate laterally acrossthe field of view (FOV) (see schematic in Fig. 1c). A simplecoordinate transformation converts the raw, stage-scanneddata to the more familiar conventional coordinate system:the axial coordinate is scaled and the ”x” lateral coordinateshifted (the other lateral coordinate, “y,” is identical in bothconventional and stage-scanned methods). We developed anImageJ macro (Schneider et al., 2012) that performs thisshifting automatically (Guo and Shroff, 2015). After trans-formation via the macro, data are registered and decon-volved, as in conventional diSPIM, to improve resolutionisotropy (Fig. 1d).
To estimate the z� step size (i.e., the distance traveled bythe motorized stage between consecutive planes in stage-scan mode), we first multiplied the assumed stage-scanningspeed (as specified by the manufacturer, and implemented inour acquisition code as 0.1 mm/s; Kumar and Shroff, 2015)
27IMPROVED CONTRAST IN diSPIM

by the acquisition time per plane (typically 5 ms for single-view, or 10 ms for dual-view). However, when we calcu-lated the resulting value of z step size by following thetransformation in Figure 1c, we found that the calculatedvalue of z step size differed from the measured value of z(checked by imaging in “conventional” diSPIM) by as muchas 8%. This discrepancy could be due to an accumulation ofmultiple errors, including light sheet tilt, collection objec-tive lens tilt, quantization errors in the stage at low speed, orslight differences between “actual” and theoretical stage
speed. To compensate for all of these potential errors, weinstead measured and used an “effective” stage speed asfollows: (i) First, the distance (z) between two fluorescentbeads (100-nm yellow-green beads, cat. no. F-8803; Invit-rogen Corp., Carlsbad, CA) was measured in “conven-tional” diSPIM mode, that is, by sweeping the synchronizedlight sheet and detection focal plane through the sample tocollect an imaging volume, and using ImageJ software(Schneider et al., 2012) to measure the axial distance be-tween two beads. (ii) Next, this value was multiplied by the
a
b
c
z
x
Moving light sheetz
xy
Stage scan z’x’
y
z’
x’
Moving light sheet Stage scand
yy
x
zz
x
1 um1 um
Raw Decon Raw Decon
Figure 1. Concept and controls behind stage-scanning dual-view, inverted, selective plane illuminationmicroscopy (diSPIM). (a) In previous diSPIM implementation, light sheet and focal plane (dotted lines) weretranslated with a stationary sample. For laterally extended samples, this implied that parts of the sample, atincreasing distances from the beam waist (e.g., upper position of light sheet), experienced a much fatter beam,thus degrading optical sectioning and contrast. Black arrow denotes direction of the moving objective lens (asin conventional imaging) or moving stage (as in stage-scanning imaging). (b) Alternatively, if the sample isscanned by moving the stage (right to left in this diagram (black arrow)) with a stationary light sheet and focalplane, different regions in the sample consistently experience a light sheet of similar thickness. Contrast andoptical sectioning are maintained by restricting the portion of the light sheet used to the optimal region of thelight-sheet waist. In (a) and (b), red and pink lines define the limits of the light sheet; dashed black lines, centeraxis of the light sheet. (c) When acquiring a series of imaging planes (yellow lines) in stage-scanning mode,planes appear to shift laterally when viewed along the “axial” stage-scanning coordinate z� (bottom diagram).As detailed in the diagram, a coordinate transformation is necessary to convert the raw, stage-scanned data tothe “conventional” images (i.e., those acquired when moving the light sheet, as shown in the upper diagram). Redlines indicate direction of motion of moving objective lens or moving stage; black lines denote the edges of thelight sheet. (d) Stage-scanning (right) does not alter lateral (top row) resolution compared to conventional (left)imaging, although raw axial resolution (bottom row) is improved. This occurs in stage-scanning because athinner portion of the light sheet is used for illumination. Joint deconvolution (Decon) improves the resolutionof conventional scanning and stage-scanning to equal degrees.
28 A. KUMAR ET AL.

square root of 2 (Fig. 1c) to yield the corresponding z�displacement, assuming the geometry in Figure 1c. (iii) Theimaging volume was retaken in stage-scanning mode, usingthe assumed stage-scanning speed. The time between beadappearances was estimated by multiplying the number ofapparent planes between beads by the acquisition time perplane. (iv) The z� in (ii) was divided by the time in (iii) toyield an effective stage speed.
Since our effective stage speed was 92% of the assumedvalue, when transforming the data from stage-scanned toconventional view (Fig. 1c), if we desired 1-�m z step
spacing between planes, we specified a z� step size of 0.65�m (0.92 � 0.707 �m), or 4 pixels in the “set slice stepsize” field, within the ImageJ shifting macro.
Figure 2c shows examples of waveforms that are inputinto the various diSPIM hardware components in this mode.The motorized sample stage is accelerated to constant speed(occurring over 50–100 ms), after which image acquisitioncommences. The light sheet is created during each exposureby applying a sawtooth wave to the y-axis of the dual-axisscan mirror within the diSPIM scan head (Y-galvanometer(Y-galvo)) waveform in Fig. 2c; Kumar et al., 2014). The
Figure 2. Illustration of the concept behind slit-scanning dual-view inverted selective plane illuminationmicroscopy (diSPIM). (a) In conventional diSPIM, a low numerical aperture (NA) beam is swept across thesample to create a light sheet, and fluorescence is collected by exposing all pixels (blue) across the imaging fieldof the camera. Because all pixels are exposed, the camera records both high-quality fluorescence generatedwithin the illumination and low-quality fluorescence scattered outside the beam (red haze outside the Gaussianbeam). (b) In slit-scanning diSPIM, camera exposure is synchronized with the position of the illumination beam,exposing only a narrow band of pixels (3 pixel rows in this example) at once. Because most of the pixels areinactive (not recording light), a “virtual slit” is formed, filtering out much of the scattered haze. This virtual slitfollows the position of the illumination beam, thus forming a “rolling shutter.” (c) Shapes of main waveformsused in stage-scanning, slit-scanning diSPIM. The sample stage accelerates to constant velocity during acqui-sition. The Y-galvanometer (Y-galvo) position alternately sweeps in a sawtooth pattern, sequentially producinga sheet in selective plane illumination microscopy A (SPIMA) and B (SPIMB) views. The Z-galvo positionalternately fixes and deflects the beam in each view. Finally, the camera and laser both trigger with a slight,user-defined delay, thus ensuring synchronization between rolling shutter mode, illumination, and Y-galvoposition. Note that these waveforms are meant to be qualitative only; see Materials and Methods and the codefor more details.
29IMPROVED CONTRAST IN diSPIM

light sheet is alternately transmitted (or deflected) to eachobjective lens by applying a square wave pulse to the z-axisof the dual-axis scan mirror each time an image is acquired(Z-galvanometer (Z-galvo) in Fig. 2c). Dual-view imagesare acquired plane-by-plane in an alternating duty cycle byapplying complementary waveforms to each objective lens.For dual-color imaging (Figs. 3 and 4), two-color acquisi-tions are performed first for one color for both planar views,then repeated for the second color. For example, if A and Brepresent the two perpendicular views, and 488 nm and 561nm are the two laser wavelengths, dual-color acquisitionproceeds plane by plane as A_488, B_488, A_561, andB_561. Camera and laser triggers are synchronized with theY- and Z-galvo waveforms, and laser and camera triggerdelays (as shown by the red stars in Fig. 2c) are set to zerounless slit-scanning is desired. The LabVIEW acquisitioncode (National Instruments Corp., Austin, TX) and an over-view of the code are available online (Kumar and Shroff,2015).
Slit-scanning
Slit-scanning is used to partially reject out-of-focus lightthat originates along the ”y” direction, i.e., the direction in
which the illumination beam is scanned to create the sheet.In this mode, the Y-galvo scan (Y scan) is synchronizedwith the camera’s rolling shutter and the laser is scannedunidirectionally once for each imaging plane. The numberof active pixel columns in the sCMOS detector, an adjust-able parameter, allows the user to control the width of thevirtual slit. We found that a 20-pixel column is optimal forthe light-sheet thickness we employed in these experiments.To achieve perfect synchronization between laser scan androlling shutter of the camera, precise calibration and opti-mization of three parameters (in each view) were critical:Y-galvo offset (setting the starting location of the Y scan),Y-galvo amplitude (defining the extent of the Y scan), andcamera trigger delay, which determines the start (timing) ofthe rolling shutter readout.
To set these parameters optimally, we begin by fixing thecamera’s region of interest (ROI) (which, for these experi-ments, was 500 � 500 pixels) and determining the Y-scanoffset by setting the Y-galvo amplitude to zero and exam-ining the apparent beam position on the camera, using afluorescent dye solution. The offset is adjusted such that thebeam position with zero amplitude falls at the top edge ofthe camera’s ROI. To estimate the correct amplitude of the
Figure 3. Stage-scanning enables interrogation of the dynamics of mitochondrial fission, fusion, andmembrane potential. (a) Overview of maximum-intensity projection of the deconvolved, 4D dataset. Mitochon-dria in fixed human osteosarcoma (U2OS) cells were stained with MitoTracker Green FM (MTG FM; ThermoFisher Scientific) and tetramethylrhodamine ethyl ester (TMRE), then volumetrically imaged every 15 s. Forclarity, only the first time point from the MTG FM spectral channel is shown. (b) Dyes showing different ratesof release from mitochondria, with MTG FM demonstrating a gradual release, and TMRE a faster exit, from themitochondria. Plots were derived by averaging the intensity in the red-dotted square region in (a) for eachspectral channel. The red arrow marks the addition of carbonyl cyanide m-chlorophenyl hydrazine (CCCP). (c)Higher-magnification views of mitochondrial dynamics in each channel, corresponding to the yellow rectangularregion in (a). Fusion and remodeling events (red arrows) are visible, as is the differential leakiness of each dye (cyan,MTG FM; magenta, TMRE). See also supplementary video 3 (http://www.biolbull.org/content/supplemental).
30 A. KUMAR ET AL.
Y-galvo, the beam is positioned at the other edge of thecamera by appropriately changing the Y-galvo offset. Thedifference in Y-galvo offset values provides a good startingguess for the Y-galvo amplitude. Next, we set the cameratrigger by providing a delay to the camera trigger signal(Fig. 2c) with respect to the Y-galvo sweep. For the settingsin this study, we set the delay to �2.5 ms. We also iteratedthe camera trigger delay around that value in small steps(�100 �s) to obtain the optimum delay. (“Optimum” isvisually obvious: the camera’s ROI is “painted” only whenthe slit and shutter are well synchronized. See online tutorial(Kumar and Shroff, 2015)). Once the trigger delay is opti-mized, we then reiterate over the Y-galvo amplitude (in0.01-mV steps) for best synchronization. Once these param-eters are optimized, they are considered fixed for the givenROI and not changed. We note that in the Orca Flash 4.0 V2Camera (Hamamatsu Photonics), slit width is defined by theratio of the line exposure to the line readout time (thereadout time can be set in multiples of �10 �s). For ourexperiments, we fixed the line readout time at 10 �s andchanged the line exposure time. The effective acquisitiontime per plane in slit-scanning is thus the sum of the readouttime for the ROI (500 pixels � 10 �s/pixel � 5 ms), cameratrigger delay (�2.5 ms), and line exposure time (200 �s), or
�8 ms. The LabVIEW acquisition code and an overview ofthe code are described online (Kumar et al., 2015).
Sample preparation
Microtubules in cultured U2OS human osteosarcomacells (HTB-96; ATCC (“American Type Culture Collec-tion”), Manassas, VA) were immunolabeled as follows:Cells were grown on #1.5, 24 � 50-mm coverslips suitablefor diSPIM; washed 3 times in cytoskeletal buffer (CB; 10mmol l–1 PIPES, 138 mmol l–1 KCl, 3 mmol l–1 3�MgCl2,2 mmol l–1 EGTA, 0.01% NaN3, 160 mmol l–1 sucrose, pH6.8); precleared in cold CB containing 0.2% Triton X-100(vol/vol) for 30 seconds; fixed and permeabilized for 30 minat 37 °C in a mixture of 0.5% glutaraldehyde, 3.7% form-aldehyde, and 0.3% Triton X-100 (vol/vol) in CB; washed 5times with CB, and quenched 3 times in ice-cold CB con-taining 100 mmol l–1 glycine. Cells were washed one timewith CB between each round of quenching. After quench-ing, cells were washed 3 times with CB and blocked inantibody dilution buffer (AbDil; 150 mmol l–1 NaCl, 20mmol l–1 Tris, 0.1% Triton X-100 (vol/vol), 0.1% NaN3,4% BSA, pH 7.4) for 1 h, and rocked gently on an agitator
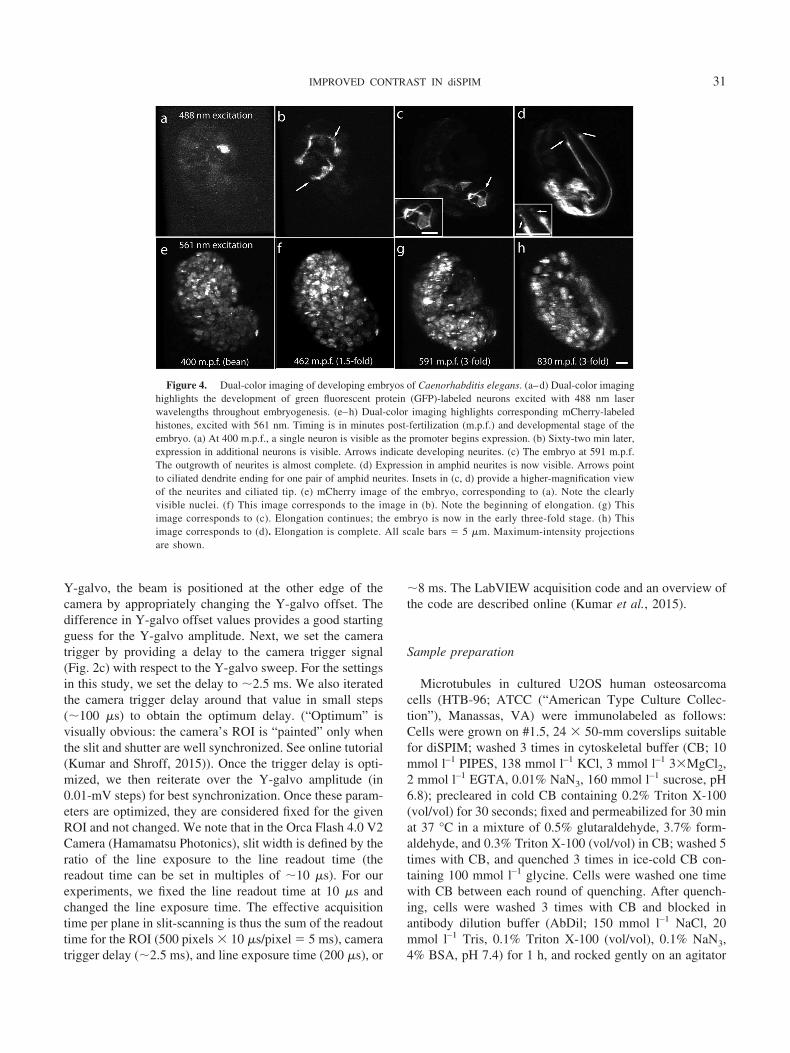
Figure 4. Dual-color imaging of developing embryos of Caenorhabditis elegans. (a–d) Dual-color imaginghighlights the development of green fluorescent protein (GFP)-labeled neurons excited with 488 nm laserwavelengths throughout embryogenesis. (e–h) Dual-color imaging highlights corresponding mCherry-labeledhistones, excited with 561 nm. Timing is in minutes post-fertilization (m.p.f.) and developmental stage of theembryo. (a) At 400 m.p.f., a single neuron is visible as the promoter begins expression. (b) Sixty-two min later,expression in additional neurons is visible. Arrows indicate developing neurites. (c) The embryo at 591 m.p.f.The outgrowth of neurites is almost complete. (d) Expression in amphid neurites is now visible. Arrows pointto ciliated dendrite ending for one pair of amphid neurites. Insets in (c, d) provide a higher-magnification viewof the neurites and ciliated tip. (e) mCherry image of the embryo, corresponding to (a). Note the clearlyvisible nuclei. (f) This image corresponds to the image in (b). Note the beginning of elongation. (g) Thisimage corresponds to (c). Elongation continues; the embryo is now in the early three-fold stage. (h) Thisimage corresponds to (d). Elongation is complete. All scale bars � 5 �m. Maximum-intensity projectionsare shown.
31IMPROVED CONTRAST IN diSPIM

(Lab Quake; Thermo Fisher Scientific, Waltham, MA). Af-ter blocking, AbDil was aspirated and cells were incubatedwith 4 �g/ml monoclonal mouse anti-�-tubulin primaryantibody (product no. T6199; Sigma-Aldrich, St. Louis,MO) in AbDil for 2 h at room temperature with rocking,washed 5 times in Abdil, incubated in a 1:200 dilution ofAlexa fluor 488 Goat antimouse secondary antibody (prod-uct no. A11001; Molecular Probes Co., Eugene, OR) inAbDil for 3 h at room temperature with rocking, washed 4times with AbDil, washed 4 times in deionized water, andimaged (Fig. 5).
We performed live mitochondrial imaging in the U2OScell line (Fig. 3). The cells were maintained in Dulbecco’sModified Eagle’s culture medium (DMEM; Sigma-Aldrich)supplemented with glucose 1 g l�1, glutamine 1 mmol l–1,pyruvate 1 mmol l–1, and 10% fetal bovine serum (FBS;Hyclone), and grown in a 5% CO2 environment at 37 °C.Two days before imaging, the cells were plated onto #1.5,24 mm � 50 mm rectangular coverslips that had beenacid-treated in 1 mol l–1 HCl overnight, rinsed extensivelywith deonized water, submerged in boiling Milli-Q water(Millipore Corp., Billerica, MA) for 5 min, rinsed again
with cold Milli-Q water, and autoclaved. During imaging,we used low-glucose (1 g l�1,) DMEM supplemented withglutamine, pyruvate, and 10% FBS without phenol red andantibiotics. To characterize mitochondrial dynamics and toobserve changes in membrane potential, we labeled the cellswith 25 nmol l–1 tetramethylrhodamine ethyl ester (TMRE;Sigma-Aldrich), which accumulates in mitochondria as afunction of mitochondrial membrane potential. They werealso labeled with 200 nmol l–1 of MitoTracker Green FM(Fei Mao, dye developer; MTG FM; Thermo Fisher Scien-tific), which preferentially binds to thiol groups on mito-chondrial proteins. To generate uncoupling of oxidationfrom phosphorylation and energy production, followed bymembrane potential collapse, we added carbonyl cyanidem-chlorophenyl hydrazine (CCCP; product no. C2759;Sigma-Aldrich) to a final concentration of 1 �mol l–1 6 minto the experiment.
Ragweed pollen grains (cat. no. 07673-1; Polysciences,Warrington, PA; Fig. 6) were spread over Poly-l-lysine-coated coverslips, washed gently with water to removeunstuck pollen, and imaged.
For lineaging a stage-scanned embryonic dataset (Fig. 7),
Figure 5. Stage-scanning improves the performance of dual-view inverted selective plane illuminationmicroscopy (diSPIM) across large fields of view. (a) Raw, single-view, stage-scanned image over a86 � 101-�m field of view. Image is a lateral, XY, maximum-intensity projection of Alexa-Fluor (AF-488)-immunolabeled microtubules in fixed human osteosarcoma (U2OS) cells. Note the consistent image qualityacross the entire field of view. (b) Comparative, higher-magnification views of the area in the yellow rectanglein (a). Note the degradation in contrast toward the right side of the imaging field, due to increased light-sheetthickness. (c) Axial YZ slice along the dotted line in (a). Conventional diSPIM imaging has additional haze, whichis still present after deconvolution. The stage-scanned images (raw, single-view and deconvolved, dual-view) are freeof haze. See also supplementary videos 1 and 2 (http://www.biolbull.org/content/supplemental).
32 A. KUMAR ET AL.

Caenorhabditis elegans embryos derived from strainBV276 ujIs113 (pie-1::mCherry::H2B � unc-119(�); pnhr-2::mCherry::histone � unc-119(�)) II were used. C. elegansembryos derived from strain BV24 were used for green fluo-rescent protein (GFP)-histone experiments in Figure 6. Fordual-color experiments in Figure 4, we imaged worms be-longing to the strain SLS-2 olaex2537 ((pncs-1::GFP; punc-122:mCH); ujIs113 (pie-1::mCherry::H2B � unc-119(�);pnhr-2::mCherry::histone � unc-119(�)) II). The SLS-2strain was created by crossing together animals belonging tostrains DCR 4315 olaex2537 (pncs-1::GFP; punc-122:mCH) and BV276 ujIs113 (pie-1::mCherry::H2B � unc-119(�); pnhr-2::mCherry::histone � unc-119(�) II). All
nematode embryos were prepared and imaged in diSPIM, aspreviously described (Kumar et al., 2014).
Lineaging
After imaging, data were shifted, cropped, and back-ground-subtracted using the stage-scanning ImageJ macro.After shifting and cropping, embryo volumes were rotatedin ImageJ so that the anterior end of the embryo was on theleft side of the volume. Rotated images were registered anddeconvolved using the GenerateFusion plugin in MedicalImage Processing, Analysis, and Visualization (MIPAV)(McAuliffe et al., 2001). After deconvolution, volumes
10 um10 um
No slitNo slit
x
y
y
z 10 um10 um
3.25 um slit3.25 um slitNo slitNo slit No slitNo slit
3.25 um slit3.25 um slit 3.25 um slit3.25 um slit
z
y DeconvolvedDeconvolved
DeconvolvedDeconvolved10 um10 um
3.25 um slitno slit, decon
no slit
Microns
Nor
mal
ized
sig
nal
3.25 um slit, decon
a b
0
0.1
0.2
0.3
0.4
0.5
0.6
0.7
0.8
0.9
1
0 10 20 30 40
Figure 6. Slit-scanning further improves contrast and optical sectioning of dual-view inverted selectiveplane illumination microscopy (diSPIM). (a) Comparative imaging of ragweed pollen (i.e., single axial slicesthrough a pollen grain) without (top row) and with (middle row) a 3.25-�m rolling slit. Scattered fluorescenceexternal to and within the pollen grain is reduced after slit-scanning in both raw (left column) and deconvolved(right) images. The graph at the bottom shows line profiles corresponding to the yellow dashed lines in imaging,confirming that deconvolved (decon), slit-scanned images show superior contrast and sectioning. (b) Compar-ative imaging without (left column) and with (right column) slit-scanning, highlighting single slices axially (toprow) and laterally (bottom row) through a live, green fluorescent protein-histone (GFP-histone)-labeled wormembryo. The axial slices correspond to the red dashed line in the lateral slices. As in (a), the slit-scannedimages show an obvious reduction in scattered haze, enabling clearer observation of individual nuclei. Allimages in (b) have been deconvolved; all images in (a) and (b) are derived from stage-scanned datasets; and“y” corresponds to the direction of the slit-scanning. See also supplementary video 5 (http://www.biolbull.org/content/supplemental).
33IMPROVED CONTRAST IN diSPIM

were run through StarryNite ver. III (July 2014 build; Baoet al., 2006) to identify nuclei. AceTree (Bao et al., 2006)was used to manually edit the StarryNite III results togenerate the lineage projections in Figure 7c.
Imaging parameters
Spacing between planes was set at 0.5 �m for all con-ventional diSPIM imaging, and 0.65 �m (after shifting, i.e.,the z, not z� parameter described in Fig. 1c). For beadimaging (Fig. 1d), 100 planes/volume/view were acquiredin conventional mode, and 75 planes/volume/view wereacquired in stage-scanning mode, at 5 ms/plane. For micro-tubule imaging (Fig. 5), 200 planes/volume/view were ac-quired in conventional mode and 160 planes/volume were
acquired in stage-scanning mode at 5 ms/plane. Stage-scan-ning, dual-color imaging of mitochondria (Fig. 3) was per-formed at 75 planes/volume/view/color at 5 ms/plane/color;a 15-s pause was introduced between imaging volumes.Single-color nematode imaging for lineaging (Fig. 7) wasperformed at 5 ms/plane and at 100 planes/volume/view. A60-s pause was introduced between imaging volumes andfocus was checked manually every hour, adjusting as nec-essary to control for focus drift. For pollen grain imaging(Fig. 6a), 50 planes/volume/view were acquired at 5 ms/plane in conventional mode and 8 ms/plane were acquiredin slit-scanning mode. For strain BV24 embryo imaging(Fig. 6b), 60 planes/volume/view were acquired at 5 ms/planein conventional mode, and 8 ms/plane were acquired in
Figure 7. Lineaging a nematode embryo using stage-scanning dual-view inverted selective plane illumi-nation microscopy (diSPIM). (a) Deconvolved diSPIM maximum-intensity projections at indicated minutespost-fertilization (m.p.f.). In this dataset, twitching begins at 444 m.p.f. Arrows show direction in the embryo:D, dorsal; V, ventral; A, anterior; P, posterior. Scale bar � 5 �m. (b) Representative single planes as viewed inStarryNite ver. III lineaging software (Bao et al., 2006), corresponding to the time points shown in (a).Green spots in the slices represent nuclei in the diSPIM image volumes; purple circles around the nucleiare cell identities assigned and tracked by StarryNite. (c) Renderings showing all nuclei tracked byStarryNite at the time points shown in (a). Different sublineages are represented by different colors. Toppanel: yellow, AB; white, P1. All other panels: red, ABa; blue, ABp; magenta, C; pink, D; green, E; cyan,MS; white, P4. 3D lineage, 3-dimensional positions of lineaged cells. See also supplementary video 4(http://www.biolbull.org/content/supplemental).
34 A. KUMAR ET AL.

slit-scanning mode. For dual-color, stage-, and slit-scanningembryonic imaging (Fig. 4), 70 planes/volume/color wereacquired at 8 ms/plane; a 60-s pause was introduced be-tween consecutive, dual-color volumes.
Deconvolution
Cropping, background subtraction, registration, and jointdeconvolution were performed using the MIPAV environ-ment, as previously described (Kumar et al., 2014). Weused the following full-width, half-maximum parameterswhen performing deconvolution: View A, 3.3, 3.0, and 9.5pixels; and View B, 9.5, 3.0, and 3.2 pixels. An updatedguide to using deconvolution in MIPAV is described online(Christensen et al., 2015).
Signal-to-background ratio comparisons
To estimate the signal-to-background ratio (SBR) in Fig-ure 5, we computed the ratio of the mean intensity of a 20 �20-pixel region within the sample (“signal”) to the meanintensity of a region of identical size outside the sample(“background”). Because local signal and background varyacross the sample, this estimate was computed at threedifferent locations for the dataset presented in Figure 5b. Toestimate SBR in Figure 6b, we computed the ratio of themean intensity of a nuclear region (�20-pixel diameter) tothe mean intensity of a non-nuclear region of identical sizefor 5 different nuclei. To report the improvements in SBR asreported in the text, we computed the ratio of each SBRmeasurement in stage-scanning versus conventional-scan-ning mode (for data in Fig. 5) and slit-scanning versusconventional mode (for data presented in Fig. 6).
Results
In conventional dual-view inverted selective plane illu-mination microscopy (diSPIM), a high-speed, micro-elec-tro-mechanical system (MEMS) mirror moves the excita-tion sheet through a sample, while a piezoelectric collarsynchronously moves the detection objective lens to keepthe focal plane coincident with the illuminated plane (Ku-mar et al., 2014) (Fig. 1a). While this technique works wellfor small, cell-sized samples, it is less effective for larger,extended samples, because the thickness of the light sheeteventually broadens to the extent that most of the sample(outside the focal plane) is illuminated (Fig. 1a). This illu-mination of out-of-focus areas lessens the effectiveness oflight sheet fluorescence microscopy (LSFM) by contaminat-ing images with extraneous light and introducing phototox-icity (without compensating benefits) in the out-of-focusareas. We reasoned that, for many samples, translating thesample laterally through a fixed light sheet and focal planewould enable imaging with an effectively thinner sheet,because only the region of excitation near the beam waist
would be used to illuminate the sample (Fig. 1b, c; see alsoMaterials and Methods above).
We implemented this “stage-scanning” mode simply bytranslating the motorized specimen stage unidirectionally atconstant velocity, while keeping light sheet and detectionoptics stationary. As long as the stage velocity is set to lessthan the point-spread function (PSF) width/exposure time(in this case, 500 nm/5 ms, or �0.1 mm s�1), the effects ofmotion blur are negligible and spatial resolution is equiva-lent to the more conventional imaging mode, in whichdetection objective lens and light sheet are translated to-gether. We characterized spatial resolution by imaging 100-nm, yellow-green fluorescent beads, comparing their appar-ent size in both stage-scanning and conventional modes(Fig. 1d). Lateral resolution was equivalent in either mode(conventional mode full width half maximum (FWHM): x509 � 20 nm, y 441 � 23 nm; stage-scan mode FWHM: x498 � 25 nm, y 436 � 20 nm; N � 10 beads). Axialresolution in conventional mode was not uniform across theimaging field, because the light-sheet thickness varies sig-nificantly along the z�-axis (Fig. 1a, c). However, stage-scanning resulted in uniform axial resolution across the fieldof view (FOV), because only the beam waist was used forillumination (conventional mode: z 2112 � 63 nm; stage-scan mode: z 1396 � 195 nm). We observed a slightastigmatism in the PSF, likely due to an imperfection in ourobjective lens. As expected, joint-deconvolution (Kumaret al., 2014; 20 iterations, Richardson-Lucy method) im-proved isotropy in all 3 spatial dimensions to �350 nm,regardless of imaging mode (Fig. 1d). We conclude thatstage-scanning preserves the high spatial resolution af-forded by diSPIM.
To demonstrate the ability of stage-scanning to imagelarge fields of view (FOVs), we fixed cells that had beenimmunolabeled with Alexa Fluor 488, decorating microtu-bules, and compared the resulting images after conventional(moving light-sheet and detection objective lens) and stage-scanning diSPIM (Fig. 5). Stage-scanning enabled imagingover large FOVs (�86 � 100 �m, Fig. 5a) without loss ofquality. In contrast, imaging the same field in conventionaldiSPIM showed pronounced degradation at the edges of theimaging field (Fig. 5b), due to the increasing thickness ofthe illuminating light sheet. Axial cuts through the sample(Fig. 5c) revealed prominent out-of-focus background sur-rounding microtubules in conventional mode (which wasabsent in stage-scanning mode), again due to the increasedthickness of the light sheet at the edges of the field. Toquantify the improvements afforded by stage-scanning, wemeasured the signal-to-background ratio (SBR) at threelocations across the FOV. Thickness of the excitation beamincreases from left to right in conventional diSPIM, but ismaintained at uniform thickness in stage-scanning. Thisdifference is reflected in the SBR, which is two to four timesbetter in stage-scanning mode (Fig. 5b); the SBR ratio
35IMPROVED CONTRAST IN diSPIM

between stage-scanning and conventional diSPIM worsensfrom left to right (see also Materials and Methods above).Although deconvolution sharpened microtubules and im-proved resolution isotropy, it could not completely removeout-of-focus background or restore image contrast (Fig. 5b,c), presumably because the low-frequency background pres-ent in conventional diSPIM images was not modeled by ourPSF. We conclude that imaging over extended fields isbetter achieved with stage-scanning than conventionaldiSPIM (compare also supplementary videos 1 and 2, http://www.biolbull.org/content/supplemental).
To demonstrate the efficacy of stage-scanning diSPIM ininterrogating live, two-color specimens over a large FOV,we visualized the dynamics of mitochondria in human os-teosarcoma cells (U2OS) (Fig. 3a) that were labeled withMitoTracker Green FM (MTG FM; excited at 488 nm) andtetramethylrhodamine ethyl ester (TMRE; excited at 561nm). MitoTracker Green binds to free thiol groups on cys-teine residues of mitochondrial proteins, and its accumula-tion in mitochondria is much less dependent on mitochon-drial membrane potential than TMRE, a lipophilic dyewhose binding to mitochondria strictly depends on mem-brane potential (Presley et al., 2003; Perry et al., 2011). Weobserved transient fluctuations in intensity from both dyes.These fluctuations were more pronounced in the TMREchannel (see supplementary video 3, (http://www.biolbull.org/content/supplemental) due to mitochondrial depolariza-tion and repolarization (Twig et al., 2008). Yet transientlosses in mitochondrial polarization did not hamper theability of mitochondria to fuse (Fig. 3b). Carbonyl cyanidem-chlorophenyl hydrazine (CCCP) uncouples oxidativephosphorylation from adenosine triphosphate (ATP) pro-duction by dissipating the proton gradient, causing a de-crease in mitochondrial membrane potential. We observedthis effect by adding CCCP to the cells 360 s into theimaging experiment; we noted a pronounced loss in mem-brane potential in the TMRE spectral channel and—to asignificantly lower extent—in the MTG channel (Fig. 3b, c).Imaging by diSPIM thus allows live, 4D imaging of mito-chondrial dynamics, fluctuations, and gradual loss of mito-chondrial membrane potential over many tens of timepoints.Stage-scanning also allowed us to interrogate these dynam-ics over a large field of view: mitochondria were clearlyresolved throughout the �100 �m � 60-�m FOV.
The embryo of Caenorhabditis elegans possesses an in-variant cell lineage (Sulston et al., 1983), for which the fateand identity of each of the 671 embryonic cells have beenmapped. Based on this lineage, semi-automated computerprograms that track and identify cells in the developingnematode embryo have been created and applied to thelineaging of embryos that have been compressed betweencoverslip and slide (Bao et al., 2006; Santella et al., 2010),usually with data acquired from spinning-disk confocalmicroscopy. More recently, uncompressed embryos have
been imaged with laser-scanning confocal or Bessel beammicroscopy, and lineaged to the onset of twitching (Giuru-mescu et al., 2012). The fast, gentle, long-term imagingcapabilities of our diSPIM system also make it an attractivesystem for the application of lineaging software. Neverthe-less, a lineage derived from diSPIM had not yet beenproduced by the time of our study. To generate such alineage, we captured stage-scanning datasets of embryosexpressing nuclear-localized histone::mCherry from thetwo-cell stage until the onset of twitching. After data pro-cessing (see Materials and Methods), we used StarryNite IIIand Acetree software to lineage the cells in the embryodataset (Fig. 7). We were able to track 99% of cells in theembryo out to 365 min post-fertilization (m.p.f) and 97% ofcells out to twitching (supplementary video 4, http://www.biolbull.org/content/supplemental), comparable to earlierresults from other methods (Giurumescu et al., 2012). Ourresults demonstrate the utility of the stage-scanning diSPIMsystem for lineaging uncompressed nematode embryos.
We have shown that stage-scanning enables high-qualityimaging across fields that extend to 100 �m in either lateraldirection. In contrast, in conventional diSPIM imaging isdegraded over imaging fields as small as 50 �m � 50 �m(Fig. 5b). We note that, in principle, the improvementsoffered by stage-scanning extend to fields as large as �4mm � 4 mm in our current sample chamber; the currentlimits are set by steric interference between objective lensesand the chamber walls.
Having demonstrated the capabilities of stage-scanning,we next turned our attention to a different diSPIM improve-ment: the introduction of partial confocal imaging (Fig. 2).Because our light sheet is constructed by scanning a lownumerical aperture (NA) excitation beam in one dimension,scattered emission light (introducing unwanted backgroundacross the image; Fig. 2a) may be rejected by passing thefluorescence corresponding to our excitation through a con-focal aperture before detection. This method has been usedto reject background when using light sheet fluorescencemicroscopy (LSFM) to image whole, fixed mouse brains byde-scanning the fluorescence, filtering it through a slit, andre-scanning before collection onto a camera (Silvestri et al.,2012). While effective, this method requires additional op-tics in the emission path, reducing collection efficiency. Anelegant alternative is to employ the “rolling shutter” modeof the sCMOS detection camera, whereby columnar pixelgroups are synchronized with the excitation and sequen-tially exposed, forming a moving “slit” that masks camerapixels outside the excitation beam (Fig. 2b; Baumgart andKubitscheck, 2012). Inspired by the integration of this roll-ing shutter with other applications of LSFM (Baumgart andKubitscheck, 2012; Chhetri et al., 2015; de Medeiros et al.,2015; Dean et al., 2015), we added this functionality to ourcontrol code (Fig. 2c, Materials and Methods), therebyintroducing partial confocality into diSPIM.
36 A. KUMAR ET AL.

To demonstrate the improvement offered by slit-scan-ning, we compared images of ragweed pollen grains ac-quired in stage-scanning mode, both with and without arolling slit (Fig. 6a). Although relatively small (19–20 �mdiameter), these specimens are highly scattering. As ex-pected, selecting a slit width of 3.25 �m (twice the approx-imate diameter of our excitation beam) improved contrastand reduced background, particularly in the direction ofbeam-scanning. There was an optimal range of slit widths,because slits greater than 3.25 �m exhibited more scatteredlight, whereas slit widths less than our beam diameter re-moved in-focus signal (data not shown). Even though somescattered light is still present after slit-scanning due to ourrelatively large slit width, the slit reduced background at theperiphery of the pollen grain and improved contrast betweenthe pollen periphery and interior. (See line profiles in Fig.6a; note that slit-scanning curves are steeper at the edges ofthe pollen, and fall to a lower value at the center due to thereduction in background.) Extraneous scattered light is noteffectively modeled by our deconvolution algorithm, so weexpected that any reduction in scattering due to slit-scan-ning would also improve deconvolved images. Indeed, theimprovements offered by slit-scanning were observed withdeconvolved images of pollen (Fig. 6a) and when imagingspecimens such as GFP-histone-labeled nuclei in live em-bryos of Caenorhabditis elegans (compare left and rightcolumns in Fig. 6b, and see supplementary video 5 (http://www.biolbull.org/content/supplemental) all deconvolved.To quantify improvements as a result of the slit, we mea-sured the signal-to-background ratio (SBR) between nucleiand the background in Figure 6b. The SBR was two to threetimes better with the slit, confirming the greater backgroundrejection afforded by slit-scanning. These improvementswere observed whether we imaged these samples in stage-scanning or conventional diSPIM mode (data not shown).We conclude that synchronized slit-scanning with a rollingshutter improves contrast and sectioning in diSPIM for bothlive and fixed samples.
As a final demonstration of combined slit- and stage-scanning modalities, we applied these to visualize develop-ing neurons in nematode embryos (Kumar et al., 2015).These samples are challenging to image because they aresensitive to photobleaching and/or photodamage (and thusbenefit from diSPIM). In addition, developing neurites rep-resent fine, diffraction-limited structures, which are easier toresolve with a thin sheet, i.e., with stage-scanning; and theembryo causes increasing scattering, particularly at latestages once the cuticle forms (so that imaging benefits fromslit-scanning). We imaged an embryo coexpressing aPncs-1::membrane-tether(PH)::GFP reporter construct,which labeled developing neurons, and nuclear-localizedmCherry, a fluorophore tracer, every minute from the two-cell stage into the three-fold stage. Green fluorescent protein(GFP) expression in neurons became apparent around the
bean stage (Fig. 4a), and expression progressively increasedthroughout development (Fig. 4b–d). Fine neuronal struc-ture was apparent at both early (Fig. 4b) and late time pointsin development (Fig. 4c, d). At early time points, we ob-served neurite outgrowth (Fig. 4b). As embryos reachedthe three-fold stage, most neurite outgrowth events ap-peared to have concluded (Fig. 4c). However, we observedPncs-1::membrane-tether(PH)::GFP expression in a newset of neurons, with fine structure visible at neurite tips inthese cells (Fig. 4d). Based on their position and morphol-ogy, we identified these structures as the ciliated endings ofamphid neuron dendrites. Concurrent imaging of themCherry channel (Fig. 4e–h) allowed for assignment of theembryo to specific developmental stages.
Discussion
While stage- and slit-scanning are fully compatible withexisting dual-view inverted selective plane illumination mi-croscopy (diSPIM) systems, they are not applicable to allsamples. For stage-scanning applications, the sample mustadhere to the coverslip; loosely attached samples will moverelative to the stage during scanning, causing motion arti-facts and image degradation. For such samples, the slit-scanning method still may prove useful in removing out-of-focus light, when combined with conventional diSPIM. Wealso note that slit-scanning—at least as implemented here—requires careful synchronization of rolling shutter andsweep of the light sheet; slit-width selection depends onboth exposure time and readout time (see Materials andMethods). Acquisition time and signal-to-noise and signal-to-background ratios are thus tightly coupled. For manythin, transparent, or dim samples (e.g., fluorescent labels intissue culture cells, such as the mitochondria in Fig. 3), theslit-scanning feature is likely to be of limited benefit; im-ages with an acceptable signal-to-background ratio (SBR)and better signal-to-noise ratio can be obtained more simplyby operating the camera “conventionally.” Conversely, formore scattering samples slit-scanning offers obvious im-provements in SBR (Fig. 6). Thus, we anticipate that, formany samples, combined slit- and stage-scanning will offerbetter imaging than conventional diSPIM. We are excitedabout applying these techniques in concert with new meth-ods for untwisting (Christensen et al., 2015) and displaying(Santella et al., 2015) 4D embryonic data, which will aid inthe construction of a 4D neurodevelopmental atlas in Cae-norhabditis elegans (Santella et al., 2015).
In our experience, motorized stages such as the one weused are incapable of precise (sub-micron) steps at highspeeds ( 10 ms). For this reason, we operated the stage atconstant velocity during stage-scanning. A future improve-ment of the system may be to replace the motorized me-chanical stage with a more sensitive and precise piezoelec-tric stage. This would eliminate the need to accelerate
37IMPROVED CONTRAST IN diSPIM

and/or decelerate the stage (Fig. 2c), shortening acquisitiontime and allowing a more precise match between stageposition and camera exposure.
Acknowledgments
We thank Jim Sims, Patrick Gregorio, and ShelleyBrankner (Hamamatsu Corporation) for help in integratingthe sCMOS slit-scanning function with our LabVIEW pro-gram; Jon Daniels and Gary Rondeau (Applied ScientificInstrumentation) for useful discussions on stage-scanning;William Mohler (University of Connecticut Health Center)for encouragement; William Gandler (NIH Center for In-formation Technology) for help with MIPAV; NicoleTashakkori and John Joseph for acquiring embryo data usedfor lineaging; and Hank Eden and Talley Lambert for theircomments on the manuscript. We also thank the ResearchCenter for Minority Institutions program and the Institute ofNeurobiology at the University of Puerto Rico for providing ameeting and brainstorming platform. MG acknowledges fund-ing from the National Natural Science Foundation of China(grants no. 61427807, 61271083, and 61525106); ShenzhenInnovation Funding (grants no. SGLH20131010110119871and GJHZ20140415152115754); and Zhejiang Province Sci-ence and Technology Projects (grant no. 2015C33061).Much of this work was conducted at the Marine BiologicalLaboratory at Woods Hole, either through the WhitmanProgram (DAC-R and HS) or a Grass Foundation Fellow-ship (to AK). Support for this work was provided by theIntramural Research Programs of the National Institute ofBiomedical Imaging and Bioengineering, and by NIHgrants no. U01 HD075602 and R24OD016474.
Literature Cited
Ahrens, M. B., M. B. Orger, D. N. Robson, J. M. Li, and P. J. Keller.2013. Whole-brain functional imaging at celluler resolution usinglight-sheet microscopy. Nat. Methods 10: 413-420.
Bao, Z., J. I. Murray, T. Boyle, S. L. Ooi, M. J. Sandel, and R. H.Waterson. 2006. Automated cell lineage tracing in Caenorhabditiselegans. Proc. Natl. Acad. Sci. USA 103: 2707-2712.
Baumgart, E., and U. Kubitscheck. 2012. Scanned light sheet micros-copy with confocal slit detection. Opt. Express 20: 21805-21814.
Chhetri, R. K., F. Amat, Y. Wan, B. Hockendorf, W. C. Lemon, andP. J. Keller. 2015. Whole-animal functional and developmentalimaging with isotropic spatial resolution. Nat. Methods 12: 1171-1178.
Christensen, R. 2015. diSPIM image processing using MIPAV (Med-ical Image Processing, Analysis, and Visualization). [Online]. diSPIMWiki. Available: http://dispim.org/software/mipav_generatefusion[2015, December 5].
Christensen, R. P., A. Bokinsky, A. Santella, Y. Wu, J. Marquina-Solis,M. Guo, I. Kovacevic, A. Kumar, P. W. Winter, N. Tashakkoriet al. 2015. Untwisting the Caenorhabditis elegans embryo. eLife 4:e10070.
de Medeiros, G., N. Norlin, S. Gunther, M. Albert, L. Panavaite,U.-M. Fiuza, F. Peri, T. Hiiragi, U. Krzic, and L. Hufnagel. 2015.Confocal multiview light-sheet microscopy. Nat. Commun. 6: 8881-8889.
Dean, K. M., P. Roudot, E. S. Welf, G. Danuser, and R. Fiolka. 2015.
Deconvolution-free subcellular imaging with axially swept light sheetmicroscopy. Biophys. J. 108: 2807-2815.
Fischer, R. S., Y. Wu, P. Kanchanawong, H. Shroff, and C. M. Wa-terman. 2011. Microscopy in 3D: a biologist’s toolbox. Trends CellBiol. 21: 682-691.
Giurumescu, C. A., S. Kang, T. A. Planchon, E. Betzig, J. Bloomekatz,D. Yelon, P. Cosman, and A. D. Chisholm. 2012. Quantitativesemi-automated analysis of morphogenesis with single-cell resolutionin complex embryos. Development 139: 4271-4279.
Guo, M., and H. Shroff. 2015. Fiji plug-in for stage scan imagereconstruction and tutorial. [Online]. diSPIM Wiki. Available: http://dispim.org/software/imagej_macro [2015, December 5].
Huisken, J., and D. Y. R. Stainier. 2009. Selective plane illuminationmicroscopy techniques in developmental biology. Development 136:1963-1975.
Huisken, J., J. Swoger, F. Del Bene, J. Wittbrodt, and E. H. K. Stelzer.2004. Optical sectioning deep inside live embryos by selective planeillumination microscopy. Science 305: 1007-1009.
Keller, P. J., A. D. Schmidt, J. Wittbrodt, and E. H. K. Stelzer. 2008.Reconstruction of zebrafish early embryonic development by scannedlight sheet microscopy. Science 322: 1065-1069.
Keller, P. J., A. D. Schmidt, A. Santella, K. Khairy, Z. Bao, J. Witt-brodt, and E. H. K. Stelzer. 2010. Fast, high-contrast imaging ofanimal development with scanned light sheet-based structured-illumi-nation microscopy. Nat. Methods 7: 637-642.
Kumar, A., and H. Shroff. 2015. diSPIM Image acquisition usingLabVIEW. [Online]. diSPIM Wiki. Available: http://dispim.org/software/labview [2015, December 5].
Kumar, A., Y. Wu, R. Christensen, P. Chandris, W. Gandler, E.McCreedy, A. Bokinsky, D. A. Colon-Ramos, Z. Bao, M. McAuliffeet al. 2014. Dual-view plane illumination microscopy for rapid andspatially isotropic imaging. Nat. Protocols 9: 2555-2573.
Kumar, A., D. A. Colon-Ramos, and H. Shroff. 2015. Watching aroundworm develop with a sheet of light. Physics Today 68: 58-59.
McAuliffe, M. J., F. M. Lalonde, D. McGarry, W. Gandler, K. Csaky,and B. L. Trus. 2001. Medical image processing, analysis andvisualization in clinical research. Pp. 381-386 in Proceedings, 14th
IEEE Symposium on Computer-Based Medical Systems, 381; CBMS2001. IEEE Computer Society, Los Alamitos, CA.
Mickoleit, M., B. Schmid, M. Weber, F. O. Fahrbach, S. Hombach, S.Reischauer, and J. Huisken. 2014. High-resolution reconstructionof the beating zebrafish heart. Nat. Methods 11: 919-922.
Perry, S. W., J. P. Norman, J. Barbieri, E. B. Brown, and H. A.Gelbard. 2011. Mitochondrial membrane potential probes and theproton gradient: a practical usage guide. BioTechniques 50: 98-115.
Planchon, T. A., L. Gao, D. E. Milkie, M. W. Davidson, J. A. Galbraith,C. G. Galbraith, and E. Betzig. 2011. Rapid three-dimensionalisotropic imaging of living cells using Bessel beam plane illumination.Nat. Methods 8: 417-423.
Presley, A. D., K. M. Fuller, and E. A. Arriaga. 2003. MitoTrackerGreen labeling of mitochondrial proteins and their subsequent analysisby capillary electrophoresis with laser-induced fluorescence detection.J. Chromatogr. B Anal. Technol. Biomed. Life Sci. 793: 141-150.
Santella, A., Z. Du, S. Nowotschin, A.-K. Hadjantonakis, and Z.Bao. 2010. A hybrid blob-slice model for accurate and efficientdetection of fluorescence labeled nuclei in 3D. BMC Bioinformatics 11:580-593.
Santella, A., R. Catena, I. Kovacevic, P. Shah, Z. Yu, J. Marquina-Solis, A. Kumar, Y. Wu, J. Schaff, D. A. Colon-Ramos et al. 2015.WormGUIDES: an interactive single cell developmental atlas and toolfor collaborative multi-dimensional data exploration. BMC Bioinfor-matics 16: 189.
Santi, P. A., S. B. Johnson, M. Hillenbrand, P. Z. GrandPre, T. J.
38 A. KUMAR ET AL.

Glass, and J. R. Leger. 2009. Thin-sheet laser imaging microscopyfor optical sectioning of thick tissues. BioTechniques 46: 287-294.
Schneider, C. A., W. S. Rasband, and K. W. Eliceiri. 2012. NIHImage to ImageJ: 25 years of image analysis. Nat. Methods 9: 671-675.
Silvestri, L., A. Bria, L. Sacconi, G. Iannello, and F. S. Pavone. 2012.Confocal light sheet microscopy: micron-scale neuroanatomy of theentire mouse brain. Opt. Express 20: 20582-20598.
Stelzer, E. H. K. 2015. Light-sheet fluorescence microscopy for quan-titative biology. Nat. Methods 12: 23-26.
Sulston, J. E., E. Schierenberg, J. G. White, and J. N. Thomson. 1983.The embryonic cell lineage of the nematode Caenorhabditis elegans.Dev. Biol. 100: 64-119.
Twig, G., A. Elorza, A. J. A. Molina, H. Mohamed, J. D. Wikstrom, G.Walzer, L. Stiles, S. E. Haigh, S. Katz, G. Las et al. 2008. Fission
and selective fusion govern mitochondrial segregation and eliminationby autophagy. EMBO J. 27: 433-446.
Winter, P. W., and H. Shroff. 2014. Faster fluorescence microscopy:advances in high speed biological imaging. Curr. Opin. Chem. Biol. 20:46-53.
Wu, Y., A. Ghitani, R. Christensen, A. Santella, Z. Du, G. Rondeau, Z.Bao, D. A. Colon-Ramos, and H. Shroff. 2011. Inverted selectiveplane illumination microscopy (iSPIM) enables coupled cell identitylineaging and neurodevelopmental imaging in Caenorhabditis elegans.Proc. Natl. Acad. Sci. USA 108: 17708-17713.
Wu, Y., P. Wawrzusin, J. Senseney, R. S. Fischer, R. Christensen, A.Santella, A. G. York, P. W. Winter, C. M. Waterman, Z. Bao et al.2013. Spatially isotropic four-dimensional imaging with dual-viewplane illumination microscopy. Nat. Biotechnol. 31: 1032-1038.
39IMPROVED CONTRAST IN diSPIM