Using Sim Smith to Improve Antenna Matchingaudiosystemsgroup.com/PacificonSmithChart.pdf · About...
129
Using Sim Smith to Improve Antenna Matching Jim Brown K9YC [email protected] http://audiosystemsgroup.com/publish.htm
-
Upload
doankhuong -
Category
Documents
-
view
224 -
download
3
Transcript of Using Sim Smith to Improve Antenna Matchingaudiosystemsgroup.com/PacificonSmithChart.pdf · About...

Using Sim Smith to Improve Antenna Matching
Jim Brown K9YC
[email protected]://audiosystemsgroup.com/publish.htm

The Objectives
• Eliminate antenna tuners
• Improve match to our rigs
• Minimize losses
• Improve operating efficiency
• Prepare for automatic switching

I wanted to replace these tuners that I also had to tune

With this switching that I can automate with band decoders
Stubs

The Tools
• NEC Design Software• Vector Network Analyzer
or
• Vector Impedance Analyzer
• Sim Smith Design Software

The Process
• Measure an existing antennaor:
• Export antenna design from NEC • Import data into Sim Smith, use it
to design matching networks–Stubs
–Matching sections
–Capacitors, inductors, transformers

About Analyzers• Vector Analyzer – includes phase
–Needed for any design work
• Vector Impedance Analyzer (VIA)
–Single Port
–Measures impedance (R + jX)
–Time Delay Reflectrometry (TDR)• Line length, cable quality, splices
• Works even w/antenna connected

About Analyzers• Vector Network Analyzer (VNA)
–Two port analysis–Measures impedance, TDR, and–Measures response through a
network or system•Coax loss, velocity factor•Bandpass filter response•Coupling between antennas•Gain (loss) of networks and systems
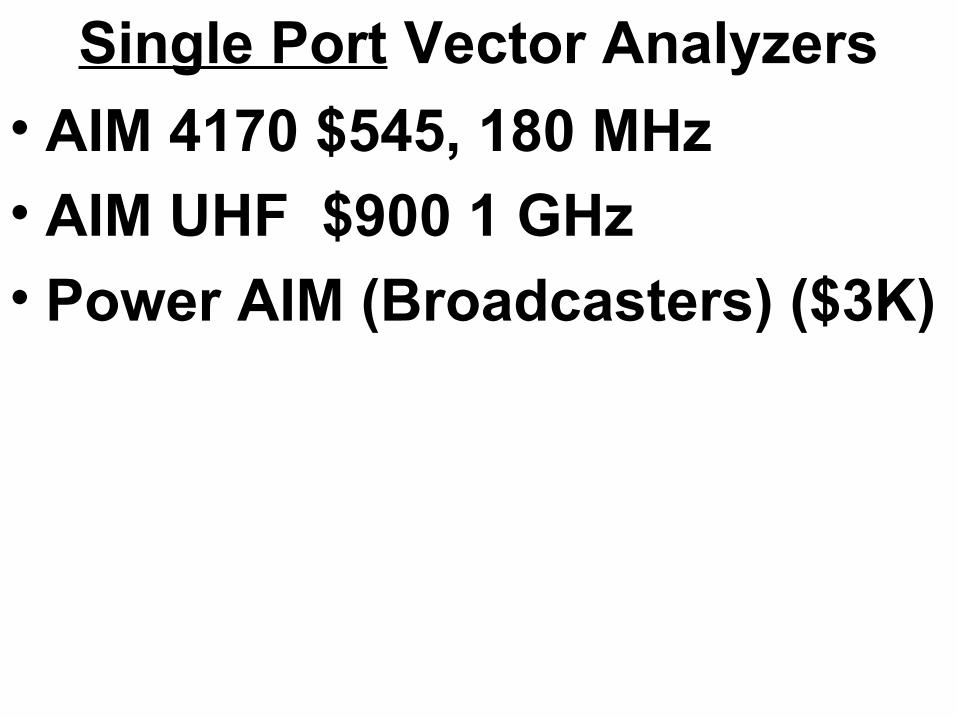
Single Port Vector Analyzers
• AIM 4170 $545, 180 MHz
• AIM UHF $900 1 GHz
• Power AIM (Broadcasters) ($3K)
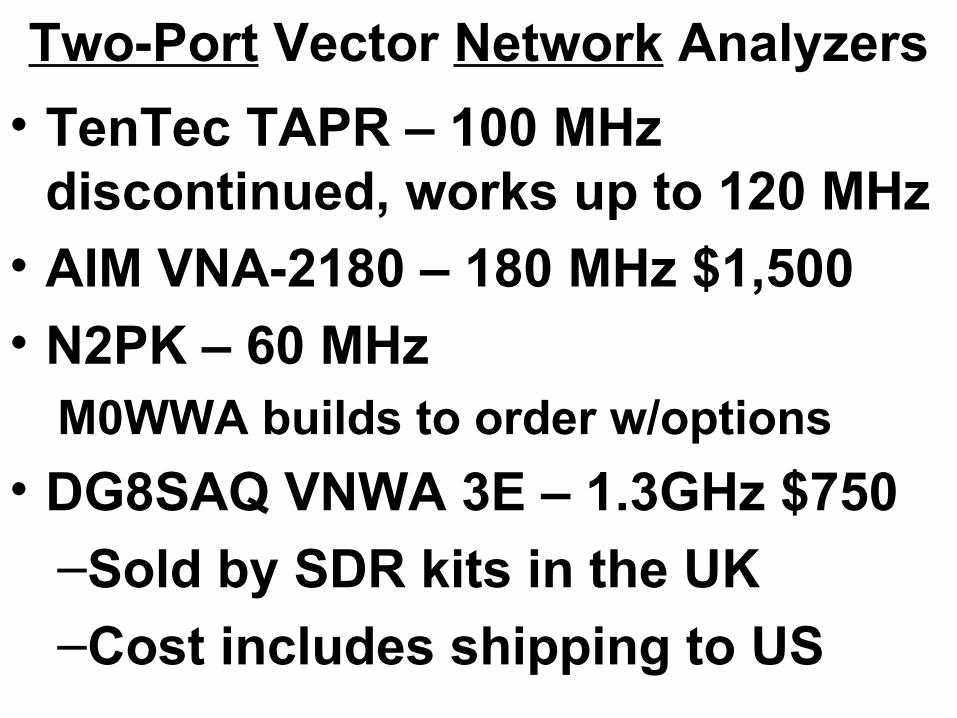
Two-Port Vector Network Analyzers
• TenTec TAPR – 100 MHz discontinued, works up to 120 MHz
• AIM VNA-2180 – 180 MHz $1,500• N2PK – 60 MHz
M0WWA builds to order w/options
• DG8SAQ VNWA 3E – 1.3GHz $750–Sold by SDR kits in the UK–Cost includes shipping to US

Low Cost Vector Analyzers• All use a Windows computer to
process and display data• All couple data via USB port• All come with free software• All come with calibration set• DG8SAQ powers from USB port• All others need DC power• All export data in standard formats

My Choice – DG8SAQ VNWA 3E• Self powered from USB port,
easiest to set up in the field• Full specs to 500 MHz, reduced
dynamic range to 1.3 GHz• Active Yahoo user group support• Ongoing development of software,
firmware, hardware by DG8SAQ
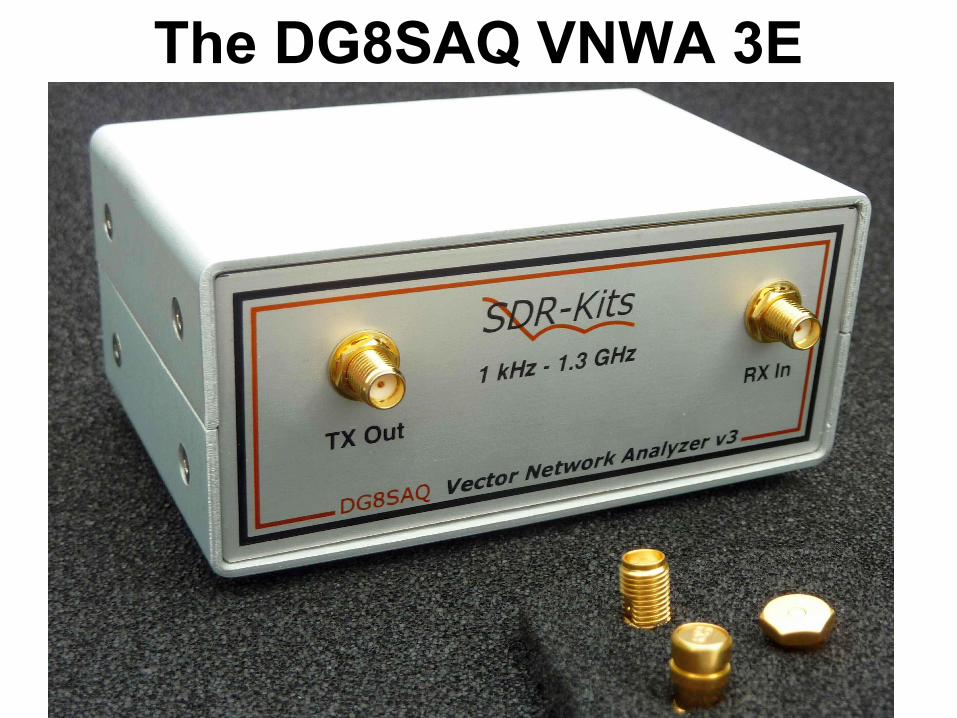
The DG8SAQ VNWA 3E

About the Smith Chart• Developed by Phillip Smith in 1939• A method of plotting R + jX data
that allows graphical computations involving transmission lines
• Allows a “way of looking” at a problem that, with experience, suggests solutions
• A great learning tool

About the Smith Chart• Impedances plotted on the chart
are “normalized” to Zo• Normalized means every data point
is divided by the same value, in this case, Zo

Zo
The Smith Chart

The Smith Chart
R+XL
R-
XC
R > ZoR < Zo

Constant SWR Circles1.5:1, 2:1, 3:1, 4:1

Transmission Line Rotates Impedances Clockwise toward
the Transmitter
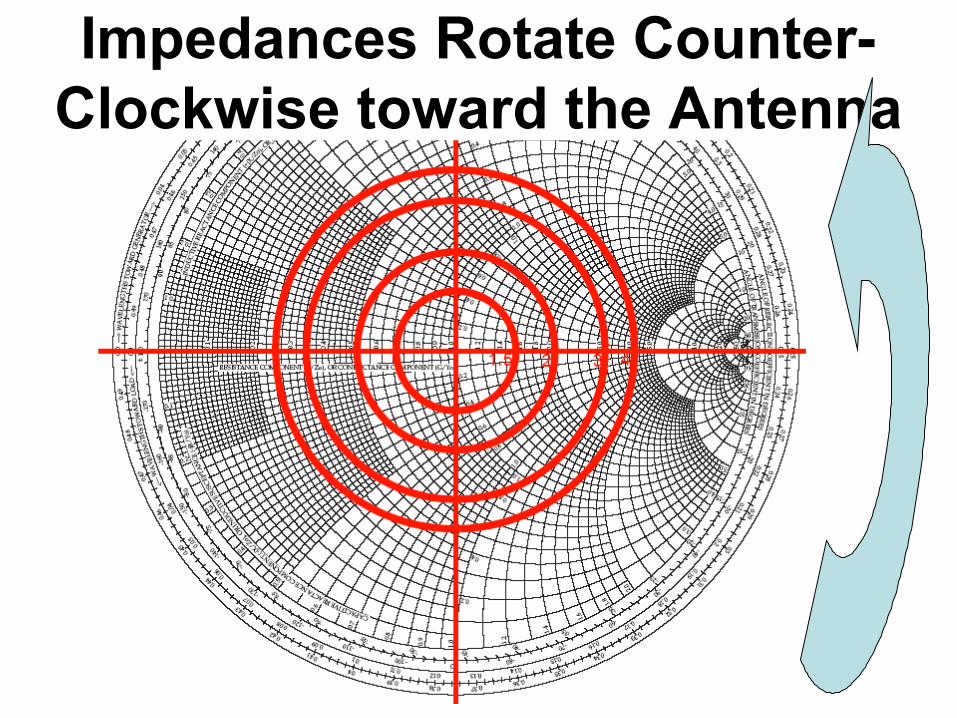
Impedances Rotate Counter-Clockwise toward the Antenna
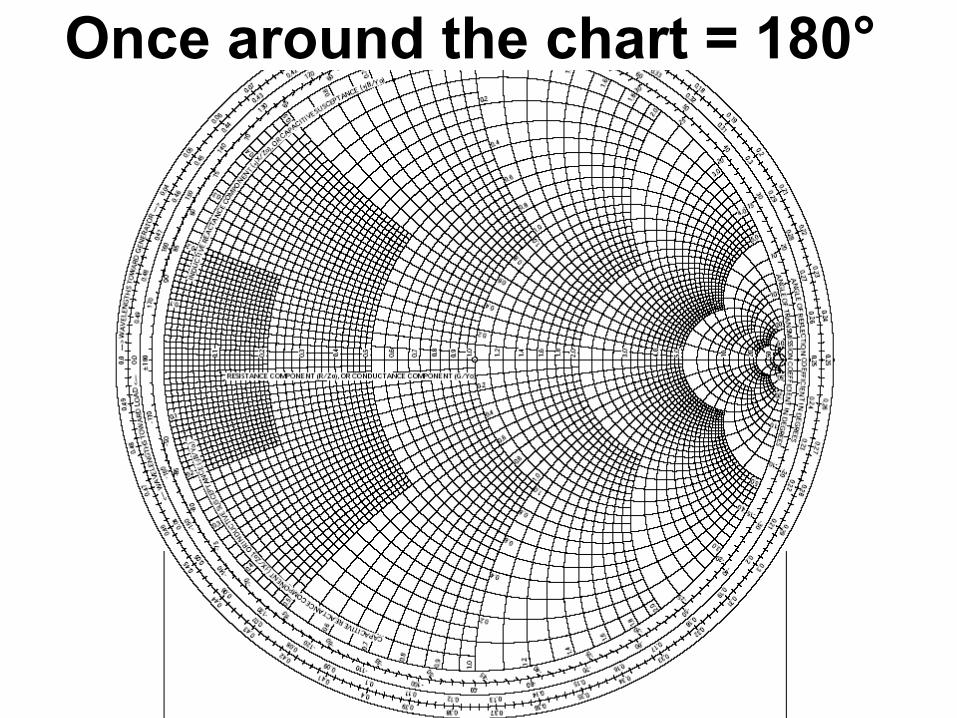
The Smith ChartOnce around the chart = 180°
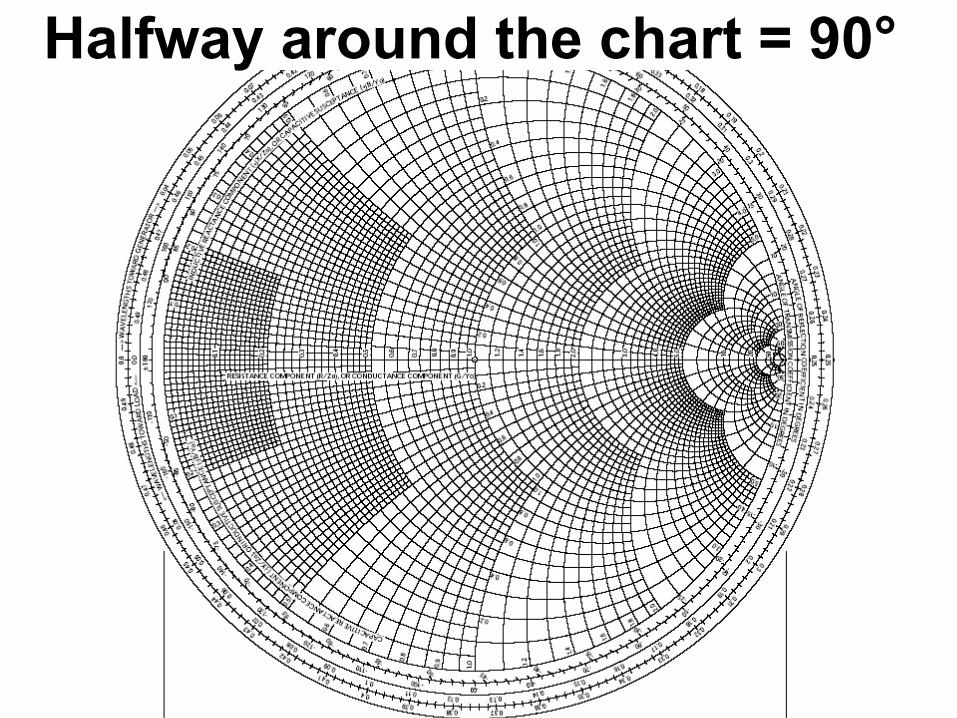
The Smith ChartHalfway around the chart = 90°

The Smith ChartWe know that a 90° (λ/4) line “inverts” the load impedance
Examples: a short becomes an openan open becomes a shortinductive becomes capacitive

The Smith Chart
λ/4 Transformer OpenShort

The Smith Chart
λ/4 125Ω20Ω

The Smith Chart
λ/4 Transformer

The Smith Chart
λ/4
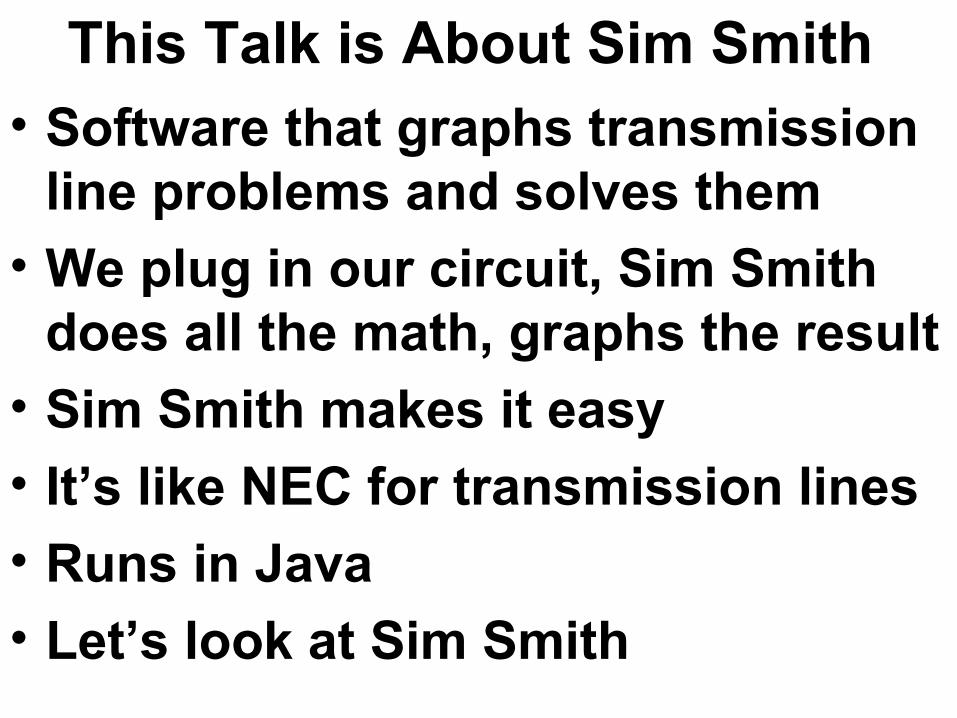
This Talk is About Sim Smith • Software that graphs transmission
line problems and solves them• We plug in our circuit, Sim Smith
does all the math, graphs the result • Sim Smith makes it easy• It’s like NEC for transmission lines• Runs in Java • Let’s look at Sim Smith


Zooming in on lower left corner

50 Ω
50Ω Plots at the Center

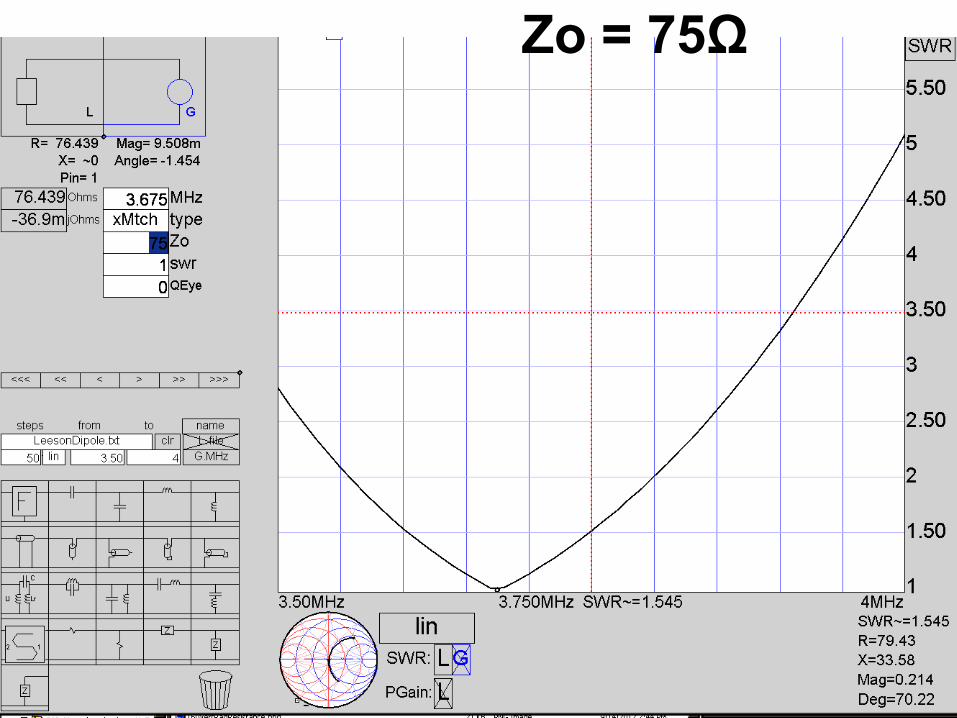
SWR and Loss View of a Model

80M Dipole Imported From NEC, Zo = 50Ω

SWR View Zo = 50Ω

Zo = 75Ω
Zo = 75Ω
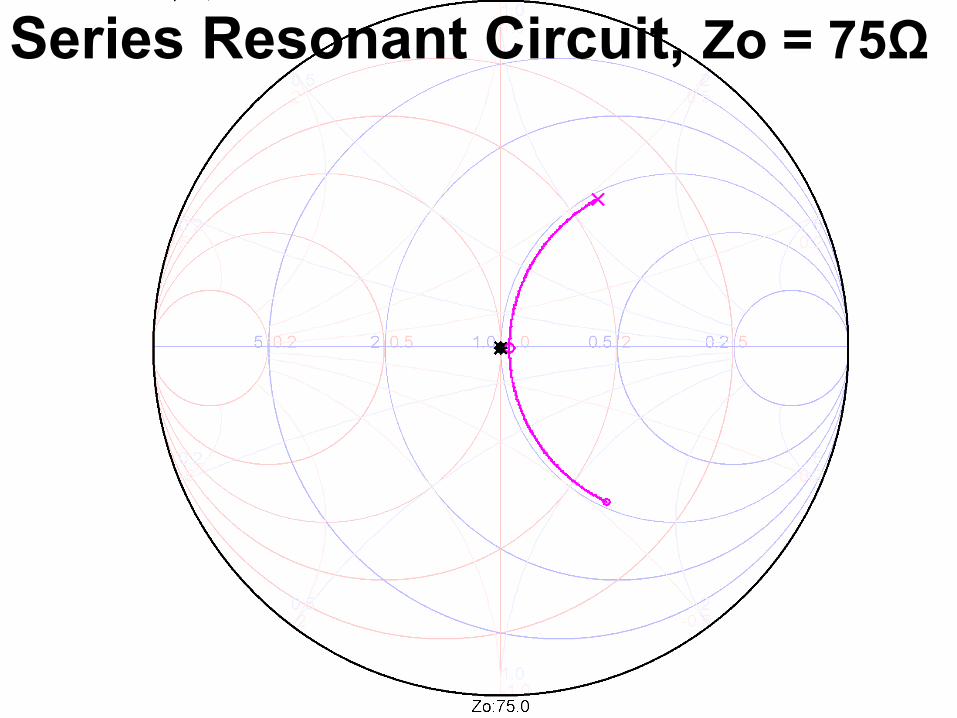
Series Resonant Circuit, Zo = 75Ω

The Dipole 75 Ω

Impedance Transformed Along Line

Impedance Transformed Along Line

Impedance Transformed Along Line

Impedance Transformed Along Line

Impedance Transformed Along Line

At Antenna
180° at 3740 kHz
Impedance at 180° at 3740 kHz
3500 kHz
4000 kHz

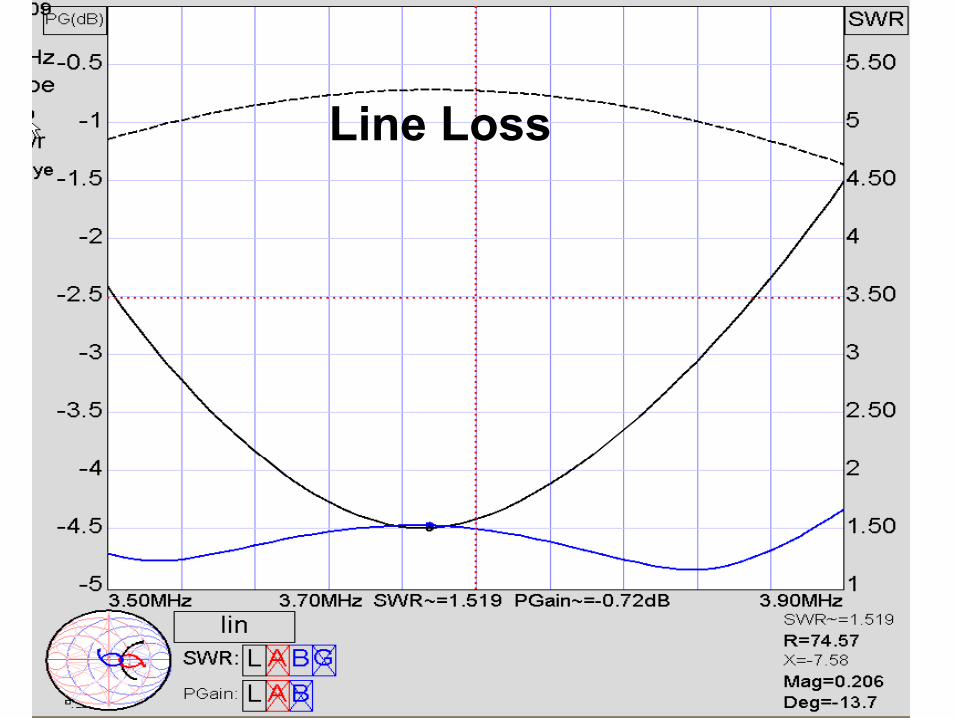
SWR Reduced By Line Loss
At Antenna
104 Ft Line Loss
3500 kHz 4000 kHz

“Leeson” 80M Dipole Matching180° 50Ω Line +90° 75Ω Line
Tuned to 3675kHz

At Transmitter
At Antenna
Line Loss
“Leeson” 80M Dipole Matching

SWR At Transmitter
SWR At Antenna
Line Loss

SWR At Transmitter
SWR At Antenna
Line Loss
180° 50Ω Line +90° 75Ω Line

One More Time Around (360°)
Line Loss

Designing Matching Networks• We need to learn a bit more about
the Smith Chart to design networks• There are two versions of the Smith
Chart• The standard version works with
impedance (Z = R + jX Ohms)–Good for adding series reactance to a
circuit–Centers of circles are on the right

The Impedance Smith Chart
Center of Circles

Two Versions of Smith Chart• The inverted version works with
admittance (Y = G +jB)–Good for adding components in
parallel in a circuit
• Centers of circles are on the left

Inverted Smith Chart for Admittance
Center of Circles

Inverted Smith Chart for Admittance
0.02 mho (50Ω)

SimSmith Has Circles For Both

And Always Uses the Right Ones


The Smith ChartWhen matching, we want to end up at the center of the chart
Zo

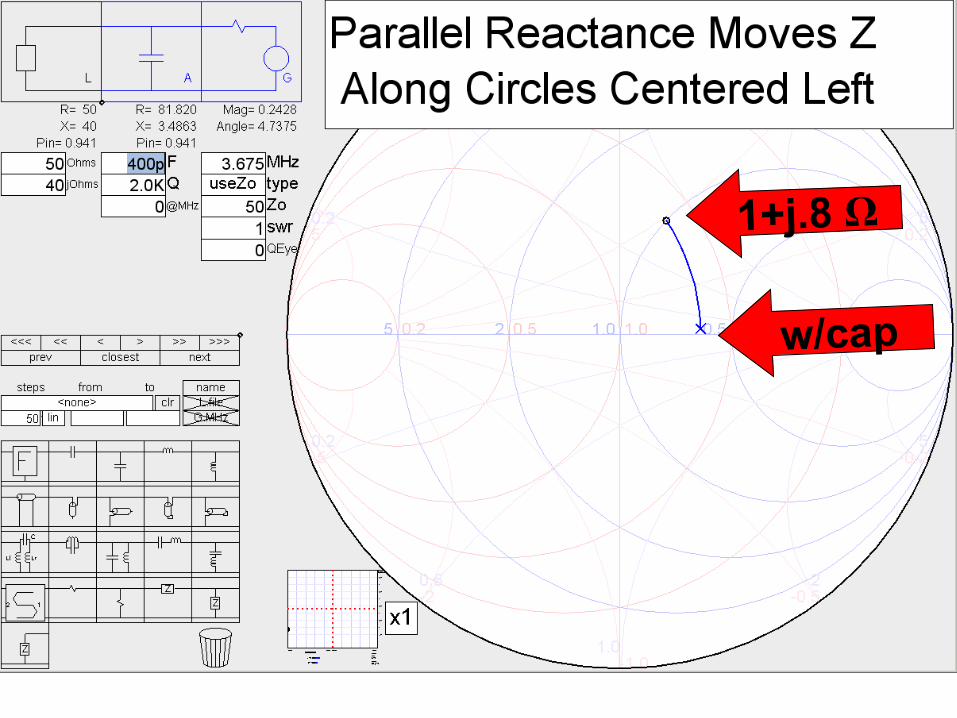
Designing Simple Networks• Adding reactance moves the
impedance along the circles• Series reactance moves Z along
circles centered to the right• Parallel reactance moves Z along
circles centered to the left–Capacitance moves Z downward–Inductance moves Z upward

A Simple Problem, at Only One Frequency
• We have a 50 + j40 Ω load (it’s inductive)
• We add a series capacitor• Z moves along a right-centered
circle, because it’s a series cap

50 Ω
1+j0.8 Ω
w/cap

A Parallel Example• Same 50+j40 Ω load (.0122 +j.0097
siemens)• On a paper Smith Chart, we would
turn the chart upside down and plot it as 0.61 + j .485
• We’re used to thinking impedance, and there’s a lot of trig in making that conversion

SimSmith to the Rescue• We draw the circuit with R, L, C,
stubs, transmission lines, etc. • Sim Smith does all the math, plots
everything in the right place, computes the right way, always displays the result in Ohms (the Impedance Smith Chart)
1+j.8 Ω
w/cap

Our Simple Example• Obviously, series C was the best
solution for this network, but most matching stubs are connected in parallel
• We’ll nearly always be following the left-centered circles

Back to Antennas• We design antennas to cover an
entire band, not just one frequency• NEC designs and antenna
measurements produce not just one point on the Smith Chart, but many points
• SimSmith plots those points as a curve for the frequency range we are interested in

Back to Antennas• Each point on the curve follows it’s
own circle• This can be tricky to visualize, so
let’s look at our 80M dipole

80M Dipole Imported From NEC
4000 kHz
3500 kHz
50Ω System

Back to Antennas• Adding 110° of coax, we get the
Red curve• Adding the parallel capacitor we
get the Blue curve

110 Degrees Along Line, Add Cap
4000 kHz3500 kHz
w/cap
No cap
50Ω System

Stub Matching• A stub is a short length of transmission
line connected in parallel with the main transmission line
• An open stub <90° looks capacitive• Find a point on the line where the
impedance is inductive (the top half of the Smith Chart) and add an open stub
• Or add a shorted stub <90° at a point where impedance is capacitive (in the bottom half of the Smith Chart)

Simple Stub Matching• Find a point on the transmission line
where we can move along a left circle to bring the curve closer to the center
• Usually easiest to add a small length of line, but we can also move along the line toward the antenna
• Add a stub that moves the impedance– Open stub to move down
– Shorted stub to move up
• Tweak position and stub for best SWR

Example – My 15M Yagi• Home brew 4-element, I didn’t get the
match quite right, and it’s up there
• A stub near the antenna will reduce SWR on the long run to the shack, also reducing cable loss
• There’s a coax splice below the rotator, a good place for a stub
• I made a VNA measurement there

SWR of 15M Yagi

Smith Chart View of 15M Yagi, measured at junction below rotator

Let’s Design a Stub

Add Coax To Rotate Impedance

Add Coax To Rotate Impedance

Add Open Stub

Add Open Stub

SWR View
At Antenna
With Stub

Add 120’ Coax To Reach Shack

SWR View
At Antenna
In Shack

SWR and Feedline Loss
SWR At Antenna
SWR In Shack
Feedline Loss
Loss (dB) SWR

Circuit For Stub

W6GJB’s 80M Dipole In Shack
SWR
3500 4000
2:1
4:1
6:1

TDR of W6GJB’s Dipole Feedline
Antenna
21.5m (70.52 ft)
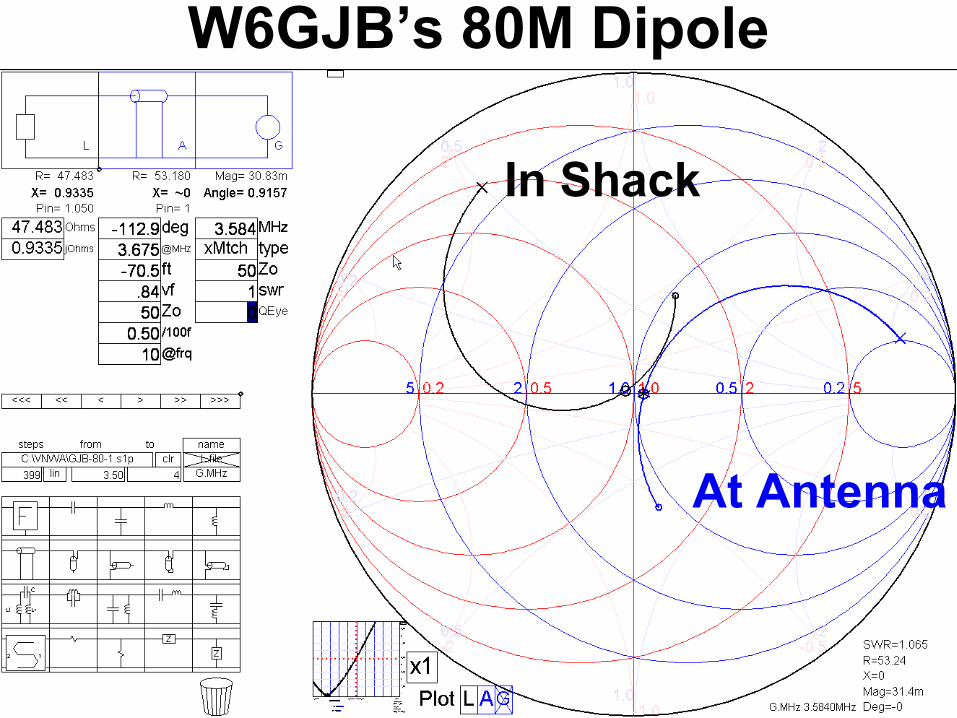
W6GJB’s 80M Dipole
At Antenna
In Shack

W6GJB’s 80M Dipole
In Shack
W6GJB’s 80M Dipole
2:1 @ 3665 kHz

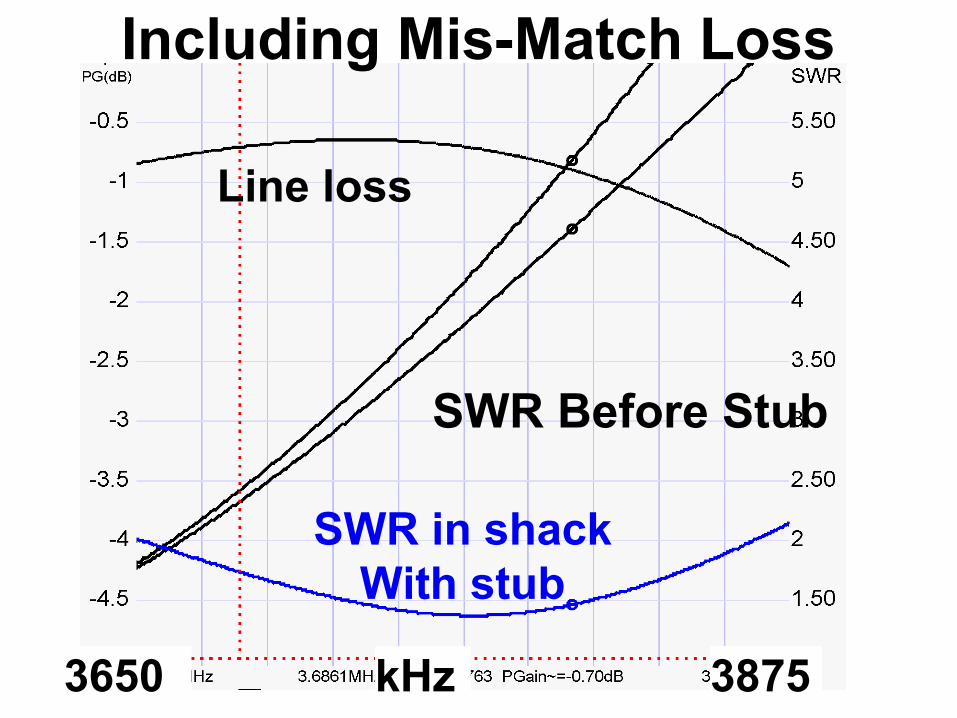
A Stub to Match for 75M SSB• SWR too high for power amp to
load above 3650 kHz• Set Sim Smith display limits to
3650 – 3900 kHz (makes it easier to see what you’re doing)
• Add length to make Z inductive• Add open stub

Before Stub
With stub
10 ft coax added
Smith Chart View of the Stub

Sim Smith Circuit for the Stub

SWR and Loss View of the Stub
Line loss
SWR Before Stub
SWR in shack With stub
3650 3875 kHz

Two Methods to Compute Loss• Include impedance mis-match
between transmitter and line (called “mismatch loss”)–Not really loss, simply less power
transferred to line• Ignore mis-match, assume some
sort of antenna tuner is used, or that Zs is significantly less than Zo

Without Mis-Match Loss
Line loss
SWR Before Stub
SWR in shack With stub
3650 kHz 3875
SWR Before Stub
SWR in shack With stub
Including Mis-Match Loss
Line loss
SWR Before Stub
SWR in shack With stub
3650 kHz 3875

When To Include Mis-Match Loss• Most VHF/UHF systems
–The path between the output devices and the output terminals is quite likely to be matched
–The source is likely to be 50Ω
• When you know the source Z is really the same as Zo

When To Ignore Mis-Match Loss• Any time an antenna tuner or
matching network not part of the model is used to drive the line
• Any “tuned” power amp• The source impedance, Zs, of most
HF power amps, including transceiver output stages, is likely to be closer 25Ω than 50Ω

Maximum Power Transfer• The classic theorem requiring
ZL = the conjugate of ZSOURCE applies to a variable LOAD impedance
• If ZSOURCE is variable, maximum power transfer occurs when
ZSOURCE << ZL

Maximum Power Transfer• The maximum power transfer
theorum was derived for linear circuits
• Impedance matching at power amp outputs is really a matter of providing an impedance that the output devices want to see
• That may or may not be
ZL = ZSOURCE

Matching my 80/40 JA Fan Dipole

My 80/40 EU/VK Fan Dipole

User Controls
Stubs

Stubs for my JA Fan Dipole

Stubs for my EU/VK Fan Dipole

Tuners I Replaced (one more was added after photo)

Cost/Benefit Analysis – Benefits• Antenna tuners are gone • SWR <1.5:1 all bands• Switching is simple, instantaneous• Exactly resettable• Much less clutter on operating
desk, space above desk for P3 VGA• Ready for YCCC “Mother of All
Antenna Switches” to control it
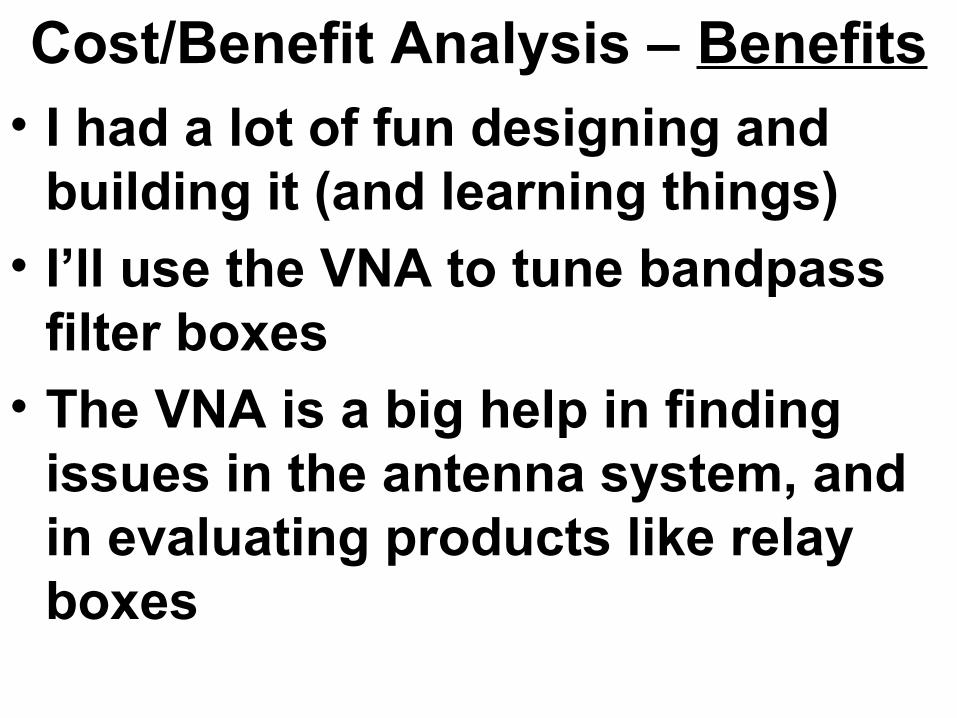
Cost/Benefit Analysis – Benefits• I had a lot of fun designing and
building it (and learning things)• I’ll use the VNA to tune bandpass
filter boxes• The VNA is a big help in finding
issues in the antenna system, and in evaluating products like relay boxes

Cost/Benefit Analysis – Costs• Some good coax, ~ 200 ft• Top Ten 1x6 switches ($110 each)• Connectors
–PL259s ~ $3 each–Tees, a few at ~ $11 each–Elbows, a few, ~ $ 9 each
• Vector analyzer $500 - $1,500–Lower cost units plenty good enough
for HF work–Or borrow one

Cost/Benefit Analysis – Savings• Antenna tuners, manual switching
–I’ve already sold five for a total of about $1,100
–I had ordered three of the new Elecraft tuners and am beta-testing one with my Titans, but I could live without them
–I’ll keep the beta unit for CQP

Rules of Thumb for Matching• Locate matching elements as close
to the antenna as practical–Generally yields a better match–Reduces line loss by minimizing
the length of line with high SWR–Practical for monoband antennas
• Matching in the shack works fine too, and is easier to switch

Ideas for Matching• Try a 75Ω matching section in 50Ω
line for an antenna near resonance –90°, 180° and multiples of 180°–Add coax if needed to adjust
length between 75Ω section and antenna so curve crosses the center horizontal (zero reactance line)
–Tweak lengths watching SWR at TX

1λ of 75Ω CATV Hard Line
w/ 58 ft CATV Hard Line
w/Stub
Line Loss 0.76dB
No Matching

3λ/2 of 75Ω CATV Hard Line
w/ 88 ft CATV Hard Line
w/Stub
No Matching
Line Loss 0.85 dB

2λ of 75Ω CATV Hard Line
w/ 117 ft CATV Hard Line
w/Stub
No Matching
Line Loss 0.9 dB

5λ/2 of 75Ω CATV Hard Line
Line Loss 1.02 dB
No Matching
w/Stub
w/146 ft CATV Hard Line

Rules of Thumb for Matching• Don’t rule out a 75 ohm matching
section with a tri-bander• 2λ on 20M (117 ft of CATV hard line)
is 3λ on 15M and 4λ on 10M
• I’m using 117 ft lengths of CATV hard line on my 20M and 15M monobanders, and may put one half that length on my 10M Yagi (because it’s much closer)

Rules of Thumb for Stubs• Try for an open stub first
–It’s usually shorter for moderate mismatches
• Higher VF coax requires more coax, but cutting errors will be lower
• Use good coax, but don’t worry about small loss differences
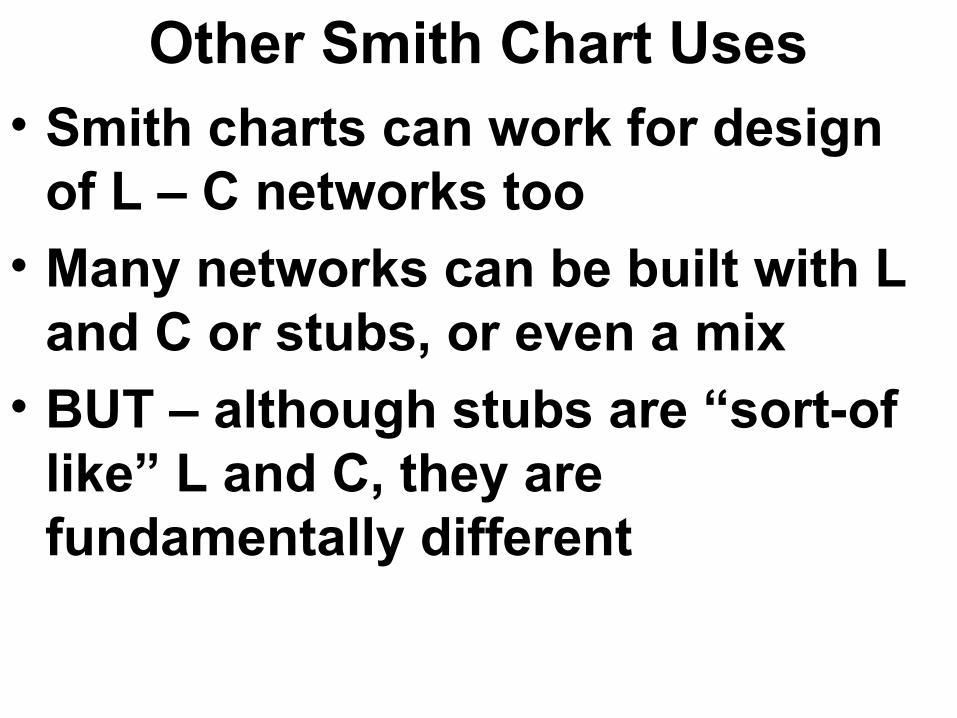
Other Smith Chart Uses• Smith charts can work for design
of L – C networks too• Many networks can be built with L
and C or stubs, or even a mix• BUT – although stubs are “sort-of
like” L and C, they are fundamentally different

How Stubs Are Different• An open stub <90° is capacitive,
but it’s capacitance varies with frequency
• Likewise, the inductance of an shorted stub <90° also varies with frequency
• A stub or matching section that is 90° or 180° at some frequency F is 85.5° or 171° at 0.95x F

How Stubs Are Different• These subtle differences often
make one or the other kind of component a better choice for any given circuit

Thinking About Stubs and Antennas
• Near resonance, a half wave dipole (or quarter wave vertical) acts much like a series resonant circuit
• Near resonance, an open λ/4 stub or shorted λ/2 stub acts like much series resonant circuit
• Near resonance, a shorted λ/4 stub or open λ/2 stub acts much like a parallel resonant circuit

Thinking About Stubs and Antennas
• An open stub shorter than λ/4 looks capacitive, and can tune out inductance
• A shorted stub shorter than λ/4 looks inductive, and can tune out capacitance
• Stubs move impedance along left-centered curves to, or away from, center of Smith chart

The Ultimate Matching Section• Loss in any line causes the
impedance to move closer to the center of the chart (lower SWR)• High losses >>> low SWR
• 1,000 ft of RG58 makes almost any antenna look perfectly matched –Approaches 1:1 for almost any load
–Burns 99% of the TX power at HF

The New Toy (Beta)

References• SimSmith info, download http
://www.ae6ty.com/Smith_Charts.html• SimSmith and Smith Chart Tutorial
http://www.ae6ty.com/Papers_files/QRParticle.pdf• SimSmith Primer
http://www.ae6ty.com/Smith_Charts_files/SimSmith%20Primer.pdf
• Ward Silver, N0AX QST Dec ’07, Jan ’08, Feb ’08 (Smith Charts)Nov ’04, Nov ’07 (Stubs)
http://www.arrl.org/hands-on-radio• Jim Brown, K9YC Some Q&A on Coax and Stubs
http://audiosystemsgroup.com/Coax-Stubs.pdf• Steve Stearns, K6OIK, Mysteries of the Smith
Chart http://archive.k6ya.org/docs/smith_chart.pdf
Using Sim Smith to Improve Antenna Matching
Jim Brown K9YC
[email protected]://audiosystemsgroup.com/publish.htm