Using principles of conservation genetics to inform ...
46
Using Principles of Conservation Genetics to Inform Propagation David J. Berg Department of Biology Miami University, Ohio
Transcript of Using principles of conservation genetics to inform ...

Using Principles of Conservation Genetics to Inform Propagation
David J. BergDepartment of BiologyMiami University, Ohio

Use of Propagation for Conservation
• Save species from extinction• Reintroduce extirpated populations• Augment extant populations• Provide individuals for research / education
Modified from IUCN (1987)

Goals of Propagation
Create populations that:• survive in captivity• have a high probability of survival in the wild• retain evolutionary potential

Problem
How do wemaximize “good” variation
increased survival in the wildmaintenance of evolutionary potential
whileminimizing “bad” variation?
loss of variationadaptation to captivity

Population Genetics Refresher
Gene: nucleotide sequence coding for a protein
Allele: one version of a geneuniparental: haploidbiparental: diploidhomozygous vs. heterozygous
Locus: physical location on a chromosome

Population Genetics RefresherMutation: change in nucleotide sequence
SubstitutionAATCCTAA AATCCAAA
DeletionAATCCTAA AATCCAA
InsertionAATCCTAA AATCCTCAA
Neutral: no change in protein

Population Genetics Refresher
Evolution: change in allele frequency over time
Hardy-Weinberg equilibrium = no change IF• No mutation• Infinite population size• Random mating• Closed population• No selection
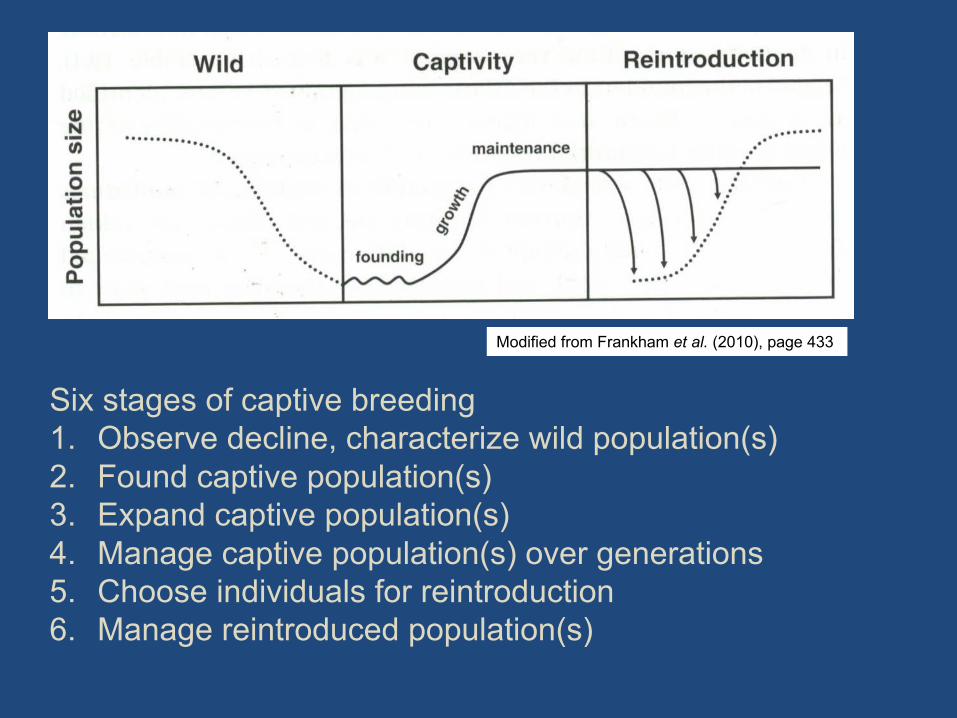
Modified from Frankham et al. (2010), page 433
Six stages of captive breeding1. Observe decline, characterize wild population(s)2. Found captive population(s)3. Expand captive population(s)4. Manage captive population(s) over generations5. Choose individuals for reintroduction6. Manage reintroduced population(s)

1. Characterize variation
Total variation within a population isimportant
Variation among populations must bemaintained

Common Markers
DNA sequences
– Mitochondrial DNAhaploid, maternal, neutral, 1 locus
– Nuclear DNA~ haploid, neutral or under selection, ≥ 1 locus
http://www.mtdnatest.com/reagents-kits/mtdnatest-human/

Common Markers
Microsatellitesdiploidneutral10s of loci
http://genomics.cafs.ac.cn/ssrdb/index.php?do=about

Future Markers
• SNPs (genomics)diploid, neutral or under selection1000s of loci

Measures ofwithin-population variation
• MicrosatellitesNA = allelic richnessH = heterozygosity (HO and HE)Ne = genetically effective population size
• SequencesNumber of haplotypesk = average number of nucleotide differences

Genetically EffectivePopulation Size
Target population with census size (Nc) = xhas genetic variation equal to an “ideal”population of size y.
Constant Nc
50:50 sex ratioSmall, random variation in family size

Measures ofamong-population variation
• MicrosatellitesFST = (pooled variation – avg. variation)/pooled variation
variation among populations within riversvariation among rivers within regionsvariation among regions
Assignment tests
• SequencesΦST = FST analogue, accounting for sequence similarity

Black River(n = 154 / 6 sites)
Devils River(n = 3 / 3 sites)
Rio Grande(n = 58 / 5 sites)
Collection sites


Parsimony Network of COINhaplotype = 34
mtDNA COI
2
12
1
12
1
1
1
1
13
4 3
3
1
12
1
2
1
1
13
Black River (n = 146)Rio Grande (n = 10)
1
2
12
1
11
1
1
Black River (n = 146)Devils River (n = 3)Rio Grande (n = 58)
Inoue et al. (2015)
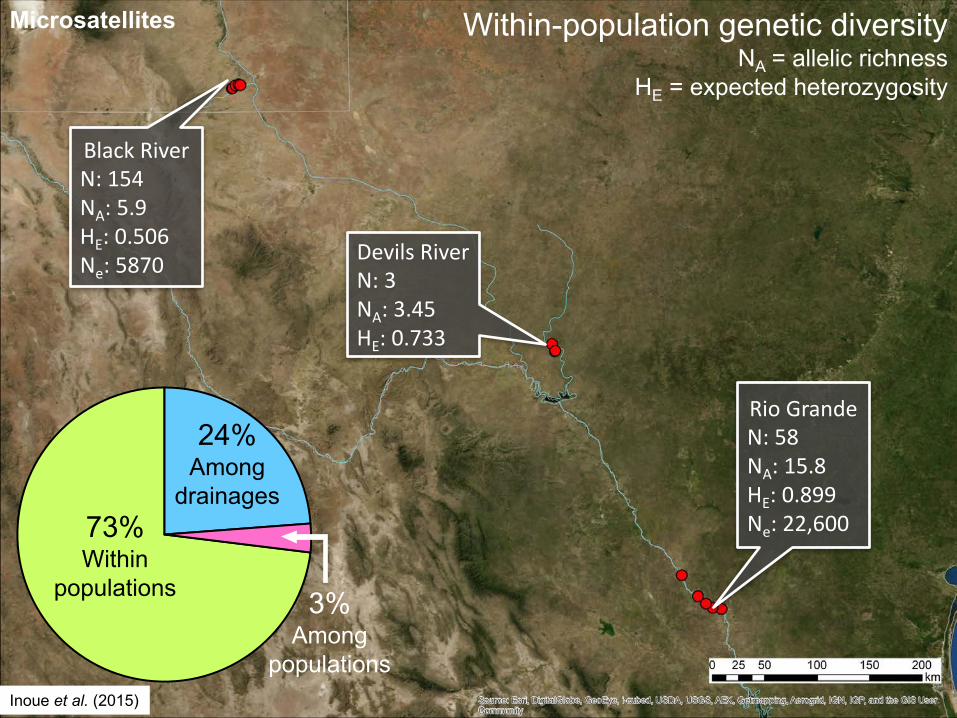
Microsatellites
BlackRiverN:154NA:5.9HE:0.506Ne:5870
DevilsRiverN:3NA:3.45HE:0.733
RioGrandeN:58NA:15.8HE:0.899Ne:22,600
Within-population genetic diversityNA = allelic richness
HE = expected heterozygosity
3%Among
populations
73%Within
populations
24%Among
drainages
Inoue et al. (2015)

CC Fall
DV RF1
BS RF3
DR RG1
RG2
RG3
RG4
RG5
DevilsRiver
Black River Rio Grande
0
0.5
1.0
Microsatellites Structure2 distinct clusters (k = 2)
Post
erio
r Pro
babi
lity
Group 1Group 2
Inoue et al. (2015)

St.Croix(SC)
Clinch(CR)
Gasconade(GR)
Meramec(MR)
Ouachita(OR)

COISequencesN=#ofindividualswith
Lineage1/Lineage2haplotypes
N=34/14
N=33/7
N=28/6
N=0/20
N=45/5SC
GR MR
CR
OR
3
251
1
1
5
1
111
2
11
23
2
2
1
52
11
1
2
11
11
28
1
17
1
2
12
Lineage1
Lineage2
COISequences
Inoue et al. (2014)

Within-populationgeneticdiversityNA =AllelicrichnessNE =Effectivepopulationsize
NA:12.8Ne:4,406
NA:13.8Ne:5,547
NA:13.9Ne:4,375
NA:8.0Ne:1,410
NA:13.2Ne:4,559
Microsatellites
Inoue et al. (2014)

Clin
ch
Gasc
onad
e
Mer
amec
Ouac
hita
St. C
roixClinch Gasconade Meramec Ouachita St. Croix
0
0.5
1.0
Post
erio
r pro
babi
lity
Structurek =2Microsatellites
Group1
Group2
Inoue et al. (2014)

Popenaias popeiiRio Grande has much greater within-population
variation than the Black RiverSignificant among-river variation
Manage as separate units
Cumberlandia monodontaOuachita population much lower variationLow among-population variation except for
Ouachita
Manage as two units, one covering large area

2. Found captive population(s)
Number of founders determineswithin-population variation
Demographic features are important
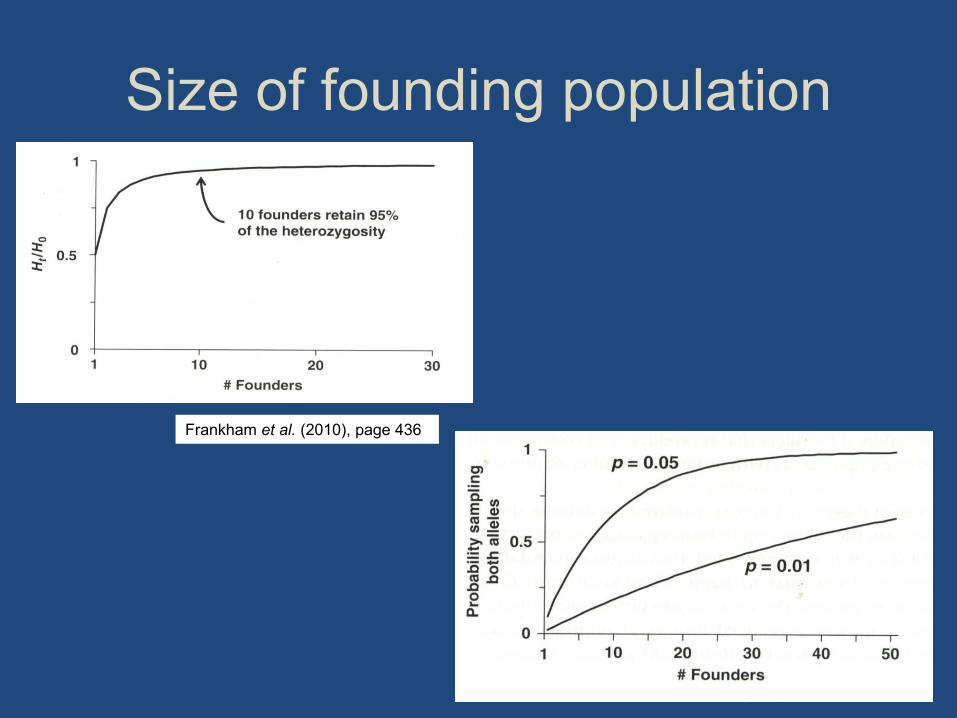
Size of founding population
Frankham et al. (2010), page 436

Ne = Nc, when50:50 sex ratio with random mating
Foos (1986)

3. Expand captive population(s)
Genetic drift = loss of genetic variation
Variance in reproduction must be random
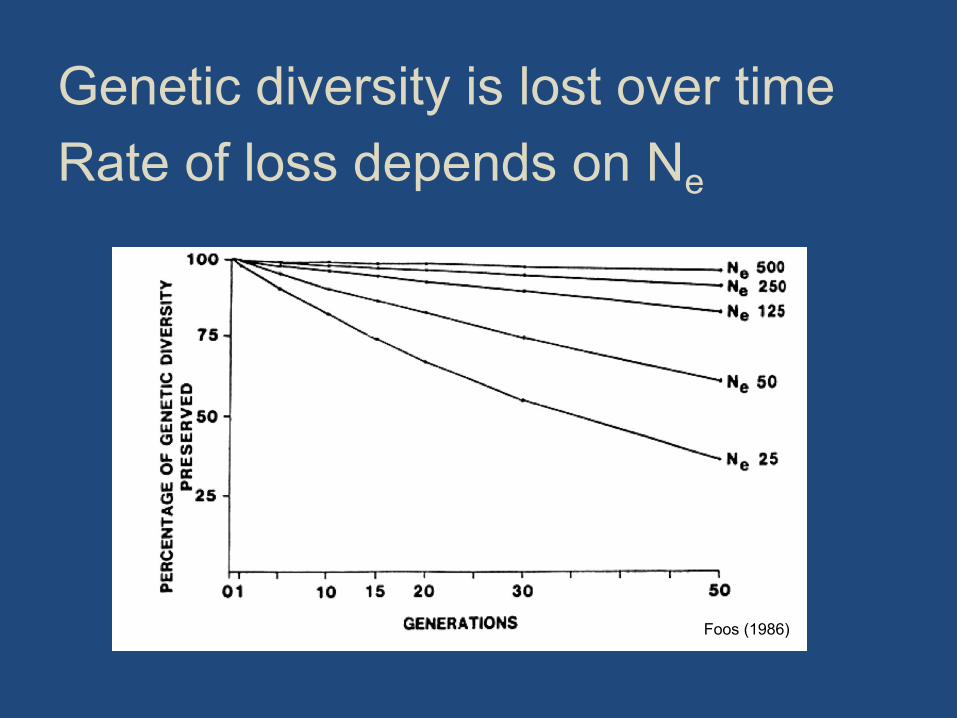
Genetic diversity is lost over timeRate of loss depends on Ne
Foos (1986)

Ne = Nc when50:50 sex ratio with random mating
AND
variance in reproduction is random
Foos (1986)

4. Manage captive population(s)
Minimize inbreeding
Maintain Ne
Minimize adaptation to captivity

Frankham et al. (2010), page 442
Maximum avoidance of inbreeding

Ne = Nc, when50:50 sex ratio with random mating
ANDvariance in reproduction is random
ANDpopulation size is constant
Ne is harmonic mean of N over timelong-term Ne ~ t / Σ(1/N)

Ne and population sizeTime Population Size1 50002 1003 10004 30005 6000
Ne = 427
Selection
Selection is on heritable traits
Selection is on the phenotype:genotype + environment
Selection varies with environmentnatural vs. artificial selection

Frankham et al. (2010), page 460
SLOSS: Single large or several small populations?

Traits under positive selection in captivity can be deleterious in the wild
Frankham et al. (2010), page 457
Genetic deterioration in Drosophila

5. Choose individuals toreintroduce
Distribute evenly among families / lineages
If augmenting, do not swamp out natives
Maintain geographic boundaries
Destroy / repurpose excess individuals

Ne / Nc
Population Ne Nc Ne / Nc
Black River 5,870 48,006 0.12
Rio Grande 22,600 280,000 0.08
Burlakova & Karatayev (2013)Inoue et al. (2015)

6. Manage reintroducedpopulation(s)
Protect from abnormal mortality, allowmortality from “normal” sources
Maintain natural habitat
Maintain geographic integrity
Let evolution happen

Frankham et al. (2010), page 340

Ne is key!No evolution in culture is the goal:
1. No mutation2. Infinite population size3. Random mating4. No gene flow5. No selection

• Maximizing Ne will retain evolutionary potential
• Reintroduce and let nature take its course

Thanks to the following
Curt Elderkin, Kentaro Inoue, Emy Monroe,Ashley Walters
Brian Lang (in memorium)

CitationsBurlakova, L. E., A. Y. Karatayev (2013) Survey of Texas hornshell
populations in Texas. Interim Performance Report for Project #419446.Texas Parks & Wildlife Department, Austin.
Foos, T. J. (1986) Genetics and demography of small populations. ThePrzewalski Horse and Restoration to Its Natural Habitat in Mongolia.Food and Agriculture Organization of the United Nations, Rome.http://www.fao.org/docrep/004/ac148e/AC148E00.htm#TOC
Frankham, R., J. D. Ballou, D. A. Briscoe (2010) Introduction toConservation Genetics, 2nd Ed. Cambridge University Press, England.
Inoue, K., B. K. Lang, D. J. Berg (2015) Past climate change drivescurrent genetic structure of an endangered freshwater mussel.Molecular Ecology 24: 1910-1926.
Inoue, K., E. M. Monroe, C. L. Elderkin, D. J. Berg (2014) Phylogeographicand population genetic analyses reveal Pleistocene isolation followed byhigh gene flow in a wide-ranging, but endangered, freshwater mussel.Heredity 112: 282-290.
IUCN (1987) The IUCN Policy Statement on Captive Breeding, IUCN,Gland, Switzerland.