Using photointerpretation and publicly available software ...
14
Using photointerpretation and publicly available software to assess revegetation ground cover on a shaded hillside A. Thomas Crawley Project Report Submitted to the Faculty of the Virginia Polytechnic Institute and State University in Partial Fulfillment of the Requirements for the Degree of Master of Science In Agriculture and Life Sciences Carl E. Zipper, Chair W. Lee Daniels, Committee Member Leonard Morrow, Committee Member Holly L. Scoggins, Committee Member June 2011 Blacksburg, VA
Transcript of Using photointerpretation and publicly available software ...

Using photointerpretation and publicly available software
to assess revegetation ground cover on a shaded hillside
A. Thomas Crawley
Project Report Submitted to the Faculty of the
Virginia Polytechnic Institute and State University
in Partial Fulfillment of the Requirements for the Degree of
Master of Science
In
Agriculture and Life Sciences
Carl E. Zipper, Chair
W. Lee Daniels, Committee Member
Leonard Morrow, Committee Member
Holly L. Scoggins, Committee Member
June 2011
Blacksburg, VA

Abstract
This project examined the potential of three plant species, Heuchera micrantha, Polystichum
acrostichoides and Pachysandra procumbens individually and in various combinations as potential
ground cover for a heavily shaded north-facing slope on the Maymont Estate in Richmond, Virginia.
Digital photographs were taken of the planting sites. Two software applications were used to make
quantitative evaluations of ground cover for the test plantings: the USDA's point sampling application
SamplePoint, and NIH's image analysis application ImageJ. GNU's Image Manipulation Program was
used to edit the digital images as needed to prepare them for interpretation and OpenOffice.org was
used to analyze data. Limiting factors for plant growth on these sites included topography and a dense
tree canopy, which obstructed sunlight (May – September) and produced mats of leaf litter (October –
March) which hindered quantification of plant growth. In order to compare the two image evaluation
methods, individual plant species' ground cover averages recorded by ImageJ were summed to compute
overall ground cover, and they were compared to the overall ground cover recorded in SamplePoint.
The two ground cover evaluation methods gave similar results. The SamplePoint method can be
applied by users with less technical training. However, due to consistent image quality and appropriate
algorithms, ImageJ has great potential as a vegetation quantifier. SamplePoint results from August to
May indicated H. micrantha initially covered an average of 6% in its quadrats in August 2009. May
2010 showed the average area had declined to 2%, while P. procumbens ground cover increased by
from 3 to 4.5% and P. acrostichoides cover increased from 11 to 16.5%, making it the most effective
species. Based on this study, P. acrostichoides will be used to revegetate the area, perhaps in
combination with P. procumbens.
Key Words
SamplePoint, ImageJ, image analysis, vegetation monitoring, ground cover, Maymont
Introduction
In 1925, the Maymont Estate in Richmond, Virginia, (Latitude= 37.5360191157835, Longitude=
-77.48028516769409) was opened to the public as an arboretum and park. Maymont's original 100
acres are intact and retain many of the architectural and landscape features in place at the time of death
by the last surviving owner, Mrs. Dooley (Figure 1). The Maymont Foundation is working to stabilize
the condition of the original woody plants collection.
1

Figure 1. An arial view of the test site with the Maymont Estate in Richmond, VA
The Maymont Foundation's Director of Horticulture and the Associate Executive Director had
several areas within the property slated for rehabilitation. Erosion mitigation and invasive species
control were recurring concerns. Of these areas, a very steep north-facing hillside that had been
covered with English Ivy (Hedera helix), an exotic invasive vine, was selected as a test site (Figure 2).
The Foundation wanted to reestablish native ground cover on the area before H. helix could take over
again. Three potential native Mid-Atlantic plant varieties were selected for testing: Hairy alumroot
(Heuchera micrantha - Hm), Christmas fern (Polystichum acrostichoides - Pa) and Allegheny spurge
(Pachysandra procumbens - Pp). Each species was selected based on acid soil preference and shade
tolerance, characteristics needed to thrive on this particular site.
Figure 2. The test site after installation of test plots.
Huchera micrantha is often found on hillsides and cliffs in well-drained soils. It does not spread by
stolons or rhizomes, but rather grows larger through a constantly expanding rosette. Polystichum
acrostichoides had already become established in various locations in and around the site. The fern
spreads through increasing the size of its crown. Based on the prolific growth of its Eurasian
counterpart, P. terminalis, in similar environs, P. procumbens was chosen (Chazdon 1988).
2

Pachysandra procumbens is also a clumping plant and does not grow as quickly as P. terminalis, which
spreads by stolons.
This project is an investigation of the possibility of successfully performing a vegetative cover
assessment using publicly available materials, software and simplified techniques of quantification.
This project's goal is to develop an easily adaptable method for potential use by laypersons to quantify
ground cover. Other researchers have explored the possibility using widely available public domain
programs in scientific research instead of commercial applications for several reasons:
1. Commercial programs are expensive
2. Commercial programs' source code and algorithms are proprietary, not public domain.
3. The operation of commercial programs is often complicated (Helma and Uhl 2000).
In this project, the researcher is developing and applying an easy-to-use, efficient system for
quantifying ground cover using public domain software. Independent researchers, volunteers and
students with limited budgets can make use of the software and techniques described in this paper. Two
potential uses include on-site measurement of meadow seed germination rates and assessment of
vegetative reclamation attempts of eroded soils.
Objectives
The primary goal of the project is to evaluate and compare growth rates of test ground cover
species in various combinations on a shaded, North-facing slope at the Maymont estate. This
assessment will be made using publicly-available, open source graphics editing programs. Specifically,
we focused on three objectives:
1. Photo interpretation & analysis: Develop an inexpensive method of ground cover
quantification using public domain, open source software.
2. Data Analysis: Estimate the percentage of ground covered by test plantings at various stages
during the first year of growth.
3. Data Comparison: Evaluate the test plantings to select the most effective method to revegetate
the north-facing slope with native plant species.
Method
Planting Sites
Two adjacent sites were chosen for their relative lack of existing native vegetation, exposed rock;
and tree roots. A soil sample was collected in early 2009 and sent to the Virginia Tech soil testing lab
3

for analysis. Notable was a pH of nearly 4.9. Soils within the area are mapped as Wateree-Wedowee-
Rock outcrop complex by the National Cooperative Soil Survey (Soil Survey Staff 2009). Wateree-
Wedowee-Rock outcrop complex is described as a mixture of predominately strongly acid, sandy loam
soils. Large sections of tree roots have been exposed in the area due to erosion of the topsoil. Dense
shade was created by a canopy of Acer rubrum, Liriodendron tulipifera, Quercus alba and Carya
glabra. Remaining light was filtered through an understory of Rhododendron sp., and Cornus florida.
Test Plantings
In each area six quadrats were established for a total of twelve quadrats. A third replication was
established in a separate location but was lost to heavy rains soon after planting. The remaining two
areas were established in combinations within each set of quadrats (Table 1, Figure 3):
Quadrat 1 14 equally spaced P. acrostichoides (Pa●)
Quadrat 2 14 equally spaced H. micrantha (Hm●)
Quadrat 3 9 evenly spaced P. procumbens (Pp●)
Quadrat 4 Interplanting- 3 Pa, 2 Pp, 3 Pa , 2 Pp, 3 Pa
Quadrat 5 5 Pa , 5 Hm, 5 Pp
Quadrat 6 Alternating rows- 3 Hm, 2 Pp, 3 Hm, 2 Pp, 3 Hm
Table 1. Planting plans for each of the six quadrats. Figure 3. Diagrams representing planting layout.
The test plantings were established in April 2009. Huchera micrantha and P. acrostichoides were
established as plugs and the P. procumbens as bare root plants. Ample rains during April and May
helped to establish plantings.
Image Capture
A Canon PowerShot SX110 IS 9.0 megapixel camera and a camera stand with a 1 m2 base, 1.5 m
in height constructed for photographing ground cover on a slope were used (Figure 4). The stand was
constructed with one inch PVC tubing, 6 elbow joints, and 4 T-connectors. A quarter-inch 20 thread
eye-bolt was used to mount the camera. To prevent sliding on hillsides, an exposed nail was attached to
the bottom of the base. Each of the 12 quadrats was photographed on five occasions over a period
extending from August 2009 through May 2010. From November 2009 through February 2010
photography was suspended until soil temperatures approached 12°C, when plant growth resumes.
4

Figure 4. Camera stand final design
Photo interpretation & analysis
Two methods were used to interpret and analyze the images for the purpose of quantifying ground
cover. The first method used spatial analysis of digital images and the program SamplePoint (Booth, et
al. 2006a) for software-assisted ocular examination. We were able to measure the area covered by the
selected species, miscellaneous species and leaf litter.
The second method used a more technical process. It reduced the entire spectrum of green pixels to
black and converted all non-green pixels to white. A macro program written for NIH's ImageJ (Burger
and Burge 2009) provides a ratio of black to white pixels in the image giving us a percentage of area
covered by the growing plants represented by the black pixels.
Image Pre-processing using GNU Image Manipulation Program (GIMP)
The program used to create and edit photos is an open-source application referred as GIMP. UC
Berkeley students Spencer Kimball and Peter Mattis developed the original program in 1995 and its
development has been continued by volunteers (Burgess 1998). Before viewing the images in
SamplePoint and ImageJ, the digital images were cropped to 1728 x 1728 pixels, rotated when
necessary, arranged in proper sequence and saved as JPEGs. These images were then analyzed using
the methods described.
5

Photo Interpretation using SamplePoint
SamplePoint is a manual image-analysis program designed in the programming language, C Sharp,
by researchers for USDA to facilitate vegetation cover measurements from nadir digital images of any
scale. The software operates essentially as a digital point frame, loading images, placing classification
points on the image, and storing the data to a database as the user classifies each point (Booth et al.
2006b). 100 points represented by single pixels were evenly distributed across each image in grid
formations a means of sampling the image pixels. User created buttons were used to assign each of the
100 points a label: P. acrostichoides, H. micrantha, P. procumbens, Root (exposed tree roots), Soil,
Invasive (self-propagated non-native plant species), or Volunteer (encroaching native plant species).
The results from each set of images were saved to a database.
Image Analysis using ImageJ
ImageJ was developed using the Java programming language by Wayne Rasband at the U.S.
National Institutes for Health. Its key features include a set of interactive tools for creating, editing,
processing, analyzing, loading, and storing images, with support for several common file formats. This
is complemented by a simple plugin/macro mechanism allowing users to extend the functionality of the
program by writing small pieces of Java code (Burger and Burge 2009). The program's primary
purpose is medical research, but as public domain, open source software any user has the four essential
freedoms defined by the Richard Stallman (1986), the founder of GNU:
1. The freedom to run the program, for any purpose.
2. The freedom to study how the program works, and change it to make it do what you wish.
3. The freedom to redistribute copies so you can help your neighbor.
4. The freedom to improve the program, and release your improvements to the public, so that the whole community benefits.
Green plants were isolated in the image by adjusting hue selection levels (Richardson et al. 2001,
Goodwin and Hsiang 2010) in GIMP for each quadrat manually to select only the green pixels.
(Enough green was present in the normally purple H. micrantha for those pixels to also be selected.
Species with foliage other than green can be selected by adjusting the selection levels accordingly.) The
saturation and lightness for the yellow and green channels were reduced to -100 which converts all
green hues to a dark gray. The saturation for all other colors was also set to -100 while the lightness
was set at +100, converting the non-green pixels to shades of light gray. A thresholding function was
6

then used to force the dark pixels, representing plant matter to black and the lighter remaining pixels to
white (Johnson 2003) (Figure 5). Any non-green plant elements still visible in the image such as leaf-
litter or roots were digitally removed. This black and white image was then saved as an 8bit grayscale
TIF file (Figure 6). Following this, a macro-program, B/W Ratio, developed for ImageJ was used to
assess the ratio of black pixels (representing green plants) to white pixels (representing soil, leaf litter,
roots, etc.) within the photographed quadrat. The data were then transferred to a spreadsheet.
Figure 5. GIMP process for preparing image for ImageJ
Figure 6. An example of the Quadrat 1 cropped image and an example of the image created for ImageJ
7

Results
Data Analysis & Comparison
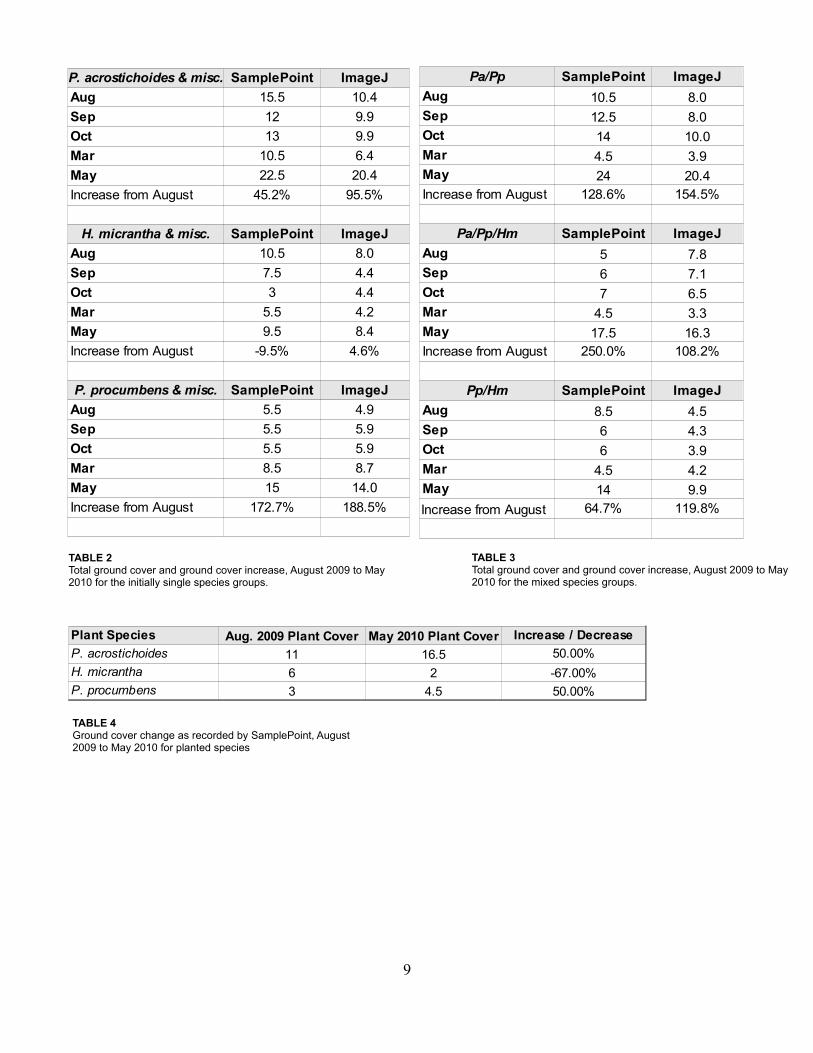
Using ImageJ, P. acrostichoides and other plants sharing the quadrats were shown to cover an
average of 10.4% of the quadrat in August 2009. May 2010 showed the average area covered to be
20.4%, an increase of almost double. The area covered by P. procumbens and the other plant species in
those quadrats nearly tripled from 4.9 to 14% of the 1 x 1m quadrat area. H. micrantha & additional
plants in those quadrats increased by 4.6%, from 8 to 8.4% of the area covered.
Using SamplePoint, data from the three mixed-species quadrats showed a greater increase of
ground covered than the three quadrats that were initially established as single species. The Pa/Pp
quadrat showed an almost 2x increase from 10.5% of the area covered to 20%. Pa/Pp/Hm showed a
3.5x increase from 5 to 17.5%. Pp/Hm showed a .64x increase from 8.5 to 14%.
Software Comparison
The Black/White Ratio macro in ImageJ was only capable of measuring nonspecific plant cover.
Invasives and seedlings were included in the pixel counts. In contrast, the original SamplePoint data
represented only the planted species (Tables 2, 3 and 4). In order to compare the two methods, the
invasive and volunteer plant counts were added to the planted species count in their respective quadrats
in SamplePoint. When charted, a correlation was evident between the two method's data. The data
generated by SamplePoint and ImageJ for P. procumbens and the miscellaneous plants in its quadrats
are especially similar.
Plant Species Comparison
A consistent rise in leaf litter obscured the plant growth occurring between August 2009 and
March 2010. Despite the thick mat of leaf litter, data generated by SamplePoint solely for the planted
species from August to May indicated P. acrostichoides initially covered an average of 11% of the
quadrat in August 2009. May 2010 showed the average area covered to be 16.5%, an increase of 50%.
The area covered by P. procumbens also increased by 50% from 3 to 4.5% of the 1 x 1m area covered.
H. micrantha decreased by a factor of 3, from 6 to 2% of the quadrat covered.
8
9
Pa/Pp SamplePoint ImageJAug 10.5 8.0Sep 12.5 8.0Oct 14 10.0Mar 4.5 3.9May 24 20.4Increase from August 128.6% 154.5%
Pa/Pp/Hm SamplePoint ImageJAug 5 7.8Sep 6 7.1Oct 7 6.5Mar 4.5 3.3May 17.5 16.3Increase from August 250.0% 108.2%
Pp/Hm SamplePoint ImageJAug 8.5 4.5Sep 6 4.3Oct 6 3.9Mar 4.5 4.2May 14 9.9Increase from August 64.7% 119.8%
TABLE 3Total ground cover and ground cover increase, August 2009 to May 2010 for the mixed species groups.
TABLE 4Ground cover change as recorded by SamplePoint, August 2009 to May 2010 for planted species
P. acrostichoides & misc. SamplePoint ImageJAug 15.5 10.4Sep 12 9.9Oct 13 9.9Mar 10.5 6.4May 22.5 20.4Increase from August 45.2% 95.5%
H. micrantha & misc. SamplePoint ImageJAug 10.5 8.0Sep 7.5 4.4Oct 3 4.4Mar 5.5 4.2May 9.5 8.4Increase from August -9.5% 4.6%
P. procumbens & misc. SamplePoint ImageJAug 5.5 4.9Sep 5.5 5.9Oct 5.5 5.9Mar 8.5 8.7May 15 14.0Increase from August 172.7% 188.5%
TABLE 2Total ground cover and ground cover increase, August 2009 to May 2010 for the initially single species groups.
Plant Species Aug. 2009 Plant Cover May 2010 Plant Cover Increase / DecreaseP. acrostichoides 11 16.5 50.00%H. micrantha 6 2 -67.00%P. procumbens 3 4.5 50.00%

10
Aug Sep Oct Mar May0
5
10
15
20
25
P. acrostichoides & miscellaneous plantsSamplePoint ImageJ
Aug Sep Oct Mar May0
2
4
6
8
10
12
14
16
P. procumbens & H. micranthaSamplePoint ImageJ
Aug Sep Oct Mar May0
2
4
6
8
10
12
14
16
P. procumbens & miscellaneous plantsSamplePoint ImageJ
Aug Sep Oct Mar May0
5
10
15
20
25
30
P. acrostichoides & P. procumbensSamplePoint ImageJ
Aug Sep Oct Mar May0
2
4
6
8
10
12
H. micrantha & miscellaneous plantsSamplePoint ImageJ
Aug Sep Oct Mar May02468
101214161820
P. acros./ P. proc / H. micranthaSamplePoint ImageJ

Discussion
Inaccurate interpretation was a problem with early SamplePoint data. In a preliminary analysis,
several non-plant pixels located directly adjacent to plant pixels had been marked as living plants. The
SamplePoint data corresponded much more closely to the ImageJ results when the exact single pixel
centered in the marker was recorded. Limiting the introduction of human error into the SamplePoint
data could be accomplished with the addition of several different users, with each analyzing the images
and then using an average of their findings as project results (Booth et al. 2006a).
With ImageJ, maintaining consistent image interpretations was a problem when attempting to
analyze photos taken under varying conditions. A solution that can be applied during image capture is
to create diffuse lighting by surrounding the quadrat with translucent plastic sheeting (Rotz et al. 2008).
This technique equalizes image color yielding more consistent images regardless of the lighting on the
days when individual photos are taken. In research conducted in 2005 by other researchers, lighting
differences were digitally adjusted after image capture. Histograms for all images were adjusted using
the autoequalize algorithm in Corel Photo Paint, normalizing color among all images to cancel the
differences caused by light intensity and color temperature (Booth et al. 2005). I did not use these
methods in this research but in retrospect, that or a similar technique might have been helpful.
VegMeasure, a vegetation measurement program developed at Oregon State University, gives the
user the option of processing each image with its own threshold value (Johnson 2003). This technique
was also used in our research, but without an algorithm or guidelines for the RGB values representing
productive plants the potential for bias exists. Another concern with ImageJ involved “noise” in the
photographic images which registered as plant cover. A 1m2 image of uncovered soil produced 5.6%
black pixels representing plant growth, even though no plants were present.
Wet leaves were another problem for the ImageJ software. Glare in the May images resulted in the
omission of the highlighted parts of the plant when selecting for green pixels. Polarizing camera lens
filters were suggested as a potential solution in previous research (Rotz et al., 2008). Waiting for the
leaves to dry is also a viable solution when time allows.
Although ImageJ was unable to differentiate various plant species, regular plant maintenance and
integrated pest management would limit the amount of non-target species in the assessment plots. With
periodic maintenance of the plots, ImageJ would be able to quantify the target species more accurately.
11

Conclusion
In searching for a less expensive, quicker way of quantifying ground cover, I found value in the
use of methodical algorithm creation, strict adherence to the rules of image assessment and careful
image capture with regard to lighting and precipitation. Expensive, commercial quantification software
packages come with these and other capabilities built-in. Both public domain software packages tested
here have the potential for use in ground cover assessment with an acceptable level of agreement. To
achieve this, the researcher using these methods must have cursory knowledge of both software and
plant materials, and should be prepared to perform mathematical calculations.
Project results indicate P. acrostichoides as the planted species showing the most horizontal
growth, resulting in increased percent ground cover. The researcher's interpretation of these results is
that P. acrostichoides is the best suited species used to revegetate the area. When used alone and in
combination with P. procumbens, P. acrostichoides provided a relatively high level of ground cover
early in the plantings' second growing season. It appears that with careful management, any of these
plant species could become established on the hillside. When using a hands-off approach, however, P.
acrostichoides adapts most readily to the environment.
Acknowledgements
The author wishes to express his appreciation to Peggy Singlemann, Director of Horticulture at the
Maymont Foundation for her wealth of horticultural knowledge; also Fred Murray, Associate Executive
Director at Maymont and the Horticulture Staff, Caroline Harding and Christopher Jones for their
gracious assistance and advice. Thanks also to Cindy Conner of Homeplace Earth, Phil Goetkin and
Michael Dixon of Wolf Trap National Park, Luke Jessup of Father Nature Restorative Landscaping,
Matthew Cohen & Elizabeth Hargrave of Matt's Habitats and The Natural Capital for their generous
advice. Special thanks to Committee Members, Drs. W. Lee Daniels, Holly L. Scoggins, Leonard
Morrow and especially Carl E. Zipper, without whom this paper would not have been possible. Finally
thanks to Rev. and Mrs. Allen Crawley Sr. and the late Mae E. Crawley for their appreciation of the
functional and aesthetic uses of plants. Most of all thanks to Stephanie Hammel whose encouragement,
support and patience made it possible for the author to give academics another shot.
12

Reference
Booth D.T., Cox S., Berryman R. (2006a) Point Sampling Digital Imagery with ‘Samplepoint’.
Environmental Monitoring and Assessment 123:97-108. DOI: 10.1007/s10661-005-9164-7.
Booth D.T., Cox S.E., Johnson D.E. (2005) Detection-Threshold Calibration and Other Factors
Influencing Digital Measurements of Ground Cover. Rangeland Ecology & Management 58:598-
604. DOI: 10.2111/05-060r1.1.
Booth D.T., Cox S.E., Meikle T.W., Fitzgerald C. (2006b) The Accuracy of Ground-Cover
Measurements. Rangeland Ecology & Management 59:179-188. DOI: 10.2111/05-069r1.1.
Burger W., Burge M.J. (2009) ImageJ, Principles of Digital Image Processing, Springer London. pp.
25-36.
Burgess S. (1998) GIMP How It All Started, http://www.gimp.org/about/ancient_history.html.
Chazdon R.L. (1988) Sunflecks and Their Importance to Forest Understorey Plants, in: A. H. F. M.
Begon, E. D. Ford, and A. Macfadyen (Eds.), Advances in Ecological Research, Academic Press.
pp. 1-63.
Helma C., Uhl M. (2000) A public domain image-analysis program for the single-cell gel-
electrophoresis (comet) assay. Mutation Research/Genetic Toxicology and Environmental
Mutagenesis 466:9-15. DOI: Doi: 10.1016/s1383-5718(99)00232-6.
Johnson E.J.L., Vulfson, M. (2003) VegMeasure: A C++ computer program for field measurement of
vegetative cover, ASPRS 2003 Annual Conference, Anchorage, Alaska. pp. 1-8.
Richardson, D. M., Karcher, E. D., Purcell, C. L. (2001) Quantifying turfgrass cover using digital
image analysis Crop Science Society of America, Madison, WI, ETATS-UNIS.
Rotz J.D., Abaye A.O., Wynne R.H., Rayburn E.B., Scaglia G., Phillips R.D. (2008) Classification of
Digital Photography for Measuring Productive Ground Cover. Rangeland Ecology & Management
61:245-248. DOI: doi:10.2111/07-011.1.
Soil Survey Staff, Natural Resources Conservation Service, United States Department of Agriculture.
Web Soil Survey. Available online at http://websoilsurvey.nrcs.usda.gov/ accessed [05/05/2009].
Stallman R. (1986) The Free Software Definition, http://www.gnu.org/philosophy/free-sw.html.
13