Using In-Depth Interviews to Estimate Non-Energy … · 20/9/2011 · Using In-depth Interviews to...
12
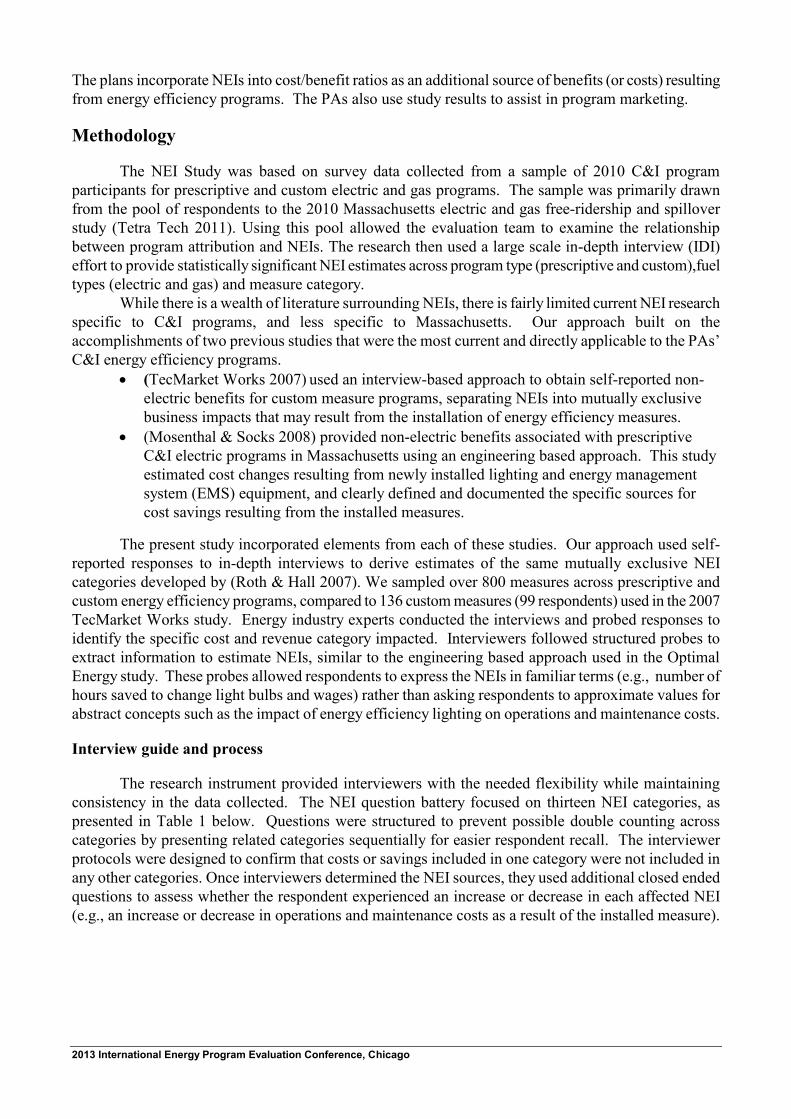
2013 International Energy Program Evaluation Conference, Chicago Using In-depth Interviews to Estimate Non-energy Impacts Resulting from Commercial and Industrial Energy Efficiency Measures Noel Stevens, DNV KEMA Energy & Sustainability, Burlington, MA Lindsay Foley, National Grid, Waltham, MA Susan Weber, DNV KEMA Energy & Sustainability, Burlington, MA Pam Rathbun, Tetra Tech, Madison, WI Miriam Goldberg, DNV KEMA Energy & Sustainability, Madison, WI ABSTRACT This paper presents the methods and results of a non-energy impact (NEI) study of commercial and industrial energy efficiency measures in Massachusetts. This is one of the largest and most comprehensive and systematic studies of nonresidential NEIs conducted to date. In addition to developing quantitative NEI factors for future program planning and valuation, the study explored the relationship between NEIs and program influence on participant decisions. NEIs can contribute positively to program effectiveness when programs use NEIs to help promote energy efficiency decisions, but can contribute to free ridership if the NEIs are well known to customers without program assistance. The study, completed in June of 2011, used in-depth interviews with 505 participants to identify and quantify NEIs associated with 789 measures installed through the programs. Researchers used a multi-step process to translate qualitative interview responses into a set of quantitative NEI estimates. We provided separate average NEI estimates for prescriptive and custom electric and gas measures aggregated into 15 reporting categories. In nearly all cases, we found statistically significant average NEIs per unit of energy savings. Introduction This paper presents study results of the Massachusetts Cross-Cutting Evaluation Team’s analysis of non-energy impacts (NEIs) attributable to 2010 commercial and industrial (C&I) retrofit programs. The study was administered by the Massachusetts Program Administrators (PAs). The goal of this study was to provide a comprehensive set of statistically reliable NEI estimates across the range of C&I retrofit programs offered by the Massachusetts electric and gas PAs. The study addressed the following objectives, separately for prescriptive and custom electric and gas measures: 1. Quantify participant gross and net NEIs per unit of energy savings; and 2. Determine the relationships between NEI rates and program attribution. NEIs include positive or negative effects resulting from energy efficiency measures, apart from energy savings. Non-energy benefits (NEB) is the terms frequently used to refer to positive NEIs, while negative NEIs—non-energy costs— reflect ways that energy efficiency measures result in adverse effects. An example of a positive NEI is the reduction in labor costs associated with cleaning an oil fired furnace upon installation of a gas furnace. An example of a negative NEI is the increased maintenance costs incurred by added equipment from co-generation measures. NEIs (or NEBs) can be further distinguished as participant or societal. This paper focuses on participant NEIs, which are monetary and non-monetary benefits (positive or negative) that the program participant experiences. DNV KEMA Energy & Sustainability (DNV KEMA) embarked on this study to fulfill the directive set forth by the Massachusetts State’s Department of Public Utilities to update and improve NEI estimates for use in the PA’s 2013 to 2015 energy efficiency three-year plan and future annual plans.
Transcript of Using In-Depth Interviews to Estimate Non-Energy … · 20/9/2011 · Using In-depth Interviews to...
2013 International Energy Program Evaluation Conference, Chicago
Using In-depth Interviews to Estimate Non-energy Impacts Resulting from
Commercial and Industrial Energy Efficiency Measures
Noel Stevens, DNV KEMA Energy & Sustainability, Burlington, MA
Lindsay Foley, National Grid, Waltham, MA
Susan Weber, DNV KEMA Energy & Sustainability, Burlington, MA
Pam Rathbun, Tetra Tech, Madison, WI
Miriam Goldberg, DNV KEMA Energy & Sustainability, Madison, WI
ABSTRACT
This paper presents the methods and results of a non-energy impact (NEI) study of commercial
and industrial energy efficiency measures in Massachusetts. This is one of the largest and most
comprehensive and systematic studies of nonresidential NEIs conducted to date. In addition to
developing quantitative NEI factors for future program planning and valuation, the study explored the
relationship between NEIs and program influence on participant decisions. NEIs can contribute
positively to program effectiveness when programs use NEIs to help promote energy efficiency
decisions, but can contribute to free ridership if the NEIs are well known to customers without program
assistance.
The study, completed in June of 2011, used in-depth interviews with 505 participants to identify
and quantify NEIs associated with 789 measures installed through the programs. Researchers used a
multi-step process to translate qualitative interview responses into a set of quantitative NEI estimates.
We provided separate average NEI estimates for prescriptive and custom electric and gas measures
aggregated into 15 reporting categories. In nearly all cases, we found statistically significant average
NEIs per unit of energy savings.
Introduction
This paper presents study results of the Massachusetts Cross-Cutting Evaluation Team’s analysis
of non-energy impacts (NEIs) attributable to 2010 commercial and industrial (C&I) retrofit programs.
The study was administered by the Massachusetts Program Administrators (PAs). The goal of this study
was to provide a comprehensive set of statistically reliable NEI estimates across the range of C&I retrofit
programs offered by the Massachusetts electric and gas PAs. The study addressed the following
objectives, separately for prescriptive and custom electric and gas measures:
1. Quantify participant gross and net NEIs per unit of energy savings; and
2. Determine the relationships between NEI rates and program attribution.
NEIs include positive or negative effects resulting from energy efficiency measures, apart from
energy savings. Non-energy benefits (NEB) is the terms frequently used to refer to positive NEIs, while
negative NEIs—non-energy costs— reflect ways that energy efficiency measures result in adverse
effects. An example of a positive NEI is the reduction in labor costs associated with cleaning an oil fired
furnace upon installation of a gas furnace. An example of a negative NEI is the increased maintenance
costs incurred by added equipment from co-generation measures. NEIs (or NEBs) can be further
distinguished as participant or societal. This paper focuses on participant NEIs, which are monetary and
non-monetary benefits (positive or negative) that the program participant experiences.
DNV KEMA Energy & Sustainability (DNV KEMA) embarked on this study to fulfill the
directive set forth by the Massachusetts State’s Department of Public Utilities to update and improve NEI
estimates for use in the PA’s 2013 to 2015 energy efficiency three-year plan and future annual plans.
2013 International Energy Program Evaluation Conference, Chicago
The plans incorporate NEIs into cost/benefit ratios as an additional source of benefits (or costs) resulting
from energy efficiency programs. The PAs also use study results to assist in program marketing.
Methodology
The NEI Study was based on survey data collected from a sample of 2010 C&I program
participants for prescriptive and custom electric and gas programs. The sample was primarily drawn
from the pool of respondents to the 2010 Massachusetts electric and gas free-ridership and spillover
study (Tetra Tech 2011). Using this pool allowed the evaluation team to examine the relationship
between program attribution and NEIs. The research then used a large scale in-depth interview (IDI)
effort to provide statistically significant NEI estimates across program type (prescriptive and custom),fuel
types (electric and gas) and measure category.
While there is a wealth of literature surrounding NEIs, there is fairly limited current NEI research
specific to C&I programs, and less specific to Massachusetts. Our approach built on the
accomplishments of two previous studies that were the most current and directly applicable to the PAs’
C&I energy efficiency programs.
(TecMarket Works 2007) used an interview-based approach to obtain self-reported non-
electric benefits for custom measure programs, separating NEIs into mutually exclusive
business impacts that may result from the installation of energy efficiency measures.
(Mosenthal & Socks 2008) provided non-electric benefits associated with prescriptive
C&I electric programs in Massachusetts using an engineering based approach. This study
estimated cost changes resulting from newly installed lighting and energy management
system (EMS) equipment, and clearly defined and documented the specific sources for
cost savings resulting from the installed measures.
The present study incorporated elements from each of these studies. Our approach used self-
reported responses to in-depth interviews to derive estimates of the same mutually exclusive NEI
categories developed by (Roth & Hall 2007). We sampled over 800 measures across prescriptive and
custom energy efficiency programs, compared to 136 custom measures (99 respondents) used in the 2007
TecMarket Works study. Energy industry experts conducted the interviews and probed responses to
identify the specific cost and revenue category impacted. Interviewers followed structured probes to
extract information to estimate NEIs, similar to the engineering based approach used in the Optimal
Energy study. These probes allowed respondents to express the NEIs in familiar terms (e.g., number of
hours saved to change light bulbs and wages) rather than asking respondents to approximate values for
abstract concepts such as the impact of energy efficiency lighting on operations and maintenance costs.
Interview guide and process
The research instrument provided interviewers with the needed flexibility while maintaining
consistency in the data collected. The NEI question battery focused on thirteen NEI categories, as
presented in Table 1 below. Questions were structured to prevent possible double counting across
categories by presenting related categories sequentially for easier respondent recall. The interviewer
protocols were designed to confirm that costs or savings included in one category were not included in
any other categories. Once interviewers determined the NEI sources, they used additional closed ended
questions to assess whether the respondent experienced an increase or decrease in each affected NEI
(e.g., an increase or decrease in operations and maintenance costs as a result of the installed measure).
2013 International Energy Program Evaluation Conference, Chicago
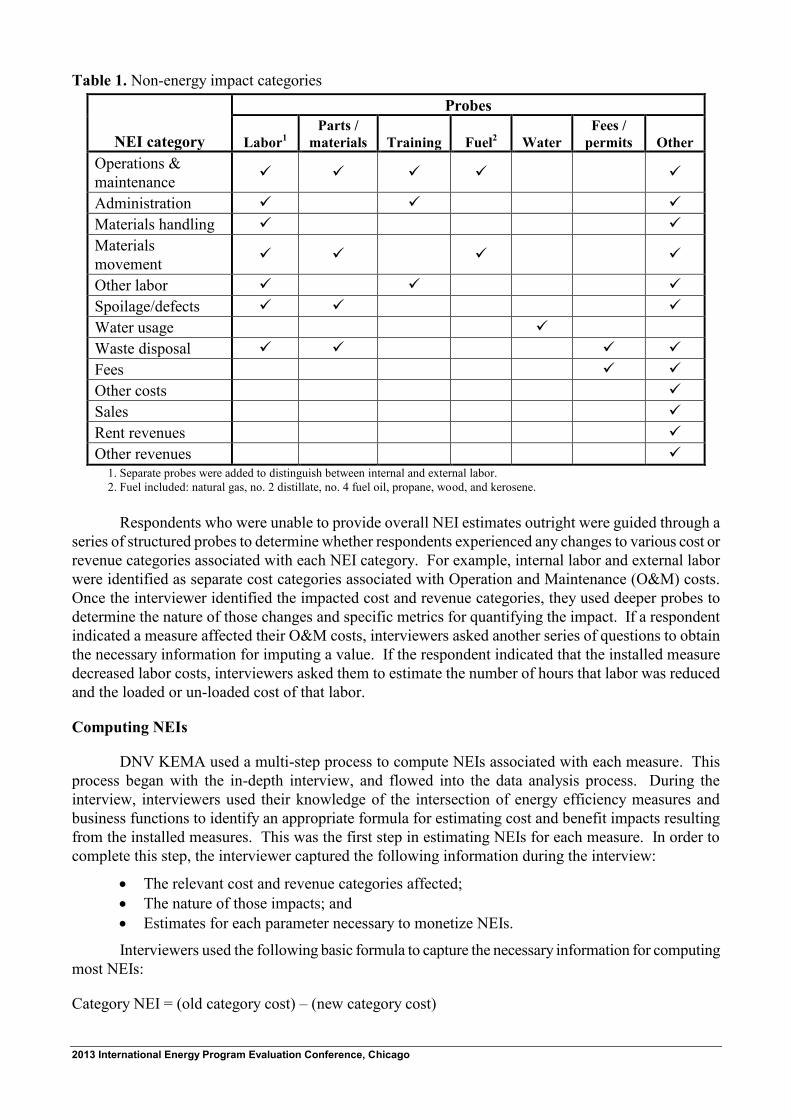
Table 1. Non-energy impact categories
NEI category
Probes
Labor1
Parts /
materials Training Fuel2 Water
Fees /
permits Other
Operations &
maintenance
Administration
Materials handling
Materials
movement
Other labor
Spoilage/defects
Water usage
Waste disposal
Fees
Other costs
Sales
Rent revenues
Other revenues 1. Separate probes were added to distinguish between internal and external labor.
2. Fuel included: natural gas, no. 2 distillate, no. 4 fuel oil, propane, wood, and kerosene.
Respondents who were unable to provide overall NEI estimates outright were guided through a
series of structured probes to determine whether respondents experienced any changes to various cost or
revenue categories associated with each NEI category. For example, internal labor and external labor
were identified as separate cost categories associated with Operation and Maintenance (O&M) costs.
Once the interviewer identified the impacted cost and revenue categories, they used deeper probes to
determine the nature of those changes and specific metrics for quantifying the impact. If a respondent
indicated a measure affected their O&M costs, interviewers asked another series of questions to obtain
the necessary information for imputing a value. If the respondent indicated that the installed measure
decreased labor costs, interviewers asked them to estimate the number of hours that labor was reduced
and the loaded or un-loaded cost of that labor.
Computing NEIs
DNV KEMA used a multi-step process to compute NEIs associated with each measure. This
process began with the in-depth interview, and flowed into the data analysis process. During the
interview, interviewers used their knowledge of the intersection of energy efficiency measures and
business functions to identify an appropriate formula for estimating cost and benefit impacts resulting
from the installed measures. This was the first step in estimating NEIs for each measure. In order to
complete this step, the interviewer captured the following information during the interview:
The relevant cost and revenue categories affected;
The nature of those impacts; and
Estimates for each parameter necessary to monetize NEIs.
Interviewers used the following basic formula to capture the necessary information for computing
most NEIs:
Category NEI = (old category cost) – (new category cost)

2013 International Energy Program Evaluation Conference, Chicago
Where
Category NEI = increase or decrease in cost for a particular NEI category
Old category cost = costs for that category prior to measure installation in 2010
New category cost = costs for that category after measure installation in 2010
A similar formula was used for changes to revenue associated with measures. Cost
reductions and revenue increases were counted as positive NEIs, and the opposites as negative NEIs.
Interviewers probed to ensure that the pre and post measure installation time periods were typical,
and adjusted if necessary. For example, if a respondent said they repaired a boiler four times per year,
interviewers then asked questions to verify the frequency of the equipment maintenance. On occasion,
the additional questions revealed that the repairs happened four times in 2009, but occurred only two
times per year in previous years. Respondents were typically able to provide such information from
memory, but occasionally referenced engineering records to confirm their responses. This information
was used to revise the initial response. This formula compared the typical year prior to and after the
measure installation, in most cases 2009 to 2011.
Data analysis and calculation of participant NEIs
Translating the qualitative interview into NEI estimates required the following multi-step process:
1. Identifying and coding cost and revenue categories affected for each NEI category –
Responses to the detailed probes for each category were re-coded to delineate the specific
cost and revenue changes resulting from the installed measures, as well as the specific
metrics used to quantify those impacts. For example, the evaluation team first determined
that internal or external O&M labor was impacted. Then they identified the direction of those
impacts, as well as the hours impacted and the respondent’s specific fully loaded wage
associated with that change.
2. Ensuring consistency across interviewers and data analysts – Responses to open ended
questions often varied across respondents. The evaluation team ensured consistency by
having a second analyst responsible for reviewing all data entered, as well as verifying and
standardizing data coding.
3. Constructing a standard set of formulas for computing NEIs –The evaluation team identified
a set of standard formulas and metrics for each cost and revenue category (i.e., the cost or
revenue items) impacted under each NEI category. Standardizing the formulas across
multiple measures allowed analysts to evaluate each in terms of the necessary metrics (e.g.,
salary, hours, price), and the range of responses to those metrics ($/hour).
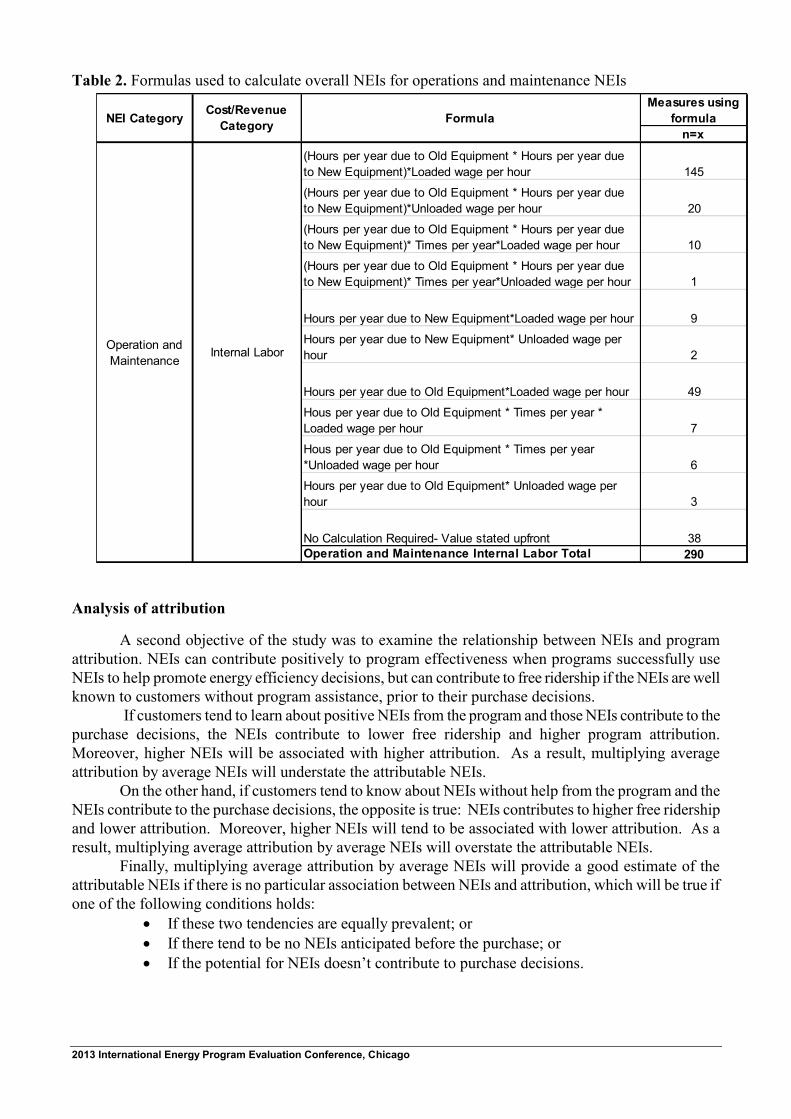
Table 2 presents the formulas used to calculate overall NEIs for operations and maintenance.
As seen in the table 38 out of 290 respondents provided operations and maintenance internal
labor NEIs outright. While not shown in the table, we found that roughly half of respondents
also were able to provide values outright across most NEI categories. The cost/revenue
category level expressed NEI questions in terms that respondents were more familiar with
than the overall NEIs or the NEI category level.
4. Identifying incomplete and incorrectly calculated NEIs – Assigning interview responses to
the standard formulas enabled data analysts to identify incomplete, incorrect, and illogical
responses.
5. Adjusting NEI estimates for replace-on-failure measures – During the quality control process,
the evaluation team realized that a number of NEIs resulted from measures that were either
replaced on failure of the existing measure or replaced a functioning measure that was
scheduled to be replaced immediately. The evaluation team determined that the portion of
the NEI associated with these measures’ “newness” was not applicable to the program
because the participant would have incurred that benefit or cost without the program. To

2013 International Energy Program Evaluation Conference, Chicago
identify replacement on failure measures, we reviewed the response categories for the timing-
related attribution questions provided from the 2010 Massachusetts electric and gas free-
ridership and spillover study, or that had been asked of the NEI study participants. Measures
for which the program had not affected the timing of installation were considered
replacements on failure. For these measures, we multiplied the estimated NEI by the percent
of the reported change that NEI interview respondents indicated was due to the measure
being new verses energy efficient
6. Identifying double counting of NEIs – By reviewing the sources of each reported NEI, their
descriptions, and metrics, the evaluation team ensured that a single effect was not counted for
multiple NEI categories, such as internal O&M labor and administrative costs.
7. Eliminating invalid NEIs - Occasionally, respondents reported NEIs that should not be
included in the analysis. For example, one respondent reported high “other revenue” resulting
from clean energy credits.The PAs’ already adjust for clean energy benefits in their benefit-
cost models. Rather than risk double counting, this benefit was excluded.
8. Imputing missing values – Approximately 40 respondents provided incomplete information
for computing one or more of the NEIs for a measure. We used the mean value of the
missing cost or revenue metric per NEI category to impute values for partial responses. This
reduced standard errors without biasing the results.
9. Computing total NEIs - The last step in the data coding and quality control phase was to
calculate total NEIs for the measure. We did this in a two-step process. First, we calculated
the ratio of NEIs per unit of savings from the sample. Then we multiplied by total savings to
estimate total NEI at the individual measure level. We used the statistical procedure of ratio
estimation to develop estimates of NEI per kWh or per therm, for electric and gas measures,
respectively. Ratio estimation extrapolates measure level NEIs to the population of
measures, allowing for direct computation of the ratio of NEI (in dollars) to reported savings
for the sample.1
1 The ratio is a combined ratio estimator, calculated as the weighted sum of NEI to the weighted sum of savings, using the
same sample points and weights for numerator and denominator.
2013 International Energy Program Evaluation Conference, Chicago
Table 2. Formulas used to calculate overall NEIs for operations and maintenance NEIs
Measures using
formula
n=x
(Hours per year due to Old Equipment * Hours per year due
to New Equipment)*Loaded wage per hour 145
(Hours per year due to Old Equipment * Hours per year due
to New Equipment)*Unloaded wage per hour 20
(Hours per year due to Old Equipment * Hours per year due
to New Equipment)* Times per year*Loaded wage per hour 10
(Hours per year due to Old Equipment * Hours per year due
to New Equipment)* Times per year*Unloaded wage per hour 1
Hours per year due to New Equipment*Loaded wage per hour 9
Hours per year due to New Equipment* Unloaded wage per
hour 2
Hours per year due to Old Equipment*Loaded wage per hour 49
Hous per year due to Old Equipment * Times per year *
Loaded wage per hour 7
Hous per year due to Old Equipment * Times per year
*Unloaded wage per hour 6
Hours per year due to Old Equipment* Unloaded wage per
hour 3
No Calculation Required- Value stated upfront 38
Operation and Maintenance Internal Labor Total 290
NEI CategoryCost/Revenue
CategoryFormula
Internal LaborOperation and
Maintenance
Analysis of attribution
A second objective of the study was to examine the relationship between NEIs and program
attribution. NEIs can contribute positively to program effectiveness when programs successfully use
NEIs to help promote energy efficiency decisions, but can contribute to free ridership if the NEIs are well
known to customers without program assistance, prior to their purchase decisions.
If customers tend to learn about positive NEIs from the program and those NEIs contribute to the
purchase decisions, the NEIs contribute to lower free ridership and higher program attribution.
Moreover, higher NEIs will be associated with higher attribution. As a result, multiplying average
attribution by average NEIs will understate the attributable NEIs.
On the other hand, if customers tend to know about NEIs without help from the program and the
NEIs contribute to the purchase decisions, the opposite is true: NEIs contributes to higher free ridership
and lower attribution. Moreover, higher NEIs will tend to be associated with lower attribution. As a
result, multiplying average attribution by average NEIs will overstate the attributable NEIs.
Finally, multiplying average attribution by average NEIs will provide a good estimate of the
attributable NEIs if there is no particular association between NEIs and attribution, which will be true if
one of the following conditions holds:
If these two tendencies are equally prevalent; or
If there tend to be no NEIs anticipated before the purchase; or
If the potential for NEIs doesn’t contribute to purchase decisions.

2013 International Energy Program Evaluation Conference, Chicago
Our study was designed to explore the relationship between NEIs and attribution by collecting
NEI data from customers for whom we also had free ridership and spillover scores. We used four
separate methods to explore the relationship between program NEIs and program attribution:
A high level comparison of overall NEI values by attribution scores;
A visual inspection of plots of NEI to energy savings ratios and attribution scores;
An examination of the correlation statistics for NEI to energy savings ratios and attribution
scores;
A comparison of 2 methods to estimate net NEIs.
The first method of calculating net NEIs is correct if there is no overall correlation between NEIs
and attribution. This is a simpler method and has been used by the PAs in the past. The second method
is appropriate whether or not there is a correlation, positive or negative, between NEIs and attribution.
This method is more complete, but also more complicated to apply.
Specifically, the first method computes the ratio of attributable NEI to gross savings by
multiplying an estimate of NEI per unit of gross savings (e.g., per kWh) by the attribution rate (both at
the measure group level). This approach is summarized in Equation 1 below, and assumes that
participants who experienced NEIs had the same overall free ridership rate as those who do not.
Equation 1. Traditional approach for computing net NEIs
Where:
NETj = Net Savings for individual measure j
Wj = Weighting factor for individual measure j used to expand from the sample to the population
NEIj = NEI study estimate of Gross NEIs for measure j
Grossj = Tracking Estimate of Gross Savings for measure j
Intersect = Number of measures included in both the NEI study and 2010 FR/SO study samples
j = Individual measure in the Intersection sample (measures that were in both the 2011 FR/SO
sample and the NEI study sample)
If free ridership rates were different for participants who experienced NEIs, then the overall
measure group free ridership rate is not the appropriate value to use for NEIs. We hypothesize that a
more accurate means of estimating net NEIs is to employ the Equation 2 below, which allows the
attribution rate for measures resulting in NEIs to differ from the overall attribution rate on savings.
2013 International Energy Program Evaluation Conference, Chicago
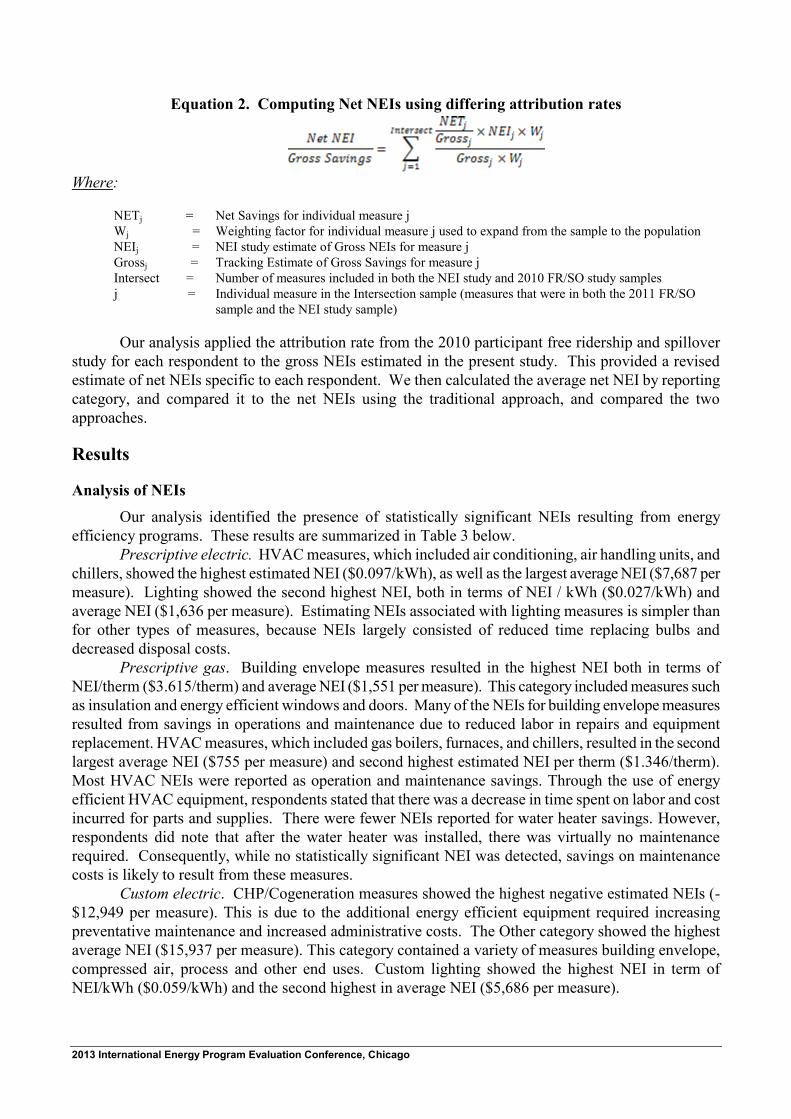
Equation 2. Computing Net NEIs using differing attribution rates
Where:
NETj = Net Savings for individual measure j
Wj = Weighting factor for individual measure j used to expand from the sample to the population
NEIj = NEI study estimate of Gross NEIs for measure j
Grossj = Tracking Estimate of Gross Savings for measure j
Intersect = Number of measures included in both the NEI study and 2010 FR/SO study samples
j = Individual measure in the Intersection sample (measures that were in both the 2011 FR/SO
sample and the NEI study sample)
Our analysis applied the attribution rate from the 2010 participant free ridership and spillover
study for each respondent to the gross NEIs estimated in the present study. This provided a revised
estimate of net NEIs specific to each respondent. We then calculated the average net NEI by reporting
category, and compared it to the net NEIs using the traditional approach, and compared the two
approaches.
Results
Analysis of NEIs
Our analysis identified the presence of statistically significant NEIs resulting from energy
efficiency programs. These results are summarized in Table 3 below.
Prescriptive electric. HVAC measures, which included air conditioning, air handling units, and
chillers, showed the highest estimated NEI ($0.097/kWh), as well as the largest average NEI ($7,687 per
measure). Lighting showed the second highest NEI, both in terms of NEI / kWh ($0.027/kWh) and
average NEI ($1,636 per measure). Estimating NEIs associated with lighting measures is simpler than
for other types of measures, because NEIs largely consisted of reduced time replacing bulbs and
decreased disposal costs.
Prescriptive gas. Building envelope measures resulted in the highest NEI both in terms of
NEI/therm ($3.615/therm) and average NEI ($1,551 per measure). This category included measures such
as insulation and energy efficient windows and doors. Many of the NEIs for building envelope measures
resulted from savings in operations and maintenance due to reduced labor in repairs and equipment
replacement. HVAC measures, which included gas boilers, furnaces, and chillers, resulted in the second
largest average NEI ($755 per measure) and second highest estimated NEI per therm ($1.346/therm).
Most HVAC NEIs were reported as operation and maintenance savings. Through the use of energy
efficient HVAC equipment, respondents stated that there was a decrease in time spent on labor and cost
incurred for parts and supplies. There were fewer NEIs reported for water heater savings. However,
respondents did note that after the water heater was installed, there was virtually no maintenance
required. Consequently, while no statistically significant NEI was detected, savings on maintenance
costs is likely to result from these measures.
Custom electric. CHP/Cogeneration measures showed the highest negative estimated NEIs (-
$12,949 per measure). This is due to the additional energy efficient equipment required increasing
preventative maintenance and increased administrative costs. The Other category showed the highest
average NEI ($15,937 per measure). This category contained a variety of measures building envelope,
compressed air, process and other end uses. Custom lighting showed the highest NEI in term of
NEI/kWh ($0.059/kWh) and the second highest in average NEI ($5,686 per measure).

2013 International Energy Program Evaluation Conference, Chicago
Custom gas. HVAC, which included measures such as boilers, furnaces, and gas chillers, showed
the highest estimated average annual NEI ($2,798 per measure). Building Envelope, which included
measures such as insulation, windows, and doors, had the second highest estimated average NEI ($922
per measure) and the second highest NEI/Therm ($0.477/Therm).
We also identified that there was a significant correlation between program energy savings and
the level of NEIs reported. The evaluation team found a strong and statistically significant correlation
between NEIs and energy savings for the following measures: prescriptive electric, custom electric and
custom gas. We also found a statistically significant correlation between NEIs and savings for
prescriptive gas, but this result was not as strong, largely resulting from the low sample size. While we
did expect to see a significant correlation between the level of savings and NEI values since larger
measures are likely to result in greater cost or revenue changes, previous studies (Roth & Hall 2007)
were unable to detect significant correlation, most likely due to a small sample size.
Table 3. Summary of average annual NEI estimates
n
Average
Annual NEI
per
Measure* NEI/kWh 90% CI Low 90% CI High Stat Sig
Precriptive
HVAC 27 7,687$ 0.0966$ 0.0544$ 0.1389$ Yes
Lighting 163 1,636$ 0.0274$ 0.0176$ 0.0372$ Yes
Motors and Drives 50 541$ 0.0043$ (0.0005)$ 0.0091$ No
Refrigeration 30 5$ 0.0013$ (0.0002)$ 0.0028$ No
Other 32 28$ 0.0039$ (0.0002)$ 0.0079$ No
Total 302 1,439$ 0.0274$ 0.0188$ 0.0360$ Yes
Custom
CHP/Cogen 6 (12,949)$ (0.0147)$ (0.0247)$ (0.0047)$ Yes
HVAC 20 5,584$ 0.0240$ 0.0003$ 0.0477$ Yes
Lighting 89 5,686$ 0.0594$ 0.0318$ 0.0871$ Yes
Motors and Drives 42 1,433$ 0.0152$ (0.0005)$ 0.0309$ No
Refrigeration 90 1,611$ 0.0474$ 0.0244$ 0.0705$ Yes
Other 29 15,937$ 0.0562$ 0.0038$ 0.1087$ Yes
Total 276 4,454$ 0.0368$ 0.0231$ 0.0506$ Yes
n
Average
Annual NEI
per
Measure** NEI/Therm 90% CI Low 90% CI High Stat Sig
Prescriptive
Building Envelope 2 1,551$ 3.6151$ 2.6418$ 4.5885$ Yes
HVAC 50 755$ 1.3464$ 0.5433$ 2.1496$ Yes
Water Heater 47 129$ 0.2604$ (0.0012)$ 0.5221$ No
Total 99 439$ 0.8344$ 0.3634$ 1.3053$ Yes
Custom
Building Envelope 46 922$ 0.4774$ 0.1258$ 0.8290$ Yes
HVAC 41 2,798$ 0.2291$ 0.1522$ 0.3060$ Yes
Water Heater 23 803$ 0.1824$ (0.4953)$ 0.8601$ No
Other 2 1,905$ 0.5253$ (5.6577)$ 6.7083$ No
Total 112 1,940$ 0.2473$ 0.1490$ 0.3455$ Yes
Electric measures
Gas measures
*Equals (NEI/kWh) x (Average annual kWh); **Equals (NEI/therm) x (Average annual therms)
2013 International Energy Program Evaluation Conference, Chicago
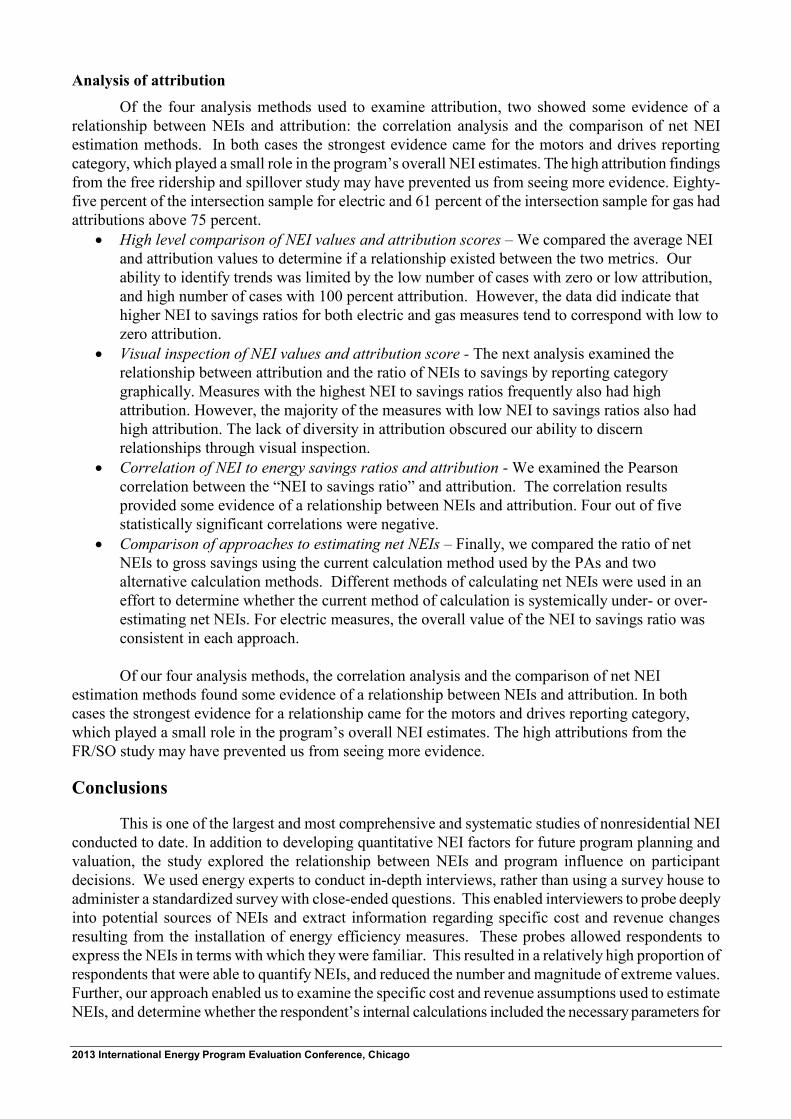
Analysis of attribution
Of the four analysis methods used to examine attribution, two showed some evidence of a
relationship between NEIs and attribution: the correlation analysis and the comparison of net NEI
estimation methods. In both cases the strongest evidence came for the motors and drives reporting
category, which played a small role in the program’s overall NEI estimates. The high attribution findings
from the free ridership and spillover study may have prevented us from seeing more evidence. Eighty-
five percent of the intersection sample for electric and 61 percent of the intersection sample for gas had
attributions above 75 percent.
High level comparison of NEI values and attribution scores – We compared the average NEI
and attribution values to determine if a relationship existed between the two metrics. Our
ability to identify trends was limited by the low number of cases with zero or low attribution,
and high number of cases with 100 percent attribution. However, the data did indicate that
higher NEI to savings ratios for both electric and gas measures tend to correspond with low to
zero attribution.
Visual inspection of NEI values and attribution score - The next analysis examined the
relationship between attribution and the ratio of NEIs to savings by reporting category
graphically. Measures with the highest NEI to savings ratios frequently also had high
attribution. However, the majority of the measures with low NEI to savings ratios also had
high attribution. The lack of diversity in attribution obscured our ability to discern
relationships through visual inspection.
Correlation of NEI to energy savings ratios and attribution - We examined the Pearson
correlation between the “NEI to savings ratio” and attribution. The correlation results
provided some evidence of a relationship between NEIs and attribution. Four out of five
statistically significant correlations were negative.
Comparison of approaches to estimating net NEIs – Finally, we compared the ratio of net
NEIs to gross savings using the current calculation method used by the PAs and two
alternative calculation methods. Different methods of calculating net NEIs were used in an
effort to determine whether the current method of calculation is systemically under- or over-
estimating net NEIs. For electric measures, the overall value of the NEI to savings ratio was
consistent in each approach.
Of our four analysis methods, the correlation analysis and the comparison of net NEI
estimation methods found some evidence of a relationship between NEIs and attribution. In both
cases the strongest evidence for a relationship came for the motors and drives reporting category,
which played a small role in the program’s overall NEI estimates. The high attributions from the
FR/SO study may have prevented us from seeing more evidence.
Conclusions
This is one of the largest and most comprehensive and systematic studies of nonresidential NEI
conducted to date. In addition to developing quantitative NEI factors for future program planning and
valuation, the study explored the relationship between NEIs and program influence on participant
decisions. We used energy experts to conduct in-depth interviews, rather than using a survey house to
administer a standardized survey with close-ended questions. This enabled interviewers to probe deeply
into potential sources of NEIs and extract information regarding specific cost and revenue changes
resulting from the installation of energy efficiency measures. These probes allowed respondents to
express the NEIs in terms with which they were familiar. This resulted in a relatively high proportion of
respondents that were able to quantify NEIs, and reduced the number and magnitude of extreme values.
Further, our approach enabled us to examine the specific cost and revenue assumptions used to estimate
NEIs, and determine whether the respondent’s internal calculations included the necessary parameters for

2013 International Energy Program Evaluation Conference, Chicago
computing cost or revenue impacts. Finally, because NEI estimates were computed from standard sets of
formulas, we were able to extend NEI estimates into future time periods by simply revising the individual
cost and revenue parameters estimates without repeating the interview process.
Our analysis clearly identified the presence of NEIs resulting from energy efficiency programs,
and significant correlations between the program savings and the level of NEIs reported. We found
statistically significant NEI per gross kWh and NEI per gross therm savings for three out of six
prescriptive electric end uses and three out of four prescriptive gas measure categories. We found
statistically significant NEI per gross kWh and NEI per gross therm savings for six out of seven custom
electric end uses and three out of five custom gas measure categories. We also found statistically
significant correlations between NEI values and gross energy savings for prescriptive and custom
electric, as well as custom gas measures. Only prescriptive gas measures did not show a statistically
significant correlation due to the relatively low sample size. Further, our analysis showed some
indication of negative correlation between the NEIs and attribution levels, but mostly for measures that
are small parts of the program. This finding does suggest that further investigation of the relationship
between attribution rates and the level of NEIs is warranted, but overall, the simple method of applying
the attribution rate on savings to NEI is sufficient for estimating net NEIs. However, it is important to
note the following study limitations:
Our research approach focused primarily on identifying annual NEIs. Consequently, the results
may under estimate NEIs associated with one-time costs or benefits.
The NEI estimates provided by this study were largely influenced by O&M cost reductions. In a
number of instances this change in O&M costs resulted from decreased repair costs associated
with the new, high efficiency (high quality) equipment. Due to the number of assumptions
required to depreciate the installed equipment and amortize the cost differential, our estimates
assumed that this cost differential occurs annually, over the life of the equipment. This may over
estimate NEIs associated with older measures. Further research is required to examine the
appropriate treatment of NEIs associated with maintenance over time.
NEIs may be under or overestimated simply due to the nature of self-report surveys. Survey
respondents were frequently able to identify NEIs, but we found that, for the same measure type,
there was variance with respect to whether respondents were aware of particular cost and revenue
changes that may occur.
There was an increased chance of self-selection bias because much of the sample consisted of
people who agreed to be interviewed twice. This was true for all of the prescriptive measures and
many of the custom measures.
The following factors may limit the applicability of NEI estimates in other jurisdictions:
Values were specific to Massachusetts customers. For example, the general cost of
labor in MA may be higher than that in a Midwestern state.
The mix of measures assumes C&I programs that are retrofits, which consisted of a
mix of early replacement and replace-on-failure measures. Additional steps should be
taken to address new construction.
The following limitations may apply to the applicability of this research to future years:
The confidence intervals reported do not correct for the 2010 population size.
Significant program changes in terms of mix of measures, or favoring early replacement
over replace on failure could make the NEI values from this study less applicable.
2013 International Energy Program Evaluation Conference, Chicago
References
DNV KEMA and Tetra Tech 2012. For definitions of the NEI categories see: “Final Report –
Commercial and Industrial Non-Energy Impacts Study.” Prepared for the Massachusetts Program
Administrators
Mosenthal, P. and Socks, M. 2008. “Non-Electric Benefits Analysis Update.” D.P.U. 09-119
Attachment AG-1-22 (j). M.Optimal Energy, Inc.
Roth, J. and Hall, N. 2007. “Non-Electric Benefits from the Custom Projects Program: A look at the
effects of custom projects in Massachusetts” Prepared for: National Grid. TecMarket Works.
Tetra Tech, 2010 Commercial and Industrial Electric Programs Free-ridership and Spillover Study:
Final Report. Prepared for the Massachusetts PAs. July 26, 2011.
Tetra Tech 2010 Commercial and Industrial Gas Programs Free-ridership and Spillover Study: Final
Report. Prepared for the Massachusetts PAs. September 20, 2011.