USING GAMIFICATION TO ENHANCE UNDERSTANDING …discovery.ucl.ac.uk/1544173/1/ZMech paper...
14
669 669 USING GAMIFICATION TO ENHANCE UNDERSTANDING OF BUILDING PERFORMANCE Panagiotis Patlakas1, Zacharias Maniadis2 & Rokia Raslan3 1 Built Environment Group, Technology School, Southampton Solent University, UK, [email protected] 2 School of Social Sciences, University of Southampton, UK, Z.M [email protected] 3 IEDE, The Bartlett, University College London, UK, [email protected] Abstract The importance of Post-Occupancy Evaluation (POE) surveys is paramount in understand- ing building performance and evaluating building technologies. However, only a small per- centage of completed buildings go through a POE. A reason is that clients and non-specialist designers often do not see the value POE can add, and consider it a specialist pursuit. This paper presents ways developed to address some of these issues. Firstly it presents a software application that was developed to visualise POE data in a 4D context. It continues by describ- ing its utilisation in a game designed to introduce students to the basic concepts of building performance and facilities management. The setup and the rules of the game are detailed, including its optimisation during the process. A pilot study and two standard workshops are described, and their results presented using both quantitative and qualitative measures. The advantages and challenges of gamification described in the literature are generally confirmed by this experiment. The paper concludes by noting the potential of novel ways of presenting building data, including 4D visualisation, in enabling more stakeholders to engage with the issue of building performance thus promoting the sustainability agenda. Keywords Post-occupancy evaluation, Visualisation, Performance gap. International Conference | Bari - Lecce, Italy Session IX
Transcript of USING GAMIFICATION TO ENHANCE UNDERSTANDING …discovery.ucl.ac.uk/1544173/1/ZMech paper...

669669
USING GAMIFICATION TO ENHANCE UNDERSTANDING OF BUILDING PERFORMANCE Panagiotis Patlakas1, Zacharias Maniadis2 & Rokia Raslan3
1 Built Environment Group, Technology School, Southampton Solent University, UK, [email protected]
2 School of Social Sciences, University of Southampton, UK, Z.M [email protected]
3 IEDE, The Bartlett, University College London, UK, [email protected]
AbstractThe importance of Post-Occupancy Evaluation (POE) surveys is paramount in understand-ing building performance and evaluating building technologies. However, only a small per-centage of completed buildings go through a POE. A reason is that clients and non-specialist designers often do not see the value POE can add, and consider it a specialist pursuit. This paper presents ways developed to address some of these issues. Firstly it presents a software application that was developed to visualise POE data in a 4D context. It continues by describ-ing its utilisation in a game designed to introduce students to the basic concepts of building performance and facilities management. The setup and the rules of the game are detailed, including its optimisation during the process. A pilot study and two standard workshops are described, and their results presented using both quantitative and qualitative measures. The advantages and challenges of gamifi cation described in the literature are generally confi rmed by this experiment. The paper concludes by noting the potential of novel ways of presenting building data, including 4D visualisation, in enabling more stakeholders to engage with the issue of building performance thus promoting the sustainability agenda.
KeywordsPost-occupancy evaluation, Visualisation, Performance gap.
International Conference | Bari - Lecce, Italy Session IX

670 ZEMCH 2015 | International Conference | Bari - Lecce, Italy
Introduction
Sustainability researchers can be confident that their discipline has never enjoyed such wide-spread attention and been assigned so much importance. The importance of the topic extends outside the Built Environment scientific and technical community, with a number of leading in-ternational policy making bodies, most notably the United Nations, placing it at the forefront (Lukan et al, 2014). This has been accompanied by a number of subsidies and other policy-making tools to support environmentally-friendly design and other pro-sustainability solutions. The issue of altering consumers’ preferences by educating them on the economic benefits of sustainable designs has attracted much less attention in the policy debate.
However, despite the generally wide support, the technical community has not always been able to deliver the intended outcomes. The term “credibility gap” was first used more than a decade ago to describe the difference between the design expectations and the actual energy use of a building (Bordass, 2004). Today this has been established as an accepted reality, with the term “performance gap” being the most common term employed to describe this phenomenon.
Issues in Environmental Design
Environmental design is meant to rely on standard iterative processes, variations of which are used in many engineering disciplines: a theoretical approach, is typically developed by research-ers, often accompanied by tests in laboratory conditions; this approach is then applied in a re-al-world building, which functions as a case study; the building is monitored to gather perfor-mance-related data, which is analysed to gauge the effectiveness of the design. This then feeds back into the theory thus helping to optimise the design and lead to further improvements.
While theoretically sound, this approach has many issues when it comes to practical application. A fundamental issue arises from modelling the proposed design itself, where the designer might make assumptions that might not be easily implemented in construction practice and building use. A further problem is associated with the simulation process itself. Most environmental rat-ing systems, such as the Building Research Establishment Environmental Assessment Method (BREEAM) and the Leadership in Energy and Environmental Design (LEED), rely on digital Building Performance Simulation tools (BPS) whose effectiveness and consistency has often shown to be problematic (Schwartz and Raslan, 2013). The problem here is twofold, on par with standard engi-neering processes. Firstly, there is the issue of the validity of the model itself, i.e. how accurately the model represents reality. Secondly, there is the issue of the verification of the, often extensive, calculation processes applied on the model.
While important, these problems are not insurmountable. Other engineering disciplines have addressed similar issues in the past: the twin issue of validation and verification appears in the vast majority of methods employed in civil and mechanical engineering. The iterative process de-scribed earlier, with the emphasis of gathering results that feed back into the theoretical analysis, aims to respond exactly to such challenges. There are, however, two key differences that differen-tiate environmental design for the built environment from other engineering endeavours.
Firstly there is the issue of user behaviour. Unlike disciplines such as structural engineering, as-sumptions made by environmental designers during the planning and design stage often differ widely from how the building is utilised once delivered and put to actual use. The precise reasons

Using gamification to enhance understanding of building performance 671
for that are unclear and often differ from case to case. Possible reasons include unrealistic as-sumptions of user behaviour, inadequate building performance, or simply users lacking an incen-tive to conform to the design assumptions (Santos Silva and Ghisi, 2014; Bourgeois et al, 2006; de Wilde and Tian, 2009; Gill et al, 2010).
A secondary reason is the relative lack of validation of the predicted design performance. While most buildings today incorporate at least some degree of pro-sustainability technologies, this is typically done on the design stage via meeting specific requirements set out in the local building regulations. Only a small percentage of completed buildings is monitored for environmental per-formance once it’s been put in use, usually when there is specific research interest. Even then, the monitoring only happens for small periods of time which might not be representative, or might be subject to a range of technical problems (Swan et al, 2015).
As such, the importance of Post-Occupancy Evaluation (POE) surveys cannot be understated. They are fundamental in closing the aforementioned loop. Menezes et al have shown how they can be used to address the performance gap (2012), while Bordass and Leaman (2005) called for POEs to become a routine part of project delivery over a decade ago. While the benefits are obvi-ous, a key barrier was identified early in environmental design research: most clients do not see a direct benefit from a POE thus creating fragmented incentives (Zimmerman and Martin, 2001). It is not difficult to appreciate why this appears so from a client’s perspective: from a strictly business perspective there is no legal requirement to conduct one and the results might show design flaws that a developer might prefer hidden.
This, however, does not justify why there is relatively limited take-up amongst architects as well as big institutional clients who commission and manage buildings for their own use. A possible fac-tor is the relative disconnect between the presentation tools architects use and the format of data gathered by data loggers, the devices that measure, record, and store parameters related to the environment for further analysis by environmental specialists. Designers work with highly visual tools (these days almost exclusively in 3D) while the output of data collected by loggers is typi-cally in a Comma Separated Values (.csv) or variations of this. Similarly, the significant amounts of data collected by loggers are not always easy to communicate to senior managers, building users, or other decision makers and stakeholders without built environment expertise.
The EnViz software application
In order to address some of these issues, a prototype software application was developed as part of a research project. The application is called EnViz (for “Environmental Visualisation” app)- vis-ualises temperature and relative humidity data in a 4D context of volumetric 3D models over time (Figure 1). The standard usability process consists of: input of a building model; input of data log-ger output; selection of timescale and time ratio; (optionally) selection of desired thermal comfort criteria. The user can then see static (3D) and dynamic (4D) visualisations of the respective data (Figure 2) based on predefined colour maps.

672 ZEMCH 2015 | International Conference | Bari - Lecce, Italy
Figure 1: Sample snapshot of the EnViz application, showing the locations of data loggers
Figure 2: Sample snapshot of the EnViz application, showing temperature of spaces
The application was developed in Java SE 7, utilising the OpenGL programming interface, as im-plemented in the Lightweight Java Game Library (LWJGL). The model input format is COLLADA, an open-source text-based format for 3D graphics, while the data logger input can be either via XML or directly via Comma Separated Values (.csv) and Microsoft Excel (.xlsx) files.

Using gamification to enhance understanding of building performance 673
Validation and Usability Testing
While the benefits of large dataset visualisation, including enhancing comprehension, enabling multi-scale evaluation, and facilitating hypothesis formation (Ware, 2012) have long been estab-lished in principle, there is little guarantee that an individual software application will achieve these aims. To validate the effectiveness of EnViz, a two-year testing programme was initiated.
Usability testing is generally viewed as an aspect of Human-Computer Interaction (HCI). A major part involves field testing with non-expert users, ideally with controlled experiments that allow the collection of both quantitative and qualitative data (Te’eni et al., 2007). A typical approach is to measure parameters such as Response Time, Response Accuracy, and Mental Effort (Huang et al., 2009).
The EnViz testing programme involved modelling and testing three different examples of differ-ent scales and building typologies. The usability testing was in the form of eight workshops with a total of 89 participants which took place in three venues in the UK and Mexico. The Response Accuracy of the participants was measured directly while the Mental Effort was gauged indirect-ly via user self-reporting in questionnaires. In these experiment, participants had increased Re-sponse Accuracy when using EnViz compared to the traditional spreadsheet form (despite the users not having used the application before), while there was a clear preference in using the application to examine the data, as opposed to using Excel. The results were documented exten-sively in a journal paper (Patlakas et al, 2014).
Gamification in the Built Environment
Gamification, defined here as using a game-like format to achieve a target outside pure enter-tainment, diversion, or leisure, has seen a rapid increase in application the past few years. An extensive survey by Hamari et al (2014) found it being applied in various fields such as commerce, health/exercise, business, data gathering, and innovation. In the Built Environment, sustainable energy use has been a focus as described by Gustafsson et al (2009) and Coen et al (2013). Unsur-prisingly, education has been a major field of application of gamification with a wide variety of techniques utilised for this purpose; according the Kapp (2012) the research consensus is largely that appropriately-designed games can be beneficial as learning tools for both games and adults.
Designing a Built Environment Game: Pilot Study
Huang and Soman (2013) have identified a five step process to applying gamification in an educa-tional setting. The authors designed a game using this five step process. Specifically:
1. Understand the Target Audience and the ContextThe game was targeted at undergraduate university students. The core target audience was first- or second-year students in Built Environment programmes, with a secondary audience of stu-dents at higher levels and, potentially, neighbouring disciplines.
2. Defining Learning ObjectivesThe aim was two-fold: firstly, to provide students with an introduction to concepts of POE, envi-ronmental design, and facilities management in an entertaining and engaging way.Secondly, to compare the student engagement and performance when using a spreadsheet-based

674 ZEMCH 2015 | International Conference | Bari - Lecce, Italy
system (as typically employed by professionals engaged in POE) and when using a 4D based ap-proach (the EnViz software).
3. Structuring the experienceStudents were firstly introduced to fundamental POE concepts in a 30’ seminar. This was followed by a quick 10-15’ demonstration of the EnViz software with a trial model (all students were familiar with Excel). Then the rules of the game were explained. This was followed by the core gaming activity. Finally, students were asked to complete a questionnaire providing feedback on the two types of activities.
4. Identifying resourcesIt was decided that the game should require only a standard PC per student, either at a university computer lab or with students using their own machines. The only additional resources required were standard stationery.
5. Applying Gamification ElementsThe game was point-based, devised around a hypothetical scenario, of a simplified real-life prob-lem. Students were provided with sketches of floor plans of a real-world building (Figure 3). They were also provided with POE data in two formats: in the first half of the game, they were given Excel files with the source data. In the second half, they were provided with the EnViz software with appropriate source files.
Figure 3: Visualisation of the building used in the game.
The scenario assumed that the given building was found to be problematic in a number of ar-eas. A POE survey was commissioned, in all the areas that were supposed to fail in achieving the standard temperature and/or relative humidity criteria for thermal comfort identified by the Chartered Institute of Building Services Engineers (CIBSE).

Using gamification to enhance understanding of building performance 675
The students were given the role of a facilities manager whose aim is to “fix” different areas of the building in the best possible way, within the costraints of an allocated budget.
The rules of the game were:• The budget was approximately a quarter of what would be required to fix the entire building,
and hence the students were required to prioritise the areas with the greatest percentage of failure. The students were awarded points based on the percentage of actual failure of an area. For example, if they decided to fix an area that failed to reach the required temperature 75% of the time, they would be awarded 75 points.
• The cost to fix each area was proportional to its surface (based on area categorisations), and the points awarded were also similarly proportional (if an area was four times as large as the base area category, and it failed 75% of the time, the student would be awarded 75 x 4 = 300 points). Effectively, the requirement of the game was for students to identify which areas per-formed worse, and prioritise them accordingly.
• In the pilot study, areas were also given “importance” coefficients based on their use. So, corri-dors were awarded a multiplier of 0.1 (10% of points), secondary spaces a multiplier of 0.5 (50% points) and office spaces and classrooms a multiplied of 0.5.
• Penalty points were applied to students who went over budget that negated any benefit from breaking the rule.
The total sum of the points followed the equation below:
P = i x a x F
where: P is the points awarded i is the importance of the area (0.0 to 1.0) α is the area factor (1 to 8) F is the failure rate of the space (0 to 100)
The workshop was part of a taught module. As an incentive to commit to the game, the student that won the most points would be given additional marks in a related summative assignment for the module.
Pilot Workshop Results and Redesign
A pilot workshop was run at a UK University with 8 first-year students enrolled on a BA in Archi-tectural Technology programme. The students executed both parts of the game and completed a questionnaire with their views.
The results of the pilot workshop were inconclusive. When using EnViz, students performed gen-erally better, however, in both cases most students were heavily penalised for going over budget. Also, some students appeared to ignore completely the importance factor of a space and concen-trated on circulation spaces. Thus it was difficult to gauge how effective each method was with regard to response time.
Qualitative feed provided via questionnaires and informal chats after the experiment generally suggested that the students preferred to work with the 3D model than with spreadsheets (de-

676 ZEMCH 2015 | International Conference | Bari - Lecce, Italy
spite the students reporting a greater familiarity with Excel than 3D tools before the experiment).
Following the pilot study, a number of decisions were taken:
• the game was simplified removing the coefficient of the importance of a space. All spaces were given equal importance with regard to points.
• an interactive system was built for logging the points (Figure 4). With this, the students could see immediately the area factor of a space, and the cost effects the space had. Thus no student would now be over budget.
Figure 4: Snapshot of the interactive game environment given to the students
Second and Third Workshops
Two workshops were run with the new design. The first took place with a cohort of 12 students enrolled on an Environmental Design and Engineering Masters programme at a second UK Uni-versity. As this group had already taken a semester-long module covering POE and while outside the core target group, it was decided that it would be interesting to gauge if they performed differently, as a benchmark exercise
As the voluntary workshop took place outside a taught module, the incentives for committing to the game were therefore lower. The top three students would have their scores published on the virtual learning environment of the related module. Potentially due to the low incentives to com-mit to the game, some students did not complete one of the components, did not engage fully, or broke the core rules (e.g. collaborated on one or more activities). All students were nevertheless allowed to remain for the entire duration as the educational component was considered more important than strict enforcement of the rules.
Among those who completed both components according to the rules, there was a marginally better performance when using EnViz, of approximately 7.5% when comparing averages (Figure

Using gamifi cation to enhance understanding of building performance 677
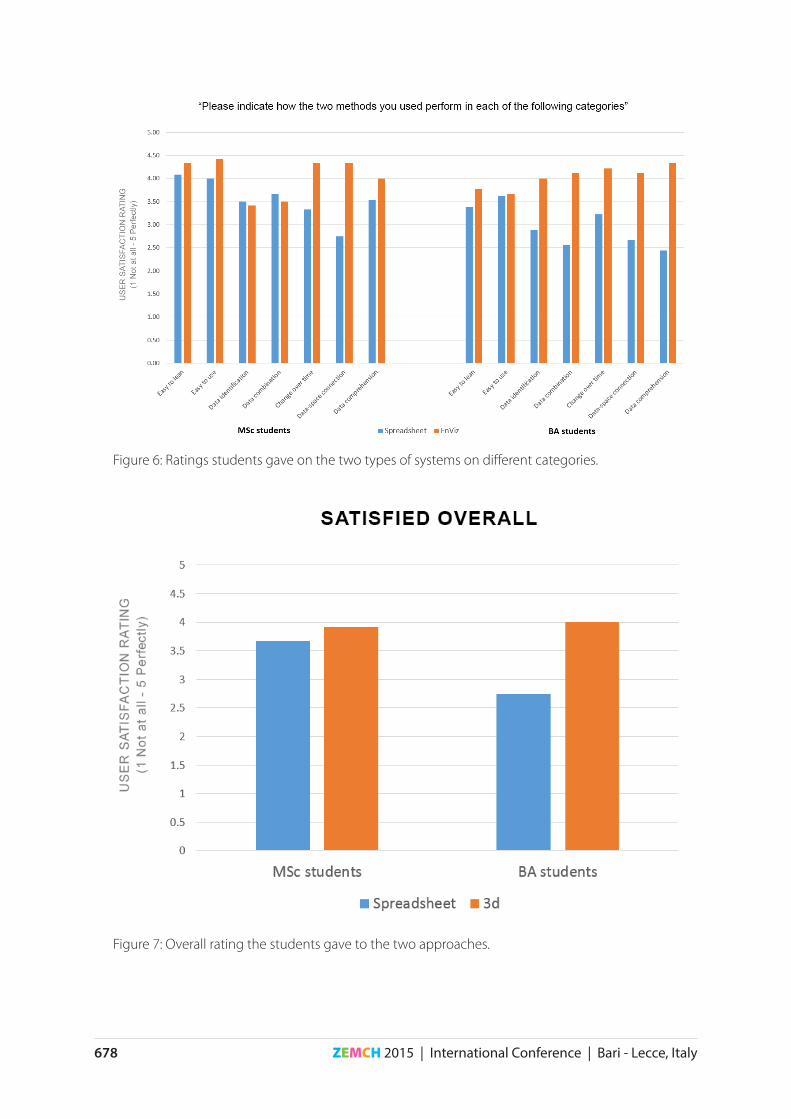
5). Qualitatively, students rated EnViz as a preferred method of work in most categories (Figures 6 and 7). The students were asked to rate the two approaches in the following categories:
• Easy to learn• Easy to use• Allows me to identify the required data easily• Allows me to combine diff erent information easily• Allows me to evaluate the change over time easily• Helps me understand how the data is connected to the space• Helps me appreciate what is actually going on in the building
Finally there was a separate entry indicated as “Satisfi ed Overall”.
The scale was 1 to 5, with 1 being the most negative and 5 the most positive.
Figure 5: Points scored by each student group (Average with Standard Deviation)
678 ZEMCH 2015 | International Conference | Bari - Lecce, Italy
Figure 6: Ratings students gave on the two types of systems on different categories.
Figure 7: Overall rating the students gave to the two approaches.

Using gamification to enhance understanding of building performance 679
A third workshop was run with a cohort of 9 core target audience BA students (first year Architec-tural Technology) and the same brief as the second workshop. Issues of engagement with learn-ing the software reflected on the results, with two students not completing one or both tasks, while three more scored very low when using EnViz suggesting that they did not engage with learning the software (something visible during the workshop). As a result the average scores of the students when using EnViz were significantly lower (33%) (Figure 5). As before, all students were more familiar with Excel than 3D modelling. However, when it came to evaluating the two applications, all students rated EnViz more highly than the spreadsheet-based method, while they found that it allowed them to work better in all aspects (Figures 6 and 7). It should be not-ed that these opinions were expressed anonymously, in order to allow students to express their views candidly.
From a teaching perspective, while there were issues with engagement in learning the software, which affected performance, as discussed above, it is important to note that most students ap-peared to enjoy the activity. The undergraduate students that completed these workshops as part of a taught module appeared to have a better grasp of POE compared to students from previous years, as evidenced in end-of-year assessments. They have also talked favourably about the activity in informal discussions during the year. As the sample is very small, and the results of the POE segment fall within a greater report, a quantitative study was judged to be of little importance and benefit.
Conclusions
This paper presented a game devised to allow undergraduate students to understand better is-sues relating to building performance, POE surveys, and facilities management. The experiment demonstrated both the advantages and challenges of gamification, in agreement with the expe-riences reported in the literature. The main advantage of the game approach appeared to be a generally greater interest from the students in the topic. It is characteristic that most students en-gaged for a 90’ period in a topic which, when delivered in seminar form in previous years, did not appear to hold equal interest. The event also appeared to be more memorable to the students, probably due to the difference in format from the more standardised learning and teaching activ-ities they covered in the rest of the year.
At the same time, gamification is not a panacea. The game needs to be carefully structured to avoid overloading the students with information (as in the pilot study), and be entertaining and intuitive while still enabling students to achieve the learning objectives. Finally, while gamifica-tion did appear to lead to greater engagement, students still need appropriate incentives to com-mit fully and can be strategic in their choice of engagement with a topic.
The second aim of the experiment, to allow comparison between the spreadsheet-based and the 3d visualisation methods, was only partially achieved. The small sample, the different student profiles, and the different levels of engagement meant that the results were different and with significant standard deviation. Thus, Workshops 1 and 2 seemed to largely follow the results of the more rigorous surveys. Workshop 3, however, showed that most students did not engage with the visualisation software sufficiently to enable direct comparison. This is to be expected to an extent; despite the conversation of the so-called “digital natives” in recent years, software fatigue appears to be a phenomenon across almost all age brackets.

680 ZEMCH 2015 | International Conference | Bari - Lecce, Italy
It is interesting, however, that all students preferred working with the 3d visualisation method, irrespective of their degree of attainment, which also agrees with previous studies. This suggests that there are potentially significant benefits in visualising large datasets from buildings in crea-tive and innovative ways, enabling non-specialists to engage with them more easily. If the aspi-ration of POE studies becoming a standard part of the building process is going to be realised, its outputs should be easily communicable and comprehensible by all stakeholders, and not just the domain of specialist practitioners.
Our overarching objective is to examine whether 3d visualization improves the quality of deci-sions that influence environmental properties of buildings. In future work we aim to examine the effects of gamification when some methodologies from behavioural disciplines such as ex-perimental economics are introduced. In particular, offering financial incentives for good per-formance could increase cognitive effort and improve commitment to the game. Furthermore, ensuring a sufficient power of the experimental design by increasing the sample sizes will allow for formal statistical analysis.
Informing educated consumer choice with regard to sustainable housing should be a key com-ponent to policies aimed at promoting the mass consumption of affordable sustainable homes. POE data capture environmental properties that can be used for informing the choice of deci-sion-makers, including consumers.
References
BORDASS, B., 2004, ‘Energy Performance of Non-Domestic Buildings: Closing the Credibility Gap’, In Proceedings of the 2004 Improving Energy Efficiency of Commercial Buildings Conference, Frankfurt, Germany.
BORDASS, B., and LEAMAN, A., 2005, ‘Making feedback and post-occupancy evaluation routine 1: A portfolio of feed-back techniques.’ Building Research & Information, 33(4), pp. 347-352.
BOURGEOIS, D., REINHART, C., and MACDONALD, I., 2006. ‘Adding Advanced Behavioural Models in Whole Building Energy Simulation: A Study on the Total Energy Impact of Manual and Automated Lighting Control’. Energy and Buildings 38, pp. 814–823.
COHEN, I., TURRIN, M., HEINZELMANN, F., and WELZNER, I., 2013, ‘The Human Factor–Introducing Game Mechanics to Computerized Home Automation Systems.’ In Proceedings of eCAADe 2013, Delft, The Netherlands.
DE WILDE, P., and TIAN, W., 2009. ‘Identification of key factors for uncertainty in the prediction of the thermal perfor-mance of an office building under climate change.’ Building Simulation 2, pp. 157–174.
GILL, Z.M., TIERNEY, M.J., PEGG, I.M., and ALLAN, N., 2010, ‘Low-energy dwellings: the contribution of behaviours to actual performance.’ Building Research & Information 38, pp. 491–508.
GUSTAFSSON, A., KATZEFF, C., and BANG, M., 2009, ‘Evaluation of a pervasive game for domestic energy engagement among teenagers.’ Computers in Entertainment (CIE), 7(4), pp.54:1-54:19.
HAMARI, J., KOIVISTO, J., and SARSA, H., 2014, ‘Does gamification work?--a literature review of empirical studies on gamification.’ In 47th Hawaii International Conference on System Sciences (HICSS), Hawaii, USA.
HUANG, W., EADES, P. and HONG, S.H., 2009, ‘Measuring effectiveness of graph visualisations: A cognitive load per-spective,’ Information Visualisation 8(3), pp. 139–152.
HSIN-YUAN HUANG, W., and SOMAN, D., 2013, A Practitioner’s Guide to Gamification of Education. Research Report Series Behavioural Economics in Action. <http://inside.rotman.utoronto.ca/behaviouraleconomicsinaction/files/2013/09/GuideGamificationEducationDec2013.pdf> retrieved on July 14, 2015.
KAPP, K. M., 2012, The gamification of learning and instruction: game-based methods and strategies for training and education. John Wiley & Sons, San Francisco, USA.
LUCON O., D. ÜRGE-VORSATZ, A. ZAIN AHMED, H. AKBARI, P. BERTOLDI, L.F. CABEZA, N. EYRE, A. GADGIL, L.D.D. HAR-VEY, Y. JIANG, E. LIPHOTO, S. MIRASGEDIS, S. MURAKAMI, J. PARIKH, C. PYKE, AND M.V. VILARIÑO, 2014: ‘Buildings.’ In: Climate Change 2014: Mitigation of Climate Change. Contribution of Working Group III to the Fifth Assessment

Using gamification to enhance understanding of building performance 681
Report of the Intergovernmental Panel on Climate Change. Cambridge University Press, Cambridge, United King-dom and New York, NY, USA.
MENEZES, A. C., CRIPPS, A., BOUCHLAGHEM, D., and BUSWELL, R., 2012, ‘Predicted vs. actual energy performance of non-domestic buildings: Using post-occupancy evaluation data to reduce the performance gap.’ Applied Energy, 97, pp. 355-364.
PATLAKAS, P., SANTACRUZ, H. B. and ALTAN, H., 2014, ‘Visualising the environmental conditions of buildings’ Proceed-ings of the ICE-Civil Engineering, 167(5), pp. 56-64.
SANTOS SILVA,A and GHISI,E, 2014, ‘Uncertainty analysis of user behaviour and physical parameters in residential building performance simulation.’ Energy and Buildings, 76, pp. 381-391.
SCHWARTZ, Y., and RASLAN, R., 2013, ‘Variations in results of building energy simulation tools, and their impact on BREEAM and LEED ratings: A case study.’ Energy and Buildings, 62, pp. 350-359.
SWAN, W., FITTON, R., and BROWN, P., 2015, ‘A UK practitioner view of domestic energy performance measurement.’ Proceedings of the ICE - Engineering Sustainability, 168(3), pp. 140-147.
TE’ENI, D., CAREY, J. and ZHANG, P., 2007, Human Computer Interaction: Developing
Effective Organisational Information Systems, Wiley, Hoboken, NJ, USA.
WARE, C., 2012, Information visualization: perception for design. Elsevier, Waltham, MA, USA.
ZIMMERMAN, A., and MARTIN, M., 2001, ‘Post-occupancy evaluation: benefits and barriers.’ Building Research & Infor-mation, 29(2), pp. 168-174.