Using Big Data to Predict Infant Mortality in Allegheny ... · University of Pittsburgh 2016(c) | 1...
25
University of Pittsburgh 2016(c) | 1 Using Big Data to Predict Infant Mortality in Allegheny County, Pennsylvania Fuchiang (Rich) Tsui, PhD. Associate Professor of Biomedical Informatics, Intelligent Systems Prog., Bioengineering Department of Biomedical Informatics University of Pittsburgh July 31, 2017 www.Tsuilab.com ©Photograph by Rich Tsui 56 th NAWRS Workshop
Transcript of Using Big Data to Predict Infant Mortality in Allegheny ... · University of Pittsburgh 2016(c) | 1...

University of Pittsburgh 2016(c) | 1
Using Big Data to Predict Infant Mortality in Allegheny County, Pennsylvania
Fuchiang (Rich) Tsui, PhD. Associate Professor of Biomedical Informatics, Intelligent Systems Prog., Bioengineering Department of Biomedical Informatics University of Pittsburgh July 31, 2017
www.Tsuilab.com
©Photograph by Rich Tsui
56th NAWRS Workshop

University of Pittsburgh 2016(c) | 2
Disclosures
• Inventor System for Hospital Adaptive Readmission Prediction and management (SHARP)
• Funder & Consultant: General Biodefense, LLC • Funding support: RK Mellon Foundation, NIH, Coulter foundation,
Innovation Works, Local foundation in Pittsburgh, Children’s Hospital of Pittsburgh of UPMC
• Fan of learning health system, clinical/public health informatics, machine learning, big data science
www.Tsuilab.com

University of Pittsburgh 2016(c) | 3
Outline • Background
– Problem – Project Vision – Data collaborators
• Project approach and Current progress – Predictive modeling concept – Data collection and integration – Pilot study: MOMI data analysis and results
• Discussion and Conclusion
www.Tsuilab.com

University of Pittsburgh 2016(c) | 4
Problem
www.Tsuilab.com

University of Pittsburgh 2016(c) | 5
Current Approaches and Limitations for Infant Mortality Prediction
• Use of a handful of risk factors from a specific domain of data (e.g., demographics, social services, etc)
• Ad-hoc selection of risk factors for predictive modeling • Lack of data merging or linking from multiple sources • Lack of translation of research into practice to increase clinical
impact
www.Tsuilab.com

University of Pittsburgh 2016(c) | 6 www.Tsuilab.com
Apr. 11, 2017

University of Pittsburgh 2016(c) | 7
Project Vision • Background
– Between 2008 and 2012, 434 infants died within their first year of life in Allegheny County out of more than 65,310 births
– Allegheny County’s infant mortality rate of 6.65 deaths per 1,000 live births is higher than the national average*
– Racial disparity in infant mortality is 27 percent larger in Allegheny County than nationally despite a robust health and social services network
• Goal To accurately identify infant mortality risk using a real-time, adaptive, predictive model and reduce that risk through referrals to an optimized and personalized mix of health, social service, and community prevention strategies.
*: www.post-gazette.com/news/health/2016/03/29/Infant-death-rates-going-down-in-Allegheny-County-some-problems-persist/stories/201603080001

University of Pittsburgh 2016(c) | 8
Data Collaborators • Allegheny County Department of Human Services (DHS)
– program services data • Allegheny County Health Department (ACHD)
– Birth and death certificates • Magee Women’s Research Institute (MWRI)
– The Magee Obstetric Medical and Infant (MOMI) • University of Pittsburgh Medical Center (UPMC)
– Electronic health records (labs, meds, demographics, etc) • Healthy Start [in progress] • Birth Circle [in progress] • …

University of Pittsburgh 2016(c) | 9
Outline • Background • Project approach and Current progress
– Predictive modeling concept – Data collection and integration – Pilot study: MOMI data analysis and results
• Discussion and Conclusion
www.Tsuilab.com

University of Pittsburgh 2016(c) | 10
Overall Project Approach
• Phase 1 (2016 - 2018) – Data collection and integration (DHS, ACHD, MWRI, UPMC) – Predictive system development: Use historical data to develop a real-
time, adaptive, predictive model of infant mortality risk – Feasibility study: Assess implementation challenges for the system – Prevention strategies: Identify effective interventions for the underlying
causes of infant mortality based on the identified risks (by RAND Corp.) • Phase 2 (from late 2018)
– Implementation of the predictive and intervention system in a clinic, embedded in an existing EHR system
– Prospective evaluation
www.Tsuilab.com

University of Pittsburgh 2016(c) | 11
Predictive Modeling from (Big) Data
Machine Learning
EHR Data
Behavior Data Social Network Data
Environment Data
Image/Video Data
Mobile/Sensor Data
Weather Data
Social Services Data
C
A B
D F E
…. ….
Predictive Model
Predictions
P(Infant Mortality|Data) =0.9
www.Tsuilab.com
Multi data sources
Data integration & de-identification

University of Pittsburgh 2016(c) | 12
Clinical EHR Data
Social Context
Infant Mortality Predictive Modeling
Behavioral Data
C
A B
D F E ….
….
- P(Mortality | Data) - Median survival time
. . .
Bayesian network
Predictive Model: Mortality Risk and Survival Time
• Age • Race • Pre-term
labor • Congenital
anomalies • Labs • Meds • ….
• Divorce • Mom education level • Bankruptcy • …
• Breastfeeding • Drug abuse • Alcoholic • …
Environment Data • Air quality • Water • Lead • …
Collaboration with ACHD, DHS, MWRI, and RAND Corp
Available in narrative reports (progress notes, social work
reports, etc)
Structured data

University of Pittsburgh 2016(c) | 13
Why Natural Language Processing?
As much as 80% of clinical data are locked in narrative free-text reports*
www.Tsuilab.com
Freetext report Freetext
report Freetext report
*: Kho AN, Rasmussen LV, et al., Practical challenges in integrating genomic data into the electronic health record, Genet Med. 2013 Oct; 15(10): 772–778. PMCID: PMC4201621

University of Pittsburgh 2016(c) | 14
Outline • Background • Project approach and Current progress
– Predictive modeling concept – Data collection and integration – Pilot study: MOMI data analysis and results
• Discussion and Conclusion
www.Tsuilab.com

University of Pittsburgh 2016(c) | 15
Record integration across multiple data sources
Performed by an Honest Data Broker

University of Pittsburgh 2016(c) | 16
60,903
UPMC (MARS) ACHD/DHS
MWRI (MOMI)
Data Source
# of Unique Moms
Matched count (%)
MOMI 85,477 60,903 (71.25%)
ACHD/DHS 140,663 60,903 (43.30%)
Mother entities fully linked across the three data sources
Mother Entity Matching

University of Pittsburgh 2016(c) | 17
Outline • Background • Project approach and Current progress
– Predictive modeling concept – Data collection and integration – Pilot study: MOMI data analysis and results
• Discussion and Conclusion
www.Tsuilab.com

University of Pittsburgh 2016(c) | 18
Education (level, years), Maternal drug abuse, Smoking, Depression, Drinks/week, Marital status,..
MOMI Data Quality Analysis
www.Tsuilab.com
• Comprising 251 variables from (parents, infant) demographics, diseases, mom’s behavioral history (14 variables), healthcare utilization, etc from 2003 to 2013
• Data quality analysis – Completeness: check missing values prevalence, e.g., 0.5% (636) with
missing mom’s SSN – Validity: variable’s value range profile, e.g., – Consistency: compare derived variables with original variables (e.g.,
teenage_mom_flag is False but mom_age <20) – Redundancy: test duplicates to avoid bias
Pregnancy weeks histogram

University of Pittsburgh 2016(c) | 19
MOMI Risk Factor Analysis
www.Tsuilab.com
• Univariate logistic regression with adjusted p-values
• l𝑛 𝑃(𝑌=1)1−𝑃 𝑌=1
= 𝛽0 + 𝑋𝛽1, where 𝛽0 and 𝛽1 are regression coefficients
• Use Benjamini & Hochberg (BH) method to control false discover rate (FDR) at 0.05

University of Pittsburgh 2016(c) | 20
Significant Risk Factors: Demographics
www.Tsuilab.com
Risk factors Group v.s. reference group Odds ratio (95% CI)
Adjusted P-value
Maternal age ≤ 26 vs. >26 2.0498 (1.7177, 2.4466) <0.0001 Maternal education High school or below vs. college
education 2.6788 (2.1738, 3.3118) <0.0001
Graduate school vs. college education
0.6676 (0.4564, 0.9508)
Unknown vs. college education 4.6675 (3.5771, 6.0604) Maternal marital status at delivery Singe vs. married 3.5602 (2.9391, 4.3334) <0.0001
Divorced, widowed, life partner, separated or committed relationship vs. married
2.3781 (1.1702, 4.2863)
Unknown, vs. married 1.2049 (0.2970, 3.1817) Maternal race African American vs. Caucasian 4.0065 (3.3481, 4.7946) <0.0001
Native American, Hispanic, Asian, Mixed and other vs. Caucasian
2.1287 (0.9623, 4.0304)
Unknown vs. Caucasian 0.7012 (0.2764, 1.4407)
University of Pittsburgh 2016(c) | 21
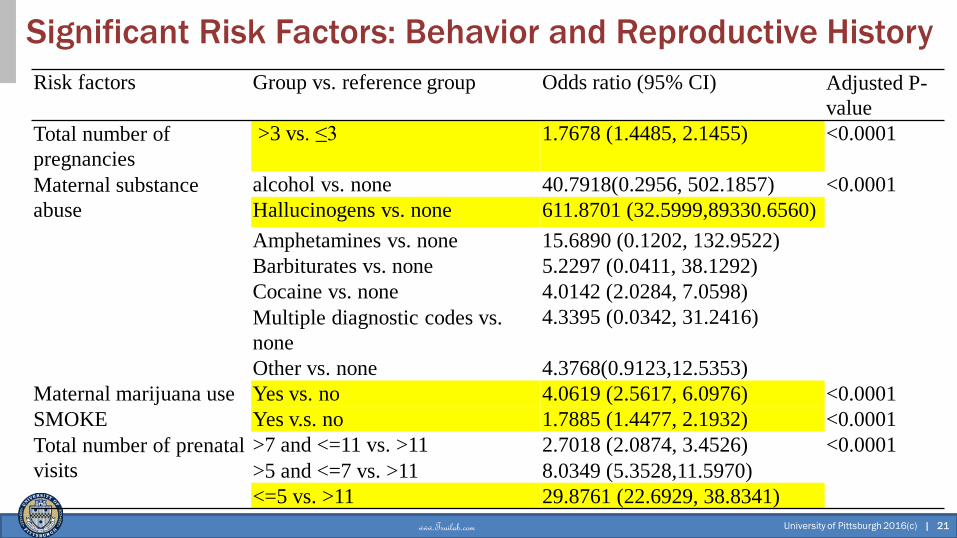
Significant Risk Factors: Behavior and Reproductive History
www.Tsuilab.com
Risk factors Group vs. reference group Odds ratio (95% CI) Adjusted P-value
Total number of pregnancies
>3 vs. ≤3 1.7678 (1.4485, 2.1455) <0.0001
Maternal substance abuse
alcohol vs. none 40.7918(0.2956, 502.1857) <0.0001 Hallucinogens vs. none 611.8701 (32.5999,89330.6560) Amphetamines vs. none 15.6890 (0.1202, 132.9522) Barbiturates vs. none 5.2297 (0.0411, 38.1292) Cocaine vs. none 4.0142 (2.0284, 7.0598) Multiple diagnostic codes vs. none
4.3395 (0.0342, 31.2416)
Other vs. none 4.3768(0.9123,12.5353) Maternal marijuana use Yes vs. no 4.0619 (2.5617, 6.0976) <0.0001 SMOKE Yes v.s. no 1.7885 (1.4477, 2.1932) <0.0001 Total number of prenatal visits
>7 and <=11 vs. >11 2.7018 (2.0874, 3.4526) <0.0001 >5 and <=7 vs. >11 8.0349 (5.3528,11.5970) <=5 vs. >11 29.8761 (22.6929, 38.8341)

University of Pittsburgh 2016(c) | 22
Outline • Background • Project approach and Current progress
– Predictive modeling concept – Data collection and integration – Pilot study: MOMI data analysis and results
• Discussion and Conclusion
www.Tsuilab.com

University of Pittsburgh 2016(c) | 23
• Verified MOMI data and identified individual risk factors from MOMI dataset that are also reflected in literatures
• Using multiple linked data sources enables comprehensive research on infant mortality
• Univariate non-ad-hoc analysis is a necessary step for building predictive modeling
• Limitation: the use of a portion of AC infant deaths from MWRI data (~50% infant delivery coverage)
• Next steps: build a predictive model from all data sources, add intervention strategies, and conduct feasibility assessment
Discussion and Conclusion

University of Pittsburgh 2016(c) | 24
Acknowledgements
www.Tsuilab.com
Jose Posada, Amie Barda, Victor Ruiz, Ye Ye Helen Shi, Fan Mi, Diyang Xue, Howard Su Luge Yang, PhD
Funding source: Richard King Mellon Foundation
• 3 FTE • 1 Postdoc fellow • 6 PhD Students in
• DBMI(3) • ISP(2) • Bioeng.(1)