
Use of QFD & Tehnology Road Mapping to Develop a Mobile ...
25
Presented at the 20 th International QFD Symposium, Santa Fe, New Mexico, 24 th October 2008 © QFD Institute Use of QFD & Technology Road Mapping to Develop a Mobile Data Collection System Authors: Dr Kim Stansfield, Programme Manager, CSC Computer Sciences Ltd. Jeff Cole, Security Architect, CSC Computer Sciences Ltd. Abstract: The work described in this paper considers the systems engineering procedures used to select and design a ‘mobile data collection’ sub-system of a larger Enterprise Application Development project for a UK Government Client. The work was conducted by the authors under contract to a system integrator in the UK. The paper describes how the authors systematically analysed the requirements of the stakeholders for the mobile subsystem using SIPOC and QFD Analysis, and how the solution was identified using a Technology Road Map such that it met all of the requirements, unlike the solution tentatively proposed by the client. In addition the hardware costs of the final solution were considerably lower to the delight of the customer. Keywords: QFD; Technology Road Maps; Systems Engineering; Requirements Management; Concept Selection; Functional and Physical Architectures; Mobile Data Collection Devices; Case Management Systems; Conflict Resolution; Programme Design; Risk Management; DSDM. Acknowledgement: The authors are indebted to the support of Mr. Lukuba Chanji, our colleague during this project who carried out much research on the mobile devices considered herein. He also provided vital inputs in the voice of the customer workshops and played a major part in the mobile device component design and systems engineering work that this work led towards. 1 Project Aims and Approach 1.1 Project Aims The paper describes a sub-project to identify mobile devices to support a larger program to develop a case management system application running in the customer’s enterprise architecture system. The case management application would be used to marshal the information gathered at incident scenes in the field, and provide tracking of this information and the way it is analysed through to collation of the resulting information in its final reporting. A critical aspect addressed by the sub-project was to identify mobile devices that allow ‘field operators’ to systematically log material found ‘in-the-field’ such that all subsequent results of treatment and analysis could be linked to the item in an auditable manner. The customer required that the system integrator identify suitable devices meeting the requirements of the various customer stake-holders, and recommend the best fit, preferably a single device. Page 1 of 25
Transcript of Use of QFD & Tehnology Road Mapping to Develop a Mobile ...

Presented at the 20th International QFD Symposium, Santa Fe, New Mexico, 24th October 2008 © QFD Institute
Use of QFD & Technology Road Mapping to Develop a Mobile Data Collection System
Authors: Dr Kim Stansfield, Programme Manager, CSC Computer Sciences Ltd. Jeff Cole, Security Architect, CSC Computer Sciences Ltd.
Abstract: The work described in this paper considers the systems engineering procedures used to select and design a ‘mobile data collection’ sub-system of a larger Enterprise Application Development project for a UK Government Client. The work was conducted by the authors under contract to a system integrator in the UK. The paper describes how the authors systematically analysed the requirements of the stakeholders for the mobile subsystem using SIPOC and QFD Analysis, and how the solution was identified using a Technology Road Map such that it met all of the requirements, unlike the solution tentatively proposed by the client. In addition the hardware costs of the final solution were considerably lower to the delight of the customer.
Keywords: QFD; Technology Road Maps; Systems Engineering; Requirements Management; Concept Selection; Functional and Physical Architectures; Mobile Data Collection Devices; Case Management Systems; Conflict Resolution; Programme Design; Risk Management; DSDM. Acknowledgement: The authors are indebted to the support of Mr. Lukuba Chanji, our colleague during this project who carried out much research on the mobile devices considered herein. He also provided vital inputs in the voice of the customer workshops and played a major part in the mobile device component design and systems engineering work that this work led towards.
1 Project Aims and Approach
1.1 Project Aims The paper describes a sub-project to identify mobile devices to support a larger program to develop a case management system application running in the customer’s enterprise architecture system. The case management application would be used to marshal the information gathered at incident scenes in the field, and provide tracking of this information and the way it is analysed through to collation of the resulting information in its final reporting. A critical aspect addressed by the sub-project was to identify mobile devices that allow ‘field operators’ to systematically log material found ‘in-the-field’ such that all subsequent results of treatment and analysis could be linked to the item in an auditable manner. The customer required that the system integrator identify suitable devices meeting the requirements of the various customer stake-holders, and recommend the best fit, preferably a single device.
Page 1 of 25

Presented at the 20th International QFD Symposium, Santa Fe, New Mexico, 24th October 2008 © QFD Institute
1.2 Focus of this Paper The authors fulfilled the roles of program manager and lead enterprise systems architect on this program conducted for previous employers. The focus of this paper is to illustrate the benefits of combining Quality Function Deployment (QFD) processes as described by Cohen [1], and Akao [2] 1 with the Technology Road Mapping process described in the European Industrial Research Management Association (EIRMA) report, Technology Road Mapping Delivering Business Vision’.[3] The data in this paper has been anonymised to protect the identity of the specific case management system application, the customer and the system supplier and to avoid disclosure of commercially sensitive information.
1.3 Project Design-Approach and Rationale The case management system being developed relied on the flow of information from numerous external systems both within and outside the Client’s Enterprise Systems. The design team therefore took a formal ‘Waterfall’ or ‘V Model’ systems engineering approach, reviewed in more detail in reference 4 [4], and enshrined in the IEEE 1220 Systems Engineering Standard.[5] but where detail of User Interfaces would be developed using the Dynamic Systems Development Model (DSDM) [6] involving detailed user-interaction workshops to define detail. This combination provided the robust framework for the confirmation of systems boundaries and interfaces with appropriate client-side staff in the initial design stage. It also provided the design team with a structured method for decomposing requirements into Functional Architectural components and further decomposition into Physical Architectural components. In addition it provided an effective framework for involving operational users of the system at the detailed implementation design. As the programme schedule dictated that the design phase of the programme would be fast, the authors proposed a QFD approach based on the traditional ‘4 phase’ QFD method but developed to reflect appropriate phases of the IT System development cycle.
1 [1] Cohen, Lou, ‘Quality Function Deployment – How to Make QFD Work For You’, Chapter 1, Addison Wesley Longman – Engineering Process Improvement Series, ISBN 0-201-63330-2, 1995. [2] Akao, Yoji (Editor) et. Al., ‘Quality Function Deployment QFD – Integrating Customer Requirements into Product Design’, Chapters 1, 2, 6 and 12, Productivity Press, Portland, Oregon, ISBN 0-915299-41-0, 1990 [3] ‘Technology Road Mapping – Delivering Business Vision’, Appendix C, European Industrial Research Management Association (EIRMA) Report, Paris, 1997 [4] ‘A Process Review & Appraisal of the Systems Engineering Capability for the Florida Dept. of Transport (FDOT) – Phase 1 – Systems Engineering Management Plan Version 2’, http://www.floridaits.com/SEMP/Files/PDF_Report/030220-TMI-V2.pdf [5] ‘IEEE P1220/D1 – Draft for Application and Management of the Systems Engineering Process (Revision of 1220-1998)’, IEEE Standards Activities Department, 4 June 2004. [6] ‘DSDM Public version 4.2’, found at following web page http://www.dsdm.org/version4/2/public/ , DSDM Consortium, 2007
Page 2 of 25

Presented at the 20th International QFD Symposium, Santa Fe, New Mexico, 24th October 2008 © QFD Institute
At the same time Penn and Siviy [7] 2 reported how leading systems integrators were increasingly following an approach integrating Six Sigma, particularly Voice of the Customer (VoC) and QFD, with CMMI for Software and Systems Engineering, which increased confidence that the solutions created would meet the client and programme objectives[6]. Further, this design process ensured that a clear and visible communication graphic would be produced for both customer and technical supply teams, that both parties understood and which reflected their priorities during all phases of development and roll-out. This was followed rather than the more comprehensive ‘matrix-of-matrices’ approach encompassing reliability and cost deployment described by Akao et al [2] as the contract delivery time available for design analysis was extremely limited. The authors also used the Technology Road Mapping process to provide context for high level design decisions, whilst allowing systems architects and engineers to assess the potential of alternative component solutions. [3]
The authors had considerable experience in using TRM and Design For Six Sigma methods centred on QFD in the systems engineering arena, and defined the project ‘design process’ to implement QFD within a ‘V Model’, as shown in Figure 1. The focus of this paper are the TRM and QFD 1 and 2 phases shown in the dotted blue box in Figure 1.
Figure 1: QFD & TRM Embedded in Systems Engineering ‘V’ Model
The authors therefore recommended the programme team use the following process steps: 1. Design and run a series of Voice of the Customer Workshops at system (QFD 1)
and component (QFD 2) levels with a range of customer stakeholder groups to:
2 [7] Penn, Lynn M. & Siviy, Jeannine M., ‘Integrating CMMI & Six Sigma in Software and Systems Engineering’, pages 61 to 66 and 129 to 132, A joint Presentation by Carnegie Mellon Software Engineering Institute and Lockheed Martin at http://www.sei.cmu.edu/sema/pdf/SixSigma_SiviyPenn_SEPG2003.pdf, 2003
Page 3 of 25

Presented at the 20th International QFD Symposium, Santa Fe, New Mexico, 24th October 2008 © QFD Institute
1.a. identify processes key to the system & system components using Supplier,
Input, Process, Output, Customer (SIPOC) analysis 1.b. confirm all stakeholders for those processes 1.c. confirm system and component boundaries using the preceding information 1.d. clarify stakeholder requirements for the system and major components 1.e. prioritise these requirements and 1.f. identify underlying conflicts in the requirements to identify technical and
programme risks 1.g. Use the QFD to translate these into the voice of the engineer and prioritise the
engineering requirements 2. In parallel the authors developed a system Technology Road Map to provide the
following: 2.a. context for the system architecture – helps the systems engineering team
understand the environment the solution is being developed within 2.b. confirmation of short term technology options for the system and its functional
components whilst providing a schedule of potential upgrades to the system to review and monitor with the customer
3. Outputs from process steps 1 and 2 were used to formulate design concepts 4. Followed-up with a “Pugh Matrix” based concept review with the customer to get
their assessment of strengths and weaknesses of ‘recommendation’ options being offered
5. Consolidate the preceding steps into a ‘mobile device recommendation report’ The above steps were conveyed to the customer in simplified form, shown in Figure 2 below, which was also used as a “navigation graphic” in documentation to indicate to lay readers the sub-process being described (by highlighting a particular “arrow”).
Figure 2: Navigation Graphic for Client Reports Clear and unambiguous communication is an essential part of the process. The Authors strove to provide clarity and simplicity in all communications with stakeholders, whether through documentation, or during workshop sessions in order to gain maximum benefit from the processes. The terms ‘QFD’, ‘Pugh’, ‘Functional and Physical Architecture’ were not communicated formally to the customer as they were considered “jargon” words. Traditionally the QFD process is focused on translating ‘Voice of the Customer (VoC)’ into the ‘Voice of the Engineer’. It was recognised by the authors that the process simultaneously helps generate and prioritise the programme management requirements i.e. the process supports a wide range of key roles in complex systems development programmes, not just technical design teams.
Page 4 of 25

Presented at the 20th International QFD Symposium, Santa Fe, New Mexico, 24th October 2008 © QFD Institute
1. Capture and Translation of the Voice of the Customer
2.1 Voice of the Customer Workshops
2.1.1 Capture of Voice of the Customer Ahead of launching the programme the client supplied an extensive requirements set for the supplier to work against, that had been developed over several years by a customer team in conjunction with a consultancy firm. This also involved an extensive round of negotiations between the client and the preferred supplier after they were down-selected. This requirement set was formed from 850 individual and compound requirements, that had evolved over the definition stage of the project. During the latter stages of contract negotiation considerable effort was made by the selected Systems Integrator, supported by the customer team, to consolidate an agreed wording of the requirement set in a requirements management system viz. DOORS (ex. Telelogic). This was done to ensure that a change control mechanism and traceability framework was in place going forward. The criticality of this approach is developed by J. Dick.[8] 3 This is illustrated at the base of Figure 3. They also contained a mixture of ‘What’ and ‘How To’ requirements. An example of a ‘How To’ requirement provided to the system integrator was ‘The stylus will be connected to the keyboard by a tether’ indicating the customer’s preconceived view that field operatives would be equipped with keyboard based devices. At contract award, the customer agreed that the Voice of the Customer workshops should be carried out such that the requirements previously stated could be validated, that representatives of stakeholder groups could update their needs and prioritise them in conjunction with other Stakeholders. This also helped the system integrator ensure that the requirements driving the design team were ‘What’ requirements and not ‘How To’ requirements. By analysing the customer’s process maps a series of 8 Voice of the Customer workshops were designed and representatives of appropriate stakeholders identified who could cover the following areas:
VoC Workshop # Functional Area 1 System Level (QFD 1) 2 In-the-Field Mobile Devices (QFD 2) 3 System Administration (QFD 2) 4 In-Field Operation Management (QFD 2) 5 Analysis Processes Management (QFD 2) 6 Management Information (QFD 2) 7 Item Storage Management (QFD 2) 8 ‘In Field’ Item Tagging (QFD 2)
3 [8] Dick, J. & Chard, J., ‘The Systems Engineering Sandwich: Combining Requirements, Models & Design’, Telelogic White Paper, February 3, 2004.
Page 5 of 25

Presented at the 20th International QFD Symposium, Santa Fe, New Mexico, 24th October 2008 © QFD Institute
The first VoC workshop addressed System Level requirements (the basis of the QFD1 analysis for the System) involving senior managers from the different departments impacted by the system. This allowed the high level system boundary to be defined in line with the Top Level System Stakeholders, and subsequently provided the context and some key requirements for the lower level ‘component’ workshops. A graphic outlines this in Figure 3 below.
Figure 3: Schematic showing linkage between VoC, QFD and Design
Seven subsequent VoC workshops were run to focus on the ‘What’ requirements of the major components of the system (each followed by a QFD 2 Analysis). Each workshop lasted one day and provided the ‘actual’ process sequence for the system and its components based on the knowledge of ‘user communities’ represented in the workshops. During each workshop the end-to-end processes for the system or component were identified, significant inputs and outputs associated with the processes mapped, and the key actors (suppliers, customers and process operators) identified. A SIPOC map was generated from this data that enabled the design team to confirm that all stake-holders were being considered in the solution. This approach has subsequently been reported publicly by Thomas.[9] 4 Each attendee at the workshop was allocated to represent at
4 [9] Thomas, Debra, ‘Identifying High-Level Requirements Using SIPOC Diagram’, I-SixSigma article, http://www.isixsigma.com/library/content/c061016a.asp, 16 October 2006
Page 6 of 25

Presented at the 20th International QFD Symposium, Santa Fe, New Mexico, 24th October 2008 © QFD Institute
least one major process. Each process owner was time-constrained and allowed to select only a limited number of requirements associated with their processes (typically three) and a consolidated list of about twenty requirements produced for each workshop. This may appear arbitrary, but empirical data suggests such drastic limitations on stakeholders produces the best results (provided the stakeholder group is representative of interests and of reasonable size). Only key requirements tend to be produced, often referred to as “Critical to Quality” requirements (CTQs).
2.1.2 Prioritisation of Requirements These requirements were prioritised using ‘pair-wise’ comparison. Running this process with multiple stakeholders provided a good framework for establishing consensus across the teams impacted by the components of the system, in effect broadening the perspective of the customer teams. Importantly the process also drives out the conflicts in perceived priorities for system requirements, and brings the opposing views to be resolved in terms of what is most important for overall ‘system success’. The workshop facilitators ensured that conflicts were both recognised and resolved amongst participants. The results of the pair-wise comparison gave a ranking of requirements from most important to least. These rankings were allocated to the standard QFD importance rating scale where ‘5’ reflects most important or ‘mission critical’ requirements, with ‘1’ reflecting least important or ‘nice-to-have’ requirements. The results of the pair-wise comparison and QFD scaling are shown for a subset of the system level requirements that most heavily impact the mobile device selection are shown in Figure 4 below. This shows three groupings of stakeholders (chosen by the authors to illustrate key aspects of the process) and selected requirements along with the QFD ratings. In the system QFD 1 matrix produced during the programme 10 stakeholder groups were analysed in the way shown below in Figure 4. During the workshops the requirements and priorities were rapidly transferred into the QFD Software (ex. IDEACore) and all subsequent QFD Analysis steps conducted using this software.
Page 7 of 25

Presented at the 20th International QFD Symposium, Santa Fe, New Mexico, 24th October 2008 © QFD Institute
Figure 4: Results of Pair-wise Prioritisation of System Requirements
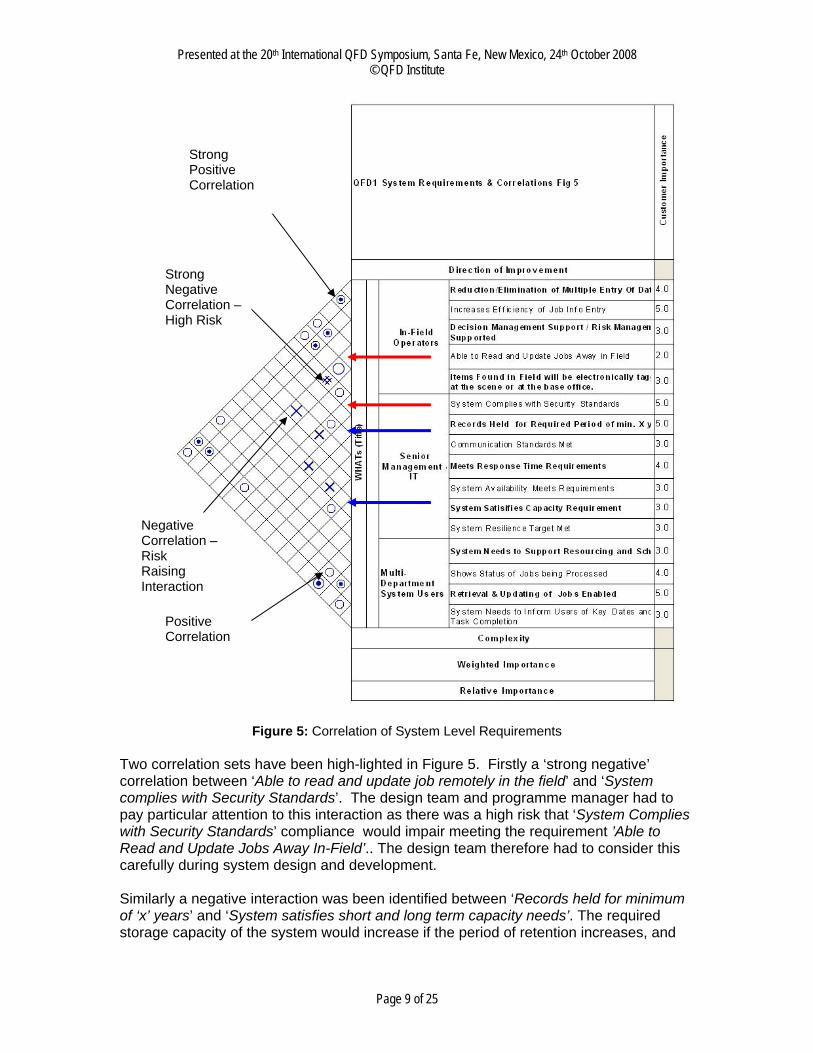
2.1.3 Correlation of Stakeholder Requirements The stakeholders present in the workshops were then asked to identify ‘positive’ and ‘negative’ correlations between the requirements (both necessary pieces of information to the designers), where ‘positive’ and ‘strong positive’ correlation are shown as open and filled circles respectively . The ‘negative’ and ‘strong negative’ correlations are shown as a ‘hash’ and ‘double hash’ respectively. A subset of these are shown for the system level (VoC 1) workshop in Figure 5.
Page 8 of 25
Presented at the 20th International QFD Symposium, Santa Fe, New Mexico, 24th October 2008 © QFD Institute
Strong Negative Correlation – High Risk
Strong Positive Correlation
Negative Correlation – Risk Raising Interaction
Positive Correlation
Figure 5: Correlation of System Level Requirements Two correlation sets have been high-lighted in Figure 5. Firstly a ‘strong negative’ correlation between ‘Able to read and update job remotely in the field’ and ‘System complies with Security Standards’. The design team and programme manager had to pay particular attention to this interaction as there was a high risk that ‘System Complies with Security Standards’ compliance would impair meeting the requirement ’Able to Read and Update Jobs Away In-Field’.. The design team therefore had to consider this carefully during system design and development. Similarly a negative interaction was been identified between ‘Records held for minimum of ‘x’ years’ and ‘System satisfies short and long term capacity needs’. The required storage capacity of the system would increase if the period of retention increases, and
Page 9 of 25
Presented at the 20th International QFD Symposium, Santa Fe, New Mexico, 24th October 2008 © QFD Institute
therefore the interaction of these requirements had to be considered a source of risk should the first requirement change.
2.1.4 Pro’s and Con’s of ‘VoC Workshops’ The ‘workshops’ on average were attended by ten representatives of the relevant stakeholders. This reflected a tremendous commitment from our client, requiring them to re-arrange shift schedules to free staff from operational duties, and to secure appropriate venues. Similarly they required appropriate staffing and commitment from the supply team, set against demanding challenges of project schedules and high priority programme launch activities. The planning, logistics, resourcing and coordination of these became a mini-project in its own right. This gave no latitude for over-runs in workshops, and to ensure data was available to the design team at earliest stage of design, the workshops had to be run within two months of the start of the project. This required considerable effort from the supply team in negotiating with the client such that they understood the potential value of the approach, which was new to them. The following benefits were delivered via these workshops, fulfilling the value expectations of the client:
• users developed a holistic understanding of their needs and those of other stakeholders and appreciated the ‘systems context’ for their area
• an understanding of conflicting requirements was established with the customer early
• many stakeholders reported they felt enfranchised through attendance at the workshops – they were being listened to – gripes and all
• the design team got to the heart of the key stakeholder drivers – and understood areas still requiring clarification by the client
• the design team better understood scope and constraints of the system • critical relationships were established between customer groups and the supply
team • they established a communication framework for use by all parties
As a final comment, during discussions with members of the client’s ‘contract negotiation team’ it was agreed that this might have been a more rapid and effective route to establishing contract requirements during the procurement cycle.
2.2 Post Workshop Analysis of VoC Information using QFD After the VoC workshops the design team used the outputs (Prioritised Customer Requirements and the Correlation Matrix) to produce a possible set of engineering design requirements viz. the “Voice of the Engineer”. The standard QFD process was followed wherein in turn for each VoC ‘What’ requirement the design team asked “How can we ensure that the ‘What’ is delivered in the design?” viz. a list of ‘How To’s’ were generated. Each of these was given a strong, medium, weak or zero relationship value according to how well it helped achieve each of the customer’s ‘What’ requirements.
Page 10 of 25

Presented at the 20th International QFD Symposium, Santa Fe, New Mexico, 24th October 2008 © QFD Institute
This important relationship field allows the engineers to do an initial, visual and numerical assessment on the closeness of “fit” between the design requirement and the customer requirements, and importantly identify gaps where key customer requirements aren’t being supported. During the design process this provides a comprehensive, visual map showing the impact of design enhancements and allowing the design engineer to tailor their solution concepts to meet the important design requirements whilst understanding the impact on other design requirements.
2.2.1 System QFD 1 Analysis The output from the first ‘System Level VoC’ workshop was used to produce the QFD 1 for the system, please refer Figure 6 below. The authors have been selective in the wording and choice of stakeholder groupings and requirements to ensure confidentiality of the original material. In terms of interaction of QFD 1 with the design process please see top left of Figure 3. It can be seen that the high-level design requirement ‘5. System Supports Mobile Devices’ is the most important requirement in the QFD analysis presented in this paper. In the full analysis within the project this proved to be the 4th most important design requirement. The full QFD 1 supplied an overview of the key components required in the system and their relative priority. It also provided context for the design team and key inputs for the follow-up major component oriented ‘QFD 2’ analyses. Within this QFD1 the team identified both Technical and Programme ‘Design Requirements’. As an example, at the top of Figure 6 Design Requirement 14 ‘ Security Review and Audit’ was a critical programme requirement needed to satisfy several Customer requirements. It would not be flowed through into the technical design QFD, but would be established as a priority programme review milestone i.e. the QFD is a powerful method integrating both programme and technical objectives and requirements. Other integrative aspects of the ‘QFD process’ in terms of focusing business development and technical teams in fulfilling the benchmarking areas of the chart were confirmed during this project, but are outside the scope of the paper.
Page 11 of 25

Presented at the 20th International QFD Symposium, Santa Fe, New Mexico, 24th October 2008 © QFD Institute
Figure 6: System QFD1 - fragment
2.2.2 QFD 2 For Mobile Device Development As described in section 2.1.1 the second Voice of the Customer workshop focused on needs of the stakeholders associated with ‘In-Field’ Operations, particularly with the mobile devices. This workshop could be seen as a QFD 1 for the Mobile Device, but as the ‘What’s’ are more detailed and reflect the needs of stakeholders for a component of the system, the authors have referenced the resulting QFD matrix as a QFD 2. As stated by Cohen, page 331 of reference [1], QFD naturally supports Object Oriented Design, a design goal for this programme. The QFD 2 analyses can be seen as requirements for components/ major objects of the system.
Page 12 of 25

Presented at the 20th International QFD Symposium, Santa Fe, New Mexico, 24th October 2008 © QFD Institute
As expected, some of the needs are sub-sets of those recorded for the QFD 1. The ‘What’s for this QFD 2, with the results of the Pair-wise prioritisation and the correlation matrix are shown in Figure 7 below As can be seen some ‘How To’ requirements remained in the Stakeholder requirements list e.g. ‘Hot swap battery for shift life’ reflected the belief by a majority of stakeholders that the solution would be a form of laptop/ notebook. The design team bore this in mind, and recognised this was a statement of ‘The device will maintain necessary power to last a whole shift’. In feeding back to the workshop representatives the supply team were careful not to change agreed wording as the stakeholders need to recognise their words and feel ownership.
Figure 7: Correlation & Priorities of What’s for QFD 2 for Mobile Devices
Page 13 of 25

Presented at the 20th International QFD Symposium, Santa Fe, New Mexico, 24th October 2008 © QFD Institute
As shown in Figure 7 critical negative correlations were identified in the workshop with Client stakeholders. As an example the need voiced by infrastructure oriented staff for ‘Maximum Data Storage’, and the In-Field Operator Staff need for ‘Portability – Hands Free and Lightweight’ were at odds with each other if the In-Field Operator was to carry the Data Storage by hand. In the same manner as described previously the QFD 2 for the In-Field Mobile Device was constructed from the outputs of the 2nd VoC Workshop. The resulting matrix is shown below and reflects the following issues in its content and format:
• The data does not reflect the whole matrix generated during the project, but maintains key issues and priorities associated with the mobile device recommendation
• The ‘How To’ Requirements have been grouped into the Functional Areas. There are a number of negative correlations between the ‘How Tos’, which form the basis of design ‘challenges’ and ‘drivers’ that became major inputs for the design team. In Figure 8 we have focused on the correlation between ‘Device Portability – Light Weight & Hands Free Device (< 2kg)’ and ‘Large Display of Data in-Field (>/= A4)’. At a more detailed level of design this would have become a natural kick-off point for a ‘Creative Problem Solving (TRIZ) or Ideation’ exercise. Please see reference [10], Huber and Mazur, to see context of TRIZ with relation to the other tools from DFSS such as QFD. [10] 5
However, the supply team had already generated the Programme Technology Road Map at this stage, and it was this that the team turned to next for ideas for solutions, as described in Section 2.3.
5 [10] Huber, Charles & Mazur, Glenn H., ‘QFD and Design for Six Sigma’, In Proceedings of the 14th Symposium on QFD published by the QFD Institute, ISBN 1-889477-14-11, 2002
Page 14 of 25

Presented at the 20th International QFD Symposium, Santa Fe, New Mexico, 24th October 2008 © QFD Institute
Figure 8: QFD 2 Matrix for In Field Mobile Device
2.2.3 Requirements Traceability and Gap Analysis After the workshops described above the results were also logged into appropriate modules within the DOORS database such that a validation and gap analysis versus the original ‘contractual’ requirements could be carried out. This is illustrated graphically at the foot of Figure 3. The combination of QFD, Pugh and a Requirements Management System (RMS) is of central importance for such
Page 15 of 25

Presented at the 20th International QFD Symposium, Santa Fe, New Mexico, 24th October 2008 © QFD Institute
programmes where the full range of the requirements management process needs to be deployed:
• Requirements clarification, structuring, decomposition, prioritisation and correlation run through QFD
• Compliance of design to requirements and design enhancement via the Pugh Matrix and linked to the QFD
• Requirements traceability, compliance analysis and configuration control over the whole programme life-cycle via an RMS such as DOORS
2.3 Development & Use of the Technology Road Map
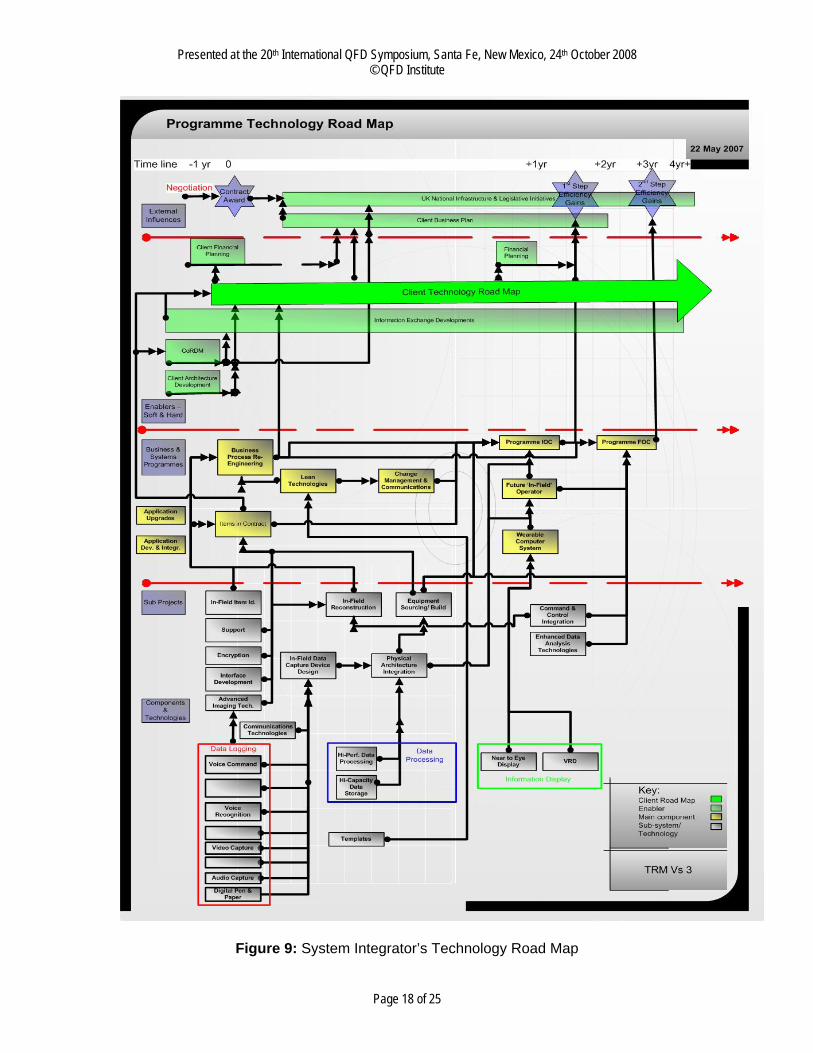
2.3.1 Development of the TRM The System Technology Road Map shown in figure 9 was structured to show relevant environmental factors and developments that were likely to impact the system. The TRM shown focuses on areas relevant to this paper. In particular the team identified the key functional architectural components of the system and mapped how these could be supported by developments in relevant systems, underlying components and their supporting component technologies. This is presented on an approximate logarithmic timeline that shows when technologies and systems are likely to be mature enough to impact the development of the system. The milestones attached to the timeline include Contract Award (with preceding contract negotiations), 1st Step Efficiency Gains (through initial introduction of System Elements), and 2nd Step Efficiency Gains through full deployment of the system. The general format follows that described in reference [3], which provides an extensive review of Technology Road Mapping approaches. The chart has been greatly simplified and anonymised. The team also recognised that relevant concepts were being proposed in other fields such as the ‘Land Warrior/ Future Soldier’ [11] 6 and ‘Wearable Computing’ programmes, which offered possible solutions to Design Requirements and Correlation challenges arising from the QFD 2. Ideas were structured in the Technology Road Map where particular effort was taken to group options in terms of the Functional Architecture. The Wearable Computing and Future Soldier concepts are integrated into a Business and Systems Project – Future In-Field Operator.
2.3.2 Analysis of the TRM Of particular relevance to this paper, at the foot of the chart are three coloured boxes, red blue and green, reflecting components of the functional architecture for the ‘in-field’ mobile devices viz. Data Logging, Data Processing and Information Display respectively.
6 [11] ‘Land Warrior’ web page at General Dynamics, http://www.gdc4s.com/content/detail.cfm?item=aa0d1b86-ac8d-47ed-b59d-f8c2157beb7e&page=3
Page 16 of 25
Presented at the 20th International QFD Symposium, Santa Fe, New Mexico, 24th October 2008 © QFD Institute
Each box contains sub-components or alternative technologies that could achieve the function. This arrangement gives options for the design team in terms of alternative physical implementations of the function and was used by the team to develop alternative solution concepts that better satisfied QFD output. Subsequently the TRM was revisited to produce rapidly an enhanced ‘solution concept’ to meet newly emerged requirements. The client’s contract requirements provided an implied solution based on possible combinations of robust laptops/notebooks and/ or PDAs, and these formed two solution concepts. These have not been drawn out on the TRM as they represent the physical integration of functional groupings, so can be seen as particular instantiation of the Physical Architecture Integration project shown above the ‘Data Processing and Storage’ Functional Group box shown on Figure 9 below.
Page 17 of 25
Presented at the 20th International QFD Symposium, Santa Fe, New Mexico, 24th October 2008 © QFD Institute
Figure 9: System Integrator’s Technology Road Map
Page 18 of 25
Presented at the 20th International QFD Symposium, Santa Fe, New Mexico, 24th October 2008 © QFD Institute
3 Concept Formulation and Evaluation Using Pugh Matrix
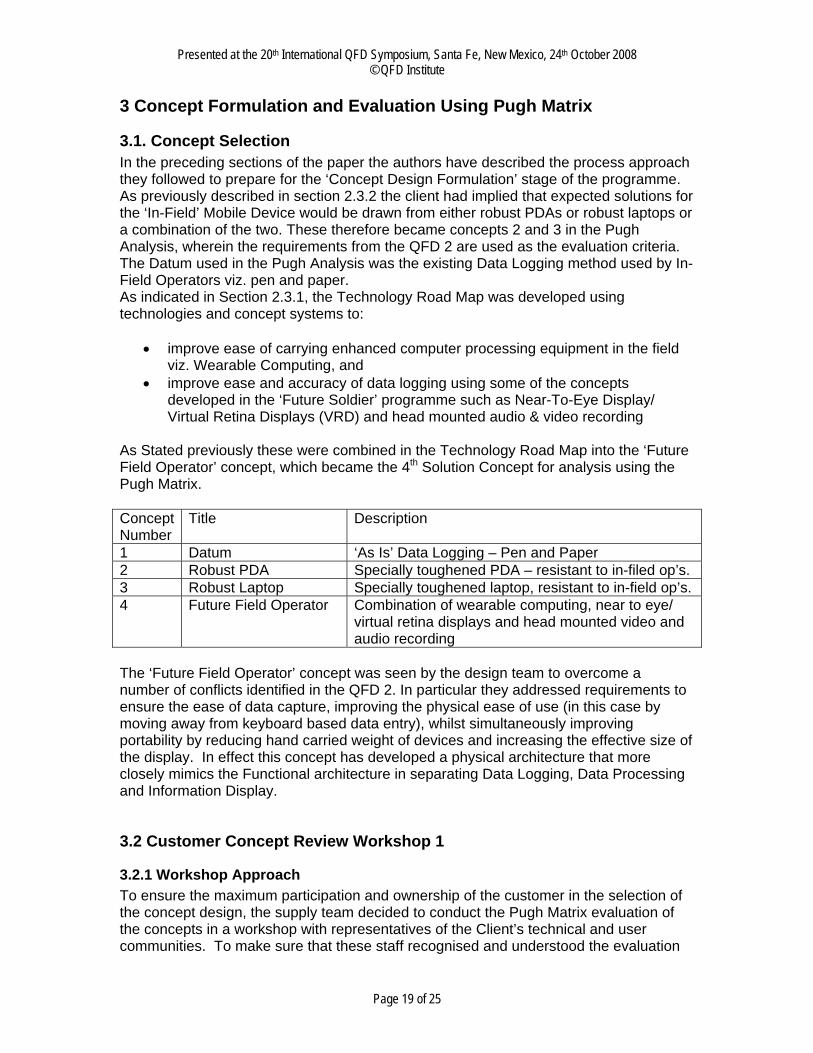
3.1. Concept Selection In the preceding sections of the paper the authors have described the process approach they followed to prepare for the ‘Concept Design Formulation’ stage of the programme. As previously described in section 2.3.2 the client had implied that expected solutions for the ‘In-Field’ Mobile Device would be drawn from either robust PDAs or robust laptops or a combination of the two. These therefore became concepts 2 and 3 in the Pugh Analysis, wherein the requirements from the QFD 2 are used as the evaluation criteria. The Datum used in the Pugh Analysis was the existing Data Logging method used by In-Field Operators viz. pen and paper. As indicated in Section 2.3.1, the Technology Road Map was developed using technologies and concept systems to:
• improve ease of carrying enhanced computer processing equipment in the field viz. Wearable Computing, and
• improve ease and accuracy of data logging using some of the concepts developed in the ‘Future Soldier’ programme such as Near-To-Eye Display/ Virtual Retina Displays (VRD) and head mounted audio & video recording
As Stated previously these were combined in the Technology Road Map into the ‘Future Field Operator’ concept, which became the 4th Solution Concept for analysis using the Pugh Matrix. Concept Number
Title Description
1 Datum ‘As Is’ Data Logging – Pen and Paper 2 Robust PDA Specially toughened PDA – resistant to in-filed op’s. 3 Robust Laptop Specially toughened laptop, resistant to in-field op’s. 4 Future Field Operator Combination of wearable computing, near to eye/
virtual retina displays and head mounted video and audio recording
The ‘Future Field Operator’ concept was seen by the design team to overcome a number of conflicts identified in the QFD 2. In particular they addressed requirements to ensure the ease of data capture, improving the physical ease of use (in this case by moving away from keyboard based data entry), whilst simultaneously improving portability by reducing hand carried weight of devices and increasing the effective size of the display. In effect this concept has developed a physical architecture that more closely mimics the Functional architecture in separating Data Logging, Data Processing and Information Display.
3.2 Customer Concept Review Workshop 1
3.2.1 Workshop Approach To ensure the maximum participation and ownership of the customer in the selection of the concept design, the supply team decided to conduct the Pugh Matrix evaluation of the concepts in a workshop with representatives of the Client’s technical and user communities. To make sure that these staff recognised and understood the evaluation
Page 19 of 25

Presented at the 20th International QFD Symposium, Santa Fe, New Mexico, 24th October 2008 © QFD Institute
criteria, the Stakeholder ‘What’ Requirements of the QFD 2 were used as the evaluation criteria in the matrix. Normally the Pugh Matrix would be run with the ‘Voice of the Engineer’ viz. the Design Requirements. This view of the concept evaluation was carried out independently by the design team. That said, it was recognised that using customer requirements would allow objective and un-biased assessment of the concepts, particularly as members of the review committee had previously been involved in generating the customers’ ‘preferred concepts’. The workshop was run at a customer venue with the Pugh Matrix displayed live to ensure complete transparency.
3.2.2 Results of Concept Review Workshop The Pugh Matrix developed during this workshop is shown in Figure 10 below.
Figure 10: Results of Initial Concept Evaluation With Customer
Page 20 of 25
Presented at the 20th International QFD Symposium, Santa Fe, New Mexico, 24th October 2008 © QFD Institute
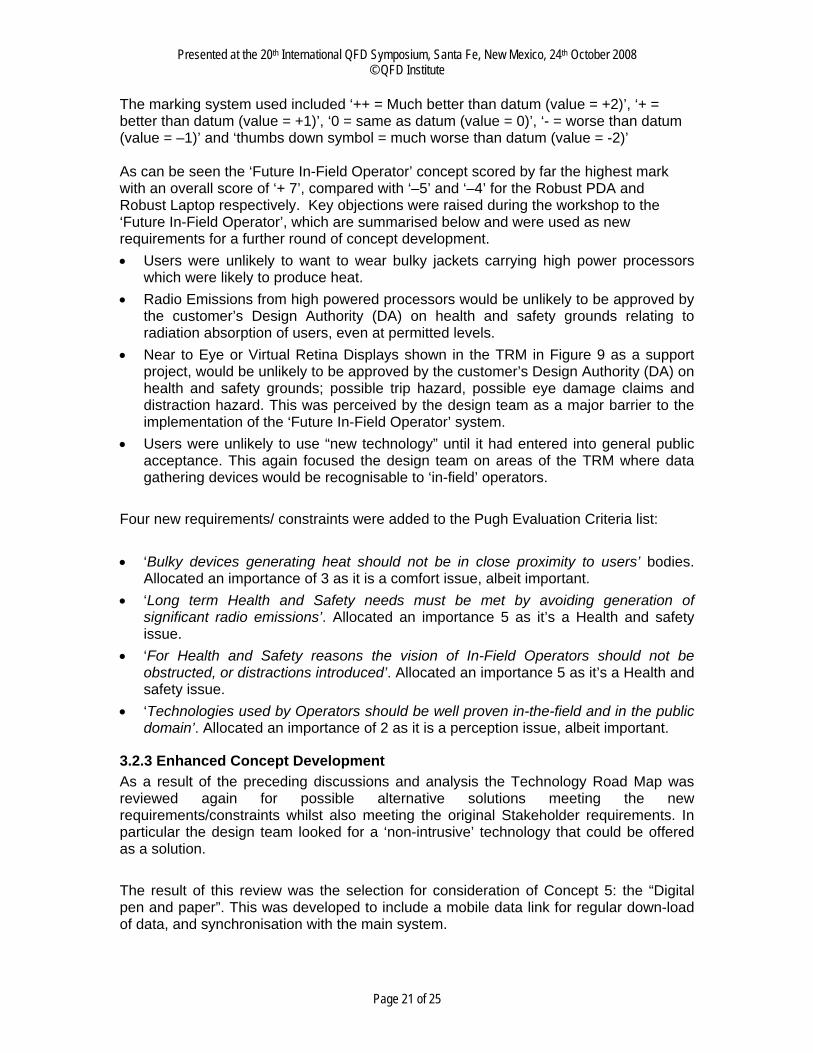
The marking system used included ‘++ = Much better than datum (value = +2)’, ‘+ = better than datum (value = +1)’, ‘0 = same as datum (value = 0)’, ‘- = worse than datum (value = –1)’ and ‘thumbs down symbol = much worse than datum (value = -2)’ As can be seen the ‘Future In-Field Operator’ concept scored by far the highest mark with an overall score of ‘+ 7’, compared with ‘–5’ and ‘–4’ for the Robust PDA and Robust Laptop respectively. Key objections were raised during the workshop to the ‘Future In-Field Operator’, which are summarised below and were used as new requirements for a further round of concept development. • Users were unlikely to want to wear bulky jackets carrying high power processors
which were likely to produce heat. • Radio Emissions from high powered processors would be unlikely to be approved by
the customer’s Design Authority (DA) on health and safety grounds relating to radiation absorption of users, even at permitted levels.
• Near to Eye or Virtual Retina Displays shown in the TRM in Figure 9 as a support project, would be unlikely to be approved by the customer’s Design Authority (DA) on health and safety grounds; possible trip hazard, possible eye damage claims and distraction hazard. This was perceived by the design team as a major barrier to the implementation of the ‘Future In-Field Operator’ system.
• Users were unlikely to use “new technology” until it had entered into general public acceptance. This again focused the design team on areas of the TRM where data gathering devices would be recognisable to ‘in-field’ operators.
Four new requirements/ constraints were added to the Pugh Evaluation Criteria list: • ‘Bulky devices generating heat should not be in close proximity to users’ bodies.
Allocated an importance of 3 as it is a comfort issue, albeit important. • ‘Long term Health and Safety needs must be met by avoiding generation of
significant radio emissions’. Allocated an importance 5 as it’s a Health and safety issue.
• ‘For Health and Safety reasons the vision of In-Field Operators should not be obstructed, or distractions introduced’. Allocated an importance 5 as it’s a Health and safety issue.
• ‘Technologies used by Operators should be well proven in-the-field and in the public domain’. Allocated an importance of 2 as it is a perception issue, albeit important.
3.2.3 Enhanced Concept Development As a result of the preceding discussions and analysis the Technology Road Map was reviewed again for possible alternative solutions meeting the new requirements/constraints whilst also meeting the original Stakeholder requirements. In particular the design team looked for a ‘non-intrusive’ technology that could be offered as a solution. The result of this review was the selection for consideration of Concept 5: the “Digital pen and paper”. This was developed to include a mobile data link for regular down-load of data, and synchronisation with the main system.
Page 21 of 25

Presented at the 20th International QFD Symposium, Santa Fe, New Mexico, 24th October 2008 © QFD Institute
The results of the further Pugh Analysis of the concepts using the expanded set of criteria is given below:
Figure 11: Review of Enhanced Concept with Additional Requirements
Page 22 of 25
Presented at the 20th International QFD Symposium, Santa Fe, New Mexico, 24th October 2008 © QFD Institute
This shows the Digital Pen solution to have significant advantages over the other solutions, scoring an overall +12 compared with a net score of +1 for the ‘Future Field Operator’, it’s nearest competitor. Further analysis was carried out by the design team to further enhance the solution design.
2.6 Customer Response Initially the client team went into denial and demanded a more comprehensive audit path leading to the recommended solution. This was to be expected as the solution was a far cry from the one that had been in the clients’ minds for several years. A cost trade-off was prepared which showed that equipping In-Field Operators with pens rather than laptops would be economically advantageous. In effect a far smaller number of robust laptops would be used. After continued internal review for several weeks the client finally admitted that they were delighted with the solution recommended.
3 Summary of Pros and Cons and Conclusions
3.1 Summary of Pros and Cons of this Approach To reiterate the VoC & QFD process provided the following: 1. Facilitated common understanding of requirements and their priorities across
multiple customer stakeholders and the design team, 2. Stake-holder buy-in achieved across the client teams 3. Focused relationships between the customer and supplier teams 4. Established a strong visual communication means for client and design teams 5. Programme and Technical requirements and risks were identified and prioritised The additional benefits of the Pugh Matrix process: 1. Gave traceability from requirement to design 2. Gave customer visibility and transparency to decision making 3. Brought objectivity to both parties – helped remove ‘preconceived solution’ syndrome 4. Helped design team identify areas for enhancing designs The further benefits by using the Technology Road Mapping with QFD and Pugh Matrix: 1. Provided context to the design team and the senior customer management team 2. Provided high-level solution options for the design team. 3. Allowed the design team to future proof the first release of the system 4. Gave an additional way of communicating about the future growth of the system for
all parties concerned (gave context for business solution development teams). The Cons for this approach include: 1. Large logistical problem of releasing key stake-holders from operational duties, and 2. Considerable supplier resources needed to run Voice of the Customer and QFD
analysis workshops. This approach demands a large commitment from client and supplier to succeed. However, these resources would normally be trying to assemble this information independently where the data generated by the efforts of individuals is far less likely to provide the essential ‘shared systems understanding’.
Page 23 of 25

Presented at the 20th International QFD Symposium, Santa Fe, New Mexico, 24th October 2008 © QFD Institute
3.2 Conclusions Despite severe time pressures the structured framework incorporating VoC, QFD, TRM and Pugh Matrix allowed the supply team to rapidly identify the priority Critical to Quality Characteristics for the system and its components, and to develop the engineering requirements from which design concepts could be developed. This provided a strong communication framework for customer and supply teams. It gave structure to the way the customer could voice their true requirements, and helped them identify unspoken requirements that would be important during implementation. The framework allowed the design team to focus on key issues and respond at high speed to new requirements viz. provides configuration management framework in which impact of requirement or technology changes can be assessed rapidly. The QFD approach in particular lends itself to identifying the functional architecture for the system, and subsequently supports the development of the physical architecture. This allowed the supply team to focus on the functional architectural components of ‘In-Field Data Logging’, ‘Data Processing’ and ‘Information Display’ that allowed it to identify a solution that delighted the customer – eventually.
References: [1] Cohen, Lou, ‘Quality Function Deployment – How to Make QFD Work For You’, Chapter 1, Addison Wesley Longman – Engineering Process Improvement Series, ISBN 0-201-63330-2, 1995. [2] Akao, Yoji (Editor) et. Al., ‘Quality Function Deployment QFD – Integrating Customer Requirements into Product Design’, Chapters 1, 2, 6 and 12, Productivity Press, Portland, Oregon, ISBN 0-915299-41-0, 1990 [3] ‘Technology Road Mapping – Delivering Business Vision’, Appendix C, European Industrial Research Management Association (EIRMA) Report, Paris, 1997 [4] ‘A Process Review & Appraisal of the Systems Engineering Capability for the Florida Dept. of Transport (FDOT) – Phase 1 – Systems Engineering Management Plan Version 2’, http://www.floridaits.com/SEMP/Files/PDF_Report/030220-TMI-V2.pdf [5] ‘IEEE P1220/D1 – Draft for Application and Management of the Systems Engineering Process (Revision of 1220-1998)’, IEEE Standards Activities Department, 4 June 2004. [6] ‘DSDM Public version 4.2’, found at following web page http://www.dsdm.org/version4/2/public/ , DSDM Consortium, 2007 [7] Penn, Lynn M. & Siviy, Jeannine M., ‘Integrating CMMI & Six Sigma in Software and Sytems Engineering’, pages 61 to 66 and 129 to 132, A joint Presentation by Carnegie Mellon Software Engineering Institute and Lockheed Martin at http://www.sei.cmu.edu/sema/pdf/SixSigma_SiviyPenn_SEPG2003.pdf, 2003 [8] Dick, J. & Chard, J., ‘The Systems Engineering Sandwich: Combining Requirements, Models & Design’, Telelogic White Paper, February 3, 2004. [9] Thomas, Debra, ‘Identifying High-Level Requirements Using SIPOC Diagram’, I-SixSigma article, http://www.isixsigma.com/library/content/c061016a.asp, 16 October 2006. [10] Huber, Charles & Mazur, Glenn H., ‘QFD and Design for Six Sigma’, In Proceedings of the 14th Symposium on QFD published by the QFD Institute, ISBN 1-889477-14-11, 2002
Page 24 of 25
Presented at the 20th International QFD Symposium, Santa Fe, New Mexico, 24th October 2008 © QFD Institute
[11] ‘Land Warrior’ web page at General Dynamics, http://www.gdc4s.com/content/detail.cfm?item=aa0d1b86-ac8d-47ed-b59d-f8c2157beb7e&page=3
About The Authors Kim Stansfield has Bachelors, Masters and Doctorate degrees in Metallurgy, Electronic Materials and Aerospace Composite Technologies and Engineering, and is a Chartered Engineer. He started his career in the Composites Group of the Royal Aerospace Establishment (MOD Procurement Executive) in the UK before moving to Lucas Engineering and Systems in the early 1990’s to work on development of an automated design and manufacturing system for complex aerospace components. Here he learned Japanese TQM methods including QFD and process improvement methods to help enhance the design of the manufacturing system, before developing two Systematic R&D services exploiting these methods. He progressed into advanced automotive and aerospace control system development arena becoming a programme manager and lead consultant specializing in Design For Six Sigma methods. More recently he moved to an IT Systems Integrator where he worked with the co-author on implementing DFSS methods in the design and development of Public Sector IT Systems. In 2007 he joined CSC Computer Sciences Ltd in the UK as a programme manager. Jeff Cole has worked for 25 years in the Power Industry in the UK rising to senior roles in commercial management for repair and maintenance of electrical power generation plant (fossil, nuclear and wind). He progressed into technical leadership roles in advanced computing systems, leading development of a system exploiting knowledge bases linked to neural networks for ‘competitive bid systems’ which led to the further development of a ‘neural network based control system’ for Power Plant. In the role of Technical Manager at KEP Energy he led the development of Internet based secure communications within the Nuclear Power Industry, and was a thought leader in deployment of Public Key Infrastructure (PKI) secure systems. More recently he joined a major System Integrator in the UK as a lead-enterprise architect with the co-author, where he led the design and development of the Case Management System (to operate within the client’s Service Oriented Enterprise Architecture ) incorporating the mobile data collection sub-system outlined in this paper. He also led thinking on Identity Management for the System Integrator in Europe. In 2007 he joined CSC Computer Sciences Ltd. in the UK as a Security Architect.
Page 25 of 25