Use of FT-IR Spectra and PCA to the Bulk Characterization ...
14
ORIGINAL ARTICLE Use of FT-IR Spectra and PCA to the Bulk Characterization of Cell Wall Residues of Fruits and Vegetables Along a Fraction Process Monika Szymanska-Chargot & Artur Zdunek Received: 9 May 2012 / Accepted: 6 December 2012 / Published online: 27 December 2012 # The Author(s) 2012. This article is published with open access at Springerlink.com Abstract This study focuses on the analysis of polysaccha- ride residues from the cell walls of fruits and vegetables: tomato, potato, pumpkin, carrot and celery root. An alcohol- insoluble residue was prepared from plant material by ex- traction using the hot ethyl alcohol method and then cell wall fractions soluble in trans-1,2-diaminocyclohexane-N, N,N′,N′-tetraacetate, sodium carbonate and alkaline solution were sequentially extracted. Infrared spectroscopy com- bined with Fourier transform (FT-IR) was used to evaluate differences among cell wall residues and among species after each step of sequential extraction of pectins and hemi- celluloses. Additionally, pectic substances were identified using an Automated Wet Chemistry Analyser. Principal component analysis (PCA) was applied to FT-IR spectra in two regions: 1,800–1,200 cm -1 and 1,200–800 cm -1 in order to distinguish different components of cell wall poly- saccharides. This method also allowed us the possibility of highlighting the most important wavenumbers for each type of polysaccharide: 1,740, 1,610 and 1,240 cm -1 denoting pectins or 1,370 and 1,317 cm -1 denoting hemicelluloses and cellulose, respectively. Keywords FT-IR spectroscopy . Vegetable and fruit cell walls . Principal component analysis . Pectin . Hemicellulose Abbreviations C Cellulose CDTA Trans-1,2-Diaminocyclohexane-N,N,N′,N′- tetraacetate CWM Cell wall material FT-IR Fourier transform infrared P Pectins PC Principal component PCA Principal component analysis XG Xyloglucan Introduction The primary cell wall of fruits and vegetables mainly con- sists of various polysaccharides: pectins, hemicelulloses and cellulose, and comparably smaller amounts of structural glycoproteins, phenolic esters, minerals and enzymes [1, 2]. In the commonly accepted model of a plant cell wall, cellulose fibrils are embedded in matrix polysaccharides, which are pectins and hemicelluloses. Concentrations of each constituent vary according to the origin of the plant, the organs and the tissue [3]. Plant cell walls and their constitutive polysaccharide networks are vital with regard to the mechanical properties of the plant organ, such as stiffness or strength. In addition, the amount and structure of cell wall non-cellulosic polysaccharides changes during development and ripening, and again during senescence of fruit. During development and ripening, changes of cell wall properties are the result of compounds’ synthesis, whereas during post-harvest rather dominates degradation. Modifi- cations of non-cellulosic polysaccharides also have a tre- mendous effect on structure and arrangement of cellulose microfibrils and hence on the mechanical properties of cell wall and plant tissue [3]. Infrared spectroscopy is one of the most frequently used spectroscopic techniques for studying plant cell wall mate- rial. The main advantage of this method is high sensitivity. Additionally, combination with Fourier transform (FT-IR) has provided a very rapid, versatile and relatively inexpen- sive tool for compounds’ identification. Transmission mode, M. Szymanska-Chargot (*) : A. Zdunek Department of Microstructure and Mechanics of Biomaterials, Institute of Agrophysics, Polish Academy of Science, Doswiadczalna 4, 20-290 Lublin, Poland e-mail: [email protected] Food Biophysics (2013) 8:29–42 DOI 10.1007/s11483-012-9279-7
Transcript of Use of FT-IR Spectra and PCA to the Bulk Characterization ...
ORIGINAL ARTICLE
Use of FT-IR Spectra and PCA to the Bulk Characterizationof Cell Wall Residues of Fruits and Vegetables Along a FractionProcess
Monika Szymanska-Chargot & Artur Zdunek
Received: 9 May 2012 /Accepted: 6 December 2012 /Published online: 27 December 2012# The Author(s) 2012. This article is published with open access at Springerlink.com
Abstract This study focuses on the analysis of polysaccha-ride residues from the cell walls of fruits and vegetables:tomato, potato, pumpkin, carrot and celery root. An alcohol-insoluble residue was prepared from plant material by ex-traction using the hot ethyl alcohol method and then cellwall fractions soluble in trans-1,2-diaminocyclohexane-N,N,N′,N′-tetraacetate, sodium carbonate and alkaline solutionwere sequentially extracted. Infrared spectroscopy com-bined with Fourier transform (FT-IR) was used to evaluatedifferences among cell wall residues and among speciesafter each step of sequential extraction of pectins and hemi-celluloses. Additionally, pectic substances were identifiedusing an Automated Wet Chemistry Analyser. Principalcomponent analysis (PCA) was applied to FT-IR spectra intwo regions: 1,800–1,200 cm−1 and 1,200–800 cm−1 inorder to distinguish different components of cell wall poly-saccharides. This method also allowed us the possibility ofhighlighting the most important wavenumbers for each typeof polysaccharide: 1,740, 1,610 and 1,240 cm−1 denotingpectins or 1,370 and 1,317 cm−1 denoting hemicellulosesand cellulose, respectively.
Keywords FT-IR spectroscopy . Vegetable and fruit cellwalls . Principal component analysis . Pectin .Hemicellulose
AbbreviationsC CelluloseCDTA Trans-1,2-Diaminocyclohexane-N,N,N′,N′-
tetraacetateCWM Cell wall material
FT-IR Fourier transform infraredP PectinsPC Principal componentPCA Principal component analysisXG Xyloglucan
Introduction
The primary cell wall of fruits and vegetables mainly con-sists of various polysaccharides: pectins, hemicelulloses andcellulose, and comparably smaller amounts of structuralglycoproteins, phenolic esters, minerals and enzymes [1,2]. In the commonly accepted model of a plant cell wall,cellulose fibrils are embedded in matrix polysaccharides,which are pectins and hemicelluloses. Concentrations ofeach constituent vary according to the origin of the plant,the organs and the tissue [3]. Plant cell walls and theirconstitutive polysaccharide networks are vital with regardto the mechanical properties of the plant organ, such asstiffness or strength. In addition, the amount and structureof cell wall non-cellulosic polysaccharides changes duringdevelopment and ripening, and again during senescence offruit. During development and ripening, changes of cell wallproperties are the result of compounds’ synthesis, whereasduring post-harvest rather dominates degradation. Modifi-cations of non-cellulosic polysaccharides also have a tre-mendous effect on structure and arrangement of cellulosemicrofibrils and hence on the mechanical properties of cellwall and plant tissue [3].
Infrared spectroscopy is one of the most frequently usedspectroscopic techniques for studying plant cell wall mate-rial. The main advantage of this method is high sensitivity.Additionally, combination with Fourier transform (FT-IR)has provided a very rapid, versatile and relatively inexpen-sive tool for compounds’ identification. Transmission mode,
M. Szymanska-Chargot (*) :A. ZdunekDepartment of Microstructure and Mechanics of Biomaterials,Institute of Agrophysics, Polish Academy of Science,Doswiadczalna 4,20-290 Lublin, Polande-mail: [email protected]
Food Biophysics (2013) 8:29–42DOI 10.1007/s11483-012-9279-7

attenuated total reflectance (ATR), diffusive reflectance andmicrospectroscopy are the most common among infraredspectroscopy methods [4, 5]. Among these techniques,ATR is a very convenient sampling method, which doesn’trequire sample heating, pressing or grinding [6]. This meth-od enables saving time and avoiding treatment that couldlead to undesired structural changes of the sample.
The middle region (wavenumbers from 4,000 cm−1 to400 cm−1) of the infrared radiation is most widely used inthe study of biological objects [5–7]. The infrared absorp-tion spectrum of each compound has its own uniquepattern in the range from 1,400 cm−1 to 400 cm−1, oftencalled the fingerprint region [8]. Additionally, the regionfrom 1,800 cm−1 to 1,400 cm−1 could deliver informationabout functional groups occurring in investigated mole-cules. Infrared spectroscopy, as a very fast technique, hasfound application in carbohydrates’ investigation, espe-cially for cell wall polysaccharides with the large diversityof pectins, hemicelluloses and cellulose. The polysacchar-ides show specific positioning and intensity of bands onthe FT-IR spectra, therefore analysis of the 1,800–400 cm−1 region provides the possibility of specific car-bohydrate recognition [5, 8].
Cellulose, which is an unbranched β(1,4)-linked glucanchain, is one of the most widely investigated polysacchar-ides. Pure cellulose exists in several crystalline polymorphswith different packing arrangements, which are known ascellulose I, II, III and IV. Cellulose I, which is the mostabundant in nature, is a mixture composed of two distinctcrystalline phases, cellulose Iα and Iβ, which have the same
conformations, but differ in crystal structure—having tri-clinic (Iα) and monoclinic unit cells (Iβ). By means ofinfrared spectroscopy, both conformation changes accompa-nying the transition from cellulose I to cellulose III poly-morph and identification of allomorphic type cellulose Iα orIβ [9–12] have been observed. The hemicelluloses andpectins are a large family of cell wall compounds. The roleof pectin and hemicelluloses is to bind to cellulose micro-fibrils in cell walls. Among the large variety of hemicellu-loses, plant primary cell walls consist of xyloglucans andglucomannans, which are replaced by arabinoxylans in grassand cereal cell walls [13]. Xyloglucan coats the cellulosemicrofibrils, attaching to their surface as well as betweenmicrofibrils, limiting their aggregation. Absorption of xylo-glucan on cellulose microfibrils is practically the same in thepresence of low concentrations of pectin as in their absence.On the other hand, in the case of the presence of pectin, anincrease of xyloglucan concentration causes a decrease ofpectin absorption onto cellulose. The cellulose-pectin interac-tion seems to be weaker than the cellulose-xyloglucan inter-action [14]. Pectin is believed to form an independentnetwork, which works as a plasticizer and water binding agent[14, 15]. Pectins consist of compounds made up of a backboneof linear (1,4)-linked α-D-galacturonan and side chains main-ly ofα-D-galactopyranose,α-L-arabinofuranose andα -(1,2)-linked rhamnopyranosyl residue [5, 16–18].
The infrared investigation of pectic derivatives allows forthe possibility of determining some functional groups whichoccur in pectic compounds [19]. Exploration of region1,800–1,600 cm−1 offers the possibility of esterification
FRESH TISSUE
CELL WALL MATERIAL (CWM)
Extraction of ionically bondedpectins with CDTA
CDTA RESIDUE
Extraction of covalently bondedpectins with Na2CO3
Na2CO3 RESIDUE
Extraction of hemicelluloseswith KOH
KOH RESIDUE
Extraction with hot alcohol method
CDTA supernatant
Na2CO3 supernatant
Fig. 1 Steps of plant materialextraction
30 Food Biophysics (2013) 8:29–42

degree estimation [20, 21]. Wellner et al. observed infraredband shift when investigating the interaction of divalentcations with potassium pectate, indicating a metal coordina-tion by pectate [22]. Infrared spectroscopy of main hemi-cellulosic compounds covers identification of their specificbands and assignment of the monosaccharides constitutingthese compounds [5].
FT-IR has found application in monitoring of cell wallpolysaccharides’ extraction, as well as cell wall changesduring processing and quality control of fruits and vegeta-bles [23, 24]. FT-IR spectroscopy combined with principalcomponent analysis (PCA) has proven to be very useful forthe fast evaluation of cell wall polysaccharides’ compositionof pectic and hemicellulosic components derived from plantmaterial when applied in the wavenumber region of 1,200–800 cm−1 [23–27]. It was also proven to be useful fordetermining structural and compositional changes of cellwalls during the habituation of bean callus culturestreated by dichlobenil [8] or as result of thermal pro-cessing of pears [24]. Moreover, FT-IR with PCA was
applied to determine the degree of amidation and meth-ylesterification of pectic polysaccharides in plant cellwall extracts, and developed models were shown to bevery consistent [19–21, 27].
FT-IR most frequently analysis was performed on super-natant containing pectic and hemicellulosic extracts, forexample, from olive pulp and sun-dried pear cell walls[23–25, 28]. However, the method has not been appliedyet for the analysis of cell wall residues directly obtainedafter the extraction. Therefore, this paper will try to identifycell wall polysaccharides according to their occurrence ineach residue of extraction by FT-IR spectroscopy. The aimof this study is the analysis of differences in compositionamong cell wall residues and among plant species (fruits andvegetables) using FT-IR spectroscopy in association withPCA. This paper proposes the identification of specificwavenumbers that could discriminate the different polysac-charide constituents of cell walls according to their FT-IRspectra within two specific regions: 1,800–1,200 cm−1 and1,200–800 cm−1.
Fig. 2 FT-IR spectra in 2,000–650 cm−1 region of four residues after each step of extraction
Food Biophysics (2013) 8:29–42 31

Materials and Methods
Cell Wall Polysaccharide Extraction
The parenchyma samples of five species: pumpkin (CurcurbitaL. cv. Bambino), celery (Apium graveolens L. var. rapaceumMill. cv. Edward), carrot (Daucus carota L. cv. Finezja), toma-to (Lycopersicon esculentum Mill. cv. Plomien) and potato(Solanum tuberosum cv. Irga), which were purchased at alocal grocery market, were used for preparation of cell wallmaterial. Cell wall material (CWM) from the species wasisolated using the modified hot alcohol insoluble solids
method as proposed by Renard (2005) [29]. Briefly, thefresh slices of material were ground by several bursts ofa kitchen processor (Zauberstab, ESGE, Hockenheim,Switzerland), then dropped in hot alcohol (ethanol 70 %,temperature approx 82–85 °C) and left for 20 min ofboiling. Then material was filtered through 65 G paper filterand then washed successively in 70 % and 96 % ethanoluntil the test for sugar presence using the phenol-sulphuricmethod of Dubois et al. 1956 [30] was negative, and finallyplaced in acetone. The sample was vacuum dried.
The obtained cell walls were further subjected to fraction-ation using the method proposed by Redgwell et al. (2008)
Table 1 Comparison of FT-IR absorption bands for assignment of cellulose, pectin and xyloglucan obtained in present experiment (column a) withprevious results from refs [6, 20, 32–35] (column b). In column e, the residues of which spectra contains given frequency are denoted
a b c d eFrequency range(measured)
Frequency range(literature)
Assignment Origin Comment
1740-1730 (P) 1745-1740 C0O stretching vibration ofalkyl ester
Pectin CWM and CDTA residue
– 1650 Amid I C-N stretching Proteins Mainly in Na2CO3 residue
– 1640 H-O-H bending vibration Absorbed water Mainly in Na2CO3 residue
1600 (P) 1630–1600 COO- antisymmetric stretching Polygalacturonic acid, carboxylate(pectin ester group)
Mainly CWM and CDTA residue
– 1550 Amid II N-H deformation Proteins
1428 (C) 1426 CH2 symmetric bending Cellulose All residue, most intensive KOHresidue
1410 (P) 1400 COO- symmetric stretching Carboxylate (pectin ester group) CWM and CDTA residue
1362 (XG, C) 1370 CH2 bending Xyloglucan, Cellulose All residues
1330 (P) 1320 Ring vibration Pectin CWM and CDTA residue
1313 (C) 1317 CH2 symmetric bending Cellulose KOH residue
1268-1230 (P) 1243 C–O stretching Pectin CWM and CDTA residue
1160 (C) 1160 O–C–O asymmetric stretching Cellulose (glycosidic link) All residues
1143 (P) 1146 O–C–O asymmetric stretching Pectin (glycosidic link) All residues
1147 (XG) 1130 O–C–O asymmetric stretching Xyloglucan (glycosidic link) None
1103 (C) 1115 C–O stretching, C–C stretching Cellulose (C2-O2) KOH residue
1093 (P) 1100 C–O stretching, C–C stretching Pectin (ring) None
1071 (XG) 1075 C–O stretching, C–C stretching Xyloglucan (ring) None
Absence 1042 C–O stretching, C–C stretching Xyloglucan (ring) None
1030 (C) 1030 C–O stretching, C–C stretching Cellulose (C6-H2-O6)
1014 (P) 1019 C–O stretching, C–C stretching Pectin (C2-C3, C2-O2, C1-O1) KOH fraction
1000 (C) 1000 C–O stretching, C–C stretching Cellulose (C6-H2-O6) Na2CO3 residue (potato)
954 (P) 960 CO bending Pectin None
941 (XG) 944 Ring vibration Xyloglucan None
899 (C), 893 (XG) 895 C1-H bending Xyloglucan, Cellulose(β-anomeric link)
All residues
832 (P) 833 Ring vibration Pectin CDTA and NA2CO3 residue (potato)
Bands not assigned1416 XG
1204 C, XG
1053 C
1019 XG
888 P
32 Food Biophysics (2013) 8:29–42

[31] with some modifications. The CWM (450 mg) wasstirred in 0.1 M trans-1,2-diaminocyclohexane-N,N,N′,N′-tet-raacetic acid, (CDTA, pH 6.5, 25 mL) at 25 °C for 6 h. Then itwas filtered and the residue disolved in 0.05 M CDTA (pH6.5, 25 mL), stirred at 25 °C for 2 h and again filtered. Theresidue of this step has been called CDTA residue.
Then, the CDTA residue was stirred in 0.05 M sodiumcarbonate (Na2CO3) (30 mL) with the addition of 20 mMsodium borohydrite (NaBH4) for approximately 20 h at 1 °C,filtered, and again stirred for 2 h at 20 °C. The residue of thisstep has been called Na2CO3 residue.
Then, the Na2CO3 residue (depectinated cell walls) wasstirred firstly in 12 mL of 0.5 M potassium hydroxide(KOH) and then in 12 mL of 1 M KOH, both with anaddition of 20 mM sodium borohydride (NaBH4) each for2 h at 20 °C every time. The residue of this step has beencalled KOH residue.
All KOH residues from tissue were rinsed several times indeionised water and finally stirred in deionised water all night.At all stages of filtration a nylon filter (Millipore, pore size11 μm) was used. At every step of extraction lyophilization ofeach residue was performed and lyophilized material wasweighted. The steps of extraction are presented in Fig. 1.
All chemicals used for extraction were purchased fromSigma Aldrich and were used without further purification.
Additionally, to obtain exemplary infrared spectra of pec-tins, hemicelluloses and cellulose the following commerciallyavailable compounds were utilized: highmethylated (degree ofmethylation 80 %) and low methylated (degree of methylation30 %) pectins (Herbstreit and Fox, Neuenbürg, Germany),microcrystalline cellulose (powder, particle size~20 μm,Sigma Aldrich) and xyloglucan (tamarind, purity >95 %,Megazyme, Bray, Ireland) as the one of the most commonhemicelluloses occurring in fruits and vegetables.
FT-IR Spectroscopy
FT-IR spectra were collected with the use of a Nicolet 6700FT-IR spectrometer (Thermo Scientific, Waltham, MA,USA) with the Smart iTR ATR sampling accessory. Eachcell wall polysaccharide residue was applied on ATR aspowder. The spectra were collected over the range 4,000–650 cm−1. For each material, five samples under the sameconditions were examined. For each sample, 200 scans wereaveraged with a spectral resolution of 4 cm−1. Then for agiven material, a final average spectrum was calculated.
Fig. 3 FT IR spectra of high- and low-methylated pectins, cellulose and xyloglucan in the range of 1,800–650 cm−1
Food Biophysics (2013) 8:29–42 33

Baseline corrections were obtained using Omnic Software(Thermo Scientific).
Pectin Content
The chemical analysis of pectin content in the CDTA andNa2CO3 supernatant was performed with Automated WetChemistry Analyser also known as a Continuous FlowAnalyser (San ++, Skalar Analytical, The Netherlands). Thisis an automated procedure for colorimetric determination ofgalacturonic acid based on total decomposition of pectin(hydrolysis with sulfuric acid) sample in acidic medium.The obtained products are transformed to furfuric deriva-tives, which when reacting with 3-phenyl phenol form acoloured dye, which is measured at 530 nm. The pectincontent is expressed as galcturonic acid content in the drymass of cell wall material (mg/g).
Principal Component Analysis
Principal component analysis (PCA) is one of the mostcommonly used chemometric methods for data reductionand exploratory analysis of high-dimensional data sets.The main goal of PCA is to obtain a small set of principalcomponents (PC) that explain the most variability on thesedata sets. PCA creates a new sub-space defined by PCs,
easier to interpret than original data. It usually allows therecognition and highlighting of characteristics and theircorrelation to physico-chemical properties of the sample.This method is especially useful in the interpretation ofFT-IR spectra, which show band diversity and complicationdepending on the source of the sample. The Unscrambler10.1 (Camo Software AS., Norway) was used forperforming PCA. Each wavelength of FT-IR was treated asvariable and they were weighted by dividing by standarddeviation.
Result and Discussion
FT-IR Spectra
Figure 2 presents the spectra of investigated residues offruits and vegetables after each step of extraction in therange of 1,800–650 cm−1. These spectra were normalizedto 1.0 at 1,020 cm−1 (C-O stretching vibration). The analysisof FT-IR spectra showed that each particular polysaccharidehas a maximum of specific bands in the region 1,800–800 cm−1 that are presented in Table 1. Additionally, thereis in Table 1 comparison of infrared band assignments forcell wall polysaccharides found in literature as well asobtained in this experiment from commercially available
Fig. 4 PCA scores scatter plots of tomato, potato, carrot, celery and pumpkin cell wall FT-IR spectra in the 1,800–1,200 cm−1 region after sequentialextraction of pectins and hemicelluloses
34 Food Biophysics (2013) 8:29–42

polysacchrides. In the case of plant cell wall, polysacchar-ides are bonded with each other, therefore the shift of bandscan be observed. The spectra in this region are characterizedby strong absorption bands for specific wavenumbers,which could be assigned to pectic, hemicellulosic and cel-lulosic polysaccharides (Fig. 2) [32, 33]. Figure 3 depictsFT-IR spectra of pure plant cell wall polysaccharides.
The spectra of CWM and CDTA residues have very similarbands denoting pectins at: 1740, 1600, 1230, 1019, xyloglu-can: 1370, 1147 and cellulose 895 cm−1. However, somebands are sharper and more intensive if CDTA is comparedto CWM. For the Na2CO3 residue, the spectra bands, denotingxyloglucan and cellulose, become more visible at 1147 (XG)and 1030 (C) cm−1 (Table 1). These bands were probablymasked in CDTA and CWM by bands corresponding topectins. The KOH residue consists of mainly cellulose, butalso branched pectins and hemicelluloses, which are usuallydifficult to remove [34]. The infrared spectrum bands charac-teristic for cellulose are at 1,370, 1,317 cm−1 (which are thesharpest for KOH spectra) and also at 1,097, 1,030 and
1,000 cm−1. The band visible in Na2CO3 and KOH spectraat 1,640 cm−1 probably correspond to water in the samples[35, 36]. Additionally, this band is affected by an amid I bandcentred at 1,650 cm−1, which indicates the presence of plantproteins. The presence of proteins is also confirmed by theexistence of a band at 1,550 cm−1, which corresponds to amidII N-H vibration [20].
The main difference between spectra of CWM andCDTA residues, and Na2CO3 and KOH residues isrevealed in the range of ester bands, which do not existin the latter case. Significant differences can be noticed inthe content of each polysaccharide and pectin esterifica-tion degree, as well as the intensity, shape and ratio ofinfrared bands situated around 1,740 cm−1 (C0O, estercarbonyl groups stretching) and 1,630–1,600 cm−1 (COO−
carboxylate ion stretching band). Examples of FT-IRspectra of pectins with different esterification degree areshown in Fig. 3, where additionally cellulose and xylo-glucan spectra are presented. The higher degree of ester-ification is reflected as the higher peak intensity and a
Fig. 5 PCA loadings plots (PC1, PC2 and PC3) of tomato, potato, carrot, celery and pumpkin cell wall FT-IR spectra in the 1,800–1,200 cm−1
region after sequential extraction of pectins and hemicelluloses
Food Biophysics (2013) 8:29–42 35

peak shift to larger wavenumber band around 1,740 cm−1,and simultaneously, a decrease of the band situated at1,600 cm−1 (Fig. 3). These spectra features have beenpreviously used for evaluation of pectins’ degree of ester-ification [6, 20, 21], even though the consistency of thedetermination would be affected by water band (around1,650 cm−1).
PCA
The most preferable region of FT-IR spectra for carbohy-drates’ analysis is 1,200–850 cm−1, which is not practicallyinfluenced by bands derived from proteins and water mole-cules, but the region of 1,800–1,200 cm−1 was also previ-ously used for PCA [23–26, 28]. The wavenumbers in thenarrow region of 1,800–1,500 cm−1 are related to the car-bonyl esters’ and carboxylates’ vibration, which reflects thepectic substances’ content [20, 21]. The region at 1,200–850 cm−1 is dominated by stretching vibrations of C – O, C– C, ring structures and deformation of CH2 groups’ vibra-tion characteristic for polysaccharides and is therefore usefulin their identification [17]. However, the bands characteris-tic for each polysaccharide are located closely to each other,and in the case of a polisaccharides’ mixture, this wouldcause problems with detection due to absorbance overlap-ping [5]. The common methods of polysaccharide extraction
are imperfect hence in the very last residue, besides thecellulose, branched pectins and hemicelluloses are also pres-ent [34]. It can clearly be seen from a comparison of Figs. 2and 3 that in the spectra of KOH residue, where only bandsfor pure cellulose should be present, in fact bands charac-teristic for pectic and hemicellulosic polysaccharides couldalso be found. This suggests implementing the PCA to bothregions 1,800–1,200 cm−1 and 1,200–850 cm−1 to obtain themost complete information about investigated samples.
The PCA was carried out for 1) distinction cell wallresidues within the studied species in terms of polysaccha-ride content and 2) revealing differences between species forthe studied cell wall residues. The analysis were carried outwithin the two spectral ranges of FT-IR spectra. In eachvariant, three principal components were enough to explaindifferences among samples. For each residue/species sam-ple, five FT-IR spectra were recorded which are replicatesshown in PCA graphs.
Discrimination of Cell Wall Residues
1800–1200 cm−1 Region The scores scatter plots PC1(explained above 90 % of variability)×PC2 (explained around2–8 % of variability) were used to obtain separation of eachgroup in the 1,800–1,200 cm−1 region (Fig. 4). Although themajor of variability was explained by PC1, it seems that PC1
Fig. 6 PCA scores scatter plots of tomato, potato, carrot, celery and pumpkin cell wall FT-IR spectra in the 1,200–850 cm−1 region after sequentialextraction of pectins and hemicelluloses
36 Food Biophysics (2013) 8:29–42
only varies scores within each group, indicating that PC1could reflect the standard deviation of recorded spectra. Thescores scatter plot PC1 vs. PC2 (Fig. 4) indicates that the cellwall residues are grouped along the PC2 axis and scatteredalong the PC1 axis. The scores of residues abundant in pecticsubstances (CWM and CDTA) lay on the positive side of PC2scores, while residues Na2CO3 and KOH, which are rich inhemicelluloses and celluloses, were on the negative side ofPC2 (Fig. 4). In Fig. 4 the tendency for the location of scoresin four groups in a pattern going from positive to negativevalues of PC2:CWM, CDTA, Na2CO3 and KOH residue,which could reflect the subsequent steps of extraction, canbe seen. Variable loadings for PC2 presented in Fig. 5 showpeaks at 1,740, 1,610 and 1,230 cm−1 that are characteristicfor the wavenumbers corresponding to pectic polysaccharides(Fig. 5). Whereas negative PC2 loading appeared for wave-numbers at 1,370 and 1,317 cm−1 characteristic for hemi-cellulosic and cellulosic polysaccharides, respectively.
The plot of PC2×PC3 (PC3 explains about 1 % of vari-ability), which is not shown in this paper, revealed less clear
groupings and interpretation of the loadings was not asstraightforward as it was in the case of the first two compo-nents (loading along PC3 are shown in Fig. 5). The signif-icant bands of positive loading in PC3 were at 1,650 (carrot,tomato) and 1,550 (tomato) cm−1, which corresponds toamid I and amid II vibrations, respectively, and denotesthe presence of proteins in plant cell wall material. However,in the case of pumpkin and celery, these wavelengths hadnegative impact on the scores. Also confusingly, positivevalues of loading were observed for wavenumbers at 1,410,1,370 and 1,317 cm−1 (cellulose bands) for pumpkin andcelery samples, whereas for potato, carrot and tomato sam-ples, loadings for these wavelengths were negative (Fig. 5).
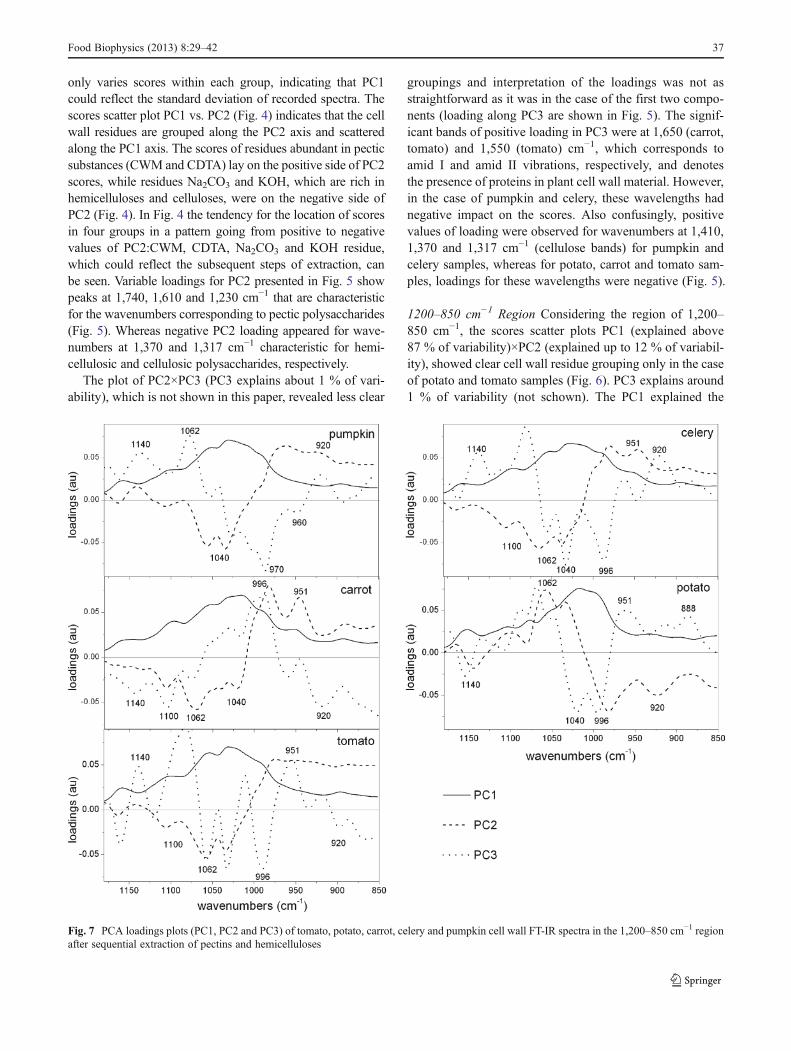
1200–850 cm−1 Region Considering the region of 1,200–850 cm−1, the scores scatter plots PC1 (explained above87 % of variability)×PC2 (explained up to 12 % of variabil-ity), showed clear cell wall residue grouping only in the caseof potato and tomato samples (Fig. 6). PC3 explains around1 % of variability (not schown). The PC1 explained the
Fig. 7 PCA loadings plots (PC1, PC2 and PC3) of tomato, potato, carrot, celery and pumpkin cell wall FT-IR spectra in the 1,200–850 cm−1 regionafter sequential extraction of pectins and hemicelluloses
Food Biophysics (2013) 8:29–42 37

majority of variability and its loadings had only positivevalues (Fig. 7), however, scores within groups are randomlyscattered along PC1 axis. Common among species, signifi-cant bands on PC2 loading have positive influence (apartfrom potato samples) on scores around 970 cm−1 (pectins)and negative around 1,035 cm−1 (cellulose) (Fig. 7). Whilefor PC3 loadings, the wavenumbers which positively influ-ence the scores are around 1,070 cm−1, denoting xyloglu-can, and around 1,140 and 960 cm−1 denoting pectins (apartfrom carrot samples). Loadings with negative values usuallyoccur at 1,030 and 996 cm−1, which are close to wave-number characteristics for cellulose vibration bands.
To summarize this part, the two bands analysed abovesuggest that for the each sample the region of 1,800–1,200 cm−1 discriminates cell wall residues. Each residuewas well separated and scores varied the most significantlyalong the PC2. The loadings indicate that positive influenceon scores have wavenumbers denoting pectins (1,740, 1,610and 1,240 cm−1) and negative on scores have wavenumbersdenoting hemicelluloses and cellulose (1,370 and1,317 cm−1, respectively). Therefore, residues with highcontent of pectins (CWM and CDTA) lie on the positiveside of the PC2 axis and residues with only hemicellulose
and cellulose content (Na2CO3 and KOH) lie on the nega-tive side.
Discrimination of Species
1800–1200 cm−1 Region Similar to cell wall residue dis-crimination, the scores scatter plots PC1×PC2 andPC2×PC3 were used to separate the five investigatedspecies.
The scores scatter plots PC1 (explained above 91 % ofvariability, figure not shown)×PC2 (explained around 4–6 % of variability) and PC2×PC3 (explained around 2 %of variability) were used to obtain separation of each group,but only in the PC2×PC3 (3 % of explained variability) plotwas the grouping visible (Fig. 8). The PCA of CWM residueshowed only a small grouping effect for species (Fig. 8).Only pumpkin, potato and carrot scores are grouped sepa-rately as scores for tomato and celery samples are mixedtogether. The component PC1 explains 92 % of variability,however, its loadings took only positive values and scoreswere again scattered along this axis (figure not shown).Only the potato CWM sample lay on the negative side ofthe PC2 axis (5 % of explained variability), the remaining
Fig. 8 PCA scores scatter plots of the FT-IR spectra of CWM, CDTA, Na2CO3 and KOH residue obtained by sequential extraction of tomato,potato, carrot, celery and pumpkin cell wall in the 1,800–1,200 cm−1 region
38 Food Biophysics (2013) 8:29–42

samples lay on its positive side or oscillated around zero(Fig. 8). PC2 loading had only one significant positive max-imum corresponding to the 1,600 cm−1, which denotes COO−
antisymmetric stretching of ester groups in pectins (Fig. 9).PC3 loadings took positive values around 1,650 and1,550 cm−1, which corresponds to amid I and amid II infraredbands, respectively, and a negative value for 1,600 cm−1.
In the case of CDTA, the residue grouping effect of thestudied species was more visible on both scatter plotsPC1×PC2 (not shown) and PC2×PC3 (Fig. 8) with scoresdispersed along the PC1 axis. The loadings in the case ofPC2 obtained positive values at 1,740 and 1,600, 1,400 and1,240 cm−1 corresponding to functional group vibrations inpectins (Fig. 9). The negative impact on the scores hadwavelengths at 1,650, 1,550 (amid I and amid II), 1,430and 1,360 cm−1 (cellulose vibration bands). In the case ofPC3, a positive impact on scores corresponds to wavenum-bers denoting vibration for cellulose: 1,360 cm−1 and pec-tins: 1,400 cm−1. Whereas negative impact on scorescorresponds to wavenumbers: 1,740 and 1,240 cm−1 denot-ing vibration for pectins and wavenumber 1,550 cm−1
denoting vibration for amid II.In Na2CO3 and KOH residues, the grouping of species was
very similar, as well as loadings for specific components
(Figs. 8 and 9). Significant values for PC1 appeared at 1,600and 1,400 cm−1 which were characteristic for pectins, and1,317 cm−1, which was characteristic for cellulose and waspositive. There were in fact two loadings having positiveimpact on PC2 scores: strong around 1,600 cm−1 and smalleraround 1,410 cm−1, both denoting pectins. The negative im-pact had values around 1,430 and 1,360 cm−1 which arecharacteristic for cellulose. For PC3 there were two strongpositive values around 1,650 and 1,550 cm−1 (amid I and amidII bands) and two negative, 1,630 and 1,410 cm−1, typical forpectins and cellulose, respectively.
1200–850 cm−1 Region The scores scatter plots PC1(explained above 93 % of variability)×PC2 (explainedaround 2–7 % of variability) and PC2×PC3 (explained1 % of variability) were used to obtain separation of eachgroup, but only in the PC2×PC3 plot was the groupingvisible (Fig. 10). Similar to the previous analyses, scoreswere scattered along the PC1 axis and its loadings had onlypositive values. The smallest grouping effect was obtainedin the case of CWM for this spectral region. The PC3loading obtained for every four sets of variables (CWM,CDTA, Na2CO3 and KOH) had significant positive valuecorresponding to 1,100 cm-1 (cellulose) and to 951 cm−1
Fig. 9 PCA loadings plots (PC1, PC2 and PC3) of the FT-IR spectra of CWM, CDTA, Na2CO3 and KOH residues obtained by sequentialextraction of tomato, potato, carrot, celery and pumpkin cell wall in the 1,800–1,200 cm−1 region
Food Biophysics (2013) 8:29–42 39

(pectins), but in the case of the second wavelength its valuedecreased to zero in the last residue (KOH) (Fig. 11). Neg-ative influence had a wavenumber around 1,042 and1,000 cm−1 (bands assigned to cellulose) for scores ofCWM and CDTA residues. In the case of Na2CO3 andKOH residues, loadings for 1,042 cm−1 changed their valuesto positive, while for 1,000 cm−1, loadings remainednegative.
PC2 loadings indicated that positive influence on CWMscores had values around 1,100 (cellulose), 1,070 and1,020 cm−1 (xyloglucan), whereas negative at 970, 927and 888 cm−1, which could be assigned to pectins. Thispattern is similar for CDTA and Na2CO3 residues, but1,020 is shifted to 1,030 cm−1 (band assigned to cellulose)and there is lack of a minimum around 888 cm−1
. Thebiggest differences in loadings maximums and minimumswere obtained for KOH residue PC3 loadings: positiveinfluence was at 1,100 cm−1 (cellulose) and 951 cm−1
(pectins), and negative at 1,015 cm−1 (cellulose). The pres-ence of a wavenumber which can be assigned to pectins orhemicellulose in KOH residue confirms that a part of thebranched non-cellulosic polysaccharides are hard to removefrom between the cellulose microfibrils [34].
Although a similar grouping effect for both of the chosenregions was obtained, a more pronounced grouping effectwas achieved for the region 1,200–850 cm−1 and with use ofPC2 and PC3 components. The groups were probably cre-ated due to pectin and hemicellulose content. Generally, theprimary cell wall of plants consists of 25 % cellulose, 25 %hemicellulose, 35 % pectins, 1–8 % structural proteins, 1–5 % minerals and 2 % phenolics compounds (% of dryweight), but it must be remembered that these values canvary between species [3, 37]. In Table 2 the results of pectincontent in CDTA and Na2CO3 supernatants (as a galactur-onic acid content mg/g of dry mass of CWM residue) areshown. These values of pectin content are in good agree-ment with values obtained previously [38–42]. The mostseparated groups have been obtained for the potato sample.By comparing this result with Table 2 it can be concludedthat potato contains the lowest content of ionically andcovalently-bonded pectins among the samples. In theCWM residues, scores for other species are mixed together(not separated), however, for tomato, which is characterizedby one of the biggest values of pectin content in the CDTAsupernatant, all scores lie on the positive side of PC2 axis.Again for CDTA residue, scores (PC2×PC3) for potato and
Fig. 10 PCA scores scatter plots of the FT-IR spectra of CWM, CDTA, Na2CO3 and KOH residue obtained by sequential extraction of tomato,potato, carrot, celery and pumpkin cell wall in the 1,200–850 cm−1 region
40 Food Biophysics (2013) 8:29–42

pumpkin, with the lowest content of covalently-bondedpectins, lie on the negative side of the PC3 axis. Scoresfor the remaining samples are arranged into groups, whichare close to each other.
Conclusion
This study showed that discrimination between the cellwall residues of fruits and vegetables is possible withthe use of FT-IR spectra in the regions 1,800–1,200 cm−1 and
1,200–850 cm−1 analysed using the PCA method, however,better distinction was obtained for region 1,800–1,200 cm−1.The grouping is due to the pectin content and separation inPC2, and significant positive loadings of FT-IR absorbanciesfor residues distinction are: 1,740, 1,610 and 1,240 cm−1.The residues abundant in hemicelluloses and cellulose areseparated in PC2 by the wavenumbers of 1,370 and1,317 cm−1, which influence the scores negatively. Theseresults suggest that analysis of polysaccharides from cell wallscan be successfully performed directly from subsequentresidues.
The differences among species when all polysaccha-ride residues are considered are most highlighted whenthe PCA is implemented on the FT-IR region 1,200–850 cm−1. The species mainly vary due to the contentof ionically or covalently-bonded pectins (CWM andCDTA residues). However, species distinction by PCAwas not as clear as in the case of discrimination of cellwall residues.
Acknowledgments The research was co-founded by National Centreof Science (research grant nr 2011/01/D/NZ9/02494).
Fig. 11 PCA loadings plots (PC1, PC2 and PC3) of the FT-IR spectra of CWM, CDTA, Na2CO3 and KOH residues obtained by sequentialextraction of tomato, potato, carrot, celery and pumpkin cell wall in the 1,200–800 cm−1 region
Table 2 Pectin content in cell wall material from chosen vegetables ascontent of galacturonic acid (Gal A mg/g of dry mass of CWM). Inparenthesis standard deviation
Sample Gal A content (mg/g dry mass CWM)
CDTA and Na2CO3 supernatant Na2CO3 supernatant
Potato 46,64 (±2,18) 28,49 (±0,24)
Pumpkin 102,95 (±0,72) 20,40 (±0,36)
Carrot 141,95 (±1,80) 35,12 (±0,49)
Tomato 253,04 (±2,44) 56,16 (±0,82)
Celery root 282,78 (±10,18) 114,64 (±7,32)
Food Biophysics (2013) 8:29–42 41

Open Access This article is distributed under the terms of the CreativeCommons Attribution License which permits any use, distribution, andreproduction in any medium, provided the original author(s) and thesource are credited.
References
1. C. Brett, K. Waldron, Physiology and Biochemistry of Plant CellWall, Topics in Plant Physiology (Unwin Hyman Ltd, London,1990), pp. 4–22
2. N.C. Carpita, D.M. Gibeaut, Plant J. 3, 1–30 (1993)3. L. Taiz, E. Zeiger, Plant Physiology, 3rd edn. (Sinauer Associates,
Sunderland, 2002), pp. 314–3374. P.R. Griffiths, J.A. De Haseth, Fourier Transform Infrared Spec-
trometry, 2nd edn. (Wiley, 2007), pp 321–3625. M. Kačurakova, R.H. Wilson, Carbohydr. Pol. 44, 291–303 (2001)6. A. Fellah, P. Anjukandi, M.R. Waterland, M.A.K. Williams,
Carbohydr. Pol. 78, 847–853 (2009)7. M. Černa, A.S. Barros, A. Nunes, S.M. Rocha, I. Delgadillo,
J. Čopikova, M.A. Coimbra, Carbohydr. Pol. 51, 383–389(2003)
8. A. Alonso-Simon, A.E. Encina, P. Garcia-Angulo, J.M. Alvarez,J.L. Acebes, Plant Sci. 167, 1273–1281 (2004)
9. E. Gümüskaya, M. Usta, H. Kirci, Polym. Degrad. Stab. 81, 559–564 (2003)
10. C. Rondeau-Mouro, B. Bouchet, B.P. Pontoire, R.J. Mazoyer, A.Buléon, Carbohydr. Pol. 53, 241–252 (2003)
11. M. Szymańska-Chargot, J. Cybulska, A. Zdunek, Sensors 11,5543–5560 (2011)
12. R.G. Zhbankov, S.P. Firsov, D.K. Buslov, N.A. Nikonenko,M.K. Marchewka, H. Ratajczak, J. Mol. Struct. 614, 117–125(2002)
13. M.C. Jarvis, Food Hydrocoll. 25, 257–262 (2011)14. A. Zykwinska, J.-F. Thibault, M.-C. Ralet, Carbohydr. Pol. 74,
957–961 (2008)15. R.H. Atalla, J.M. Hackney, I. Uhlin, N.S. Thompson, Int. J. Biol.
Macromol. 15, 109–112 (1993)16. K.H. Caffall, D. Mohnen, Carbohydr. Res. 344, 1879–1900 (2009)17. M. Kačurakova, P. Capek, V. Sasinkova, N.Wellner, A. Ebringerova,
Carbohydr. Pol. 43, 195–203 (2000)18. D. Mohnen, Curr. Opin. Plant Biol. 11, 266–277 (2008)19. S.B. Engelsen, L. Norgaard, Carbohydr. Pol. 30, 9–24 (1996)
20. A.K. Chatjigakis, C. Pappas, N. Proxenia, O. Kalantzi, P. Rodis,M. Polissiou, Carbohydr. Pol. 37, 395–408 (1998)
21. R. Gnansambandam, A. Proctor, Food Chem. 68(327–332)(2000)
22. N. Wellner, M. Kačurakova, A. Malovikova, R.H. Wilson, P.S.Belton, Carbohydr. Res. 308, 123–131 (1998)
23. A.S. Barros, I. Mafra, D. Ferreira, S. Cardoso, A. Reis, J.A. Lopesda Silva, I. Delgadillo, D.N. Rutledge, M.A. Coimbra, Carbohydr.Pol. 50, 85–94 (2002)
24. D. Ferreira, A. Barros, M.A. Coimbra, I. Delgadillo, Carbohydr.Pol. 45, 175–182 (2001)
25. M.A. Coimbra, A. Barros, D.N. Rutledge, I. Delgadillo, Carbo-hydr. Res. 317, 145–154 (1999)
26. R. Hori, J. Sugiyama, Carbohydr. Pol. 52, 449–453 (2003)27. H. Winning, N. Viereck, T. Salomonsen, J. Larsen, S.B. Engelsen,
Carbohydr. Res. 344, 1833–1841 (2009)28. M.A. Coimbra, A. Barros, M. Barros, D.N. Rutledge, I. Delgadillo,
Carbohydr. Pol. 37, 241–248 (1998)29. C.M.G.C. Renard, Carbohydr. Pol. 60, 512–522 (2005)30. M. Dubois, K.A. Gilles, J.K. Hamilton, P.A. Rebers, F. Smith,
Anal. Chem. 28, 350–356 (1956)31. R.J. Redgwell, D. Curti, C. Gehin-Delval, Eur. Food Res. Technol.
227, 607–618 (2008)32. M. Kačurakova, A.C. Smith, M.J. Gidley, R.H. Wilson, Carbo-
hydr. Res. 337, 1145–1153 (2002)33. C.F.B. Sene, M.C. McCann, R.H. Wilson, R. Grinter, Plant Phys-
iol. 106, 1623–1631 (2004)34. S.C. Fry, The Growing Plant Cell Wall: Chemical and Metabolic
Analysis (The Blackburn Press. Longman Scientific & Technical,UK, 1988), pp. 64–65
35. A. Synytsya, J. Čopikova, P. Matĕjka, V. Machovič, Carbohydr.Pol. 54, 97–106 (2003)
36. R.H.Wilson,A.C. Smith,M. Kačurakova, P.K. Saunders, N.Wellner,K.W. Waldron, Plant Physiol. 124, 397–405 (2000)
37. J. Cybulska, K. Konstankiewicz, A. Zdunek, K. Skrzypiec, Int.Agrophys. 24, 107–114 (2010)
38. K.C. Gross, S.J. Wallner, Plant Physiol. 63, 117–120 (1979)39. K. Houben, R.P. Jolie, I. Fraye, A.M. Van Loey, M.E. Henddrickx,
Carbohydr. Res. 346, 1105–1111 (2011)40. M.C. Jarvis, M.A. Hall, D.R. Trelfall, J. Friend, Planta 152, 93–
100 (1981)41. M.C. Jarvis, Planta 154, 344–346 (1982)42. A. Kotcharian, H. Kunzek, G. Dongowski, Food Chem. 87, 231–
245 (2004)
42 Food Biophysics (2013) 8:29–42