Usage Uneveness in Child Language Supports …ycharles/papers/bucld2011.pdf · Usage Uneveness in...
22
Usage Uneveness in Child Language Supports Grammar Productivity Charles Yang Department of Linguistics, Computer Science & Psychology Institute for Research in Cognitive Science University of Pennsylvania BUCLD 2011 1
Transcript of Usage Uneveness in Child Language Supports …ycharles/papers/bucld2011.pdf · Usage Uneveness in...

Usage Uneveness in Child Language Supports Grammar
Productivity
Charles YangDepartment of Linguistics, Computer Science & Psychology
Institute for Research in Cognitive ScienceUniversity of Pennsylvania
BUCLD 2011
1

Saying and Knowing
★ What one says might not know reflect what knows about language
★ Bellugi, Bloom, Bowerman, Brown, Cazden, C. Chomsky, N. Chomsky, Fraser, McNeill, Schlesinger, Slobin
★ Shipley, Smith & Gleitman (1969, Language) on telegraphic speech
★ Not everything that one knows will be said (e.g., islands)
★ Competence/performance

The usage-based turn
★“(w)hen young children have something they want to say, they sometimes have a set expression readily available and so they simply retrieve that expression from their stored linguistic experience” (Tomasello 2000, 77)”
★Chief evidence: limited range of combinatorial diversity
★Verb Island Hypothesis (Tomasello 1992): “Of the 162 verbs and predicate terms used, almost half were used in one and only one construction type, and over two-thirds were used in either one or two construction types.”
★Morphology (Pizutto & Caselli 1994): Italian children use only 13% of stems in 4 or more person-number agreement forms.

A simple observation
★ “give me X”, a highly frequent expression, is often cited as evidence of the child using formulaic expressions
★ From the Harvard children
★ give me: 93, give him: 15, give her: 12, or 7.75 : 1.23 : 1
★ me: 2870, him: 466, her: 364, or 7.88 : 1.28 : 1
★ Need to work out a proper baseline
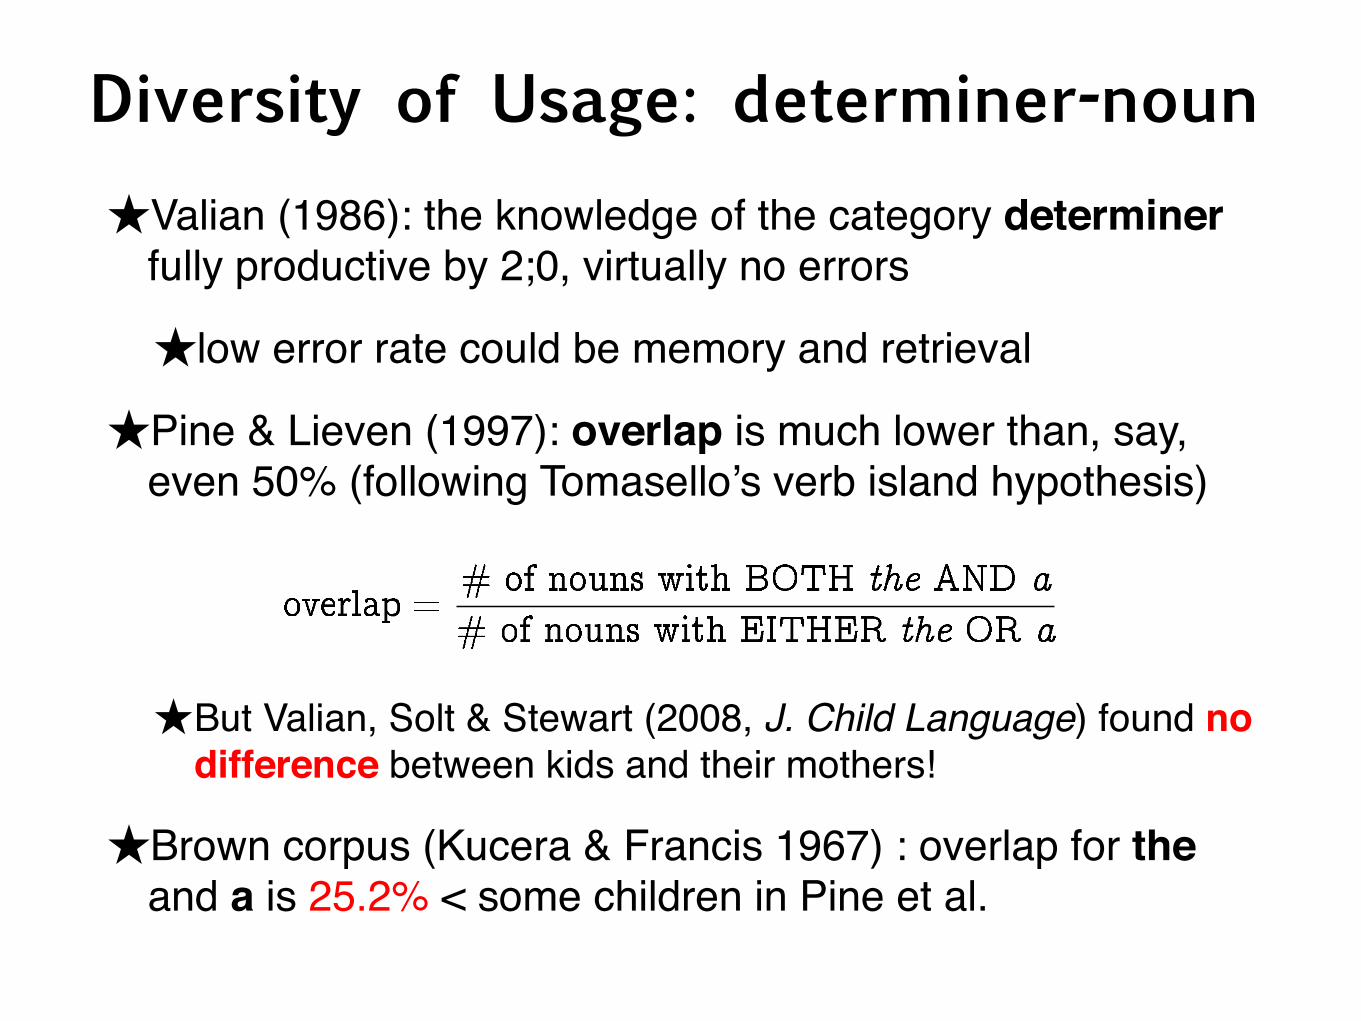
★Valian (1986): the knowledge of the category determiner fully productive by 2;0, virtually no errors
★low error rate could be memory and retrieval
★Pine & Lieven (1997): overlap is much lower than, say, even 50% (following Tomasello’s verb island hypothesis)
★But Valian, Solt & Stewart (2008, J. Child Language) found no difference between kids and their mothers!
★Brown corpus (Kucera & Francis 1967) : overlap for the and a is 25.2% < some children in Pine et al.
Diversity of Usage: determiner-noun

Zipf’s long tail
★ Excellent fit across languages and genres (Baroni 2008)
★ allows one to approximate frequencies of words without even knowing what they are

The Grammar Hypothesis★ Assume DP⇒DN is completely productive: combination is
independent
★ D⇒a/the, N⇒cat, book, desk, water, dog ...
★ other phrases/structures can be analyzed similarly
★Given the Zipfian distribution of words, overlap is necessarily low
★Most nouns will be sampled only once in the data: zero overlap
★ If a noun is sampled multiple times, there is still a good chance that it is paired with only one determiner, which also results in zero overlap
★ If the determiner frequencies are Zipfian as well, this makes the overlap even lower
Imbalanced determiners
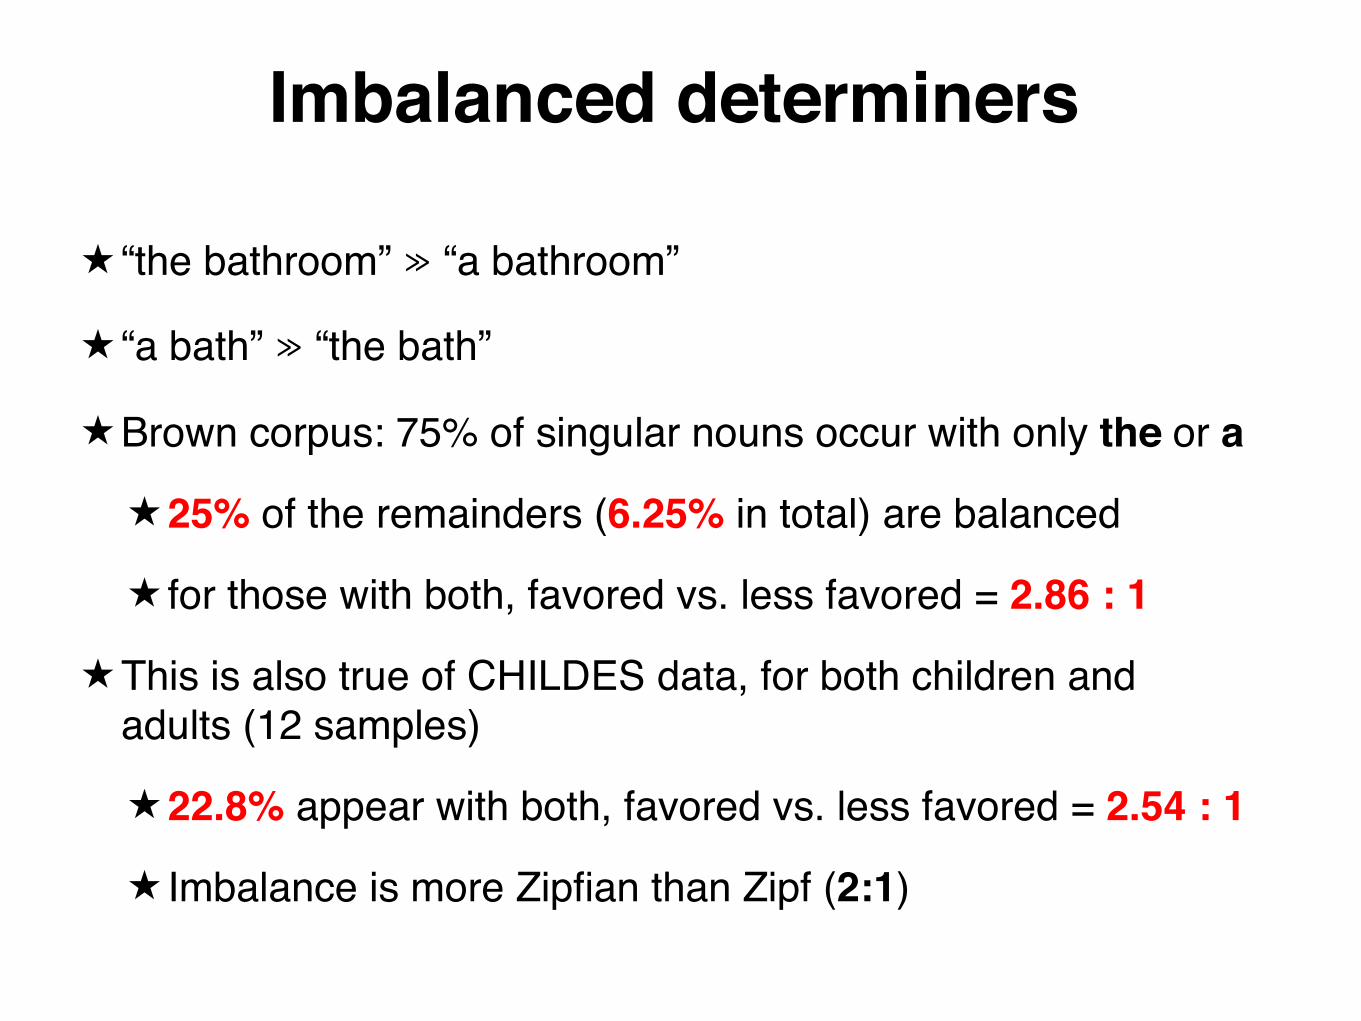
★ “the bathroom” ≫ “a bathroom”
★ “a bath” ≫ “the bath”
★Brown corpus: 75% of singular nouns occur with only the or a
★25% of the remainders (6.25% in total) are balanced
★ for those with both, favored vs. less favored = 2.86 : 1
★This is also true of CHILDES data, for both children and adults (12 samples)
★22.8% appear with both, favored vs. less favored = 2.54 : 1
★ Imbalance is more Zipfian than Zipf (2:1)

Zipfian Probabilities
★ The rth word has probability of Pr
★ We can approximate the occurrences of nouns and determiners in any sample accurately, regardless of their identities
expectedoverlap
expectedoverlap
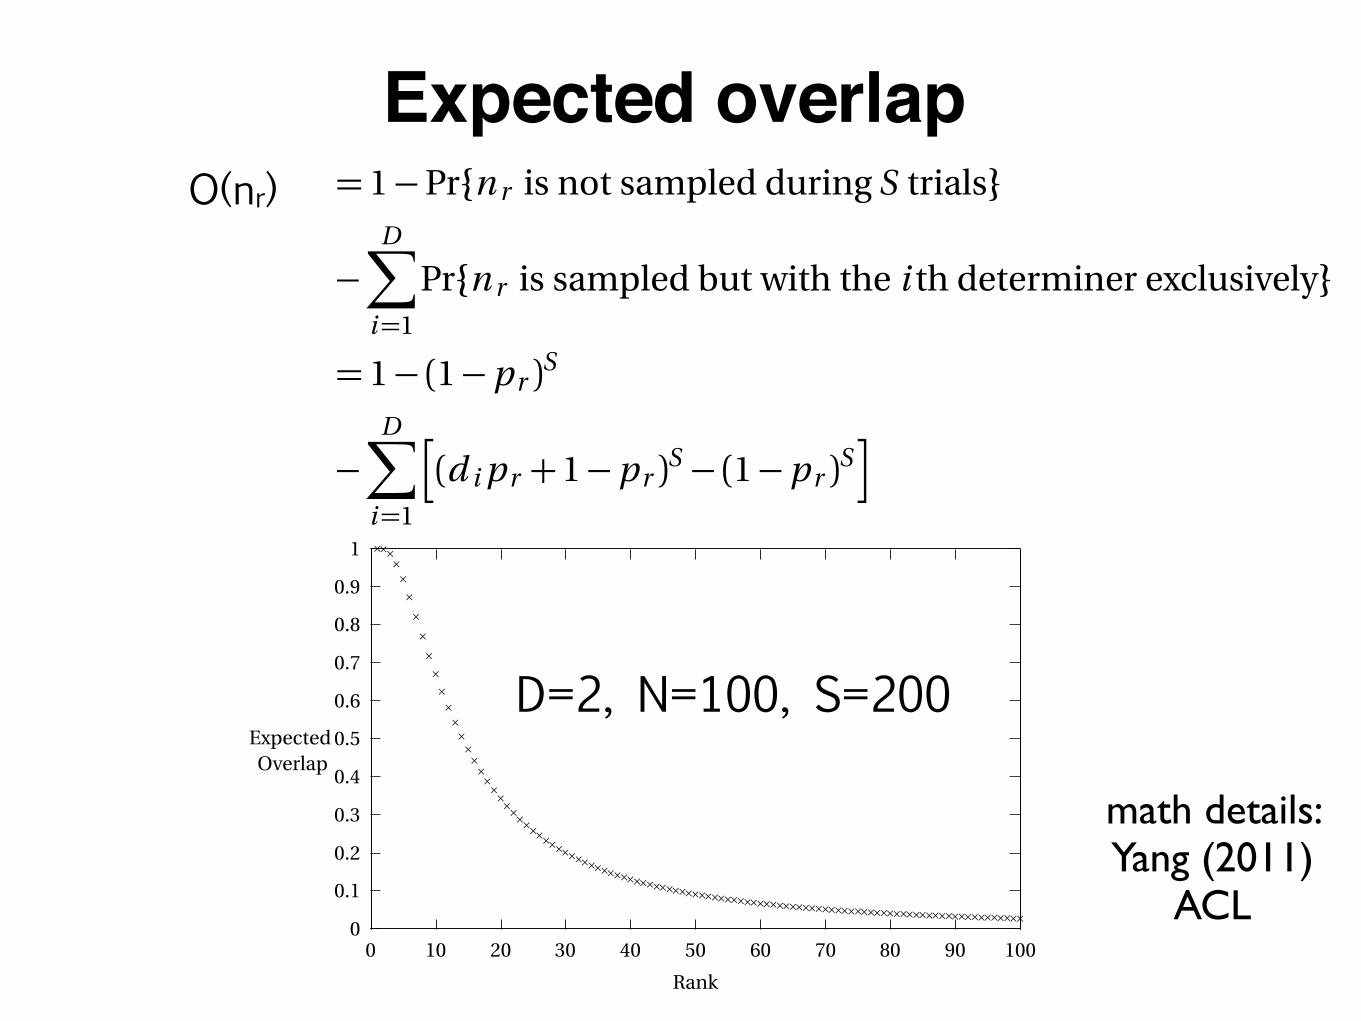
Expected overlap
language acquisition.
3 Quantifying Productivity
3.1 Theoretical analysis
Consider a sample (N , D,S), which consists of N unique nouns, D unique determiners, and Sdeterminer-noun pairs. In the present case, D = 2 for “the” and “a”, but our analysis below isapplicable to the general case. The nouns that have appeared with more than one (i.e. two)determiners will have an overlap value of 1; otherwise, they have the overlap value of 0. Theoverlap value for the entire sample will be the number of 1’s divided by N .
Our analysis calculates the expected value of the overlap value for the sample (N , D,S) underthe productive rule “DP⇥D N”; let it be O(N , D,S). This requires the calculation of the expectedoverlap value for each of the N nouns over all possible compositions of the sample. Consider thenoun n r with the rank r out of N . Following equation (3), it has the probability pr = 1/(r HN )of being drawn at any single trial in S. Let the expected overlap value of n r be O(r, N , D,S). Theoverlap for the sample can be stated as:
(4)
O(D, N ,S) =1N
N�
r=1
O(r, N , D,S)
Consider now the calculation O(r, N , D,S). Since n r has the overlap value of 1 if and only if ithas been used with more than one determiners in the sample, we have:
(5)
O(r, N , D,S) = 1�Pr{n r is not sampled during S trials}
�D�
i=1
Pr{n r is sampled but with the i th determiner exclusively}
= 1� (1�pr )S
�D�
i=1
⇥(d i pr +1�pr )S � (1�pr )S
⇤
The last term in (5) requires a brief comment. Under the hypothesis that the language learnerhas a productive rule “DP⇥D N”, the combination of determiner and noun is independent.Therefore, the probability of noun n r combining with the i th determiner is the product of theirprobabilities, or d i pr . The multinomial expression
(p1+p2+ ...+pr�1+d i pr +pr+1+ ...+pN )S
8
O(nr)
0
0.1
0.2
0.3
0.4
0.5
0.6
0.7
0.8
0.9
1
0 10 20 30 40 50 60 70 80 90 100
ExpectedOverlap
Rank
����������������������������������������������������������������������������������������������������
Figure 4. Expected overlap values for nouns ordered by rank, for N = 100 nouns in a sample size of S = 200 withD = 2 determiners. Word frequencies are assumed to follow the Zipfian distribution. As can be seen, few of nounshave high probabilities of occurring with both determiners, but most are (far) below chance. The average overlap
is 21.1%.
Under Zipfian distribution of categories and their productive combinations, low overlap values area mathematical necessity. As we shall see, the theoretical formulation here nearly perfectly match thedistributional patterns in child language, to which we turn presently.
3.2 Determiners and productivity
Methods. To study the determiner system in child language, we consider the data from six childrenAdam, Eve, Sarah, Naomi, Nina, and Peter. These are the all and only children in the CHILDES database(MacWhinney 2000) with substantial longitudinal data that starts at the very beginning of syntactic de-velopment (i.e, one or two word stage) so that the item-based stage, if exists, could be observed. Forcomparison, we also consider the overlap measure of the Brown corpus (Kucera & Francis 1967), forwhich productivity is not in doubt.
We first removed the extraneous annotations from the child text and then applied an open sourceimplementation of a rule-based part-of-speech tagger (Brill 1995):5 words are now associated with theirpart-of-speech (e.g., preposition, singular noun, past tense verb, etc.). For languages such as English,which has relatively salient cues for part-of-speech (e.g., rigid word order, low degree of morphologicalsyncretism), such taggers can achieve high accuracy at over 97%. This already low error rate causes evenless concern for our study, since the determiners “a” and “the” are not ambiguous and are always cor-rectly tagged, which reliably contributes to the tagging of the words that follow them. The Brown Corpusis available with manually assigned part-of-speech tags so no computational tagging is necessary.
With tagged datasets, we extracted adjacent determiner-noun pairs for which D is either “a” or “the”,and N has been tagged as a singular noun. Words that are marked as unknown, largely unintelligible
5Available at http://gposttl.sourceforge.net/.
10
D=2, N=100, S=200
math details: Yang (2011)
ACL

Empirical Data
★ Children: Adam, Eve, Sarah, Nina, Naomi, Peter
★ All children in CHILDES that started at one/two word stage and with reasonably large longitudinal samples
★ Used a variant of the Brill tagger (1995) with statistical information for disambiguation (gposttl.sourceforge.net): sufficiently adequate due to the unambiguity of “a” and “the”
★ extract D-Nsg pairs
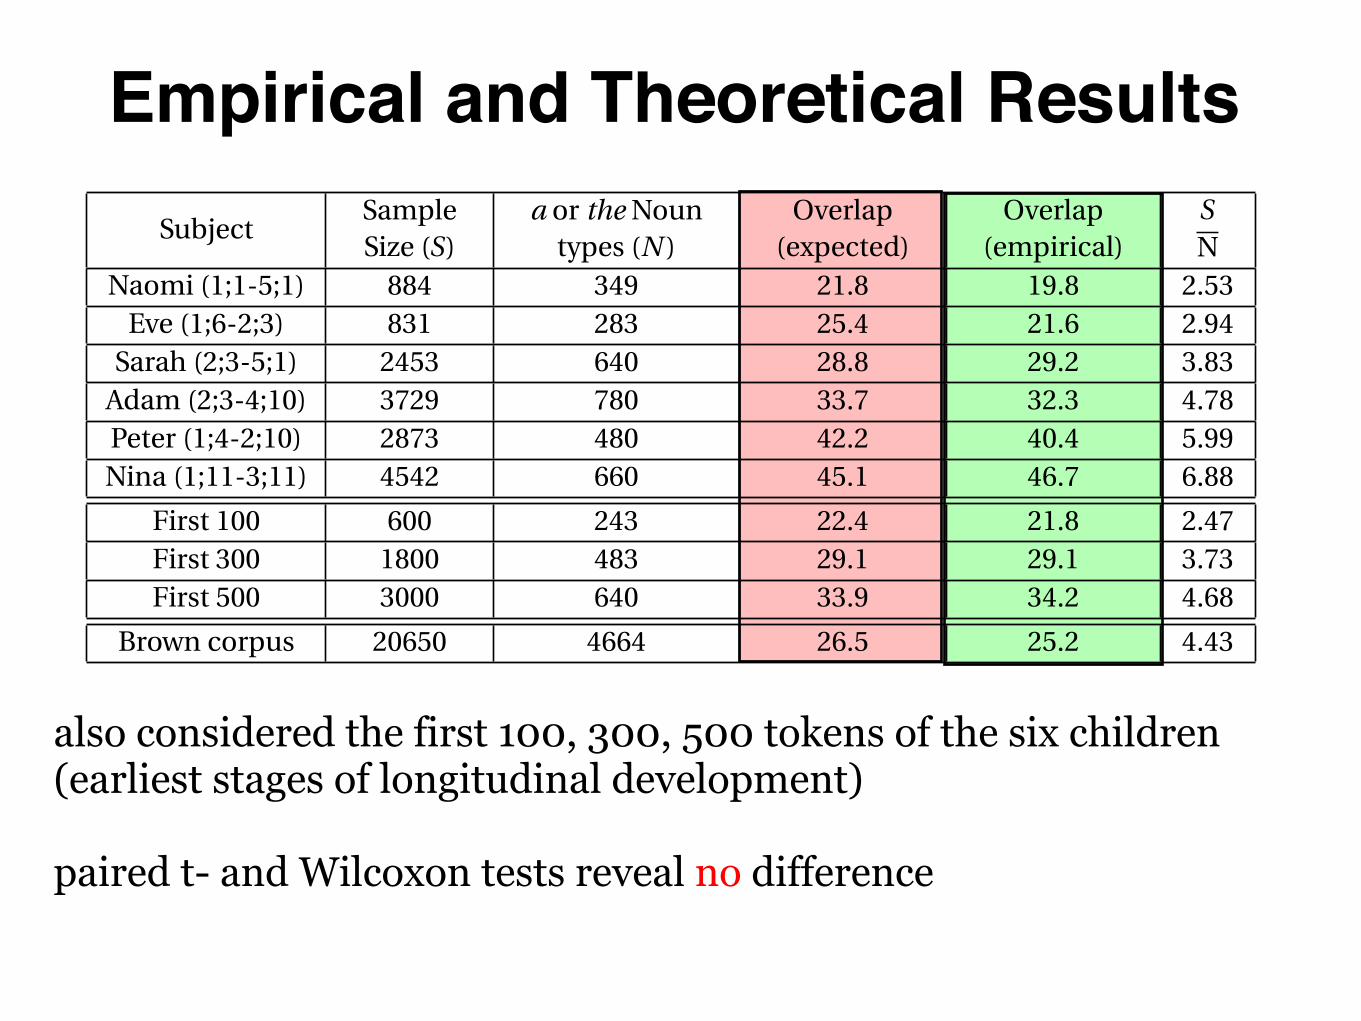
Empirical and Theoretical Results
also considered the first 100, 300, 500 tokens of the six children(earliest stages of longitudinal development)
paired t- and Wilcoxon tests reveal no difference
transcriptions with special marks, are discarded. As is standard in child language research, consecutiverepetitions count only once toward the tally. For instance, when the child says “I made a queen. I madea queen. I made a queen”, “a queen” is counted once for the sample.
In an additional test suggested by Virginia Valian (personal communication), we pooled together thefirst 100, 300, and 500 determiner-noun tokens of the six children and created three hypothetical childrenfrom the very earliest stages of language acquisition, which would presumably be the least productiveknowledge of determiner usage.
For each child, the theoretical expectation of overlap is calculated based on equations in (3)—(4),that is, only with the sample size S and the number of unique nouns N in determiner-noun pairs whileD = 2. These expectations are then compared against the empirical overlap values computed from thedeterminer-noun samples extracted with the methods above. The results are summarized in Table 1.
SubjectSampleSize (S)
a or the Nountypes (N )
Overlap(expected)
Overlap(empirical)
SN
Naomi (1;1-5;1) 884 349 21.8 19.8 2.53Eve (1;6-2;3) 831 283 25.4 21.6 2.94
Sarah (2;3-5;1) 2453 640 28.8 29.2 3.83Adam (2;3-4;10) 3729 780 33.7 32.3 4.78Peter (1;4-2;10) 2873 480 42.2 40.4 5.99Nina (1;11-3;11) 4542 660 45.1 46.7 6.88
First 100 600 243 22.4 21.8 2.47First 300 1800 483 29.1 29.1 3.73First 500 3000 640 33.9 34.2 4.68
Brown corpus 20650 4664 26.5 25.2 4.43
Table 1. Empirical and expected determiner-noun overlaps in child speech. The Brown corpus isincluded in the last row for comparison. Results include the data from six individual children and thefirst 100, 300, 500 determiner-noun pairs from all children pooled together, which reflect the earlieststages of language acquisition. The expected values in column 5 are calculated using only the sample
size S and the number of nouns N (column 2 and 4 respectively), following the analytic results insection 3.1.
The theoretical expectations and the empirical measures of overlap agree extremely well (column 5and 6 in Table 1). Neither paired t- nor Wilcoxon test reveal significant difference between the two setsof values. Perhaps a more revealing test is linear regression (Figure 5): a perfect agreement between thetwo sets of value would have the slope of 1.0, and the actual slope is 1.08 (adjusted R2 = 0.9716).
11

Null hypothesis is confirmed
y=1.08x, R2=0.97
identity
15
20
25
30
35
40
45
50
15 20 25 30 35 40 45 50
Empi
rical
Predicted

Why Variation★ Some children have higher overlap than others (and Brown)
★ sample size alone does not predict overlap
★ Overlap is determined by how many nouns (out of N) can be expected to be sampled more than once, or
★ Overlap is a monotonically increasing function of
expectedoverlap
expectedoverlap

Analysis of Variation
r = 0.986, p<0.00001
transcriptions with special marks, are discarded. As is standard in child language research, consecutiverepetitions count only once toward the tally. For instance, when the child says “I made a queen. I madea queen. I made a queen”, “a queen” is counted once for the sample.
In an additional test suggested by Virginia Valian (personal communication), we pooled together thefirst 100, 300, and 500 determiner-noun tokens of the six children and created three hypothetical childrenfrom the very earliest stages of language acquisition, which would presumably be the least productiveknowledge of determiner usage.
For each child, the theoretical expectation of overlap is calculated based on equations in (3)—(4),that is, only with the sample size S and the number of unique nouns N in determiner-noun pairs whileD = 2. These expectations are then compared against the empirical overlap values computed from thedeterminer-noun samples extracted with the methods above. The results are summarized in Table 1.
SubjectSampleSize (S)
a or the Nountypes (N )
Overlap(expected)
Overlap(empirical)
SN
Naomi (1;1-5;1) 884 349 21.8 19.8 2.53Eve (1;6-2;3) 831 283 25.4 21.6 2.94
Sarah (2;3-5;1) 2453 640 28.8 29.2 3.83Adam (2;3-4;10) 3729 780 33.7 32.3 4.78Peter (1;4-2;10) 2873 480 42.2 40.4 5.99Nina (1;11-3;11) 4542 660 45.1 46.7 6.88
First 100 600 243 22.4 21.8 2.47First 300 1800 483 29.1 29.1 3.73First 500 3000 640 33.9 34.2 4.68
Brown corpus 20650 4664 26.5 25.2 4.43
Table 1. Empirical and expected determiner-noun overlaps in child speech. The Brown corpus isincluded in the last row for comparison. Results include the data from six individual children and thefirst 100, 300, 500 determiner-noun pairs from all children pooled together, which reflect the earlieststages of language acquisition. The expected values in column 5 are calculated using only the sample
size S and the number of nouns N (column 2 and 4 respectively), following the analytic results insection 3.1.
The theoretical expectations and the empirical measures of overlap agree extremely well (column 5and 6 in Table 1). Neither paired t- nor Wilcoxon test reveal significant difference between the two setsof values. Perhaps a more revealing test is linear regression (Figure 5): a perfect agreement between thetwo sets of value would have the slope of 1.0, and the actual slope is 1.08 (adjusted R2 = 0.9716).
11

Does memory+retrieval work?★“(w)hen young children have something they want to say,
they sometimes have a set expression readily available and so they simply retrieve that expression from their stored linguistic experience” (Tomasello 2000, 77)
★Tentative evaluation: model the learner as a list of joint DN pairs with their associated frequency rather than independently combined units
★big learner: list consists of 6.5 million words of child-directed speech in the CHILDES database
★small learner: list consists of the child-directed utterance for each particular child in the CHILDES transcript
★calculate the overlap for the sampled D-N pairs, averaging over 1000 trials

Item-based learners
★paired t- and Wilcoxon tests show significant differences (p < 0.005)
★Does not exhaust item/usage-based approaches
measures. This is confirmed in strongest terms: S/N is a near perfect predictor for the empiricalvalues of overlap (last two columns of Table 1): r = 0.986, p < 0.00001.
We now briefly explore the question whether the determiner usage data by children can beaccounted for by the item based approach to language learning. Our effort is hampered bythe lack of concrete models for the item-based learning approach, a point that Tomasello con-cedes [4, p274]. Analytical results like those in Box 2 cannot be similarly obtained. A plausi-ble approach can be construed based on a central tenet of item-based learning, that the childdoes not form grammatical generalizations but rather memorizes specific and itemized combi-nations. Similar approaches such as construction grammar [10], usage [27] and exemplar basedmodels [28] make similar commitment to the role of verbatim memory. To this end, we con-sider a type of learning model that memorizes determiner-noun pairs in the input, and thesepairs are then sampled jointly, following the commitment of item-based learning, rather thanindependently (which would be the productive rule-based view).
ChildSampleSize (S)
Overlap(BIG learner)
Overlap(small learner)
Overlap(empirical)
Eve 831 16.0 17.8 21.6Naomi 884 16.6 18.9 19.8Sarah 2453 24.5 27.0 29.2Peter 2873 25.6 28.8 40.4Adam 3729 27.5 28.5 32.3Nina 4542 28.6 41.1 46.7
First 100 600 13.7 17.2 21.8First 300 1800 22.1 25.6 29.1First 500 3000 25.9 30.2 34.2
Table 2. Is the full productivity data in child language consistent with item-based learning? Twovariants of learners are considered. One type, the BIG learner, is designed to mimic the long
term commitment to memory; it stores a large set of determiner-noun pairs , which consists ofa sample of 1.1 million child directed utterances from the CHILDES database (methods as
described in Box 3). The other variant – the small learner – only memorizes the adult utterancespresent in each child’s transcript. For both learners, we draw an independent and randomsample from these stored D-N pairs with respect to their joint empirical frequencies; this is
contrasted with the rule-based model in which D and N are drawn independently. The samplesize matches those in each child’s production (Table 1, column 2). The overlap values are then
calculated as the percentage of nouns that appear with both “a” and “the” over those thatappear with either. The results are given in Table 2, averaged over 1000 trials per child.
Both sets of overlap values from item-based learning (column 3 and 4) are significantly dif-ferent from the empirical measures (column 5): p < 0.005 for both paired t-test and pairedWilcoxon test. This suggests that children’s use of determiners do not follow the predictionsof the item-based learning approach. Naturally, our evaluation here is tentative since the propertest can be carried out only when the theoretical predictions of item-based learning are made
9

A Quick Look at Verbs
★ Zipf-like distributions in words, morphology and syntactic rules (Chan 2008, Chan & Lignos 2011)
★ Islands everywhere! (Kowalski & Yang, yesterday)
★ 1.1 million child-directed English sentences
★ Top 15 more frequent transitive verbs
★ Top 10 most frequent frames following Tomasello (1992)
★ e.g., “see him” and “see her”

Zipf all the way#1 #2 #3 #4 #5 #6 #7 #8 #9 #10
put 401 164 124 15 12 12 11 10 8 5
tell 245 65 49 49 45 36 22 16 14 13
see 152 100 38 32 28 21 14 14 12 11
want 158 83 36 24 19 15 13 9 5 4
let 238 38 32 23 22 17 8 6 3 3
give 115 92 59 32 31 7 5 5 5 5
take 130 57 30 21 18 15 14 9 8 7
show 100 34 27 21 19 17 12 8 7 7
got 58 37 14 12 11 9 7 7 7 4
ask 45 41 27 24 12 10 8 8 4 2
make 67 20 12 10 9 7 7 4 3 2
eat 67 42 14 8 6 5 5 3 3 3
like 39 13 9 6 4 4 4 4 3 3
bring 43 30 17 15 10 10 3 3 3 3
hear 46 22 13 9 6 4 4 3 3 3
total 1904 838 501 301 252 189 137 109 88 75

Islands Everywhere
★ 100 verbs, 100 nouns: 10 million words for 50% diversity
★ 1500 verbs, 1500 nouns: 46 years for 50% diversity
clear. And that is exactly the point: the advocates of item-based learning not only rejected the al-ternative hypothesis without adequate statistical tests, but also accepted the favored hypothesiswithout adequate statistical tests. Intuition is no substitute for theoretical analysis or statisticalvalidation.
4 An Itemized Look at Verbs
The formal analysis in section 3 can be generalized to the study of child verb syntax and mor-phology (Box 1). Unfortunately, the acquisition data in support of the Verb Island Hypothesis [4]and the item-based nature of early morphology [14] is not available in the public domain.
But there is no escape from the Zipfian grasp: the combinatorics of verbs and their morpho-logical and syntactic associates are similarly lopsided in their usage distribution as in the case ofdeterminers. Consider first the kind of verbal syntax distributions attributed to the Verb IslandHypothesis. We focus on constructions that involve a transitive verb and its nominal objects, in-cluding pronouns and noun phrases. Following the definition of “sentence frame” in Tomasello’soriginal Verb Island study [4, p242], each unique lexical item in the object position counts asa unique construction for the verb. Figure 3 shows the construction frequencies of the top 15transitive verbs in 1.1 million child directed utterances.
4
4.5
5
5.5
6
6.5
7
7.5
8
0 0.5 1 1.5 2 2.5
log(freq)
log(rank)
�
�
�
� ����� �
Figure 3. Rank and frequency of verb-object constructions based on 1.1 million child-directedutterances. Processing methods are as described in Box 3 except here we focus on adjacent verb-nominal pairs in part-of-speech tagged texts. The verbs are the top 15 most frequent transitiveverbs: put, tell, see, want, let, give, take, show, got, ask, make eat, like, bring and hear. For eachverb, we counted its top 10 most frequent constructions, which are defined as the verb followeda unique lexical item in the object position (e.g., “ask him” and “ask John” are different construc-tions.) For each of the 10 ranks, we tallied the construction frequencies for all 15 verbs: the
10

Conclusion★ Grammar + Zipf = Usage
★ One of the many (future) statistical tests for language
★ Child language: Is there a storage stage? (Possible, but let’s catch it early!)
★ Productivity is not inconsistent with storage effects
★ Theory of grammar: The role of storage in syntactic coverage is minimal (Bikel 2004, Computational Linguistics)
★ Matches vs. mismatches in theoretical and experimental research
★ The most important lesson from Zipf ...