Usability Evaluation of an Online Media Resource Guide...
23
Usability Evaluation of an Online Media Resource Guide Research Paper Graduate Student Kim Cooper Legislative Correspondent 1221b F. St., NE Washington, DC 20002 [email protected] Dr. Cindy Akers Associate Professor Box 42131 Lubbock, Texas 79409 [email protected] Dr. David Doerfert Associate Professor Box 42131 Lubbock, Texas 79409 [email protected] Dr. Todd Chambers Associate Professor Lubbock, Texas 79409 [email protected] Dr. Chad Davis Science Coordinator Dallas Independent School District Dallas, Texas 75204 [email protected]
Transcript of Usability Evaluation of an Online Media Resource Guide...
Usability Evaluation of an Online Media Resource Guide
Research Paper Graduate Student
Kim Cooper
Legislative Correspondent 1221b F. St., NE
Washington, DC 20002 [email protected]
Dr. Cindy Akers
Associate Professor Box 42131
Lubbock, Texas 79409 [email protected]
Dr. David Doerfert Associate Professor
Box 42131 Lubbock, Texas 79409 [email protected]
Dr. Todd Chambers Associate Professor
Lubbock, Texas 79409 [email protected]
Dr. Chad Davis
Science Coordinator Dallas Independent School District
Dallas, Texas 75204 [email protected]
ABSTRACT
This study used a survey research design to evaluate the effectiveness, efficiency,
satisfaction, credibility, and therefore, the overall usability of CottonLink an online media
resource guide as determined by members of the Texas Plains region associated press medium.
Using a modified version of Dillman’s (2000) Tailored Design Method, the response rate
reached 54.2% with a total of 39 completed online surveys. The researcher designed instrument
achieved acceptable reliability scores for each portion of usability: effectiveness, .95; efficiency,
.98; satisfaction, .92; credibility, .92; and overall usability, .97.
Respondent’s found the Web site to be effective, efficient, satisfying, credible, and
usable. Findings were relevant for both researchers and practitioners. Future research should: (a)
evaluate terminology related to usability, (b) test actual agriculture knowledge and experience,
(c) analyze usability qualitatively, and (d) replicate this study with a larger population.
Recommended practices for practitioners include: (a) continually develop usable educational
resources for media members, (b) extend the media resource guides for additional commodities
and states, (c) holding training workshops for both media and industry representatives.
Key Words: Usability, Media Resource Guide, Web site evaluation
INTRODUCTION
Agricultural issues are becoming increasingly complex, combining one of the oldest
industries with some of the newest technologies. Journalists face time and knowledge challenges
when reporting on technical or scientific issues, often being “overwhelmed by their complexity”
(Whitaker & Dyer, 2000, p. 125). In addition, journalists are developing into generalists. They
are expected to cover a greater number of beats, whether or not they are trained or familiar with
the subject matter (Voss, 2003). Therefore, they rely heavily on various news gathering
techniques where new technologies affect the way business is done and information is
distributed. One of the important techniques for gathering news and information about
agricultural industries has been the use of the World Wide Web. However, there have been
questions related to how ‘usable’ websites are (Nielsen, 2000). This study analyzes the usability
of a website devoted to issues related to the cotton industry. Specifically, this study examined a
variety of objectives related to the usability of Cottonlink, as well as credibility, of this web-
based resource by professional journalists.
Previous studies on the Texas print media’s coverage of cotton and the impact of the
media resource guides indicated a level of bias, which decreased after the release of an earlier
version of the cotton media resource guide (Beesely, 2003; Vinyard, 2004). Whitaker and Dyer
(2000) found that journalists did little to establish new and better sources of information, as
evident in Hein’s (2005) study, which discovered a majority of the reporters were simply not
utilizing the cotton media resource guide. Likewise, Wright (2001) found increased information
and new technologies have strengthened both personal and professional relationships between
journalists and public relations people. Computer mediated communication is now acceptable
and used to build relationships. The Internet has become the most accessible and abundant
source of information available. As the world’s largest information source, the Internet provides
the public relations industry with a stimulating communication medium that offers an unlimited
potential for message or information dissemination (Wright, 2001).
To further refine public relation practices and improve the media’s coverage, it is
imperative to understand the tools media members employ to gather information and how to
maximize the tool’s usefulness. During the information age, options for information sources are
abundant, options are readily available and serving the exact needs of the media (Wright, 2001;
Hein, 2005). Providing the media with credible and knowledgeable sources eliminates work for
the journalist and allows the journalist to focus on writing an accurate article. Current
technological trends lead toward the use of the Internet and online news gathering techniques to
provide the media with the most informative, accessible, and customizable information (Callison,
2003; Hein, 2005). Successful media resource tools must empower the audience with a usable,
credible, informative, accessible, and customizable source of information. .
The Web is “the ultimate customer-empowering environment” and “usability rules the
Web” (Nielsen, 2000, p.9). Web site usability could be the difference between achieving the
site’s goal and creating a negative image for an entire industry (Donahue, Weinschenk, &
Nowicki, 1999). According to Nielsen (2000) and Krug (2000), all Web sites must be evaluated
on usability. The conceptual framework developed for this study used the review of literature to
refine Nielsen’s (1993) approach to understanding general usability (illustrated in Figure 1) to
specifically focus on Web site usability. His general approach provided a basic model for
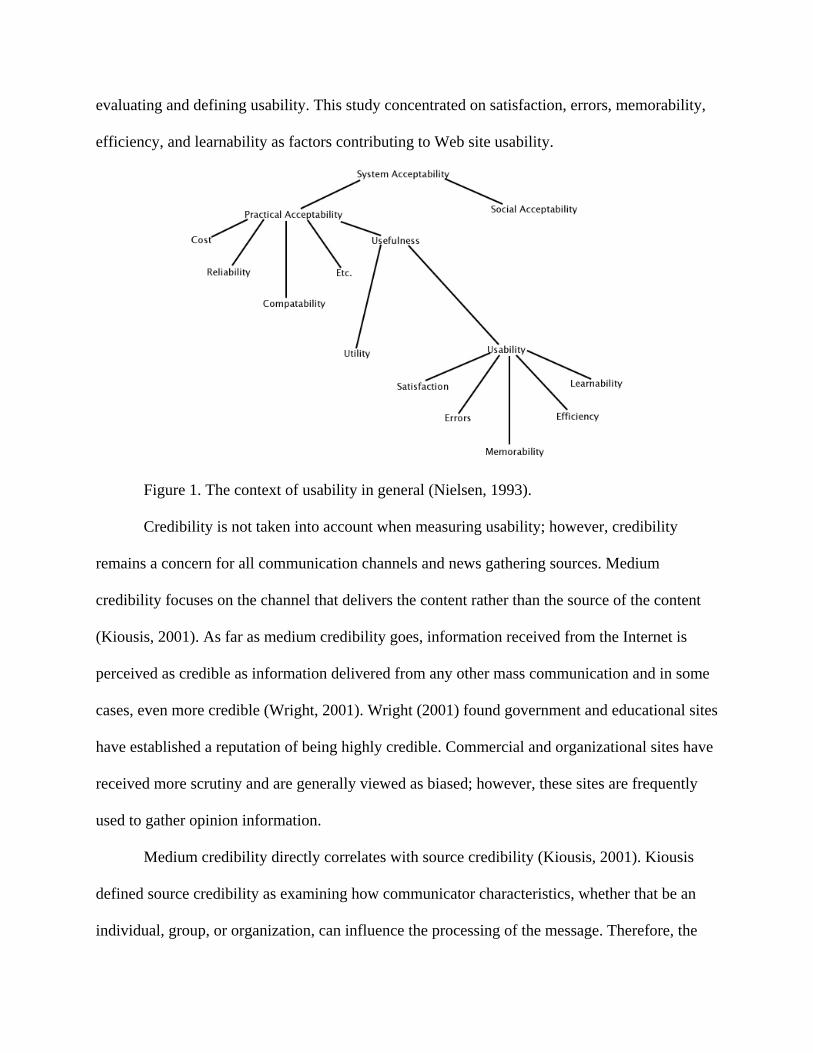
evaluating and defining usability. This study concentrated on satisfaction, errors, memorability,
efficiency, and learnability as factors contributing to Web site usability.
Figure 1. The context of usability in general (Nielsen, 1993).
Credibility is not taken into account when measuring usability; however, credibility
remains a concern for all communication channels and news gathering sources. Medium
credibility focuses on the channel that delivers the content rather than the source of the content
(Kiousis, 2001). As far as medium credibility goes, information received from the Internet is
perceived as credible as information delivered from any other mass communication and in some
cases, even more credible (Wright, 2001). Wright (2001) found government and educational sites
have established a reputation of being highly credible. Commercial and organizational sites have
received more scrutiny and are generally viewed as biased; however, these sites are frequently
used to gather opinion information.
Medium credibility directly correlates with source credibility (Kiousis, 2001). Kiousis
defined source credibility as examining how communicator characteristics, whether that be an
individual, group, or organization, can influence the processing of the message. Therefore, the
individual characteristics of each Web site and the information available from it combine to
formulate the perceived source credibility.
The contributing factors of usability and credibility determine the initial worth of the site
and the extent to which online media resource guide could be valuable for the intended audience.
Evaluating the use of online resource guides as a news gathering technique for the media
provides meaningful information on the format, content, and value of information provided to
the media online.
The purpose of this study was to determine the usability of an online media resource
guide for members of the region’s print media. The following objectives were developed to carry
out the purpose of this study:
1. Determine the effectiveness of the online media resource guide for members of the
Texas print media in the Plains region.
2. Determine the efficiency of the online media resource guide for members of the
Texas print media in the Plains region.
3. Describe the Plains region members’ of the Texas print media satisfaction with the
online media resource guide.
4. Describe the credibility of the online media resource guide perceived by members of
the Texas print media in the Plains region.
METHODOLOGY
Design
A web-based survey research design was used for this study, which Fraenkel and Wallen
(2006) describe as asking questions to collect information from a specific group of people in
order to describe characteristics of a population. Specifically, a cross-sectional survey method
was used to evaluate the effectiveness, efficiency, satisfaction, and credibility of on online media
resource guide at just one point in time from a predetermined population (Fraenkel & Wallen,
2006). Because the objectives of the study were related to the usability of a web-based resource,
newspaper journalists were identified as the primary target audience.
Population
As seen in Figure 2, the Plains, Coastal, and Greater Texas regions were established as
working zones to define the concentration of cotton production. The Northwestern portion of
Texas makes up the Plains region and contains the highest concentration of cotton production in
the nation. The Plains and Coastal regions consist of heavily concentrated cotton production,
while the Greater Texas region represents the portion of the state with sparse cotton production.
Krug (2000) advised using the target audience of the Web site to test the usability of the
site so their needs are determined and met through the testing. To do so, this study’s population,
consisting of members of the Texas newspaper industry within the Plains region, was established
by cross-referencing the online membership roster of the Texas Press Association with the
county lines. The Plains region, consisting of 66 counties and 88 newspapers with membership to
the Texas Press Association as of January 2006, was identified as the purposeful target
population. Schutt (2006) indicated that “in some circumstances it may be more feasible to skirt
the issue of generalizability by conducting a census – studying the entire population of interest –
rather than drawing a sample” (p. 138). Therefore, the target population for this study was a
census of the 88 newspapers in the Plains region.
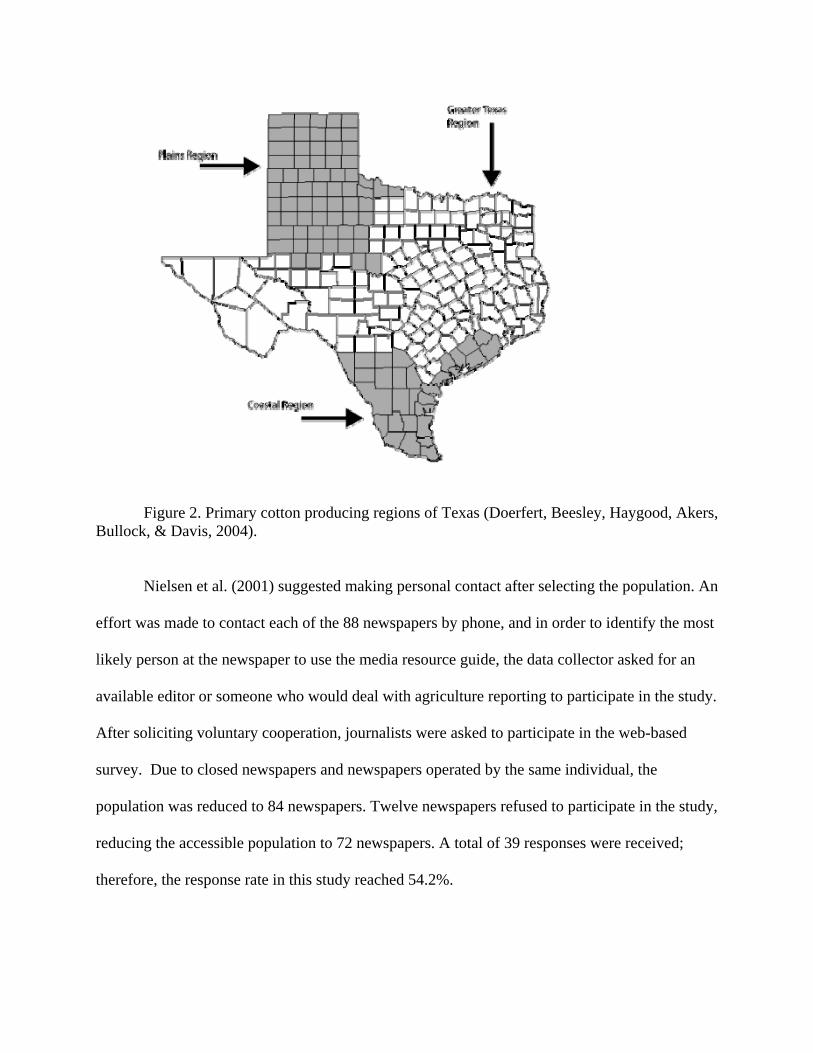
Figure 2. Primary cotton producing regions of Texas (Doerfert, Beesley, Haygood, Akers, Bullock, & Davis, 2004).
Nielsen et al. (2001) suggested making personal contact after selecting the population. An
effort was made to contact each of the 88 newspapers by phone, and in order to identify the most
likely person at the newspaper to use the media resource guide, the data collector asked for an
available editor or someone who would deal with agriculture reporting to participate in the study.
After soliciting voluntary cooperation, journalists were asked to participate in the web-based
survey. Due to closed newspapers and newspapers operated by the same individual, the
population was reduced to 84 newspapers. Twelve newspapers refused to participate in the study,
reducing the accessible population to 72 newspapers. A total of 39 responses were received;
therefore, the response rate in this study reached 54.2%.
Instrumentation
This study used a researcher-designed instrument consisting of an online survey
questionnaire. Zoomerang.com, an online survey administrator, was used to develop and host the
survey instrument. The researchers built the instrument with four distinct sections. Section one
gathered data related to participants’ current status and needs for reporting. This information is
not reported in this paper. Sections two and three contained Likert-type scale questions. A four-
point scale was used to measure the strength of agreement: (1) strongly disagree, (2) disagree, (3)
agree, and (4) strongly agree. This measurement was also coded as scale type data assuming that
each measurement fell between 1 and 4.
Section two of the study contained the task performance portion of the instrument where
participants were asked to open the media resource guide Web site in a new window and take a
couple of minutes to explore the site and focus on the contact directory, photo gallery, and e-lert
system before returning to complete the survey. This information is not reported in this paper.
Since usability is the degree to which a product is effective, efficient, and satisfying for
those who use it (Usability Professionals’ Association, 2005) and credibility heavily influences
news gathering techniques, the third section of the instrument contained statements tied to the
categories: effectiveness, efficiency, satisfaction, and credibility. Statements were adapted from
usability instruments developed by Axtell (2006) and Palmer (2002) along with the related
literature from Nielsen (2001) and Krug (2000).
Nielsen (2001) deemed site design as the most important factor when evaluating
usability. Within this study, site design was heavily tied to the effectiveness category. Cato
(2001) defined effectiveness as the amount of user effort required to achieve the user and domain
goal. Questions within the effectiveness section were related to page organization, site
organization, navigation menus, downloadable documents and links, and achieving their goal
with the site.
On the other hand, content is the primary reason users go to a site (Nielsen, 2001). This
study defined efficiency as the accuracy and completeness the user achieves with respect to the
goals (Cato, 2001). Therefore, the efficiency section dealt with the quality of information, the
ability to understand the material presented, the availability of contact information, and the
overall presentation of information.
As with any type of communication, satisfaction is key to developing loyal, returning
users. In the satisfaction category, the usefulness of the site, download/upload speed, amount of
user interaction, site aesthetics, and overall feeling of satisfaction were rated.
The credibility category specifically asked the subject to rate (a) how likely they would
be to browse the site again, (b) if the site enhances their ability to cover cotton, (c) the likelihood
they would recommend the media resource guide to colleagues, and (d) if the site portrayed
media resource guide as a credible source.
Dillman (2000) found respondents are more likely to complete surveys when
demographics are not at the beginning; therefore, the final section of the instrument collected
demographic information. This information is not reported in this paper.
Validity and Reliability
Threats to validity fall into two general categories: internal and external. For this study,
external validity was not a threat because this research was not generalized to other populations.
The study’s internal validity was controlled by using only one data collector and by obtaining
specific information about the subjects’ demographics and location. Since the cross-sectional
survey collects information at only one time, history, mortality, and maturation were not threats
to the study.
Fraenkel and Wallen (2006) identified mortality, location, instrumentation, and
instrument decay as the primary threats to internal validity of survey research. Fraenkel and
Wallen (2006) recommend holding the location constant as the best method of controlling
location threat. Because the purpose of the media resource guide is to assist the media with
reporting on cotton, subjects completed the survey in their typical working conditions- a realistic
setting for the use and purpose of the media resource guide. Since research shows the type of
Internet connection to influence user satisfaction, respondents were asked the type of Internet
connection used when completing the survey. This allowed researchers to account for variations
in processing speed and analyze the impact Internet connection has on usability in order to
minimize location as a threat. Because participants were able to set their own pace, instrument
decay was not considered a valid threat in this study.
Through the use of a pilot test, instrumentation error was minimized as a threat. The pilot
test also helped determine if the questions were easy to understand while testing the reliability
and validity of the instrument. The instrument was pilot tested with Coastal region newspapers
since this population is similar to the target population. There are 58 newspapers in the coastal
region and 38 consented to participate in the study. Data collected from the 21 pilot test
responses were analyzed for reliability.
The Cronbach’s Alpha for effectiveness was .59, .49 for efficiency, .72 for satisfaction,
and .79 for credibility. While the Cronbach’s Alpha for effectiveness and efficiency were low,
Nunnally (1967) suggested .5 could be considered adequate during early research stages or with
new instrument development. However, adjustments were made to the effectiveness and
efficiency categories using comments and suggestions from the pilot test respondents to increase
the reliability. A reliability test was repeated with data from the actual population, which was
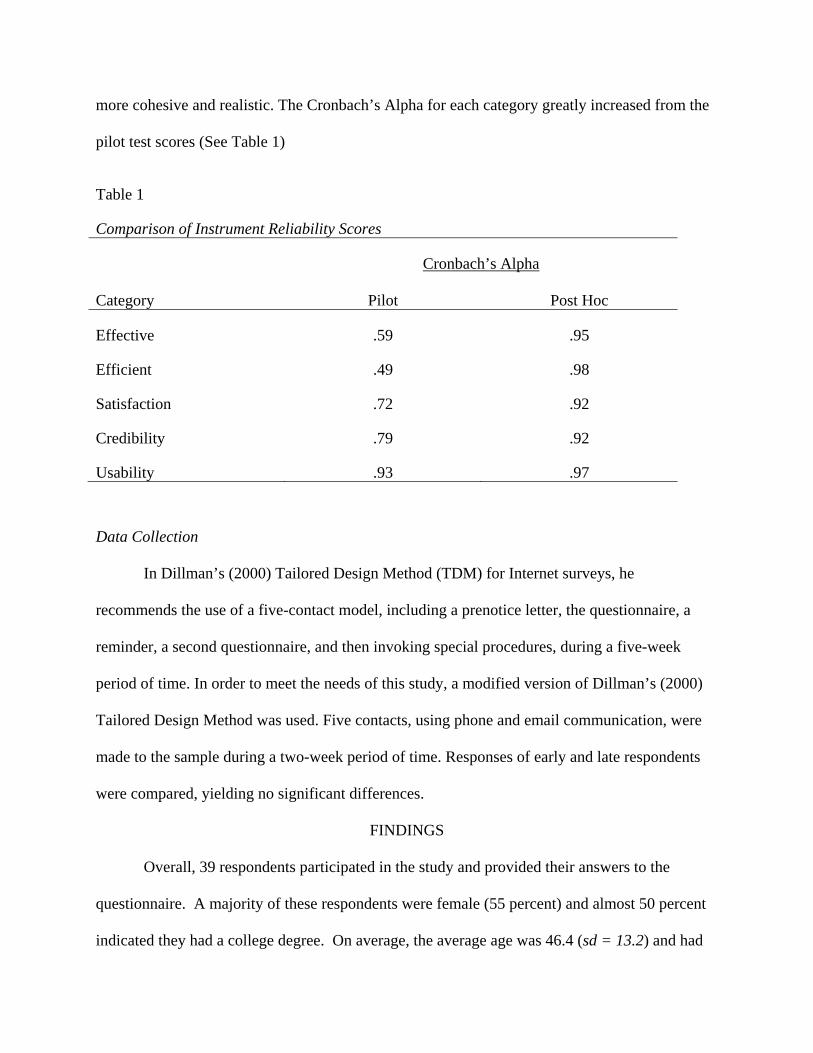
more cohesive and realistic. The Cronbach’s Alpha for each category greatly increased from the
pilot test scores (See Table 1)
Table 1
Comparison of Instrument Reliability Scores
Cronbach’s Alpha
Category Pilot Post Hoc
Effective
Efficient
Satisfaction
Credibility
Usability
.59
.49
.72
.79
.93
.95
.98
.92
.92
.97
Data Collection
In Dillman’s (2000) Tailored Design Method (TDM) for Internet surveys, he
recommends the use of a five-contact model, including a prenotice letter, the questionnaire, a
reminder, a second questionnaire, and then invoking special procedures, during a five-week
period of time. In order to meet the needs of this study, a modified version of Dillman’s (2000)
Tailored Design Method was used. Five contacts, using phone and email communication, were
made to the sample during a two-week period of time. Responses of early and late respondents
were compared, yielding no significant differences.
FINDINGS
Overall, 39 respondents participated in the study and provided their answers to the
questionnaire. A majority of these respondents were female (55 percent) and almost 50 percent
indicated they had a college degree. On average, the average age was 46.4 (sd = 13.2) and had
an average time spent in their profession of 14.4 years (sd = 11.5). As a profession, the profile
of the respondents included 64 percent editors and 21 percent as reporters. Finally, the
respondents were asked to provide their opinion about how much knowledge and experience in
agriculture they had. Using a 1 to 10 scale where a “1” meant “None” and a “10” meant
“Extensive,” overall knowledge of agriculture rated 5.1 (sd = 2.5) and agricultural experience
rated 4.1 (sd = 2.6).
Effectiveness
A series of seven individual statements was used to gauge the effectiveness of the online
media resource guide (See Table 2). All responses in section three of the instrument were based
on a four-point Likert scale: 1 = strongly disagree, 2 = disagree, 3 = agree, 4 = strongly agree.
Out of the seven individual statements, ‘Overall, this Web site’s navigation was effective’ had
the highest mean score (M = 3.44). Nielsen (2000) identified navigation as a “necessary evil” and
heavily related to effectiveness (p.18). Therefore, the final individual statement in this section,
‘Overall, this Web site’s navigation was effective,’ was included to summarize the effectiveness
in the subject’s mind. Responses were consistent with the other effectiveness statements, adding
validity to the individual statements and their relevance to effectiveness. Interestingly enough,
the statement with the lowest mean score (M = 3.14) for the effectiveness series and the entire
section three of the instrument also contained the word “effective.” By taking the mean of the
seven individual statements, the total mean score for effectiveness was 3.32 (SD = .56).
Researchers were confident in the findings and determined users felt the CottonLink media
resource guide was effective.
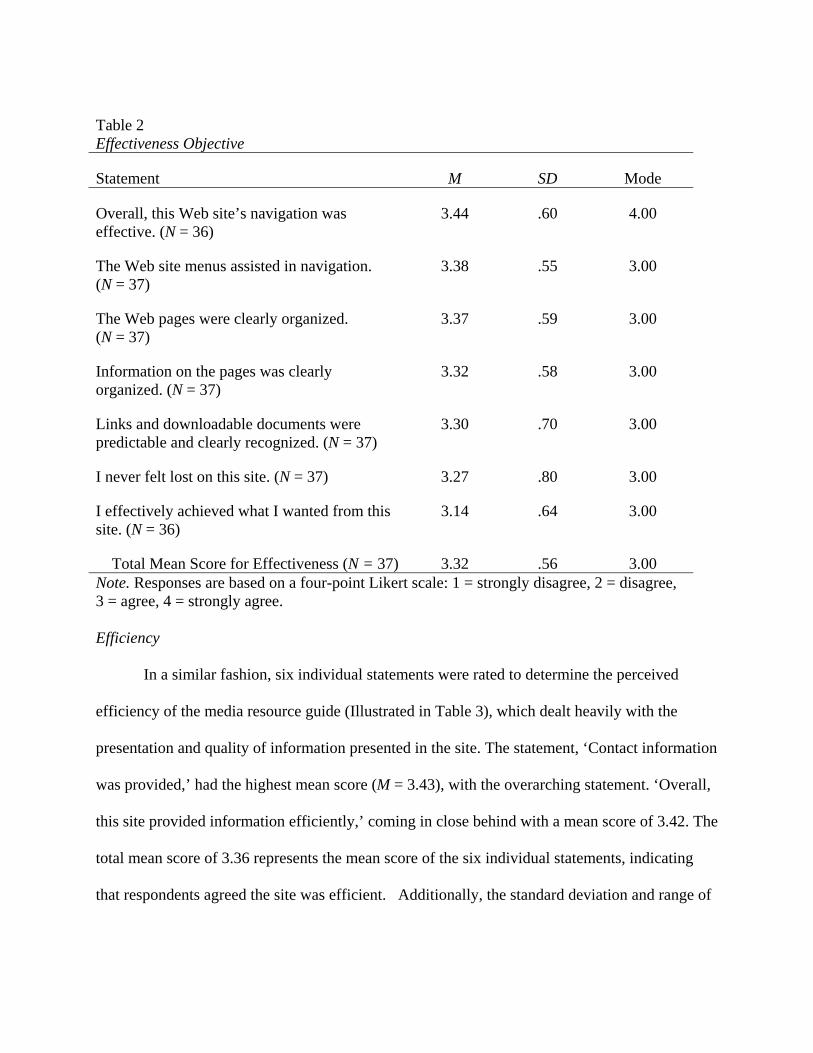
Efficiency
In a similar fashion, six individual statements were rated to determine the perceived
efficiency of the media resource guide (Illustrated in Table 3), which dealt heavily with the
presentation and quality of information presented in the site. The statement, ‘Contact information
was provided,’ had the highest mean score (M = 3.43), with the overarching statement. ‘Overall,
this site provided information efficiently,’ coming in close behind with a mean score of 3.42. The
total mean score of 3.36 represents the mean score of the six individual statements, indicating
that respondents agreed the site was efficient. Additionally, the standard deviation and range of
Table 2 Effectiveness Objective
Statement M SD Mode
Overall, this Web site’s navigation was effective. (N = 36)
The Web site menus assisted in navigation. (N = 37)
The Web pages were clearly organized. (N = 37)
Information on the pages was clearly organized. (N = 37)
Links and downloadable documents were predictable and clearly recognized. (N = 37)
I never felt lost on this site. (N = 37)
I effectively achieved what I wanted from this site. (N = 36)
Total Mean Score for Effectiveness (N = 37)
3.44
3.38
3.37
3.32
3.30
3.27
3.14
3.32
.60
.55
.59
.58
.70
.80
.64
.56
4.00
3.00
3.00
3.00
3.00
3.00
3.00
3.00
Note. Responses are based on a four-point Likert scale: 1 = strongly disagree, 2 = disagree, 3 = agree, 4 = strongly agree.
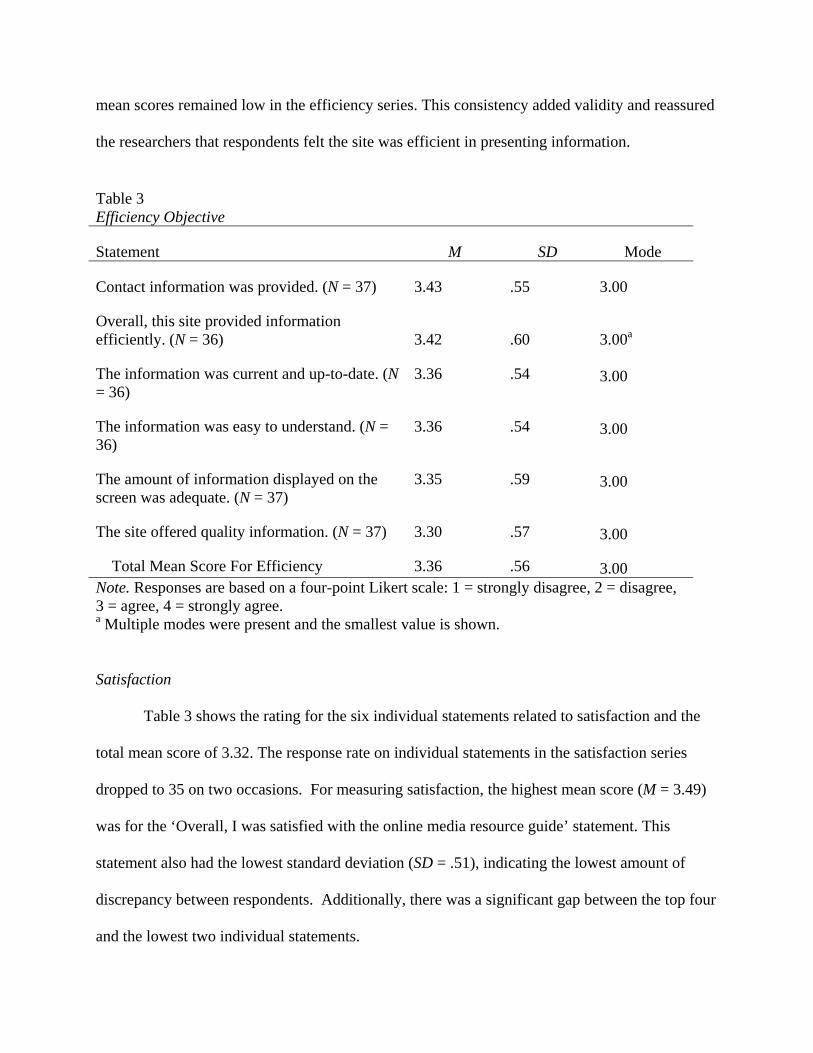
mean scores remained low in the efficiency series. This consistency added validity and reassured
the researchers that respondents felt the site was efficient in presenting information.
Satisfaction
Table 3 shows the rating for the six individual statements related to satisfaction and the
total mean score of 3.32. The response rate on individual statements in the satisfaction series
dropped to 35 on two occasions. For measuring satisfaction, the highest mean score (M = 3.49)
was for the ‘Overall, I was satisfied with the online media resource guide’ statement. This
statement also had the lowest standard deviation (SD = .51), indicating the lowest amount of
discrepancy between respondents. Additionally, there was a significant gap between the top four
and the lowest two individual statements.
Table 3 Efficiency Objective
Statement M SD Mode
Contact information was provided. (N = 37)
Overall, this site provided information efficiently. (N = 36)
The information was current and up-to-date. (N = 36)
The information was easy to understand. (N = 36)
The amount of information displayed on the screen was adequate. (N = 37)
The site offered quality information. (N = 37)
Total Mean Score For Efficiency
3.43
3.42
3.36
3.36
3.35
3.30
3.36
.55
.60
.54
.54
.59
.57
.56
3.00
3.00a 3.00
3.00
3.00
3.00
3.00 Note. Responses are based on a four-point Likert scale: 1 = strongly disagree, 2 = disagree, 3 = agree, 4 = strongly agree. a Multiple modes were present and the smallest value is shown.
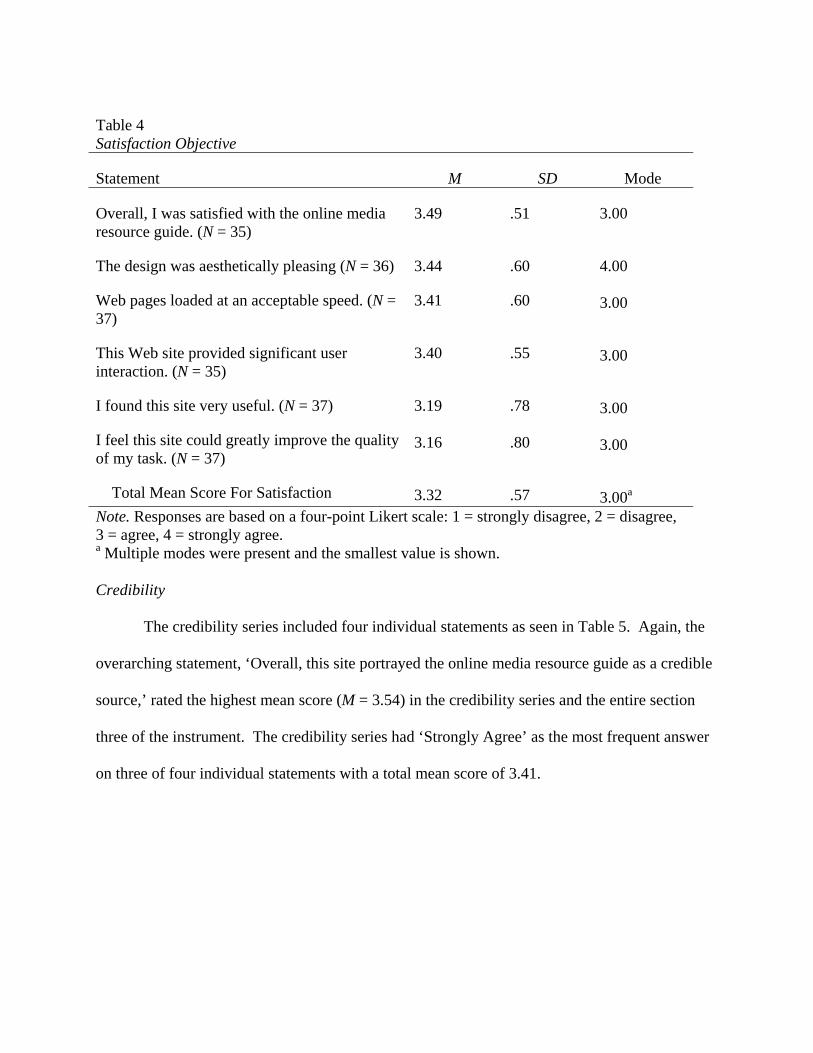
Credibility
The credibility series included four individual statements as seen in Table 5. Again, the
overarching statement, ‘Overall, this site portrayed the online media resource guide as a credible
source,’ rated the highest mean score (M = 3.54) in the credibility series and the entire section
three of the instrument. The credibility series had ‘Strongly Agree’ as the most frequent answer
on three of four individual statements with a total mean score of 3.41.
Table 4 Satisfaction Objective
Statement M SD Mode
Overall, I was satisfied with the online media resource guide. (N = 35)
The design was aesthetically pleasing (N = 36)
Web pages loaded at an acceptable speed. (N = 37)
This Web site provided significant user interaction. (N = 35)
I found this site very useful. (N = 37)
I feel this site could greatly improve the quality of my task. (N = 37)
Total Mean Score For Satisfaction
3.49
3.44
3.41
3.40
3.19 3.16
3.32
.51
.60
.60
.55
.78 .80
.57
3.00
4.00 3.00
3.00
3.00 3.00
3.00a
Note. Responses are based on a four-point Likert scale: 1 = strongly disagree, 2 = disagree, 3 = agree, 4 = strongly agree. a Multiple modes were present and the smallest value is shown.
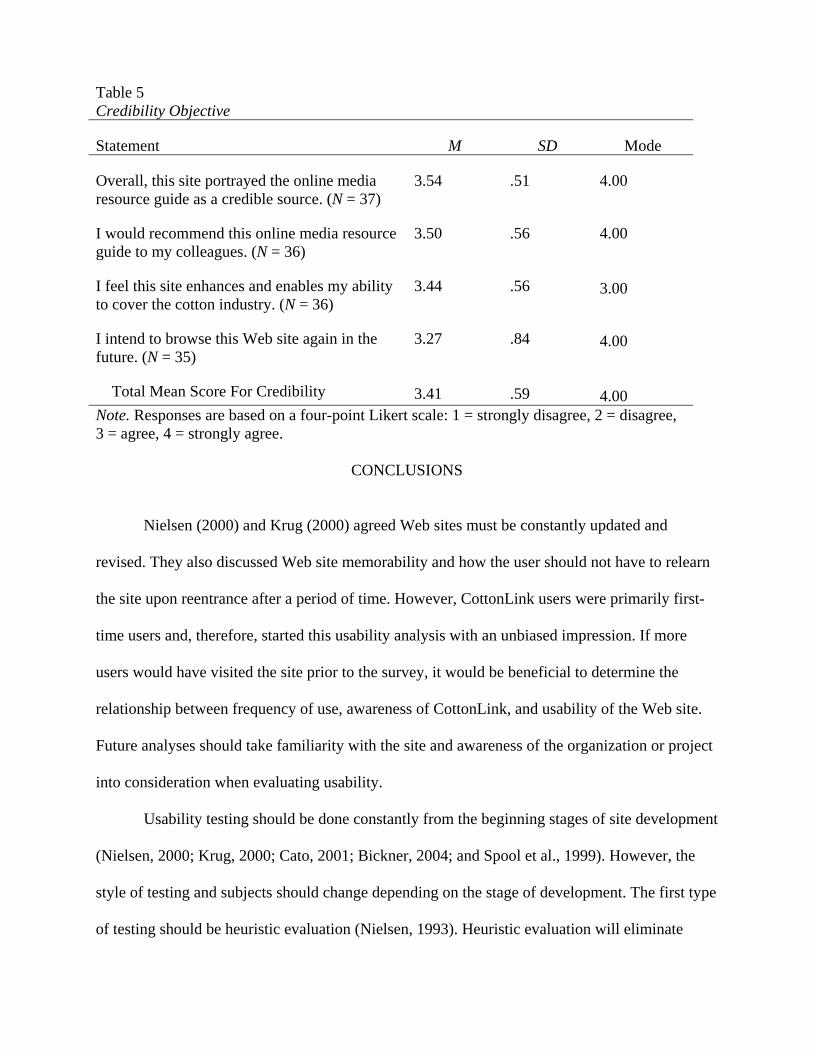
CONCLUSIONS
Nielsen (2000) and Krug (2000) agreed Web sites must be constantly updated and
revised. They also discussed Web site memorability and how the user should not have to relearn
the site upon reentrance after a period of time. However, CottonLink users were primarily first-
time users and, therefore, started this usability analysis with an unbiased impression. If more
users would have visited the site prior to the survey, it would be beneficial to determine the
relationship between frequency of use, awareness of CottonLink, and usability of the Web site.
Future analyses should take familiarity with the site and awareness of the organization or project
into consideration when evaluating usability.
Usability testing should be done constantly from the beginning stages of site development
(Nielsen, 2000; Krug, 2000; Cato, 2001; Bickner, 2004; and Spool et al., 1999). However, the
style of testing and subjects should change depending on the stage of development. The first type
of testing should be heuristic evaluation (Nielsen, 1993). Heuristic evaluation will eliminate
Table 5 Credibility Objective
Statement M SD Mode
Overall, this site portrayed the online media resource guide as a credible source. (N = 37)
I would recommend this online media resource guide to my colleagues. (N = 36)
I feel this site enhances and enables my ability to cover the cotton industry. (N = 36)
I intend to browse this Web site again in the future. (N = 35)
Total Mean Score For Credibility
3.54
3.50
3.44
3.27 3.41
.51
.56
.56
.84 .59
4.00
4.00 3.00
4.00 4.00
Note. Responses are based on a four-point Likert scale: 1 = strongly disagree, 2 = disagree, 3 = agree, 4 = strongly agree.
many design flaws and functionality errors found in the Web site. When conducting research in
the beginning stages of development, a smaller group of individuals would be evaluated using
qualitative research methods in order to gain richer data. Bickner (2004) recommended watching
a first-time user visit the site and qualitatively recording their thoughts, suggestions, and
difficulties. The task performance style of testing would be implemented to ensure individuals
were given the same opportunity and level of difficulty. Subjects would still complete a shorter
survey to gather data related to demographics and the components of usability. The qualitative
data could then be cross-referenced with the survey data to evaluate the richness and accuracy of
data found.
Usability testing should be conducted periodically after the launch of the site (Krug,
2000; Nielsen, 2000). The next usability testing for CottonLink ought to be conducted in six
months after extensive promotion within the cotton industry and toward media members. A
replication study could be conducted to compare findings; however, members of the print media
from the Greater Texas region should be included. Members of the print media in the Greater
Texas region were not included in this study but would add value to the next study as it is a non-
cotton producing region with a larger population. The region largely impacts the agenda, and
CottonLink must show them the value of the resource for non-production areas. In this study,
researchers would have liked to run more extensive statistics; however, the size of the population
limited the impact of the analysis. Future research with the larger population would enable
researchers to look into path analysis and cross tabulations.
Looking back at Nielsen’s (1993) general model of usability, future studies should
incorporate and analyze the utility branch as well. The utility branch deals with the value of the
media resource guide and what kind of importance users place on the system. By determining the
importance and value the intended users place on the tool, researchers could continue to develop
the portions users found the most value in and reduce the amount of time and effort spent on
portions of low value. Within the task performance of the instrument in this study, researchers
asked the user to look at the e-lert system and then followed up with a yes or no question asking
them if they would like to subscribe. With 78.9% of respondents choosing to subscribe, eight
respondents chose not to subscribe while only four disagreed that it was useful. Further research
on the utility of the CottonLink media resource guide could explain why respondents opted not
to subscribe even though they felt it was useful.
Better information sources and promotion will aid those journalists who do desire new
and improved sources of information. If practitioners can ease this process by providing a
reliable and usable resource, journalists will likely spread the word to their colleagues. In this
study, 97.2% of respondents agreed or strongly agreed they would recommend this site to their
colleagues. Agricultural commodities could greatly benefit from the addition of an industry-wide
media resource guide and could work together to gain a strong reputation amongst journalists.
One respondent in this study even made the comment, “Wow, I wish the beef and peanut
industry did this.”
The Internet has become a housing facility for information, allowing easy distribution
and updating in a readily accessible format. Utilize the Internet as just that, a housing facility for
information. It should not be the only form of communication but should supplement all other
forms. Media resource guides for commodities should serve as a clearing house of information
related to the topic. It should include an overview and facts, directory of available sources,
statistics and figures, photographs, industry practices, and above all else, localized information.
Users are able to filter through what they do not want and retrieve the desired good when Web
sites are properly developed and highly usable. It should also be noted younger generations
utilized the Internet more often, for more purposes, and for greater lengths of time (Madden,
2006). So as younger generations replace those older generations in the media, public relations
will have to adjust to meet the needs of the younger audience by using new mediums such as the
Internet more effectively. The context of the media should relate specifically to the changing
trends of the audience. As time goes by the audience is more and more familiar with the Internet
and developing technologies.
Callison (2003) found journalists demanded unique, multimedia, content-rich news and
information they can access in a timely manner and a usable format. When respondents
identified topics they would like to see in a media resource guide, 48.7% answered “no” to
expert sources. However, the breakdown of time spent newsgathering found in this study shows
a majority of time being spent on personal interviews, press releases, and telephone calls. The
CottonLink media resource guide was designed to make each of those a less time consuming
process for the journalist. Future promotion should be done to illustrate all of the benefits found
in the media resource guide and how it assists various aspects of the newsgathering process.
Prior to answering this portion of the instrument, 78.9% of respondents had not visited the
CottonLink Web site. With proper promotion and continued updates, journalists should come to
expect media resource guides to assist them in all aspects of newsgathering.
The terminology associated with usability and Web sites still trouble the industry.
Researchers recommend in-depth studies on the wording choices and what Web characteristics
apply to the specific terminology. Research could implement a correlational research design and
determine the relationship between the individual set of statements and the overarching statement
related to the term. Another maybe simpler option might be to jumble the individual statements
and not list in category sections. This would encourage respondents to thoroughly think out each
response and reduce the likelihood of simply producing socially acceptable responses.
Researchers would then code the individual statements into categories and run reliability tests to
determine if the statements were reliable when coded into categories. By conducting this
research, future usability analyses could establish consistency and uniformity throughout the
profession.
REFERENCES
Axtell, S. (2006). Usability analysis of the USDA-ARS Ogallala Initiative Web site. Unpublished master’s thesis, Texas Tech University, Lubbock.
Beesely, A. (2003). Cotton as portrayed by the Texas print media: A content analysis.
Unpublished master’s thesis, Texas Tech University, Lubbock. Bickner, C. (2004). Web Design on a Shoestring. Indianapolis, IN: New Riders Publishing. Callison, C. (2003). Media relations and the Internet: How Fortune 500 company Web sites
assist journalists in news gathering. Public Relations Review, 29, 29-41. Cato, J. (2001). User-centered Web design. London: Addison-Wesley Longman. Dillman, D.A. (2000). Mail and Internet surveys: The tailored design method. (2nd ed.). New
York: Wiley. Doerfert, D.L., Beesley, A., Haygood, J., Akers, C., Bullock, S., & Davis, C.S. (2004). The
potential role of news determinants influencing the coverage of the cotton industry by Texas newspapers. Unpublished manuscript, Texas Tech University, Department of Agricultural Education and Communications, Lubbock, TX.
Donahue, G.M., Weinschenk, S., & Nowicki, J. (1999). Usability is good business. Retrieved
September 25, 2006 from http://www.compuware.com. Fraenkel, J.R., & Wallen, N.E. (2006). How to Design and Evaluate Research in Education (6th
ed.). New York: McGraw-Hill. Hein, J. (2005). An examination of factors considered by the Texas print media on the use of a
media resource tool in developing news stories. Unpublished master’s thesis, Texas Tech University, Lubbock.
Kiousis, S. (2001). Public trust or mistrust? Perceptions of media credibility in the information
age. Mass Communication and Society. 4(4), 381-403. Krug, S. (2000). Don’t make me think. Indianapolis, Indiana: New Riders Publishing. Madden, M. (2006). Internet penetration and impact. Retrieved April 27, 2006 from
http://www.pewinternet.org/tpf/r/182/report_display.asp. Nielsen, J., Coyne, K.P., & Tahir, M. (2001). Make it usable. Retrieved February 24, 2006, from
http://www.psmag.com/print-article2/0,1217,a+2556,00.asp. Nielsen, J. (2000). Designing Web usability. Indianapolis, Indiana: New Riders Publishing.
Nielsen, J. (1993). Usability Engineering. Boston: Academic Press. Nunnally, C. (1967). Psychometric Theory. McGraw-Hill Book Company, Inc. New York, NY. Palmer, J.W. (2002). Web site usability, design, and performance metrics. Information Systems
Research 3(2), pp. 151-167. Parlinski, M. & Parlinski, I.S. (2003). The Internet in the agricultural sector tips and tricks to
design a Web page for companies in the agri-food sector. Paper presented at the EFITA 2004 Conference, pp. 851-859, Debrecen, Hungary.
Schutt, R.K. (2006). Investigating the social world: The process and practice of research (5th
ed.). Thousand Oaks, CA: Pine Forge Press. Spool, J.M., Scanlon, T., Snyder, C., Schroeder, W., & DeAngelo, T. (1999). Web site usability:
A designer’s guide. San Francisco, CA: Moran Kaufmann Publishers, Inc. Usability Professionals’ Association (2005). Resources: About usability. Retrieved November
22, 2005 from http://www.upassoc.org/usability_resources/about_usability/. Vinyard, A. (2004). An examination of the Texas print media’s ability to report objectively on
cotton following the dissemination of an agricultural media resource. Unpublished master’s thesis, Texas Tech University, Lubbock.
Voss, M. (2003). Why reporters and editors get health coverage wrong. Nieman Report, 57(1),
46-48. Whitaker, B.K. & Dyer, J.E. (2000). Identifying sources of bias in agricultural news reporting.
Journal of Agricultural Education, 41(4), 125-133. Wright, D.K. (2001). The magic communication machine: Examining the Internet’s impact on
public relations, journalism, and the public. The Institute for Public Relations. Retrieved October 17, 2005 from http://www.instituteforpr.org/index.php/IPR/IPR_info/magic_communication_machine/