Adding Usability. Methods for Modelling, User Interface Design and Evaluation

Usability Evaluation of a Visual Modelling Tool for OWL Ontologies
Juan García (Computer Science Department, University of Salamanca, Spain
Francisco J. García-Peñalvo (Computer Science Department
Science Education Research Institute (IUCE), GRIAL Research Group, University of Salamanca, Spain
Roberto Therón (Computer Science Department, University of Salamanca, Spain
Patricia Ordoñez de Pablos (Department of Business Administration and Accountability, Spain
Faculty of Economics, University of Oviedo, Spain [email protected])
Abstract: Usability is generally regarded as ensuring that software products are effective and efficient to use from the user's perspective. Diverse aspects that ensure the usability of a software product should be assessed during the different phases in its life cycle. The goal of usability testing is to evaluate whether or not a tool that is being developed will be usable by the end user in order to achieve the tasks for which it is being designed. This paper is targeted at describing the evaluation and the usability of OWL-VisMod, a visual modelling tool for OWL ontologies, from the point of view of the human-computer interaction. This evaluation is based on a user-centred approach and the use of questionnaires. The whole usability evaluation process is described and the results are discussed. Keywords: OWL ontologies, evaluating usability, modelling OWL, user-centred design Categories: H.0, H.1.1, H.5.2
1 Introduction
In human-computer interaction and computer science, usability studies the elegance and clarity of interaction with a computer program or a web site when it is designed. The software usability is generally regarded as ensuring that software products are easy and effective to use from the users perspective. It involves optimizing the interactions that people have with software products. More specifically, usability is broken down into the following goals:
• Effective to use (effectiveness). • Efficient to use (efficiency).
Journal of Universal Computer Science, vol. 17, no. 9 (2011), 1299-1313submitted: 8/1/11, accepted: 28/4/11, appeared: 1/5/11 © J.UCS

• Safe to use (safety). • Having good utility (utility). • User satisfaction (satisfaction). • Easy to learn (learnability).
Depending on the application field, diverse software systems would require some
or all of the goals described above, that are typically operationalized as questions. The purpose is to provide the developing team with a concrete means of assessing various aspects of the interaction and the users’ experience. Through answering the questions, designers can be alerted very early on in the design process to potential design problems and conflicts that might not be considered.
Conceptual modelling is an activity that aims to build knowledge bases, such as database or ontologies [Thalheim, 10]; other proposals are used to estimate if these conceptual models can be transformed into logic-based specifications [Benevides, 10]. Some tools for modelling ontologies have been proposed, or even ontologies have been used to measure diverse knowledge aspects [ZadJabbari, 10]. This paper describes an evaluation of a tool called OWL-VisMod, a visual modelling tool for Knowledge Bases, more specifically OWL ontologies. An available beta version of the tool has been released and this paper describes an evaluation performed in the last part of its development. The principle target is to provide a very intuitive tool that can be used by anyone interested in modelling ontologies. Its design is based on the use of diverse interconnected visualisation techniques, borrowed from the Visual Analytics and Information Visualisation fields.
Nowadays, the tools that are available for editing and modelling ontologies are focused on their use by expert users, because of the complex results for those users with no background in the field of ontological engineering. This aspect represents a disadvantage for users to generate semantic contents for the Web, especially for the Semantic Web, also called Web 3.0 [Rego, 11]. Semantic Web will be a reality when all the users that generate Web contents, can use tools letting them properly generate semantic contents. This is the main objective of our proposal, to offer a free, easy-to-use and intuitive tool, to generate OWL ontologies.
This paper starts with a brief introduction; then some aspects that were taken into account to evaluate the usability of the tool are briefly described; the third section describes each one of the directed-steps that users performed in order to complete the evaluation; then the fourth section provides the analysis of the results, leading to the conclusions in the fifth section.
2 Evaluating the Usability
The International Organization for Standardization (ISO) defines Usability of a product as the extent to which the product can be used by specified users to achieve specified goals with effectiveness, efficiency, and satisfaction in a specified context of use. Usability can be summarised using five main attributes: learnability, efficiency, memorability, errors, and user satisfaction. Depending on the type of application one attribute might be more critical than another.
1300 Garcia J., Garcia-Penalvo F.J., Theron R., Ordonez de Pablos P. ...

OWL-VisMod1 is a visual modelling tool for creating, editing and visualising OWL ontologies. It is targeted to those users that need to perform ontological engineering activities. At this final point of the tool development, an evaluation of its usability is needed, by testing the tool with those users that will be using it. The details of its implementation, and each one of the visual techniques, are out of the scope of this paper, in case you are interested, please visit the project’s website1. The main aspects to be evaluated are the effectiveness and the users’ satisfaction in general, for this reason the proposal does not require critical security or efficiency requirements. To evaluate its usability, a user-centred evaluation was applied. User-centred evaluations are accomplished by identifying representative users, representative tasks, and developing a procedure for capturing the problems that users have in trying to apply a particular software product in accomplishing these tasks.
Effectiveness is a very general goal and refers to how good a product is at doing what it is supposed to do. Efficiency refers to the way a product supports users in carrying out their tasks [Lazar, 10] [Sharp, 07]. We identify and understand better the effectiveness by answering the question as to whether or not the tool is capable of allowing people to learn, and develop the ontological engineering efficiently. It represents the main aspect to evaluate in OWL-VisMod, so it should be capable of being fully compliant to its tasks. These tasks include the edition, visual representation and manipulation of OWL ontologies.
Another aspect to be evaluated is the utility that refers to the extent to which the product provides the right kind of functionality so that users can do what they need or want to do. The question associated with utility would be if OWL-VisMod provides an appropriate set of functions that will enable users to carry out all their tasks in the way they want to do them. In this aspect, it has been provided with the functionality needed to fully implement OWL DL and OWL Lite ontologies according to the OWL specification2.
Learnability or the easiness of learning is the capability of a software product to enable the user to learn how to use it. Learnability may be considered as an aspect of usability, and is of major concern in the design of complex software applications. A key concern is determining how much time users are prepared to spend learning a product. Learnability can be associated with the questions: how long will it take a user to figure out how to use the most basic functions for the new tool?; and how long would it take a user to learn the whole set of functions?. This aspect has been strongly taken into account, and diverse intuitive mechanisms have been considered to interact with the tool. These mechanisms include menus illustrated with icons, right-click menus and buttons to develop operations. The main aspect to take into account in the learnability process is the one related to the navigation process through the diverse visualisations. This process requires a learning curve, but anyone with background knowledge of the ontological domain would not find it difficult to navigate the process in the tool.
1 http://www.analiticavisual.com/juan/OWL-VisMod.html 2 http://www.w3.org/TR/owl-features/
1301Garcia J., Garcia-Penalvo F.J., Theron R., Ordonez de Pablos P. ...

2.1 Prototyping
Prototypes are a useful aid when discussing ideas with users; the activity of building prototypes encourages reflection in design, and is recognised by designers from many disciplines as an important aspect of the design process. Diverse prototypes have been released and taken under the consideration of the users. OWL-VisMod has been built using the classical iterative process for software engineering. Each part can be associated with the implementation of a single visualisation, focused on covering a specific aspect in the ontological development process. The diverse visualisations were tested as prototypes upon successful completion. Hence, they serve a variety of purposes: for example, to test the technical feasibility of an idea, to clarify some vague requirements and to perform diverse user tests and evaluations. During the development process of the tool, these prototypes have been proposed in order to deal with the main requirements, resulting in a variety of visualisations that have been implemented in the final version.
2.2 Usability Testing
Users want interactive products that are easy to learn, effective, efficient, safe and satisfying to use. Achieving this means that the product has to be evaluated, and running effective evaluations involves understanding not only why evaluation is important but also what aspects to evaluate, where evaluation should take place, and when to evaluate. At what stage in the product lifecycle evaluation takes place depends on the type of product itself. The Usability testing is important particularly in the later stages of the designing, for ensuring consistency in the navigation structure, use of terms, and how the system responds to the user. Currently, a beta version of OWL-VisMod is available to be tested by the users. In this paper, an "informal" case study has been developed, without a general model. Getting feedback is required, in order to describe the successful use of the tool. The term "informal" refers to the fact that this case study does not require a rigorous procedure [Lazar, 10], but is just intended to provide valuable feedback of the usability.
2.3 User-Centred Evaluation
At this final stage of the development process, it is crucial to perform an evaluation of the tool. A user-centred approach to evaluate its usability has been performed. The first aspect to be considered was the identification of the representative users. This tool is targeted for any user, even for those with no background in ontologies. To make this happen, direct evaluation is needed with different users, in order to evaluate the intuitiveness and the usability of the tool. The big portals that generate a lot of web contents -e.g. social networks-, perform this work (development of semantic knowledge). In contrast, this proposal is focused on single users that also generate a lot of web contents, especially with blogs or personal web pages. Most of these users are young people that are constantly generating contents that should have a semantic structure, or at least, would rather it would be desirable that it had it. Twenty one students attending the Computer Science Program at the University of Salamanca participated in this evaluation. Even though most of them were attending the Master’s Program, none of them were specialists on ontologies, and this evaluation represented
1302 Garcia J., Garcia-Penalvo F.J., Theron R., Ordonez de Pablos P. ...

their first interaction with them. They were provided with a simple introductory explanation of ontologies and the modelling capabilities of the tool.
The second aspect to be considered was the definition of the representative tasks to be developed by the users, in order to firstly, evaluate the effectiveness and secondly, the user satisfaction with the visualisations and the interaction with them. To evaluate the effectiveness, an evaluation was implemented according to each one of the established points in the OWL specification3. The best way to evaluate these points was by building an ontological model. Users were asked to model an ontology, they were asked to think about a knowledge base related to their university environment, using concepts such as: student, professor, subject, university, faculty, etc. This suggestion helped in getting similar ontologies to contrast to, share information and facilitate the modelling process by making it more dynamic.
3 Describing the Evaluation
The evaluation consisted of 26 questions in total, 22 closed-ended and 4 open-ended, divided into four groups. The first task was to download the tool from its web location4, unzip the files and to execute the jar file. Once the tool was downloaded, the user-centred evaluation was divided into two parts: the first part was intended to evaluate the effectiveness of the tool. This means to get the users evaluations about the visualisations and the steps for modelling the ontology. The goals to be achieved were to identify whether or not the visualisations satisfy all the purposes they were implemented for, as well as the control flow. The evaluation was done in parts, evaluating each one of the visualisations according to the control flow, and then a global evaluation of the whole tool. The first visualisations to be evaluated were the treemap, proposed and described in [Johnson, 91] and the hierarchical tree; these visualisations let the user analyse the hierarchy of the ontology and are used to create new RDF Schema Features. A treemap is a visualisation of hierarchical structures, basically based on the representation of trees using nested rectangles. Actually, its name refers to the notion of turning a tree into a planar space-filling map. Currently, trees and treemaps, could represent the best techniques to represent hierarchies.
Another important aspect to be evaluated was the visualisation that represents the coupling among classes. The second part to be evaluated was related with user satisfaction in general, and is described in detail in the following section.
The RDF Schema Features include the addition of classes, properties and individuals to the ontology, and the definition of the domain and range in each one of the properties. These features define the basic schema of an ontology, and represent the main aspect to consider when users are creating or updating an ontology. The first task developed by the users, was the creation of the whole hierarchy. Firstly, users were asked to create a new ontology, the ontology requires a valid URL, being the URL: http://www.analiticavisual.com\#. The treemap visualisation is then displayed and then they had to populate it with all the classes representing the diverse concepts in their knowledge base.
3 http://www.w3.org/TR/2004/REC-owl-features-20040210/ 4 http://www.analiticavisual.com/juan/download.html
1303Garcia J., Garcia-Penalvo F.J., Theron R., Ordonez de Pablos P. ...

3.1 Evaluating the Hierarchy of the Ontology
One of the main aspects when modelling an ontology is the hierarchy of concepts. It represents a crucial aspect to be clearly specified when creating or editing an ontological model. Users were asked to create an ontology based on an academic approach. They created their own, personal models, with classes, properties and individuals. Figure 1 depicts one of the models created by the users; Figure 1(a) depicts a treemap with the hierarchy of concepts, while Figure 1(b) depicts the same hierarchy but using a simple tree visualisation, with the treemap blurred as the background, in order to maintain the whole context. This first phase consisted of the population of the ontology, with all the classes representing concepts in the domain field, such as Professor, Subject, University, Faculty, Scholarship, etc.
Figure 1: A taxonomical view of the ontology after creating all the classes. Fig. (a) depicts the hierarchy represented using a treemap visualisation. Fig. (b) represents the same hierarchy using a simple tree visualisation.
Once the whole hierarchy was defined by the users, the next step was to create the relationships among the diverse concepts. Object properties define relationships among classes; these relationships are defined to perform logical inference over the knowledge base. Users were asked to populate the ontological model with these relations, as well as the diverse intrinsic features such as equality, symmetry or transitivity.
There is another visualisation that has been implemented in order to provide an additional way to analyse diverse metrics over the classes. A table of values, enriched with diverse capabilities, mainly forms this technique called table-lens. It is formed by one row for each class in the model, and diverse columns representing a metric value for this class. For instance, represented metrics are total of properties, total of individuals, total of subclasses, as well as diverse metrics representing the coupling of classes.
1304 Garcia J., Garcia-Penalvo F.J., Theron R., Ordonez de Pablos P. ...

OWL Lite Equality and Inequality features may be stated to properties, classes or individuals. The property characteristics are: symmetry, inverse, transitivity, functional and inverse functional. They are special identifiers in OWL Lite that are used to provide information concerning properties and their values. OWL Lite allows restrictions to be placed on how properties can be used by instances of a class. These restrictions are: allValuesFrom and someValuesFrom. OWL Lite also includes a limited form of cardinality restrictions. OWL cardinality restrictions are referred to as local restrictions, since they are stated on properties with respect to a particular class. That is, the restrictions constrain the cardinality of that property on instances of that class.
At this point of the evaluation, users were asked to answer a questionnaire about the intuitiveness, easiness of use and the usability of the visualisations used until this point, which is focused on building the taxonomy of concepts. The first set of direct questions, are listed below:
1. Is the hierarchy clearly represented using trees and treemaps in your opinion? (1 - 5)
2. Is the table lens useful to give an overview of the global elements in the ontological model? (1 - 5)
3. Is the modelling process clear and intuitive enough to build an OWL ontology? (1 - 5)
4. Is the modelling tool easy to learn, use and understand? (1 - 5) 5. What is your degree of satisfaction with these visualisations? (1 - 5) 6. What extra comments would you like to add?
Except for the last question, that is an open-ended question, the first five
questions are close-ended and are evaluated by ranking a value, being 1 the worst value and 5 the best possible one.
3.2 Evaluating the Semantic Zoom Approach
Once the taxonomy has been created and evaluated by the users, the next step was the evaluation of the visualisations representing the semantic zoom. These visualisations are focused on providing all the information related with a selected class, and they are shown in response of a user request by selecting a class. Semantic zoom is defined as a graphical technique to balance detailed information with the whole context; it changes the meaning and type of information displayed, in contrast to physical zoom that just changes the size and visible details. This technique is useful to display specific information that is hidden in the whole context of a visualisation; for instance, the treemap visualisation representing the whole hierarchy of an ontological model such as depicted in Figure 1(a), hides the properties and individuals of the class. Visualising these individuals is not the purpose of a hierarchical visualisation. If the user would like to go into detail, it would be enough to click on the item representing the class, in order to perform a semantic zoom over the selected class. This interaction would change the information displayed to the user, and all the internal information of the selected class would be displayed in a different and more specialised visualisation, illustrated in Figure 2. This figure illustrates one of the classes in the model created by one of the students in the evaluation process; it depicts a class at the centre, with its properties surrounding it, as well as the individuals. This
1305Garcia J., Garcia-Penalvo F.J., Theron R., Ordonez de Pablos P. ...

technique also lets users perform what is known as visual querying; by selecting the diverse elements, all the related values are also highlighted. Treemap includes two different semantic zoom visualisations to display the internal components of a class; one of them is shown in Figure 2. It depicts the selection of a class, which is located at the centre, and its properties are located in a radial layout surrounding it. Datatype properties are represented in a soft green tone, having all the internal values inside. For numerical types (integer or float), histogram-like bars are used in order to contrast different values. At the same time, object properties are represented in a soft red tone, also having its internal elements inside them. The visual querying technique is performed by selecting a visual element; for instance, figure 2 depicts the selection of an instance. As a consequence, all the values for this instance in each one of the properties are also highlighted. The inverse process can also be done; by selecting a specific value in a property, all the instances having this value for this property, would be also highlighted.
Figure 2: A semantic zoom view where the user can navigate and query the diverse properties, individuals and its internal values.
The next step in the evaluation process was focused on evaluating the semantic zoom techniques. Each user was asked to provide an evaluation of these visualisations. The second set of direct questions about semantic zoom is listed below:
1306 Garcia J., Garcia-Penalvo F.J., Theron R., Ordonez de Pablos P. ...

1. Is the semantic zoom intuitive enough to show the internal elements of a selected class? (1 - 5)
2. Is the navigation model of these visualisations easy to understand? (1 - 5) 3. Is it clear enough what these visualisations are created for? (1 - 5) 4. What is your satisfaction degree with both these semantic zoom
visualisations? (1 - 5) 5. What extra comments would you like to add?
3.3 Evaluating the Coupling Visualisations
Another aspect that has not been previously evaluated is concerning to the representation of the coupling among classes. Users were asked to navigate the global coupling visualisation, interacting with the diverse elements. This visualisation represents the coupling among all the classes in the ontological model. Classes are organised in a radial layout and the coupling (relationships) is represented with edges that link the coupled classes, following the Holten's proposal described in [Holten, 07]. At this point, users were also asked to navigate the visualisation, and to change the diverse options such as the sphere representation, to develop searches, etc. The navigation with this visual representation includes another semantic zoom representing the single coupling of a selected class, which users were also asked to navigate and interact with. This semantic zoom technique has been proposed and is described in [García, 10], where the coupling is defined as a property that lets two classes to be related to each other.
At this point, each user was asked to answer the third group of direct questions, focused on couplings, which are listed below:
1. Is the coupling visualisation clear enough to represent the relationships like coupling among classes? (1 - 5)
2. Is the navigation easy to perform in this visualisation? (1 - 5) 3. Is the semantic zoom visualisation clear enough to represent the single
coupling of a class? (1 - 5) 4. Are these visualisations easy to learn, use and understand? (1 - 5) 5. What is your degree of satisfaction with both these visualisations? (1 - 5) 6. What extra comments would you like to add?
The details of these visualisations are out of the scope of this paper. Many
examples, images, videos of all the visualisations implemented in the tool, are available on the project’s website1.
3.4 Evaluating the Global User Satisfaction
Once each visualisation was isolated and analysed separately, the final phase of the evaluation involved a global user satisfaction of the tool, as well as the navigation flow, the intuitiveness and the easiness of use. Users were also asked to use another bigger ontology in order to test some aspects of scalability, a crucial aspect in the ontologies modelling field. The selected ontology was SAO v1.25 (Subcellular Anatomy Ontology) freely available and described in [Fong, 07]. This ontology
5 http://ccdb.ucsd.edu/SAO/1.2/SAO.owl
1307Garcia J., Garcia-Penalvo F.J., Theron R., Ordonez de Pablos P. ...
describes the subcellular anatomy of the nervous system, covering nerve cells, their parts and interaction between these parts. This ontology was built in Protege 3.2.x in OWL 1.0, conforms to OWL-DL rules. This ontology was selected as it has almost 800 classes, in order to test the scalability and the navigation flow. Users were asked to load the SAO ontology directly from its URL location. Then, once the ontology was loaded by the tool, users repeated the navigation flow described above, in order to evaluate this new ontology, without modifying it. Once each one of the users navigated all the visualisations of the tool, they were asked to answer more general questions in order to evaluate the whole tool. The last group of questions to evaluate the whole tool are listed below:
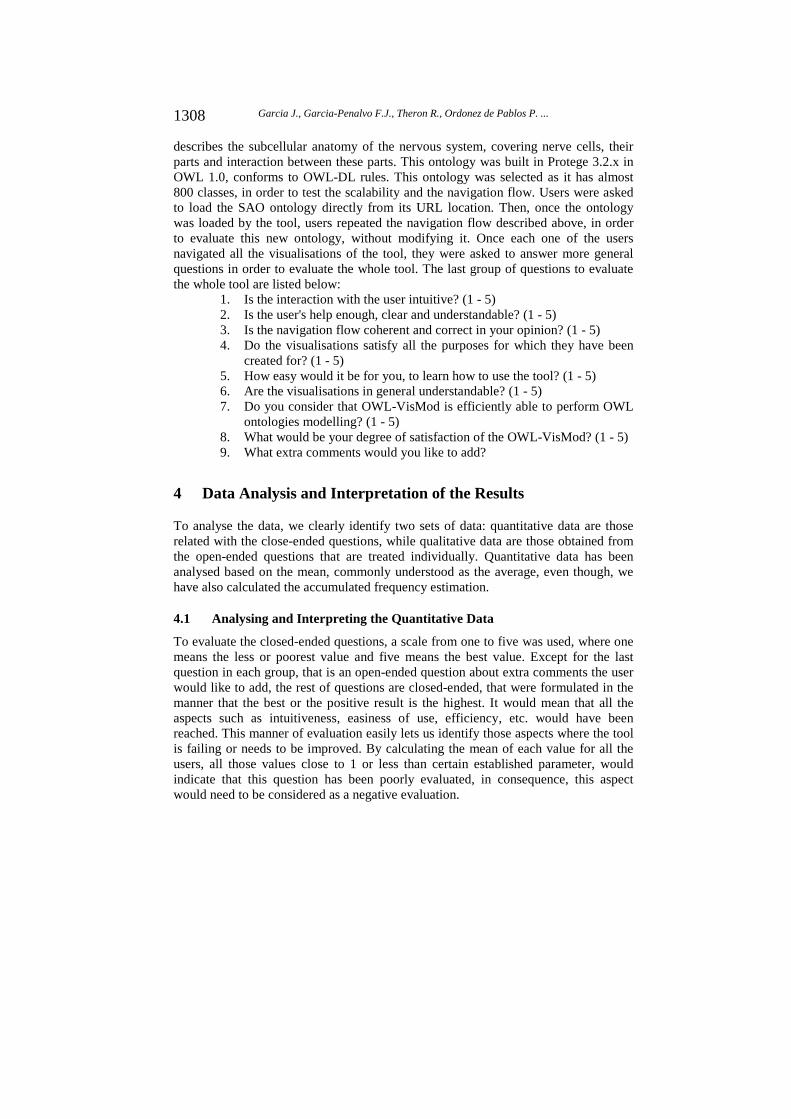
1. Is the interaction with the user intuitive? (1 - 5) 2. Is the user's help enough, clear and understandable? (1 - 5) 3. Is the navigation flow coherent and correct in your opinion? (1 - 5) 4. Do the visualisations satisfy all the purposes for which they have been
created for? (1 - 5) 5. How easy would it be for you, to learn how to use the tool? (1 - 5) 6. Are the visualisations in general understandable? (1 - 5) 7. Do you consider that OWL-VisMod is efficiently able to perform OWL
ontologies modelling? (1 - 5) 8. What would be your degree of satisfaction of the OWL-VisMod? (1 - 5) 9. What extra comments would you like to add?
4 Data Analysis and Interpretation of the Results
To analyse the data, we clearly identify two sets of data: quantitative data are those related with the close-ended questions, while qualitative data are those obtained from the open-ended questions that are treated individually. Quantitative data has been analysed based on the mean, commonly understood as the average, even though, we have also calculated the accumulated frequency estimation.
4.1 Analysing and Interpreting the Quantitative Data
To evaluate the closed-ended questions, a scale from one to five was used, where one means the less or poorest value and five means the best value. Except for the last question in each group, that is an open-ended question about extra comments the user would like to add, the rest of questions are closed-ended, that were formulated in the manner that the best or the positive result is the highest. It would mean that all the aspects such as intuitiveness, easiness of use, efficiency, etc. would have been reached. This manner of evaluation easily lets us identify those aspects where the tool is failing or needs to be improved. By calculating the mean of each value for all the users, all those values close to 1 or less than certain established parameter, would indicate that this question has been poorly evaluated, in consequence, this aspect would need to be considered as a negative evaluation.
1308 Garcia J., Garcia-Penalvo F.J., Theron R., Ordonez de Pablos P. ...
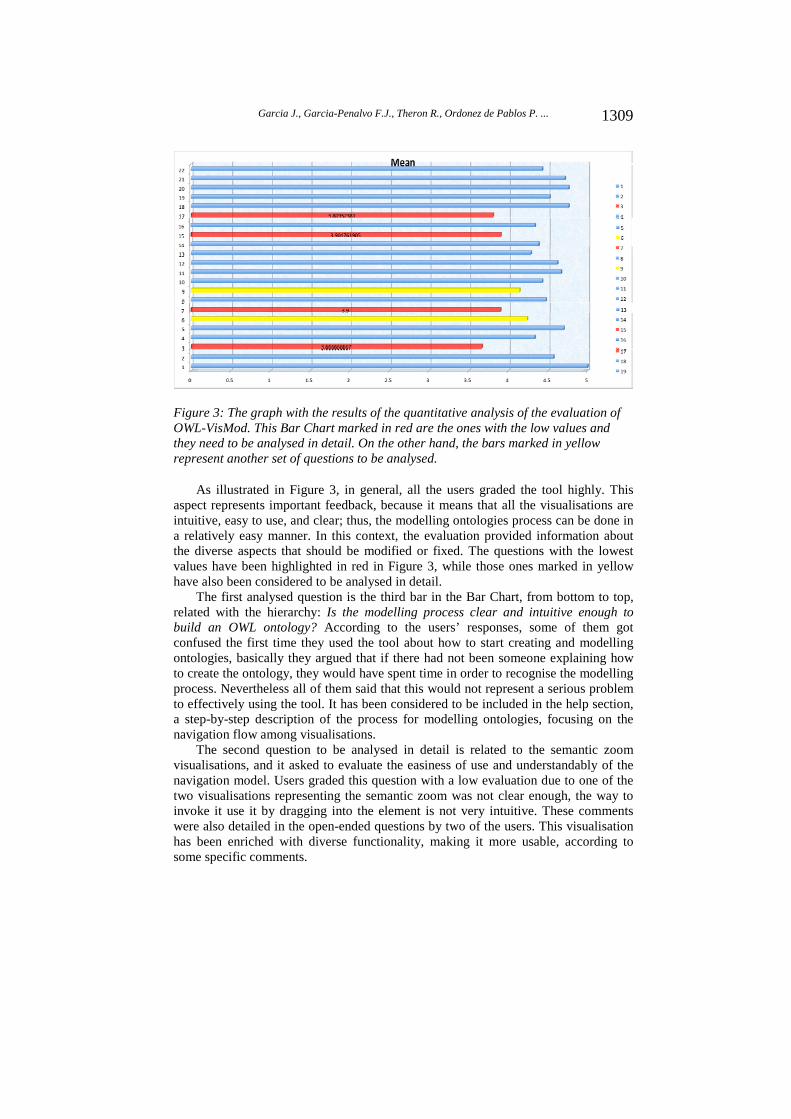
Figure 3: The graph with the results of the quantitative analysis of the evaluation of OWL-VisMod. This Bar Chart marked in red are the ones with the low values and they need to be analysed in detail. On the other hand, the bars marked in yellow represent another set of questions to be analysed.
As illustrated in Figure 3, in general, all the users graded the tool highly. This aspect represents important feedback, because it means that all the visualisations are intuitive, easy to use, and clear; thus, the modelling ontologies process can be done in a relatively easy manner. In this context, the evaluation provided information about the diverse aspects that should be modified or fixed. The questions with the lowest values have been highlighted in red in Figure 3, while those ones marked in yellow have also been considered to be analysed in detail.
The first analysed question is the third bar in the Bar Chart, from bottom to top, related with the hierarchy: Is the modelling process clear and intuitive enough to build an OWL ontology? According to the users’ responses, some of them got confused the first time they used the tool about how to start creating and modelling ontologies, basically they argued that if there had not been someone explaining how to create the ontology, they would have spent time in order to recognise the modelling process. Nevertheless all of them said that this would not represent a serious problem to effectively using the tool. It has been considered to be included in the help section, a step-by-step description of the process for modelling ontologies, focusing on the navigation flow among visualisations.
The second question to be analysed in detail is related to the semantic zoom visualisations, and it asked to evaluate the easiness of use and understandably of the navigation model. Users graded this question with a low evaluation due to one of the two visualisations representing the semantic zoom was not clear enough, the way to invoke it use it by dragging into the element is not very intuitive. These comments were also detailed in the open-ended questions by two of the users. This visualisation has been enriched with diverse functionality, making it more usable, according to some specific comments.
1309Garcia J., Garcia-Penalvo F.J., Theron R., Ordonez de Pablos P. ...

The third question is related to the second one; it asked about the degree of satisfaction with both semantic zoom visualisations. In general, a comment about one of these visualisations was that it was not very clear on how to invoke it, by dragging the class out of the treemap. More information should be provided to the users in order to clarify this aspect. A possibility is to display a specialised help window depending on the context. For instance, being the user navigating the treemap visualisation, the help window should be specialised in those aspects related to this interaction. This would make it possible for the user to navigate to the specific aspects he / she is interested in, without having to navigate the whole help window.
The fourth question that was evaluated with a low value was the one which was labelled number fifteen, and which asked about the intuitiveness of the user interaction. In general, some users mentioned that certain parts of the tool are not intuitive enough. Especially those options related to the semantic zoom visualisations; the results are not intuitive enough on how to close these visualisations in order to return to the main views. And the drag and drop interaction results are not clear enough, for the first time using the tool. Users suggested the addition of a small close button to clearly indicate how to close the semantic zoom visualisations and return to the main views.
On the other hand, those questions marked in yellow were also analysed being considered as not as crucial as those ones previously mentioned. The first of these questions is: Is the semantic zoom technique intuitive enough to show the internal elements of a selected class? This question has been commented above, and is directly related to the second question above. The following question was also marked in yellow: Is the coupling visualisations clear enough to represent the relationships like coupling among classes? Although the evaluation of the satisfaction degree is not bad, some users suggested diverse specific actions to be taken into account.
The last group of questions are related to the global evaluation of the tool. In this final group, the first question marked in yellow is related to the coherency and the correctness of the navigation flow among visualisations. Some users commented that as it was the first time using the tool it was not very intuitive about the navigation flow and they argued that learning how to use it requires previous explanation. Even though this situation is not as bad as it could be, it represents a good observation from the point of view of the users.
In general, the graph shown in Figure 4 illustrates the accumulated frequencies of the 21 users, and each one of the evaluations for each question. It just represents a second view of the Bar Chart shown in Figure 4, and it confirms all the results obtained from the Bar Chart representing the mean value. In contrast to figure 3, where the mean shows general evaluations, figure 4, provides an evaluation for each of the questions, of each of the users.
1310 Garcia J., Garcia-Penalvo F.J., Theron R., Ordonez de Pablos P. ...

Figure 4: The graph with the accumulated frequencies from the users' evaluation. This image shows each of the values graded by the users to each question, being 22 questions represented in the same number of columns, and 21 users varying in a colour representation.
4.2 Analysing and Interpreting the Qualitative Data
The open-ended questions are intended to be a direct evaluation of those aspects the user would like to be modified, replaced or added. These questions provided full and direct feedback of those aspects that users would like to be implemented or improved in OWL-VisMod. According to them, we detected diverse aspects in the tool that are described in detail below:
Most of the comments from the users were about the semantic zoom; some of them found this visualisation technique confusing at the beginning, especially for those users that are not really involved with ontologies. They argued that this technique can be confusing until the user becomes completely familiar with its significance; it means that users should know about ontologies and knowledge bases. Other comments were about the help, to make it clearer, and also about the possibility of displaying a small video to explain the navigation flow, that sometimes it is not as intuitive as it should. Attending to these suggestions, the website has been enriched with diverse videos and images describing both the visualisations and the navigation flow1.
Another crucial aspect with this evaluation was that tests that were developed have also helped us to detect diverse bugs that we had not previously detected. These aspects that were also detailed represent a crucial result of the evaluation, and without any doubt, the first step to perform in order to improve the tool. Even though these bugs are not considered critical or that they will affect the functionality of the tool,
1311Garcia J., Garcia-Penalvo F.J., Theron R., Ordonez de Pablos P. ...

because most of them are related to refreshing views or repainting visualisations, it is very important to fix them completely. Moreover, more functionality is going to be added to enrich the tool.
5 Conclusions
This work describes an evaluation of OWL-VisMod1, -a visual modelling tool for OWL ontologies-, with a current beta version released. It is crucial to evaluate it in a real scenario with some users. This paper has described a step-by-step evaluation process performed to get a feedback about the tool, especially to know whether or not the targets have been reached. This user-centred evaluation process has been performed making use of questionnaires, with both open-ended and close-ended questions. All the users involved in this activity, were students with different levels of knowledge about ontologies. This feedback leads us to discover the weakest points or those aspects that should be improved; furthermore, it has also leads us to discover some bugs that need to be fixed. This is a crucial aspect to work on; the detection and correction of programming bugs, or functionalities that do not perform as should.
The evaluation process was divided into two parts: the first one based on a quantitative analysis based on closed-ended questions, and a second qualitative analysis based on open-ended questions. The quantitative data analysis showed an evaluation of diverse aspects of the tool, focusing on four groups of activities. On the other hand, the analysis of the qualitative data provided us with detailed information about specific aspects in the tool, that users would prefer to be fixed or even changed.
Acknowledgements
This work was supported by Spanish Government project TIN2010-21695-C02-01, by the Castile and Lion Regional Government through GR47 and also by the Ministerio de Ciencia e Innovacion of Spain under project FI2010-16234.
References
[Benevides, 10] Benevides A., Guizzardi G., Ferreira B., and Andrade J.: Validating modal aspects of ontouml conceptual models using automatically generated visual world structures. Journal of Universal Computer Science, (J.UCS), vol. 16 no. 20:2904–2933, 2010.
[Fong, 07] Fong L., Larson S.D., and Gupta A.: An ontology-driven knowledge environment for subcellular neuroanatomy: Owl: Experiences and directions. In. Proc. CEUR Workshop, ISSN 1613-0073, 2007.
[García, 10] García J., García F., and Theron R.: Visualising semantic coupling among entities in an owl ontology. In. Proc. ONTOSE 2010, Ontology, Conceptualization and Epistemology for Information Systems, Software Engineering and Service Science, Springer, Lecture Notes in Business Information Processing, 2010, Volume 62, Part 3, pp 90-106, 2010.
[Holten, 06] Holten D.: Hierarchical edge bundles: Visualization of adjacency relations in hierarchical data. In IEEE Transactions on Visualization and Computer Graphics (TVCG; Proceedings of Vis/InfoVis 2006), Vol. 12, No. 5, Pages 741 - 748, 2006.
1312 Garcia J., Garcia-Penalvo F.J., Theron R., Ordonez de Pablos P. ...

[Johnson, 91] Johnson B. and Shneiderman B.: Treemaps: a space filling approach to the vi- sualization of hierarchical information structures. Proceedings of the 2nd. IEEE Visualization Conference, pages 284–291, 1991.
[Lazar, 10] Lazar J., Feng J., and Hochheiser H.: Research Methods in Human-Computer In- teraction. John Wiley and Sons, Ltd., Publication, 2010.
[Rego, 11] Rego H., Moreira T., and García-Peñalvo, F. J.: AHKME eLearning Information System: A 3.0 Approach. International Journal of Knowledge Society Research (IJKSR), vol. 2 no. 2:73-81, 2011.
[Sharp, 07] Sharp H., Rogers Y. and Preece J.: Interaction design: beyond human-computer interaction. Wiley & Sons Ltd., second edition, 2007.
[Thalheim, 10] Thalheim B.: Towards a theory of conceptual modelling. Journal of Universal Computer Science (J.UCS), vol. 16 no. 20:3102–3137, 2010.
[ZadJabbari, 10] ZadJabbari B., Wongthongtham P., and Hussain F.: Ontology based approach in knowledge sharing measurement. Journal of Universal Computer Science, vol. 16 no. 6:956–982, 2010.
1313Garcia J., Garcia-Penalvo F.J., Theron R., Ordonez de Pablos P. ...