U.S. Renewables Portfolio Standards
46
E NERGY T ECHNOLOGIES A REA E NERGY A NALYSIS AND E NVIRONMENTAL I MPACTS D IVISION U.S. Renewables Portfolio Standards 2021 Status Update: Early Release Galen Barbose February 2021 This work was funded by the Office of Energy Efficiency and Renewable Energy (Strategic Analysis Team) of the U.S. Department of Energy under Contract No. DE-AC02-05CH11231. Download report and supporting materials at: rps.lbl.gov
Transcript of U.S. Renewables Portfolio Standards

ENERGY TECHNOLOGIES AREA ENERGY ANALYSIS AND ENVIRONMENTAL IMPACTS D IVISION
U.S. Renewables Portfolio Standards 2021 Status Update: Early Release
Galen Barbose
February 2021
This work was funded by the Office of Energy Efficiency and Renewable Energy (Strategic Analysis Team)
of the U.S. Department of Energy under Contract No. DE-AC02-05CH11231.
Download report and supporting materials at: rps.lbl.gov

ENERGY TECHNOLOGIES AREA ENERGY ANALYSIS AND ENVIRONMENTAL IMPACTS D IVISION
Disclaimer This document was prepared as an account of work sponsored by the United States Government. While this document is believed to contain correct information, neither
the United States Government nor any agency thereof, nor The Regents of the University of California, nor any of their employees, makes any warranty, express or implied,
or assumes any legal responsibility for the accuracy, completeness, or usefulness of any information, apparatus, product, or process disclosed, or represents that its use
would not infringe privately owned rights. Reference herein to any specific commercial product, process, or service by its trade name, trademark, manufacturer, or
otherwise, does not necessarily constitute or imply its endorsement, recommendation, or favoring by the United States Government or any agency thereof, or The Regents
of the University of California. The views and opinions of authors expressed herein do not necessarily state or reflect those of the United States Government or any agency
thereof, or The Regents of the University of California.
Ernest Orlando Lawrence Berkeley National Laboratory is an equal opportunity employer.
Copyright NoticeThis manuscript has been authored by an author at Lawrence Berkeley National Laboratory under Contract No. DE-AC02-05CH11231 with the U.S. Department of Energy.
The U.S. Government retains, and the publisher, by accepting the article for publication, acknowledges, that the U.S. Government retains a non-exclusive, paid-up,
irrevocable, worldwide license to publish or reproduce the published form of this manuscript, or allow others to do so, for U.S. Government purposes

Notes on the 2021 Early Release and the Planned 2021 Full Release
Berkeley Lab did not issue an RPS Status Update in 2020
This early release for 2021 is being issued in lieu of the 2020 report
A subsequent “full release” of the 2021 Status Update will be issued later in the calendar year
That full release will include further updates to all data elements contained with the present
report, as well as new material summarizing state and utility clean energy/zero-carbon targets
3
Acronyms
4
ACP: Alternative compliance payment
CCA: Community choice aggregator
CES: Clean energy standard
DG: Distributed generation
DPU: Department of Public Utilities
EIA: Energy Information Administration
ESP: Electricity service provider
GW: Gigawatt
GWh: Gigawatt-hour
IOU: Investor-owned utility
LSE: Load-serving entity
MSW: Municipal solid waste
MW: Megawatt
MWh: Megawatt-hour
NEPOOL: New England Power Pool
OSW: Offshore wind
POU: Publicly owned utility
PPA: Power purchase agreement
PUC: Public utilities commission
RE: Renewable electricity
REC: Renewable electricity certificate
RPS: Renewables portfolio standard
SACP: Solar alternative compliance payment
SREC: Solar renewable electricity certificate
TWh: Terawatt-hour

Highlights
Evolution of state RPS programs: States continue to refine and revise their RPS policies. Among other significant changes
since the start of 2019, eight states enacted higher RPS targets or created new clean-energy/zero-carbon targets (AZ, DC, MD,
NM, NV, VA, WA), in most cases setting targets equal to at least 50% of retail sales.
Historical impacts on renewables development: Roughly half of all growth in U.S. renewable electricity (RE) generation and
capacity since 2000 is associated with state RPS requirements, though that percentage has declined in recent years,
representing 23% of all U.S. RE capacity additions in 2019. However, within particular regions—namely, the Northeast and Mid-
Atlantic—RPS policies have remained a dominant driver for RE growth.
Future RPS demand and incremental needs: RPS demand growth through 2030 will require roughly 90 GW of new RE
capacity and will require total U.S. non-hydro RE generation to reach 17% of electricity sales (compared to 12% in 2019).
Relative to EIA projections, this amounts to roughly one-third of projected RE growth over the next decade.
RPS target achievement to-date: States have generally met their interim RPS targets in recent years, with only a few
exceptions reflecting unique, state-specific issues.
REC pricing trends: Prices for NEPOOL Class I RECs rose steeply over 2019, reaching $40/MWh and remaining at roughly
that level over 2020. PJM Tier I REC prices continued to rise at a modest pace over the course of 2020, reaching $10/MWh by
year-end. Prices for solar RECs remained relatively stable over 2020, and continue to exhibit wide variation across states, with
the highest prices ($200-450/MWh) in NJ, MA, and DC.
RPS compliance costs and cost caps: RPS compliance costs in 2019 averaged roughly 2.6% of retail electricity bills in RPS
states, compared to 2.3% in 2018, with costs in most states ranging from 0.5% to 4.5% of retail electricity bills.
5
Table of Contents
Evolution of State RPS Programs
Historical Impacts of State RPS Policies on Renewables Development
Future RPS Demand and Incremental Needs
RPS Target Achievement To-Date
REC Pricing Trends
RPS Compliance Costs and Cost Caps
Outlook
6
Additional supporting data and documentation available at: rps.lbl.gov
- RPS annual percentage targets by state
- RPS demand projection and underlying load forecasts
- RPS historical compliance data

ENERGY TECHNOLOGIES AREA ENERGY ANALYSIS AND ENVIRONMENTAL IMPACTS D IVISION
Evolution of State RPS Programs

What is a Renewables Portfolio Standard (RPS)?aka Renewable Energy/Electricity Standard (RES)
8
Renewables
Portfolio Standard
A requirement on retail electric suppliers…
To supply a minimum percentage or amount of their retail load…
With eligible sources of renewable energy
Typically Backed with penalties of some form
OftenAccompanied by a tradable renewable energy certificate (REC)
program to facilitate compliance
Never Designed the same in any two states
This report covers U.S. state RPS policies. It does not cover:
Voluntary renewable electricity goals
Broader clean energy standards without a renewables-specific component (briefly discussed in a side-bar)
RPS policies outside of the United States or in U.S. territories

RPS Policies Exist in 30 States and DCApply to 58% of Total U.S. Retail Electricity Sales
9
Source: Berkeley Lab (February 2021)Notes: Target percentages represent the sum
total of all RPS resource tiers, as applicable.
In addition to the RPS policies shown on this
map, voluntary renewable energy goals exist
in a number of U.S. states, and both
mandatory RPS policies and voluntary goals
exist among U.S. territories (American Samoa,
Guam, Puerto Rico, US Virgin Islands).
WI: 10% by 2015
NV: 50% by 2030
TX: 5,880 MW by 2015
PA: 18% by 2021
NJ: 54.1% by 2031
CT: 44% by 2030
MA: 41.1% by 2030 +1%/yr
ME: 84% by 2030
NM: 80% by 2040 (IOUs)
80% by 2050 (co-ops)
CA: 60% by 2030
MN: 26.5% by 2025
Xcel: 31.5% by 2020
IA: 105 MW by 1999
MD: 50% by 2030
RI: 38.5% by 2035
HI: 100% by 2045
AZ: 15% by 2025
NY: 70% by 2030
CO: 30% by 2020 (IOUs)
20% by 2020 (co-ops)
10% by 2020 (munis)
MT: 15% by 2015
DE: 25% by 2026
DC: 100% by 2032
WA: 15% by 2020
NH: 25.2% by 2025
OR: 50% by 2040 (large IOUs)
5-25% by 2025 (other utilities)
VA: 100% by 2045 (Dominion)
or 2050 (Appalachian)
IL: 25% by 2026
VT: 75% by 2032
MO: 15% by 2021
OH: 8.5% by 2026
MI: 15% by 2021
NC: 12.5% by 2021 (IOUs)
10% by 2018 (co-ops and munis)
RPS Policies and Rules Vary Significantly from State to State
10
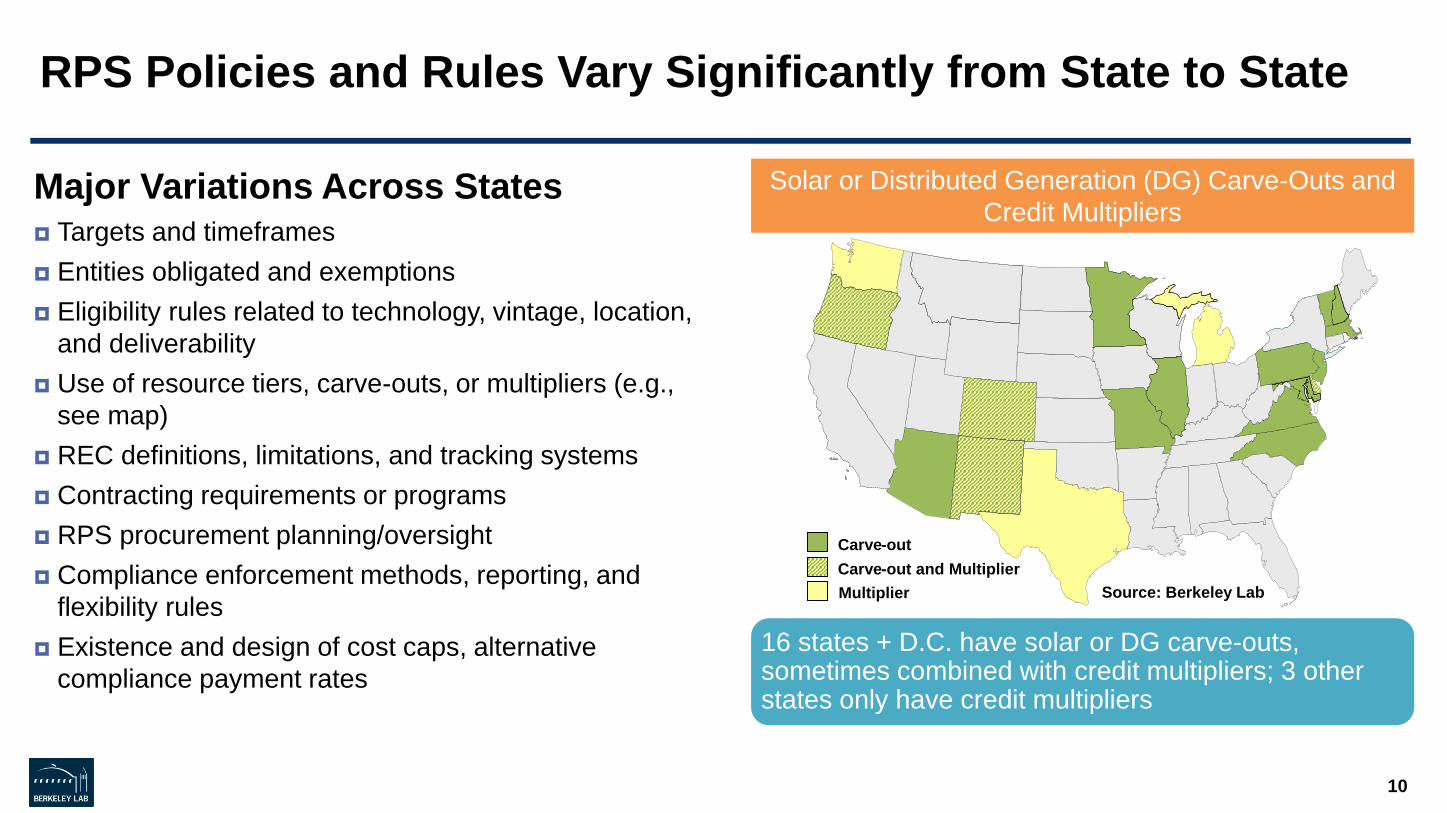
Major Variations Across States Targets and timeframes
Entities obligated and exemptions
Eligibility rules related to technology, vintage, location,
and deliverability
Use of resource tiers, carve-outs, or multipliers (e.g.,
see map)
REC definitions, limitations, and tracking systems
Contracting requirements or programs
RPS procurement planning/oversight
Compliance enforcement methods, reporting, and
flexibility rules
Existence and design of cost caps, alternative
compliance payment rates
Solar or Distributed Generation (DG) Carve-Outs and
Credit Multipliers
16 states + D.C. have solar or DG carve-outs, sometimes combined with credit multipliers; 3 other states only have credit multipliers
Source: Berkeley Lab
Carve-out
Multiplier
Carve-out and Multiplier

CO
HI IL
MA CT MD DC NH MI
ME PA NJ NY DE NC MO
IA MN AZ NV WI TX NM CA RI MT WA OR OH KS VT VA
● ● ● ● ● ● ● ● ● ● ● ● ● ● ● ● ● ● ● ● ● ● ● ● ● ● ● ●1983 1991 1994 1996 1997 1998 1999 2000 2001 2002 2003 2004 2005 2006 2007 2008 2009 2010 2011 2012 2013 2014 2015 2016 2017 2018 2019 2020
IA MN AZ MN NM CT NJ CT AZ CA DC HI CO CA MA CO IL CA DC CT CA CO AZ
WI NV MN NM CO CA CO DE IL DE CT MD CT MA CT IL MA CT DC NJ
NV PA NV CT CT HI ME IL DC NJ MD OH HI MA MD MA MD
TX HI DE MA MN MA DE NH MN OR KS MI ME NJ ME
NJ MD MD NV MD IL NM MT WI VT NY NH NY NM
WI ME NJ OR NJ MA NY NM OR PA NV
MN RI NY MD OH NV RI NY
NJ NC OH
NM WI WA
PA
TX
Most RPS Policies Have Been on the Books for a Decade or MoreBut states continue to make regular and significant revisions
11
Source: Berkeley Lab
Current as of Feb. 2021
RPS Enactment
Major Revisions

General Trends in RPS Revisions
12
Increasing and extending RPS targets: More than half of all RPS states have raised their overall
RPS target or carve-out one or more times since initial RPS adoption; many in recent years
Embedding RPS within broader clean electricity standards: Several states have created 100%
zero-carbon electricity targets or targets for other zero-emission resources, in concert with the RPS
Addressing valuation and integration issues: Several states have created separate energy storage
targets or “clean peak” standards in tandem with an RPS, in order to address RE integration issues
Developing carve-outs to support specific technologies/applications: Emphasis initially on solar
and DG, but some states have phased those out; recent focus on offshore wind, storage, low-income
Long-term contracting programs: Often aimed at regulated distribution utilities in competitive retail
markets; have sometimes targeted specific types of resources (solar/DG, offshore wind)
Adjusting alternative compliance payment (ACP) rates and cost caps: Both increases and
decreases, as states seek to achieve compliance at least-cost
Refining resource eligibility rules: Particularly for hydro and biomass (e.g., related to project size,
vintage, eligible feedstock, repowered facilities); also geographic eligibility rules
RPS Legislation and Other Revisions since January 2019 Most proposals sought to strengthen or make small technical changes
13
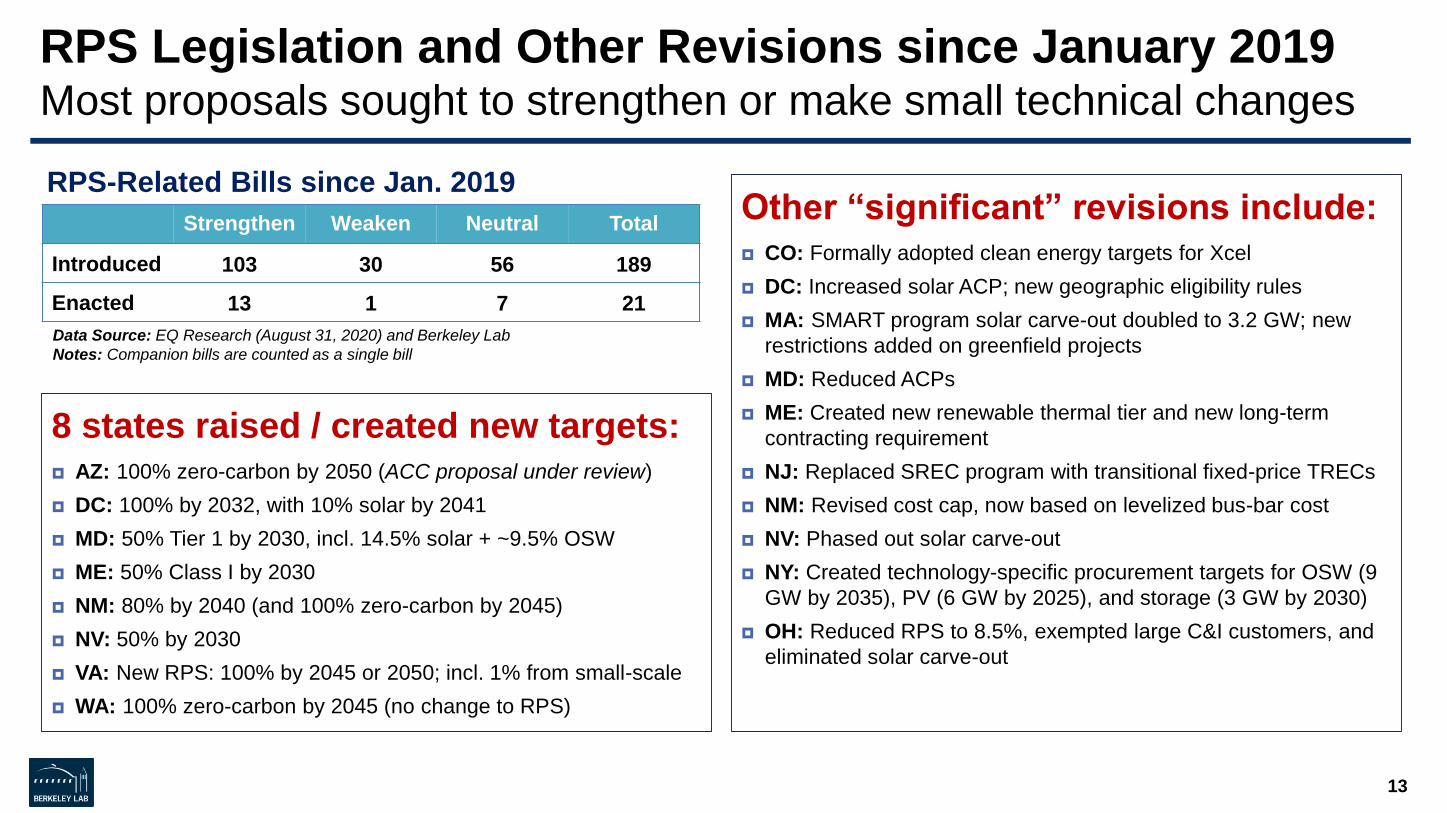
Strengthen Weaken Neutral Total
Introduced 103 30 56 189
Enacted 13 1 7 21
RPS-Related Bills since Jan. 2019
Data Source: EQ Research (August 31, 2020) and Berkeley Lab
Notes: Companion bills are counted as a single bill
8 states raised / created new targets: AZ: 100% zero-carbon by 2050 (ACC proposal under review)
DC: 100% by 2032, with 10% solar by 2041
MD: 50% Tier 1 by 2030, incl. 14.5% solar + ~9.5% OSW
ME: 50% Class I by 2030
NM: 80% by 2040 (and 100% zero-carbon by 2045)
NV: 50% by 2030
VA: New RPS: 100% by 2045 or 2050; incl. 1% from small-scale
WA: 100% zero-carbon by 2045 (no change to RPS)
Other “significant” revisions include: CO: Formally adopted clean energy targets for Xcel
DC: Increased solar ACP; new geographic eligibility rules
MA: SMART program solar carve-out doubled to 3.2 GW; new
restrictions added on greenfield projects
MD: Reduced ACPs
ME: Created new renewable thermal tier and new long-term
contracting requirement
NJ: Replaced SREC program with transitional fixed-price TRECs
NM: Revised cost cap, now based on levelized bus-bar cost
NV: Phased out solar carve-out
NY: Created technology-specific procurement targets for OSW (9
GW by 2035), PV (6 GW by 2025), and storage (3 GW by 2030)
OH: Reduced RPS to 8.5%, exempted large C&I customers, and
eliminated solar carve-out

ENERGY TECHNOLOGIES AREA ENERGY ANALYSIS AND ENVIRONMENTAL IMPACTS D IVISION
Historical Impacts of State RPS Policies on
Renewables Development

RPS Policies Exist amidst a Broader Array of Market and
Policy Drivers for RE Growth
15
RE Growth
Declining RE Costs
Other State
PoliciesPURPA
RPS Policies
Federal Tax
Credits
Green Power
Markets
Parsing out the incremental impact of individual drivers for RE growth is challenging, given the many overlaps and interactions
We present two simple approaches to
gauge the impact of RPS policies on RE
growth—without claiming strict attribution:
1. Compare total historical RE growth to the
minimum amount required to meet RPS
demand
2. Quantify the portion of historical RE
capacity additions directly serving entities
with RPS obligations

RPS Policies Have Been One Key Driver for RE Generation Growth RPS requirements constitute 45% of total U.S. RE growth since 2000
16
Growth in Non-Hydro Renewable
Generation: 2000-2019
Notes: Minimum Growth Required for RPS excludes contributions to RPS compliance
from pre-2000 vintage facilities, and from hydro, municipal solid waste, and non-RE
technologies. This comparison focuses on non-hydro RE, because RPS rules
typically allow only limited forms hydro for compliance.
Total non-hydro RE generation in the U.S. grew by 402
TWh since 2000
RPS policies required a 189 TWh increase over the same
period (45% of total RE growth)
Not strict attribution: some of that would have occurred
without RPS
At the same time, RPS may have helped to stimulate
RE cost reductions and industry development,
facilitating RE growth outside of RPS programs
RE growth outside of RPS’s associated with:
Voluntary green power markets (~150 TWh)
Economic utility purchases, often supported by
integrated resource planning processes
Net-metered PV (often not counted towards RPS)

RPS Role in Driving RE Growth Varies by RegionMost critical in the Northeast and Mid-Atlantic; less so in other regions
17
Growth in Non-Hydro Renewable
Generation: 2000-2019
Notes: Northeast consists of New England states plus New York. Mid-Atlantic consists
of states that are primarily within PJM, in terms of load served.
Northeast and Mid-Atlantic: RPS needs have
outpaced actual RE growth, suggesting that RPS
demand has been a key driver
West: Actual RE growth has exceeded RPS
requirements, partly due to net metered PV in CA
Texas and the Midwest: RE growth has far
outpaced RPS needs, driven by attractive wind
energy economics
Southeast: Negligible regional RPS demand (NC),
though some RE growth serves RPS demand in
PJM
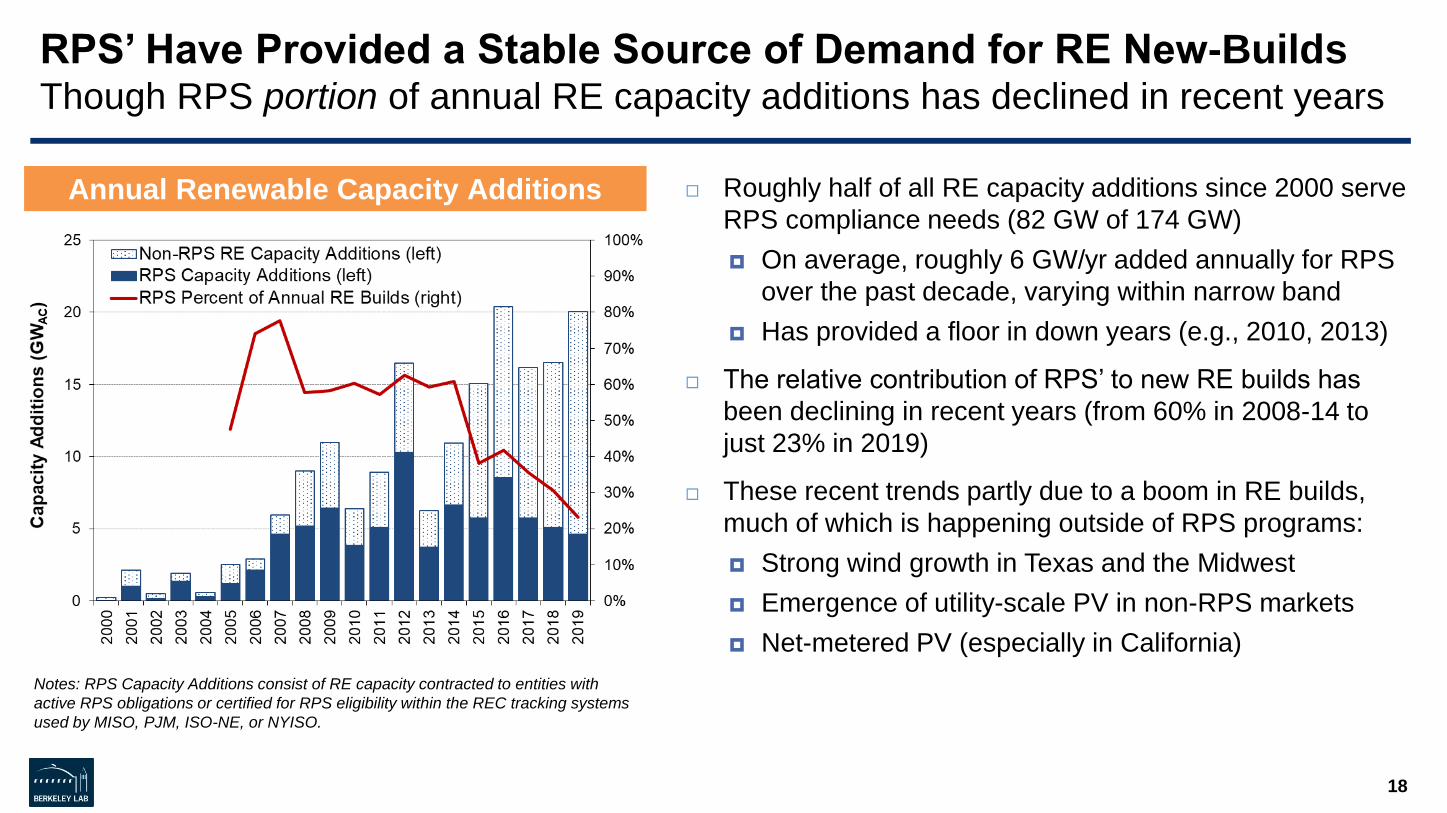
RPS’ Have Provided a Stable Source of Demand for RE New-BuildsThough RPS portion of annual RE capacity additions has declined in recent years
18
Annual Renewable Capacity Additions
Notes: RPS Capacity Additions consist of RE capacity contracted to entities with
active RPS obligations or certified for RPS eligibility within the REC tracking systems
used by MISO, PJM, ISO-NE, or NYISO.
Roughly half of all RE capacity additions since 2000 serve
RPS compliance needs (82 GW of 174 GW)
On average, roughly 6 GW/yr added annually for RPS
over the past decade, varying within narrow band
Has provided a floor in down years (e.g., 2010, 2013)
The relative contribution of RPS’ to new RE builds has
been declining in recent years (from 60% in 2008-14 to
just 23% in 2019)
These recent trends partly due to a boom in RE builds,
much of which is happening outside of RPS programs:
Strong wind growth in Texas and the Midwest
Emergence of utility-scale PV in non-RPS markets
Net-metered PV (especially in California)

RPS Policies Remain Central to RE Growth in Particular RegionsRecent RE additions in Northeast and Mid-Atlantic primarily serve RPS demand
19
Notes: See previous slides for regional definitions and for decision rules on how RPS Capacity
Additions are determined
RPS policies have been a larger driver in… Northeast: Relatively small market, but almost all
capacity additions serving RPS demand
Mid-Atlantic: Combo of solar carve-out capacity and
wind projects (merchant or corporate procurement, but
RPS-certified and likely selling RECs for RPS needs)
West: The bulk of U.S. RPS capacity additions in
recent years; split evenly between CA and other states
But have been a smaller driver in… Texas: Achieved its final RPS target in 2008 (7 years
ahead of schedule); all growth since is Non-RPS
Midwest: Lots of wind development throughout the
region, some contracted to utilities with RPS needs
Southeast: RE growth almost all utility-scale PV;
primarily driven by PURPA and utility procurement, but
some serving RPS demand in NC and PJM
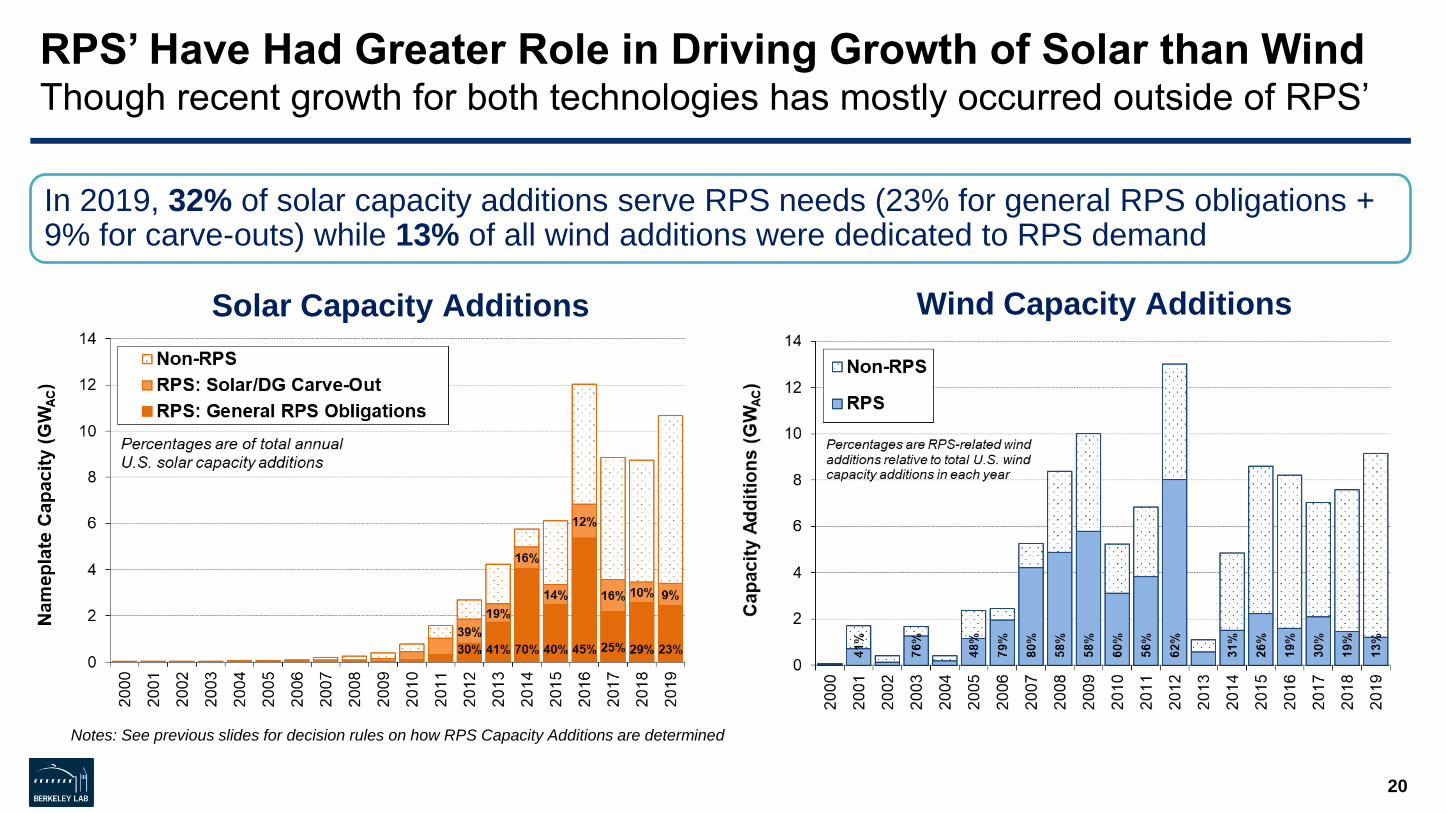
RPS’ Have Had Greater Role in Driving Growth of Solar than WindThough recent growth for both technologies has mostly occurred outside of RPS’
20
Solar Capacity Additions Wind Capacity Additions
In 2019, 32% of solar capacity additions serve RPS needs (23% for general RPS obligations + 9% for carve-outs) while 13% of all wind additions were dedicated to RPS demand
Notes: See previous slides for decision rules on how RPS Capacity Additions are determined
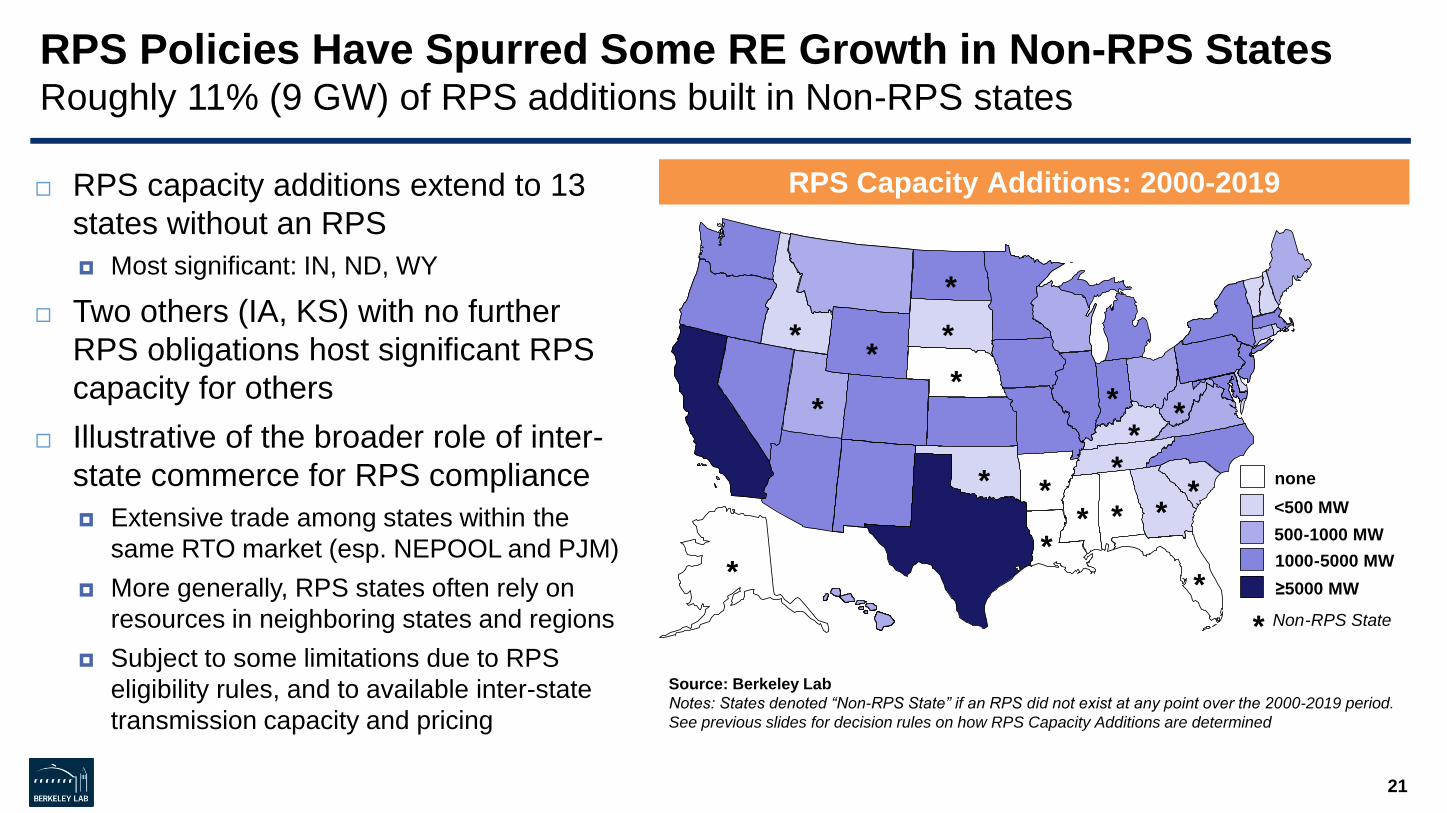
RPS Policies Have Spurred Some RE Growth in Non-RPS StatesRoughly 11% (9 GW) of RPS additions built in Non-RPS states
21
RPS Capacity Additions: 2000-2019
Source: Berkeley Lab
Notes: States denoted “Non-RPS State” if an RPS did not exist at any point over the 2000-2019 period.
See previous slides for decision rules on how RPS Capacity Additions are determined
<500 MW
1000-5000 MW
500-1000 MW
≥5000 MW
none
Non-RPS State
**
* *
*
*
*
*
**
**
** * *
**
*
*
RPS capacity additions extend to 13
states without an RPS
Most significant: IN, ND, WY
Two others (IA, KS) with no further
RPS obligations host significant RPS
capacity for others
Illustrative of the broader role of inter-
state commerce for RPS compliance
Extensive trade among states within the
same RTO market (esp. NEPOOL and PJM)
More generally, RPS states often rely on
resources in neighboring states and regions
Subject to some limitations due to RPS
eligibility rules, and to available inter-state
transmission capacity and pricing

ENERGY TECHNOLOGIES AREA ENERGY ANALYSIS AND ENVIRONMENTAL IMPACTS D IVISION
Future RPS Demand and Incremental Needs

Half of States Have Longer-Term Targets (2030 or Beyond)
23
Year of Maximum RPS Percentage Requirement
10 states have already passed
their final RPS target year or will
do so this year
6 states will hit their
final RPS target
year in 2025 or 2026
15 states have targets extending
to 2030 or beyond
(MA has no final target year)
IA
MT
TX
WINC
(POUs)
CO
MN (Xcel)
WA
MI
MO
NC (IOUs)
PA
AZ
MN
NH
OR(POUs)
DE
IL
OH
CA
CT
MD
ME
NV
NY NJ
DC
VT RI
NM(IOUs)
OR(IOUs) HI
NM(Coops)
VA
● ● ● ● ● ● ● ● ● ● ● ● ● ● ● ● ● ● ● ● MA
1999 2015 2016 2017 2018 2019 2020 2021 2022 2023 2024 2025 2026 2030 2031 2032 2035 2040 2045 2050

Ultimate RPS Target Levels Vary WidelyThough can sometimes be difficult to compare directly
24
States can generally be grouped into three sets
One contingent of states with final RPS targets of
roughly 15-25% by 2020-2025
A large group of states with much higher targets
(typically 50-100%) by 2030
A smaller set of states with similarly high targets
but longer timeframes (2045-2050)
Comparing nominal percentage targets can be
misleading, due to differences in policy design
E.g., large hydro eligibility, exempt load, etc.
CA, NY, and VA stand out in terms of their
absolute TWh RPS demand, owing to both their
aggressive percentage targets and large sizes
Final RPS Targets and Target Years
Notes: Final RPS Target Year refers to the year in which the statewide RPS
percentage target reaches its maximum, typically remaining at that level in
subsequent years. For states with RPS targets that differ across LSEs, the
percentage targets shown are a weighted average, based on retail sales among
RPS-obligated LSEs. Note that MA’s RPS target continues to rise indefinitely; for
illustrative purposes, we show the target for 2050.

Projected U.S. RPS Demand Grows over time with rising targets and load growth
25
Projected RPS Demand (TWh)
State-level RPS demand projections through 2050 available for download at: rps.lbl.gov
Notes: Projected RPS demand is estimated based on current targets, accounting for
exempt load, likely use of credit multipliers, offsets, and other state-specific
provisions. Underlying retail electricity sales forecasts are based on regional growth
rates from the most-recent EIA Annual Energy Outlook reference case.
Represents gross RPS compliance requirements
Growth is steepest through 2030, reaching 630
TWh, tapering off thereafter as most states pass
their final target year, reaching 840 TWh by 2050
To be sure, increased demand does not equate
to required increase in supply, as some
utilities/regions are ahead of schedule
Also, banked RECs can meet some RPS demand
growth
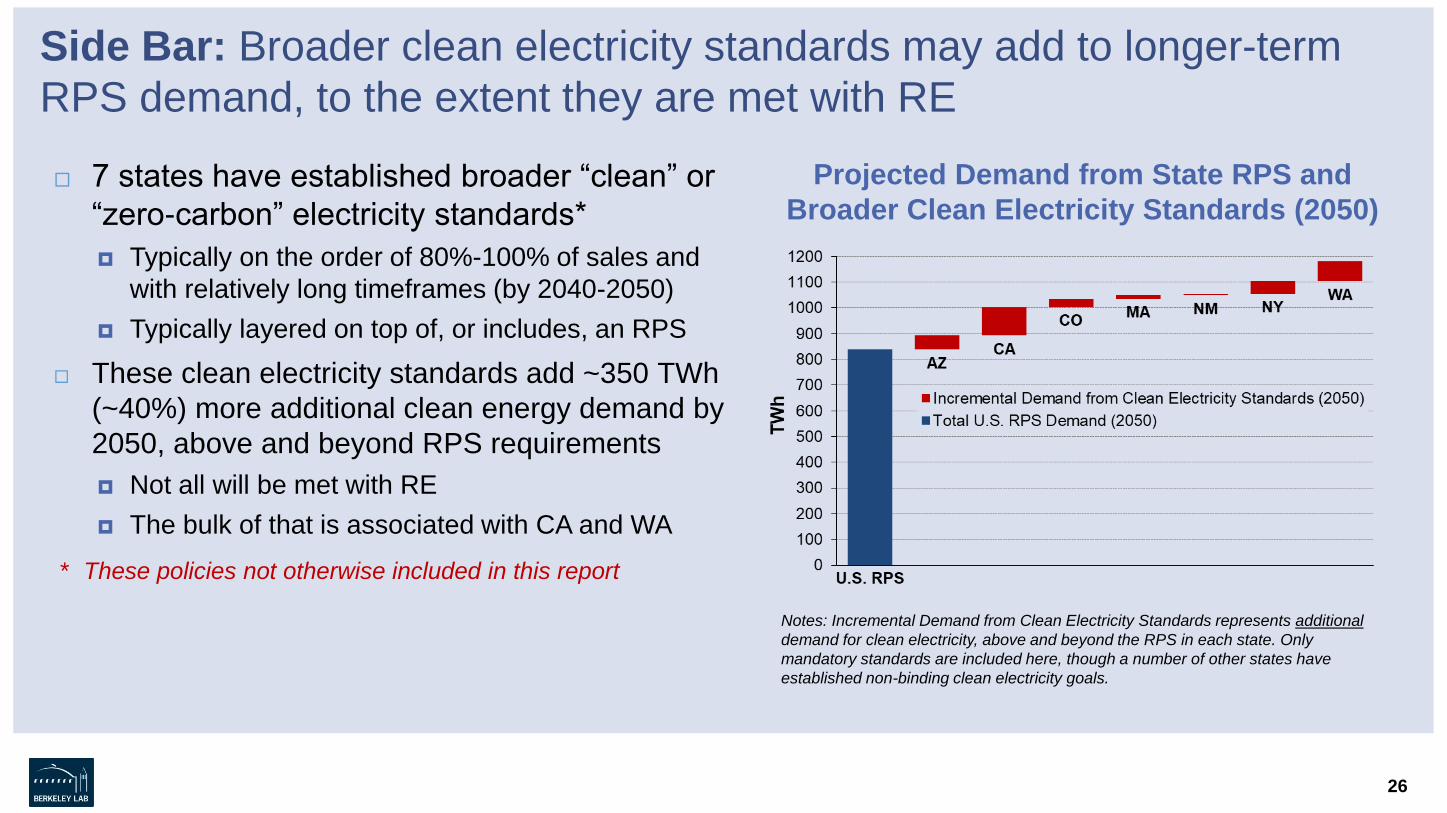
Side Bar: Broader clean electricity standards may add to longer-term
RPS demand, to the extent they are met with RE
7 states have established broader “clean” or
“zero-carbon” electricity standards*
Typically on the order of 80%-100% of sales and
with relatively long timeframes (by 2040-2050)
Typically layered on top of, or includes, an RPS
These clean electricity standards add ~350 TWh
(~40%) more additional clean energy demand by
2050, above and beyond RPS requirements
Not all will be met with RE
The bulk of that is associated with CA and WA
* These policies not otherwise included in this report
26
Projected Demand from State RPS and
Broader Clean Electricity Standards (2050)
Notes: Incremental Demand from Clean Electricity Standards represents additional
demand for clean electricity, above and beyond the RPS in each state. Only
mandatory standards are included here, though a number of other states have
established non-binding clean electricity goals.

Required Increase in RPS Generation Supply250 TWh by 2030, ~50% increase in U.S. Non-Hydro RE from 2019
27
Required Increase in RPS Generation (TWh)
Notes: For regulated states, incremental RPS needs are estimated on a utility-specific basis,
based on each utility’s RPS procurement and REC bank as of year-end 2019. For
restructured states, incremental RPS needs are estimated regionally, based on the pool of
RPS-certified resources registered in the regional REC tracking system, allocated among
states based on eligibility, demand, and other considerations.
Required increase in RPS supply estimated:- Relative to available RPS resources as of year-end 2019
(see figure notes for further details)
- Accounting for REC banking over the forecast period, per
each state’s rules
- With varying assumptions about surplus REC sales by
regulated utilities, depending on the state
Mid-Atlantic: Incr. needs driven by recent RPS
revisions throughout the region, though termination of
OH RPS after 2026 frees up supplies for other states
Northeast: Consists mostly of NY, about 80%
California: IOUs over-supplied due to load migration
to CCAs, and assumed to sell surplus RECs
Non-CA West: Roughly half from NV, the next-largest
NM, in both cases reflecting recent RPS revisions

Required RE Capacity Builds for RPSRoughly 90 GW needed by 2030 (relative to 2019 available supply)
28
Notes: Calculated from estimated incremental generation needed to meet RPS
demand, based on state-specific assumptions about the mix and capacity factor of
new RPS supply. RE Under Development consists of units permitted or under
construction, site preparation, or testing as of Feb. 2021, plus units that entered
commercial operation in 2020 or 2021, based on data from ABB-Ventyx.
Required RPS Capacity Additions (GW) Primarily for the Mid-Atlantic and Northeast
Putting these aggregate needs into context:
More than doubles the amount of RPS capacity
additions to-date (82 GW through 2019)
Equates to an avg. RPS build-rate of 8 GW/yr.
(compared to historical rate of 6 GW/yr)
New RE capacity currently under development
will meet some of that incremental need
Not all of that capacity will be available for RPS needs
or is completely fungible within a region
Some capacity under development may serve adjacent
regions (e.g., Midwest RE serving Mid-Atlantic RPS’)

Comparison of U.S. RPS Demand and RE SupplyEIA-forecasted RE growth projected to well-exceed minimum RPS needs
29
U.S. RPS Demand vs. RE Supply (% of U.S. Retail Electricity Sales)
Notes: The figure focuses on non-hydro RE, given the limited eligibility of hydro for
state RPS obligations. Accordingly, the Aggregate State RPS Demand excludes
historical and projected contributions by hydro as well as by municipal solid waste,
demand-side management, and other non-RE technologies.
In aggregate, state RPS targets equate to 13%
of U.S. retail electricity sales by 2030
To meet those targets, total U.S. non-hydro RE
supply will need to reach 17% of retail sales
Accounting for the fact that not all existing RE supplies
are available for RPS compliance
EIA projects non-hydro RE generation reaching
28% of retail sales by 2030
Rapid growth prior to expiration of ITC/PTC in early
2020s, followed by slower growth through 2030
Suggests that roughly one-third of RE growth over the
next decade is associated with rising RPS demand

ENERGY TECHNOLOGIES AREA ENERGY ANALYSIS AND ENVIRONMENTAL IMPACTS D IVISION
RPS Target Achievement To-Date
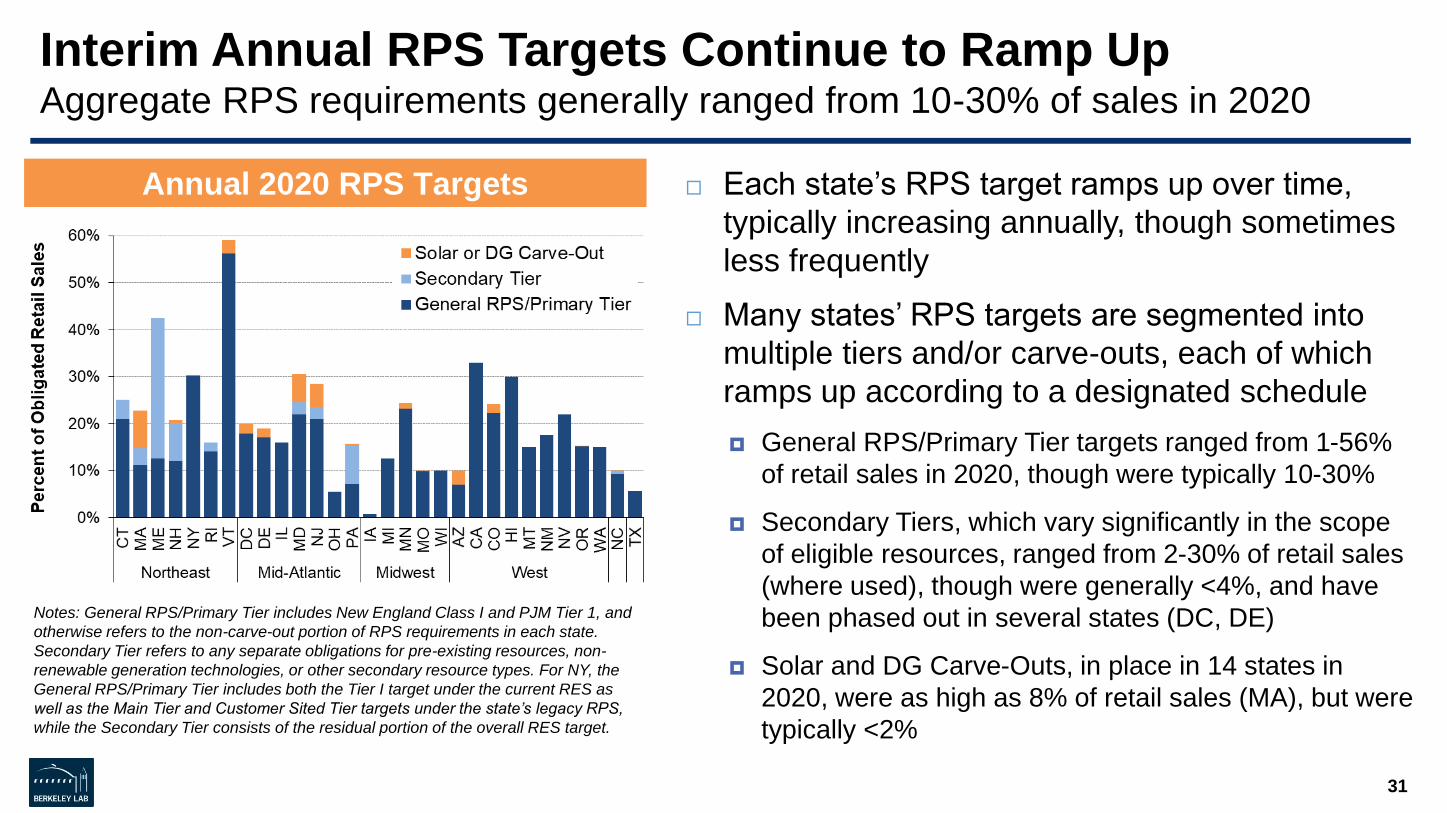
Interim Annual RPS Targets Continue to Ramp UpAggregate RPS requirements generally ranged from 10-30% of sales in 2020
31
Annual 2020 RPS Targets
Notes: General RPS/Primary Tier includes New England Class I and PJM Tier 1, and
otherwise refers to the non-carve-out portion of RPS requirements in each state.
Secondary Tier refers to any separate obligations for pre-existing resources, non-
renewable generation technologies, or other secondary resource types. For NY, the
General RPS/Primary Tier includes both the Tier I target under the current RES as
well as the Main Tier and Customer Sited Tier targets under the state’s legacy RPS,
while the Secondary Tier consists of the residual portion of the overall RES target.
Each state’s RPS target ramps up over time,
typically increasing annually, though sometimes
less frequently
Many states’ RPS targets are segmented into
multiple tiers and/or carve-outs, each of which
ramps up according to a designated schedule
General RPS/Primary Tier targets ranged from 1-56%
of retail sales in 2020, though were typically 10-30%
Secondary Tiers, which vary significantly in the scope
of eligible resources, ranged from 2-30% of retail sales
(where used), though were generally <4%, and have
been phased out in several states (DC, DE)
Solar and DG Carve-Outs, in place in 14 states in
2020, were as high as 8% of retail sales (MA), but were
typically <2%

States Have Generally Met Their Interim TargetsExceptions typically reflect unique state-specific issues
32
Percentage of RPS Obligations Met with RECs or RE
For most-recent compliance year available in each state
Many states/utilities well ahead of schedule, while
others have met interim targets by relying on
stockpiles of banked RECs from prior years
Relatively few instances where interim targets
significantly missed
DC (Solar): In-district eligibility requirements restrict
the pool of supply
IL (General RPS): Reflects procurement lag under
IPA’s new long term planning process, decision to
forego short-term RECs to meet near-term shortfalls
NY (General RPS): LSE reliance on ACPs seemingly
reflects transitional issues during the first years of the
new RES Tier 1 regime, rather than true under-supplyFigure notes: “General RPS Obligations” refers to the non-carve-out portion of RPS requirements in each state. For
New England states, it refers to Class I obligations, and for PJM states it refers to Tier I obligations. The years overlaid
on each bar refer to the most-recent compliance year for which compliance data are available in each state.
Compliance with interim RPS targets typically
demonstrated through annual compliance filings,
albeit with some lag (sometimes >1 year)

ENERGY TECHNOLOGIES AREA ENERGY ANALYSIS AND ENVIRONMENTAL IMPACTS D IVISION
REC Pricing Trends

REC Pricing Trends for Primary Tier RPS ObligationsPrices in 2020 remained high in New England, rose slightly in PJM
34
New England:
• Rising targets pushed Class I prices up dramatically in
2019 to ~$40/MWh, where they remained through 2020
• Lower prices in Maine due to broader biomass eligibility
Mid-Atlantic/PJM:
• Bifurcated market based on geographic eligibility rules
(more restrictive rules & higher prices in NJ/PA/MD/DE)
• Prices rising slowly with growth in regional RPS targets,
reaching ~$10/MWh by end of the year
Source: Marex Spectron. Plotted values are the mid-point of monthly average bid and
offer prices for the current or nearest future compliance year traded in each month.
REC prices are a function of supply-demand
balance, expectations therein, and ACP rates
• As a result, REC prices can be volatile and sensitive to
changes in eligibility rules
• Regional markets in New England and Mid-Atlantic
emerge based on common pools of eligible supply

SREC Pricing Trends for RPS Solar Carve-OutsPrices in most states remained flat through 2020
35
• DC: Acute undersupply due to in-district requirements
• MA: Price movements bounded by clearinghouse floor and
SACP
• NJ: Pricing has remained relatively stable, partly through
legislative changes to the target level
• MD: Prices rose in 2019 after higher targets enacted
• DE, PA, OH heavily oversupplied, in part due to eligibility of
out-of-state projects
• NH: Low solar ACP ($55/MWh)Source: Marex Spectron. Plotted values are the mid-point of monthly average bid and
offer prices for the current or nearest future compliance year traded in each month.
SREC pricing is highly state-specific due to de facto in-state requirements in most states and varying ACPs

ENERGY TECHNOLOGIES AREA ENERGY ANALYSIS AND ENVIRONMENTAL IMPACTS D IVISION
RPS Compliance Costs and Cost Caps

RPS Compliance CostsDefinition, data sources, and limitations
37
RPS Compliance Costs: Net cost to the load-serving entity (LSE), above and beyond what
would have been incurred in the absence of RPS*
Retail Choice States• RPS compliance primarily via unbundled RECs
• We estimate RPS compliance costs based on REC
plus ACP expenditures
• Rely wherever possible on PUC-published data on
actual REC costs; otherwise use broker spot market
prices
Vertically Integrated States• RPS compliance primarily via bundled PPAs
• We synthesize available utility and PUC compliance
cost estimates, which rely on varying methods
• Compliance costs imputed by comparing gross RPS
procurement costs to a counterfactual (e.g., market
prices or a long-term avoided cost projection)
Can be measured in terms of different metrics; we summarize costs primarily in terms of a
percentage of average retail electricity bills in each RPS state
*Key Limitation: The underlying data and methods used here represent only a partial accounting of the full suite of costs and benefits associated with RPS policies—see slide 39 for additional details and indicative ranges for the potential magnitude of those omitted impacts

Side Bar: Impacts Omitted from RPS Compliance Cost Estimates
38
Depending on the state and associated compliance-cost estimation method, some RPS impacts—including both costs and
benefits—may be either omitted or only partially captured in the RPS compliance cost estimates presented here:
Balancing costs: To the extent that these costs are “socialized” rather than paid directly by the generator (e.g., through an integration tariff), they will not be
reflected in REC costs and PPA rates. Most RE integration studies show costs of $1-10/MWh of wind and solar, with variation partly reflecting the size of the
balancing area, RE penetration level, and scope of costs included (Wiser and Bolinger 2018; Wiser et al. 2017).
T&D network upgrades: Beyond any dedicated grid-tie costs paid directly by the generator, RE may also impact the need for T&D network upgrades, whose costs
are socialized. Based on a recent synthesis of transmission cost estimates for utility-scale wind and solar (Gorman et al. 2019), those resources typically entail
average transmission network costs ranging from $2-10/MWh of RE. RPS policies can also impact distribution network costs, to the extent that RPS obligations are
met with distributed RE (primarily via solar/DG carve-outs). Those impacts are highly system-specific and may be either positive or negative, with studies of
distribution network costs often ranging from $0-10/MWh and studies of T&D network benefits due to avoided or deferred investments often ranging from $4-
50/MWh (Gorman et al. 2019).
Wholesale market price suppression: Increased penetration of RE reduces average market clearing prices in bulk power energy and capacity markets, at least
over the short run—representing a consumer benefit in the form of a wealth transfer from generators. Studies of historical energy-market price effects have found
reductions of $0-12/MWh of load served, at varying RE penetration levels and over varying durations (Mills et al. 2019). Depending on the fraction of load exposed
to spot market prices, those price reductions correspond to consumer benefits ranging from roughly $0-300/MWh of RE generation, with a median of ~$30/MWh
across studies and assumptions. These benefits, however, may be partially offset by payments to utilities for the non-depreciated portion of retired baseload plants,
to the extent that those retirements are driven by RE growth.
Energy and capacity value deflation: The energy and capacity value of wind and solar generally decline with penetration, due to a combination of market price
suppression during hours when solar and wind are generating, increased curtailment, and reduced capacity credit. Depending on the specific methods used to
estimate RPS compliance costs, these value deflation effects may not be fully captured. Based on a comprehensive literature survey, Wiser et al. (2017) estimate
that these value deflation effects are equivalent to a cost of ~$5/MWh for wind at low penetrations. At 15% penetration, the equivalent costs range from $5-15/MWh
for wind and from $10-30/MWh for solar.
Broader societal impacts: Beyond those costs and benefits directly incident on utilities and ratepayers, RPS policies have broader effects that may also have
motivated their enactment and be relevant to their evaluation. Wiser et al. (2016) evaluated a subset of those impacts on a retrospective basis, estimating $26-
101/MWh of human health benefits from reduced air pollution, $7-64/MWh of global benefits from reduced carbon emissions, and $13-37/MWh of consumer benefits
from reduced natural gas prices, among other impacts.

RPS Compliance Costs as a Percentage of Customer BillsAveraged 2.6% of retail electricity bills in 2019
39
RPS Compliance CostsPercentage of Average Retail Electricity Bill
Costs as a percent of retail bills have risen over time
with rising targets, as discussed on previous slide
Wide variability across states, as evident by
percentile bands, ranging from 0.5% to 4.5% in 2019
(more detail on the next slide)
A proxy for “rate impact”, albeit a rough one:
– Some impacts, both positive and negative, not fully
captured (as discussed on the preceding slide)
– Compliance costs borne by LSE not always fully or
immediately passed through to ratepayers
– ACPs may be credited to ratepayers or recycled through
incentive programs
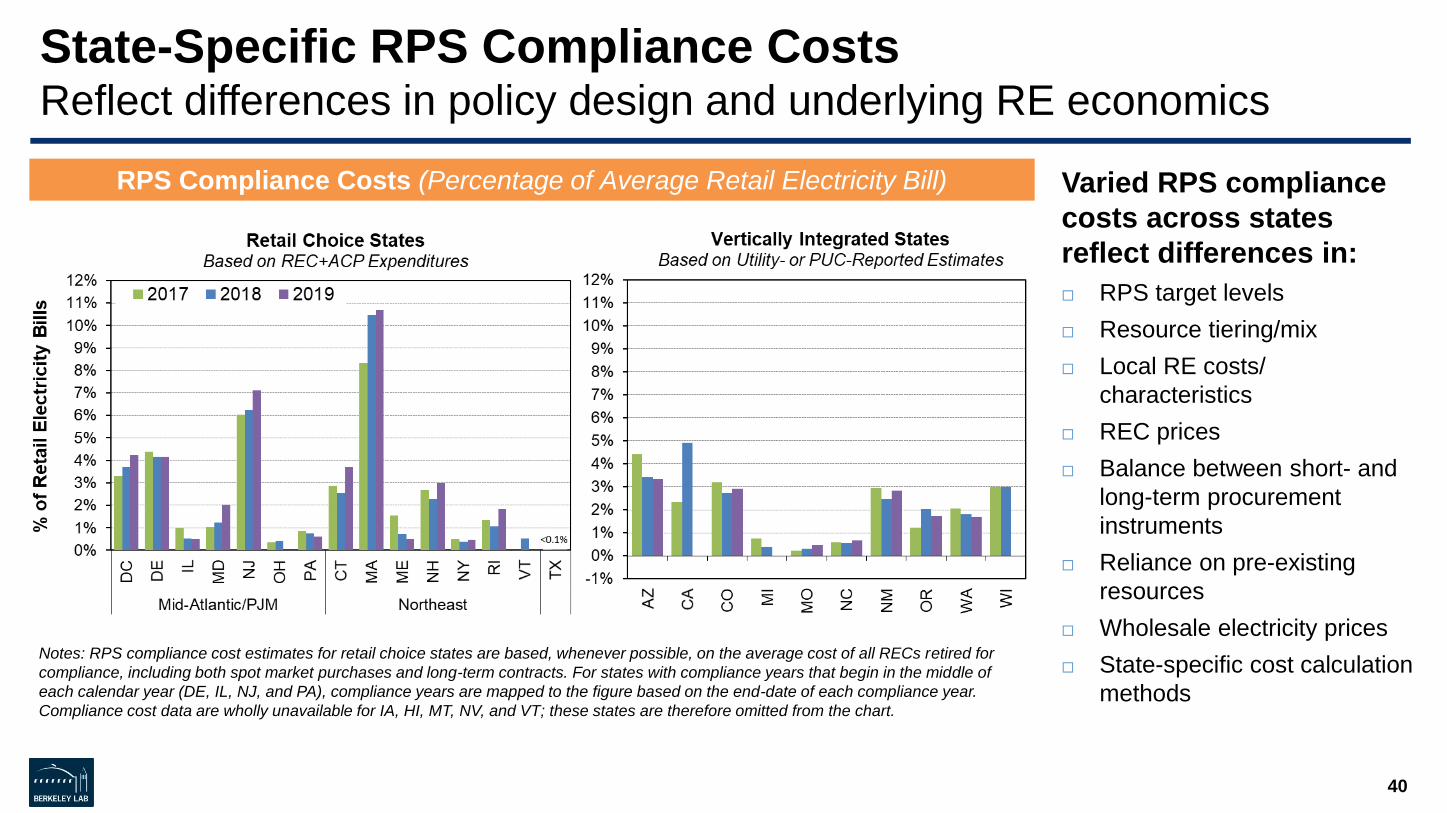
State-Specific RPS Compliance CostsReflect differences in policy design and underlying RE economics
40
RPS Compliance Costs (Percentage of Average Retail Electricity Bill)
Notes: RPS compliance cost estimates for retail choice states are based, whenever possible, on the average cost of all RECs retired for
compliance, including both spot market purchases and long-term contracts. For states with compliance years that begin in the middle of
each calendar year (DE, IL, NJ, and PA), compliance years are mapped to the figure based on the end-date of each compliance year.
Compliance cost data are wholly unavailable for IA, HI, MT, NV, and VT; these states are therefore omitted from the chart.
Varied RPS compliance
costs across states
reflect differences in:
RPS target levels
Resource tiering/mix
Local RE costs/
characteristics
REC prices
Balance between short- and
long-term procurement
instruments
Reliance on pre-existing
resources
Wholesale electricity prices
State-specific cost calculation
methods

RPS Compliance Costs by Resource TierRetail choice states only
41
RPS Compliance Costs (Percentage of Average Retail Electricity Bill)
Notes: RPS compliance cost estimates are based, whenever possible, on the average cost of all RECs retired for compliance, including
both spot market purchases and long-term contracts. For states with compliance years that begin in the middle of each calendar year (DE,
IL, NJ, and PA), compliance years are mapped to the figure based on the end-date of each compliance year.
Primary Tier: Rising REC
prices and targets put upward
pressure on compliance costs
in 2019, muted in some
states by long-term contracts
Secondary Tier: Generally a
marginal contributor to overall
RPS compliance costs, due
to low REC prices
Solar/DG Carve-Out: The
dominant component of RPS
compliance costs in several
states (DC, NJ, MA) with high
SREC prices and/or relatively
high targets

RPS Cost Containment MechanismsMay cap growth in RPS compliance costs
42
Notes: Each state’s cost containment mechanism was translated into the equivalent maximum
allowed rate impact. These represent the maximum possible single-year impact, not the maximum
long-term or average impact, which would be less. For ACP states, this generally corresponds to a
scenario in which the final RPS target is achieved entirely with ACPs. For MA, ACPs do not apply to
the SMART program; we therefore used the DPU’s estimated cost of $85/MWh for that portion of the
RPS. The cost cap in PA does not apply to the solar carve-out, and the cost cap in NJ does not
cover the offshore wind carve-out. For CO, the cap represents the maximum allowable surcharge,
but actual compliance costs borne by the utility in any individual year may be greater (and are
smoothed out over time via balancing accounts). Excluded from the chart are states without any
explicit mechanism to cap incremental RPS costs, though many of those states have other
mechanisms or regulatory processes to limit RPS costs.
Recent Costs Compared to Effective Cost Caps
Size of caps varies widely, but typically less than 10% of
retail electricity bills (higher in several states with
particularly aggressive targets or high ACP rates)
In a few instances (IL, NM), states or utilities have hit rate
impact caps and temporarily curtailed RPS procurement
Some cost containment mechanisms are more like “soft”
caps (due to discretion in enforcement or in how costs are
calculated, applicability to only a portion of the RPS, and
multi-year averaging or use of balancing accounts)
RPS policies have various cost containment mechanisms
– ACPs (which cap REC prices)
– Caps on rate impacts or revenue
requirements (gross or net)
– Caps on RPS surcharges
– RE contract price caps
– Financial penalties
– Regulatory oversight of
procurement
Going forward, RPS compliance costs will depend on RE
technology costs and REC prices, electricity prices, natural
gas prices, tax policy, and a variety of other factors
ENERGY TECHNOLOGIES AREA ENERGY ANALYSIS AND ENVIRONMENTAL IMPACTS D IVISION
Outlook

The Future Role & Impact of State RPS Programs Will Depend On…
44
Whether additional states decide to increase and extend RPS targets and/or
adopt broader “clean electricity” mandates encompassing RE
Federal policy and wholesale market design
Other ongoing RPS policy refinements (e.g., REC banking rules, long-term
contracting programs, eligibility rules, etc.)
Complementary efforts to address RE integration and valuation issues, including
continuing evolution of wholesale electricity market design
RE cost and REC price trajectories, and the attendant impacts on RPS
compliance costs

References
Mills, A.D., D. Millstein, R. Wiser, J. Seel, J.P. Carvallo, S. Jeong, and W. Gorman. 2019. Impact of Wind, Solar, and Other Factors on Wholesale Power
Prices: An Historical Analysis—2008 through 2017. Berkeley, CA: Lawrence Berkeley National Laboratory.
Wiser, R., G. Barbose, J. Heeter, T. Mai, L. Bird, M. Bolinger, A. Carpenter, G.A. Heath, D. Keyser, J. Macknick, A.D. Mills, and D. Millstein. 2016. A
Retrospective Analysis of the Benefits and Impacts of US Renewable Portfolio Standards. Lawrence Berkeley National Laboratory and National
Renewable Energy Laboratory.
Wiser, R., A. Mills, J. Seel, T. Levin, A. Botterud. 2017. Impacts of Variable Renewable Energy on Bulk Power System Assets, Pricing, and Costs.
Lawrence Berkeley National Laboratory and Argonne National Laboratory.
Wiser, R. and M. Bolinger. 2018. 2017 Wind Technologies Market Report. Washington D.C.: U. S. Department of Energy.
45
ENERGY TECHNOLOGIES AREA ENERGY ANALYSIS AND ENVIRONMENTAL IMPACTS D IVISION
ContactsGalen Barbose: [email protected], (510) 495-2593
For more informationDownload publications from the Electricity Markets & Policy Group: https://emp.lbl.gov/publications
Sign up for our email list: https://emp.lbl.gov/mailing-list
Follow the Electricity Markets & Policy Group on Twitter: @BerkeleyLabEMP
AcknowledgementsThis work was funded by the Office of Energy Efficiency and Renewable Energy (Strategic Analysis Team) of the U.S. Department of Energy
under Contract No. DE-AC02-05CH11231.