RENEWABLES PORTFOLIO STANDARD 2008 2010 … · 2013-09-20 · CEC‐300‐2013‐010‐SD ......
231
California Energy Commission STAFF DRAFT REPORT RENEWABLES PORTFOLIO STANDARD 2008 ‐ 2010 PROCUREMENT VERIFICATION RPS 2008‐ 2010 Verification Report SEPTEMBER 2013 CEC ‐ 300 ‐ 2013 ‐ 010 ‐ SD
Transcript of RENEWABLES PORTFOLIO STANDARD 2008 2010 … · 2013-09-20 · CEC‐300‐2013‐010‐SD ......

Cal i fornia Energy Commission
STAFF DRAFT REPORT
RENEWABLES PORTFOLIO STANDARD 2008‐2010 PROCUREMENT VERIFICATION RPS 2008‐2010 Verification Report
SEPTEMBER 2013
CEC ‐300 ‐2013 ‐010 ‐SD

CALIFORNIA ENERGY COMMISSION Gina Barkalow Theresa Daniels James Haile Primary Authors Gina Barkalow Project Manager Kate Zocchetti Acting Office Manager RENEWABLE ENERGY OFFICE Suzanne Korosec Deputy Director RENEWABLE ENERGY DIVISION Robert P. Oglesby Executive Director
i
ACKNOWLEDGEMENTS
The Renewables Portfolio Standard 2008‐2010 Procurement Verification Final Commission Report was prepared with contributions from the following:
California Energy Commission
Gabe Herrera Mark Kootstra Michael Nyberg Garry O’Neil Kate Zocchetti
California Public Utilities Commission
Sean Simon Robert Blackney
Oregon Department of Energy
Rebecca O’Neil Juliet Johnson Julie Peacock
Public Utilities Commission of Nevada
Anne‐Marie Cuneo Darci Dalessio
DISCLAIMER
Staff members of the California Energy Commission prepared this report. As such, it does not necessarily represent the views of the Energy Commission, its employees, or the State of California. The Energy Commission, the State of California, its employees, contractors, and subcontractors make no warrant, express or implied, and assume no legal liability for the information in this report; nor does any party represent that the uses of this information will not infringe upon privately owned rights. This report has not been approved or disapproved by the Energy Commission nor has the Commission passed upon the accuracy or adequacy of the information in this report.
ii
PREFACE
The enactment of Senate Bill 1078 (Sher, Chapter 516, Statutes of 2002) in September 2002 created California’s Renewables Portfolio Standard (RPS) program. At the outset, the RPS program required retail sellers of electricity to increase their procurement of eligible renewable energy resources by at least 1 percent per year so that 20 percent of their retail sales are procured from eligible renewable energy resources by 2017. Senate Bill 107 (Simitian and Perata, Chapter 464, Statutes of 2006), accelerated the RPS goal of 20 percent renewables by 2010. In 2011, Governor Jerry Brown signed Senate Bill X1‐2 (Simitian, Chapter 1, Statutes of 2011, First Extraordinary Session), extending the 20 percent Renewables Portfolio Standard target in 2010 to a 33 percent Renewables Portfolio Standard by December 31, 2020, and broadening the scope of the RPS to include local publicly owned electric utilities.
The Energy Commission and the California Public Utilities Commission jointly implement the Renewables Portfolio Standard. Under the Renewables Portfolio Standard, the Energy Commission is charged with certifying eligible renewable energy resources that satisfy RPS procurement requirements and developing an accounting system to verify the compliance of retail sellers’ and local publicly owned electric utilities. Although not legally mandated, the Renewables Portfolio Standard Procurement Verification Report is prepared as part of the Energy Commission’s Renewables Portfolio Standard responsibilities and is intended to convey its verification findings to the California Public Utilities Commission for use in determining the compliance of retail sellers.

iii
ABSTRACT
This Renewables Portfolio Standard 2008‐2010 Procurement Verification Staff Draft Report presents the California Energy Commission’s findings on the amount of renewable energy procured by retail sellers of electricity under California’s Renewables Portfolio Standard (RPS). The report presents RPS procurement verification findings for 16 retail sellers, which include investor‐owned utilities (large and multijurisdictional utilities), electric service providers, and community choice aggregators. The report also includes minor updates to claims made by select retail sellers during 2001 and 2003‐2007.
Keywords: Renewables Portfolio Standard, RPS, Renewable Energy Credits, RECs, renewable attributes, annual procurement target, initial baseline procurement amount, incremental procurement target, certification, verification, generation, investor‐owned utilities, electric service providers, multijurisdictional utilities, community choice aggregators, Western Renewable Energy Generation Information System, WREGIS
Please use the following citation for this report:
Barkalow, Gina, Theresa, Daniels, James, Haile. 2013. Renewables Portfolio Standard 2008‐2010 Procurement Verification Draft Staff Report. California Energy Commission, Renewable Energy Division. CEC‐300‐2013‐010‐SD.
iv
TABLE OF CONTENTS
ACKNOWLEDGEMENTS ....................................................................................................................... i
PREFACE ................................................................................................................................................... ii
ABSTRACT .............................................................................................................................................. iii
TABLE OF CONTENTS ......................................................................................................................... iv
LIST OF FIGURES ................................................................................................................................ viii
LIST OF TABLES .................................................................................................................................. viii
EXECUTIVE SUMMARY ........................................................................................................................ 1
Background ............................................................................................................................................. 1
Report Overview .................................................................................................................................... 2
Conclusions ............................................................................................................................................. 4
CHAPTER 2: Introduction ....................................................................................................................... 5
Overview of the Renewables Portfolio Standard and Verification ................................................. 5
Report Organization and Scope ........................................................................................................... 7
Renewables Portfolio Standard Procurement Targets ...................................................................... 8
CHAPTER 3: Verification Methods ....................................................................................................... 9
Transitioning From the Interim Tracking System to the Western Renewable Energy Generation Information System ........................................................................................................... 9
Renewables Portfolio Standard Certification and Eligibility Date ........................................... 12
Sources of Renewables Portfolio Standard Claims Data ............................................................ 12
Sources of Generation Data ............................................................................................................ 13
Overclaim Analysis ......................................................................................................................... 14
Renewable Energy Credit Claims Relative to the Vintage of the Credits ................................ 14
Multifuel Analysis ........................................................................................................................... 15
Biomethane Analysis ....................................................................................................................... 15
Delivery Requirements For Out‐of‐State Facilities ..................................................................... 15
Verification That Renewable Energy Credits Are Counted Only Once ................................... 16
Coordinating With Other States to Ensure Against Double‐Counting .................................... 17
v
Coordinating With the Voluntary Renewable Energy Credit Market to Ensure Against Double‐Counting ............................................................................................................................. 19
Finalizing Verified Data .................................................................................................................. 20
CHAPTER 4: Verification Issues .......................................................................................................... 22
Verification of Procurement Date Relative to the Vintage of the Renewable Energy Credits .. 22
Multifuel Analysis ................................................................................................................................ 24
Verification Requirements for Biomethane Claims ......................................................................... 26
Verification Process for Biomethane Claims .................................................................................... 29
Verification Analysis of Specific Biomethane Claims ..................................................................... 30
Noble Americas Energy Solutions and Pilot Power Group ....................................................... 30
Pacific Gas and Electric Company ................................................................................................. 30
Verification of Energy Delivery for Out‐of‐State Facilities ............................................................ 31
Pending Claims ................................................................................................................................ 33
Recommendation to Accept Pending Claims .................................................................................. 36
CHAPTER 5: Verification Findings ..................................................................................................... 38
Renewables Portfolio Standard Verification Results ...................................................................... 38
Summary Tables ............................................................................................................................... 38
Verification Results for Investor‐Owned Utilities ........................................................................... 42
Pacific Gas and Electric Company ................................................................................................. 42
San Diego Gas & Electric Company .............................................................................................. 44
Southern California Edison Company .......................................................................................... 46
Verification Results for Small and Multijurisdictional Utilities .................................................... 48
PacifiCorp ......................................................................................................................................... 48
Sierra Pacific Power Company ....................................................................................................... 49
Verification Results for Electric Service Providers and Community Choice Aggregation ....... 50
APS Energy Services ........................................................................................................................ 50
3Phases Energy Services ................................................................................................................. 51
Calpine PowerAmerica‐CA ............................................................................................................ 52
Constellation New Energy .............................................................................................................. 52

vi
Commerce Energy, Inc. ................................................................................................................... 55
Direct Energy Business, LLC .......................................................................................................... 56
Marin Energy Authority (Community Choice Aggregation) .................................................... 57
Noble Americas Energy Solutions ................................................................................................. 58
Pilot Power Group ........................................................................................................................... 59
Praxair Plainfield Inc. ...................................................................................................................... 60
Shell Energy North America .......................................................................................................... 60
Revisions to Previous Years’ Procurement Claims ......................................................................... 62
Southern California Edison Company .......................................................................................... 62
Noble Americas Energy Solutions ................................................................................................. 64
CHAPTER 6: Verification Analysis ..................................................................................................... 65
RPS‐Eligible Procurement by Resource Type .................................................................................. 65
New and Repowered Facilities .......................................................................................................... 68
Transitioning From Interim Tracking System to the Western Renewable Energy Generation Information System .............................................................................................................................. 69
Renewable Energy Certificate Vintage and Retirement Date ........................................................ 70
CHAPTER 7: Verification Limitations and Future Efforts .............................................................. 72
Limitations of the Interim Tracking System ..................................................................................... 72
Procurement Verification ................................................................................................................ 73
Long‐Term Verification ....................................................................................................................... 75
Outlook for Future Reports ................................................................................................................ 76
Glossary .................................................................................................................................................... 77
APPENDIX A: Retail Sellers’ Modified RPS Track Forms and WREGIS Reports ................... A‐1
3Phases Energy Services RPS Procurement Claims Analysis ...................................................... A‐4
APS Energy Services RPS Procurement Claims Analysis ............................................................ A‐5
Calpine Power America‐CA RPS Procurement Claims Analysis ............................................... A‐6
Commerce Energy, Inc., RPS Procurement Claims Analysis ...................................................... A‐8
Constellation NewEnergy RPS Procurement Claims Analysis ................................................. A‐10
Direct Energy Business, LLC RPS Procurement Claims Analysis ............................................ A‐14
vii
Marin Energy Authority RPS Procurement Claims Analysis .................................................... A‐16
Noble Americas Energy Solutions LLC RPS Procurement Claims Analysis .......................... A‐17
Pilot Power Group, Inc. RPS Procurement Claims Analysis ..................................................... A‐20
Praxair Plainfield, Inc. RPS Procurement Claims Analysis ........................................................ A‐22
Shell Energy RPS Procurement Claims Analysis ........................................................................ A‐23
PacifiCorp RPS Procurement Claims Analysis ............................................................................ A‐29
Sierra Pacific Power RPS Procurement Claims Analysis............................................................ A‐43
Pacific Gas and Electric RPS Procurement Claims Analysis ...................................................... A‐46
Southern California Edison RPS Procurement Claims Analysis ............................................... A‐93
SDG&E RPS Procurement Claims Analysis ............................................................................... A‐130
viii
LIST OF FIGURES
Figure 1: Locations Along Biomethane Delivery Path Where Data Must Be Gathered ................. 28
Figure 2: Template Summary of RPS Procurement (kWh) ................................................................ 40
Figure 3: Annual Procurement by Fuel Type for 2008 to 2010 .......................................................... 67
Figure 4: Total Procurement for Entire Compliance Period (2008 to 2010) by Fuel Type ............. 67
Figure 5: Chart Showing the Amount of Generation (MWh) Procured From New and Repowered Facilities for Each Year From 2008 to 2010. ............................................................. 69
Figure 6: Usage of Each Reporting System as a Percentage of Total Procurement ........................ 69
LIST OF TABLES
Table 1: Noble and Pilot 2008‐2010 Biomethane Claim Analysis ...................................................... 30
Table 2: PG&E 2008‐2010 Biomethane Claim Analysis ...................................................................... 30
Table 3: Retail Sellers’ Pending Claims – RPS ID Not in Misc Field, but in Comment Field ........ 33
Table 4: Retail Sellers’ 2008‐2010 Pending RPS‐Procurement Claims – No RPS ID on e‐Tag ....... 35
Table 5: PG&E Summary of RPS Procurement (kWh) ........................................................................ 42
Table 6: PG&E Withdrawn Claims to Be Added In Future Verification Reports (kWh) ............... 43
Table 7: SDG&E Summary of RPS Procurement (kWh) ..................................................................... 45
Table 8: SCE Summary of RPS Procurement (kWh) ........................................................................... 46
Table 9: PacifiCorp Summary of RPS Procurement (kWh) ................................................................ 48
Table 10:Sierra Pacific Summary of RPS Procurement (kWh) ........................................................... 49
Table 11: APSES Summary of RPS Procurement (kWh) for 2008 ...................................................... 50
Table 12: 3Phases Summary of RPS Procurement (kWh) ................................................................... 51
Table 13: Calpine PowerAmerica‐CA, LLC, Summary of RPS Procurement (kWh) ...................... 52
Table 14: CNE Summary of RPS Procurement (kWh) ........................................................................ 54
Table 15: Commerce Summary of RPS Procurement (kWh) .............................................................. 55
Table 16: Direct Energy Business, LLC, Summary of RPS Procurement (kWh) ............................. 56
Table 17: Marin Energy Authority Summary of RPS Procurement (kWh) ...................................... 57

ix
Table 18: Noble Americas Summary of RPS Procurement (kWh) .................................................... 58
Table 19: Pilot Power Summary of RPS Procurement (kWh) ............................................................ 59
Table 20: Praxair Plainfield Summary of RPS Procurement (kWh) .................................................. 60
Table 21: Shell Energy Summary of RPS Procurement (kWh) .......................................................... 60
Table 22: Southern California Edison’s Updated RPS Procurement Claims by Year (kWh) ........ 63
Table 23: Southern California Edisonʹs Updated 2001 and 2003‐2007 RPS‐Eligible Procurement 63
Table 24: Noble Americas Energy Solution’s Updated 2007 RPS‐Eligible Procurement ............... 64
Table 25: 2008‐2010 RPS‐Eligible Procurement by Resource Type (MWh) ...................................... 66
Table 26: New and Repowered RPS Procurement .............................................................................. 68
Table 27: WREGIS Claims That Exceeded REC Retirement Requirement Limits .......................... 70

1
EXECUTIVE SUMMARY
Background California’s Renewables Portfolio Standard, enacted in 2002, required retail sellers of electricity to increase their procurement of eligible renewable energy resources by at least 1 percent per year so that 20 percent of their retail sales were procured from eligible renewable energy resources by 2017. Subsequent changes to law first accelerated the 20 percent goal to 2010, then added an increased goal of 33 percent by 2020 and broadened the scope of the Renewables Portfolio Standard to include local publicly owned electric utilities starting in 2011.
The California Energy Commission and the California Public Utilities Commission jointly implement the Renewables Portfolio Standard program. The Energy Commission certifies eligible renewable energy resources for the Renewables Portfolio Standard and verifies the procurement claims of retail sellers for the California Public Utilities Commission to use when determining retail sellers’ compliance with the Renewables Portfolio Standard. Energy Commission staff does not evaluate retail sellers’ progress in meeting Renewables Portfolio Standard procurement obligations.
For years prior to 2011, the California Public Utilities Commission set baseline formulas and annual procurement targets for the Renewables Portfolio Standard, and will determine compliance with procurement requirements for all California retail sellers based on the verified amounts included in this report.
The Energy Commission’s verification reports are not legally mandated but are prepared as part of the Energy Commission’s Renewables Portfolio Standard responsibilities. After the Energy Commission adopts and finalizes the reports, they are transmitted to the California Public Utilities Commission.
The Renewables Portfolio Standard 2008‐2010 Procurement Verification Final Staff Report (2008‐2010 Verification Report):
• Verifies the Renewables Portfolio Standard eligibility of the renewable energy facilities from which each reporting retail seller is claiming procurement.
• Verifies, to the extent possible, that the amount of renewable electricity procurement claimed by each retail seller was sufficiently generated by each eligible facility.
• Determines the amount of renewable electricity that may be attributed to multifuel facilities, including facilities using biomethane, by comparing the renewable and fossil fuel usage amounts with the amount of allowable fossil fuel usage per eligible facility.
• Verifies, to the extent possible, that out‐of‐state renewable energy facilities satisfy the Energy Commission’s delivery requirements.

2
• Verifies, to the extent possible, that procurement exclusively serves California’s Renewables Portfolio Standard and is not double counted for another renewable energy regulatory or market program.
• Identifies eligible, ineligible, pending, and withdrawn procurement claims for each retail seller and provides the total amount of eligible procurement.
• Analyzes eligible procurement claims by resource type, claims attributed to new and repowered facilities, the transition of retail sellers’ reporting using the Interim Tracking System to the Western Renewable Energy Generation Information System, and the time between the dates of generation and retirement of claims.
• Discusses the limitations of the Energy Commission’s Interim Tracking System established before the development of the Western Renewable Energy Generation Information System, which is now used to track renewable energy procurement in 14 western states, two Canadian provinces, and northern Baja California.
On September 21, 2012, Energy Commission staff held a public workshop to present initial results of its verification process. Among other items, the workshop addressed the date of the procurement relative to the vintage date of a renewable energy credit, biomethane‐related claims, and energy delivery for out‐of‐state facilities.
Report Overview This report compares retail sellers’ procurement claims to generation data submitted by generating facilities to various energy programs to verify that sufficient electricity was generated to substantiate total procurement claims from those facilities. Additional verification is performed to ensure that: procurement has not been claimed before facilities were certified as eligible; fuel requirements for multifuel facilities were met; claims from out‐of‐state facilities met delivery requirements; biomethane claims did not exceed eligible amounts; and claims were not double counted in other states or for the Green‐e Energy voluntary renewable energy program.
This report applies to retail sellers, which include investor‐owned utilities (large, small, and multijurisdictional), electric service providers, and community choice aggregators reporting for 2008 through 2010. A total of 16 retail sellers reported procurement for 2008 through 2010, and although no small utilities reported procurement for those years, two multijurisdictional utilities and one community choice aggregator reported Renewables Portfolio Standard procurement and are included in this report. While local publicly owned electric utilities must now implement a Renewables Portfolio Standard program and report their progress to the Energy Commission, publicly owned utilities are not included in this report. Starting with reporting year 2011, in accordance with Senate Bill X1‐2 (Simitian, Chapter 1, Statutes of 2011, First Extraordinary Session), Energy Commission staff will begin verifying renewable energy procurement claims by local publicly owned electric utilities to determine Renewables Portfolio Standard compliance. Energy Commission staff expects to prepare a separate verification and compliance report specifically for local publicly owned electric utilities.
3
In this report, staffs have verified nearly 550 claims for 2008, more than 600 claims for 2009, and close to 620 claims for 2010. Staff resolved outstanding issues with supporting documentation, with retail sellers in some cases correcting and refilling their procurement claims. During the verification process for 2008‐2010, staff identified and resolved nearly 40 overclaim issues, 12 multifuel issues, and 12 energy delivery issues, and verified biomethane claims for the first time. There are 13 claims listed as pending because of energy delivery concerns. Staff identified and resolved an additional 11 overclaim issues through collaboration with Green‐e Energy’s voluntary renewable energy credit program. Four retail sellers resubmitted 16 revised forms, and 8 retail sellers submitted 15 updated or additional Western Renewable Energy Generation Information System Reports to correct previous procurement claims, which staff accepted if appropriate.
Two retail sellers requested that data from previous reporting years be updated. Staff corrected the 2007 total eligible procurement claim amounts for Noble Americas Energy Solutions LLC and revised the 2001 and 2003‐2007 total eligible amounts for Southern California Edison Company. This report lists these procurement claims to illustrate the procurement changes for the appropriate years and the revised total annual eligible procurement claim amounts. However, because the retail sellers submitted the corrected forms with the ineligible procurement claims removed, these are not outstanding issues.
During verification of 2008‐2010 data, Energy Commission staff developed a process by which retail sellers could request to have reported procurement claim amounts withdrawn rather than have the claims be reported as ineligible. Three investor‐owned utilities and two electric service providers asked staff to remove certain procurement claims that were reported using the Western Renewable Energy Generation Information System rather than have the claims reported as ineligible. The reason for these requests was that when using the Western Renewable Energy Generation Information System for Renewables Portfolio Standard reporting, it is not possible to “unretire” certificates (remove retired renewable energy credits from a retirement subaccount) after 12 months.
Energy Commission staff also analyzed the time between the generation and retirement dates of renewable energy credit claims for purposes of the California Public Utilities Commission’s timing requirements for retirement. PacifiCorp submitted claims in January 2011 using the Interim Tracking System for renewable energy credits with vintage dates of January, February and March 2008. Staff recommends that the Energy Commission in this case determine that the January 2011 retirement date is acceptable because it is consistent with the retail seller’s intention to report its 2008 RPS procurement accurately and in a timely manner.
The findings in the 2008‐2010 Verification Report are based in part on the Energy Commission’s Interim Tracking System. The robustness of the verification process using the Interim Tracking System is limited by the availability and quality of the generation data against which procurement claims are checked; the ability of staff to account for renewable energy procurement claims in the voluntary market and other renewable energy reporting programs, such as those in other states; and the ability of staff to analyze energy delivery documentation

4
when such data are not available from the Western Renewable Energy Generation Information System.
After verification reports are transmitted to the California Public Utilities Commission, the Energy Commission may make correct previous verification report results if staff later learns that revisions are required.
Conclusions The vast majority of the procurement claims detailed in this report were from Renewables Portfolio Standard‐certified facilities with sufficient generation and, for claims from out‐of‐state facilities, sufficient energy deliveries, to cover the total procurement amounts claimed. However, there are pending procurement claims because retail sellers did not include the specific information required by the RPS Eligibility Guidebook, Third Edition, to verify procurement claims from out‐of‐state facilities with energy delivery. Because each retail seller with pending claims provided additional supporting documentation to the Energy Commission, staff recommends that these pending procurement claims be accepted as eligible in the final 2008‐2010 Verification Report. Pending claims may be determined to be eligible upon Energy Commission adoption of the final 2008‐2010 Verification Report.
All retail sellers found to have ineligible procurement claims subsequently revised their RPS reports or requested that Energy Commission staff withdraw the ineligible claim amounts.
At the request of Noble Americas Energy Solutions LLC for 2007 claims and of Southern California Edison Company for 2001 and 2003‐2007 claims, staff reviewed, verified, and revised, as appropriate, the total amounts listed as eligible toward their Renewables Portfolio Standard obligations for those years.
Energy Commission staff finds that the procurement claim amounts listed in this report are eligible to count toward meeting the retail sellers’ Renewables Portfolio Standard obligations. Furthermore, staff recommends that pending procurement claims related to out‐of‐state facilities with energy delivery documentation be accepted as eligible for the Renewables Portfolio Standard. Additionally, Energy Commission staff recommends that PacifiCorp’s 2008 CEC‐RPS‐Track form be considered as effectively submitted on January 27, 2011 for purposes of determining the renewable energy credit retirement date.

5
CHAPTER 2: Introduction Overview of the Renewables Portfolio Standard and Verification This Renewables Portfolio Standard 2008‐2010 Procurement Verification Staff Report (2008‐2010 Verification Report) presents the Energy Commission’s findings on the amount of renewable energy procured by retail sellers of electricity under California’s Renewables Portfolio Standard (RPS).
California’s RPS program was established in 2002 under Senate Bill 1078 (Sher, Chapter 516, Statutes of 2002) with the goal of increasing the percentage of renewable energy in the stateʹs electricity mix to 20 percent of retail sales by 2017. The RPS statutes underscore the importance of increasing the diversity, reliability, public health, and environmental benefits of the state’s energy mix. The Energy Commission’s 2003 Integrated Energy Policy Report (IEPR) recommended accelerating the RPS goal to 20 percent by 2010, and the 2004 IEPR Update further recommended increasing the target to 33 percent by 2020. The stateʹs Energy Action Plan supported this goal.1
In 2006, Senate Bill 107 (Simitian and Perata, Chapter 464, Statutes of 2006) codified Californiaʹs 20 percent by 2010 RPS goal and took effect on January 1, 2007. The legislation required retail sellers of electricity (electric corporations,2 electric service providers [ESPs], and community choice aggregators [CCAs]) to increase renewable energy purchases by at least 1 percent per year with a target of 20 percent renewables by 2010. To broaden the scope of the RPS to include local publicly owned electric utilities3 and to codify the ambitious 33 percent by 2020 goal, Governor Brown signed Senate Bill X1‐2 (Simitian, Chapter 1, Statutes of 2011, First Extraordinary Session) in April 2011. The Energy Commission fully supports the RPS mandate, which will also help the state meet its greenhouse gas reduction target of reaching 1990 emissions levels by 2020.4
Under the RPS statutes the Energy Commission is charged with certifying renewable energy resources (i.e. generation facilities) as eligible for California’s RPS and for developing an accounting system verifying compliance with the RPS. The Energy Commission’s Renewables Portfolio Standard Eligibility Guidebook (RPS Guidebook) specifies the eligibility criteria and process for certifying generating facilities as eligible for the RPS. The eligibility criteria include facility
1 California Energy Commission, http://www.energy.ca.gov/energy_action_plan/index.html.
2 Also referred to as investor‐owned utilities.
3 http://www.leginfo.ca.gov/pub/11‐12/bill/sen/sb_0001‐0050/sbx1_2_bill_20110412_chaptered.pdf.
4 California Energy Commission, 2008 Integrated Energy Policy Report Update, CEC‐100‐2008‐008‐CMF.

6
qualifications by technology, size, resource type, and initial commercial operation date. The RPS Guidebook also now includes reporting and verification requirements under SB X1‐2.5
The Energy Commission worked with the Western Governors’ Association to develop the Western Renewable Energy Generation Information System (WREGIS) to help track and verify renewable energy generation and procurement. WREGIS is an independent renewable energy tracking system for the region covered by the Western Electricity Coordinating Council (WECC).6 WREGIS issues and electronically tracks renewable energy credits (WREGIS Certificates, also known as RECs) representing renewable energy generation and, beginning with 2008 data, is used for RPS reporting and verification.7
The Energy Commission and the California Public Utilities Commission (CPUC) jointly implement the RPS program. For the time frame covered in this Verification Report, the primary responsibilities of the CPUC were to establish RPS baseline formulas, implement annual procurement targets (APTs), determine compliance, and impose penalties for noncompliance for retail sellers. Since the CPUC is responsible for determining compliance, Energy Commission staff is not evaluating retail sellers’ progress in meeting RPS obligations in this report. SB X1‐2 specifies that for “any retail seller procuring at least 14 percent of retail sales from eligible renewable energy resources in 2010, the deficits associated with any previous renewables portfolio standard shall not be added to any procurement requirement…”8 The data contained in this report will be used by the CPUC to determine retail sellers’ RPS compliance. Interested parties should refer to retail sellers’ compliance filings on the CPUC’s website.9
While not legally mandated, the Verification Report is prepared as part of the Energy Commission’s RPS responsibilities. Upon finalization of the 2008‐2010 Verification Report, the Energy Commission will transmit its RPS procurement verification findings to the CPUC. To date, the Energy Commission has published verification reports for compliance years 2004‐2007.
The 2008‐2010 Verification Report includes procurement from 15 entities: Pacific Gas and Electric Company (PG&E); San Diego Gas & Electric Company (SDG&E); Southern California Edison Company (SCE); 3Phases Energy Services; APS Energy Services; Calpine Power America‐CA; Commerce Energy, Inc.; Constellation NewEnergy, Inc.(CNE); Praxair Plainfield Inc.; Pilot Power Group, Inc; Marin Energy Authority; Shell Energy North America. L.P (FKA Coral Power, LLC); Direct Energy (FKA Strategic Energy, LLC); Pacific Power / PacifiCorp, and Sierra
5 California Energy Commission, Renewables Portfolio Standard Eligibility Guidebook, Seventh Edition. May 2013. http://www.energy.ca.gov/renewables/documents/index.html#rps.
6 The Western Electricity Coordinating Council is the regional entity responsible for coordinating and promoting bulk electric system reliability in the Western Interconnection. http://www.wecc.biz/Pages/Default.aspx.
7 For more information about WREGIS go to: http://www.wecc.biz/WREGIS/Pages/default.aspx
8 Public Resources Code section 399.15(a).
9 CPUC Compliance and Reporting: http://www.cpuc.ca.gov/PUC/energy/Renewables/compliance.htm
7
Pacific Power Company.10 For reporting year 2008, a total of 23,889 GWh of renewable energy procurement from 514 generating facilities have been identified as RPS‐eligible. For reporting year 2009, a total of 29,274 GWh of renewable energy procurement from 525 generating facilities have been identified as RPS‐eligible. For reporting year 2010, a total of 31,883 GWh of renewable energy procurement from 557 generating facilities have been identified as RPS‐eligible.
On September 21, 2012, Energy Commission staff held a public workshop to review its preliminary 2008‐2010 RPS procurement verification data findings.11 The “Verification Issues” and “Verification Findings” sections of this report incorporate workshop comments on issues identified with the preliminary 2008‐2010 findings.
Energy Commission staff will incorporate comments on this staff draft report into the draft Commission report, which will be presented for adoption at an Energy Commission business meeting. Upon adoption, the 2008‐2010 Verification Report will be transmitted to the CPUC for use in determining retail sellers’ RPS compliance.
Report Organization and Scope This report is organized into six chapters. Chapter 2 describes the Interim Tracking System (ITS), WREGIS, and the various RPS verification methods. Chapter 3 describes verification issues specific to 2008‐2010, and Chapter 4 provides the retail sellers’ procurement verification findings and staff’s recommendation on pending claims. Chapter 5 presents staff’s procurement claim verification analysis, and Chapter 6 discusses the limitations of the current ITS, long term verification, and outlook for future verification reports.
This 2008‐2010 Verification Report compares RPS procurement claims made by retail sellers with generation data submitted to various energy programs by generating facilities to verify that there was sufficient generation to cover the total amount of procurement from each facility. The report applies to retail sellers, which include large investor‐owned utilities (IOUs), small and multijurisdictional utilities (SMJUs), electric service providers (ESPs), and one community choice aggregator (CCA).12 While there are no small utilities reporting, two multijurisdictional utilities (PacifiCorp and Sierra Pacific Power) are included. Nine ESPs have made RPS procurement claims.13
10 On January 1, 2011, Sierra Pacific Power Company completed transfer of ownership to Liberty Energy‐California Pacific Electric Company (Liberty) and Liberty became responsible for providing services for the electric customers within Sierra’s former California service territory.
11 The workshop notice can be found at http://www.energy.ca.gov/portfolio/notices/2012‐09‐21_workshop/2012‐09‐21_procurement_Verification_Notice.pdf.
12 Marin Energy Authority is the only CCA with claims covered in this report.
13 This report does not cover local publicly owned electric utilities (POUs) because the RPS mandate in SB X1‐2 does not apply to POUs until 2011. Until 2010, POUs were responsible for implementing and enforcing a renewables portfolio standard that recognize “the intent of the Legislature to encourage

8
Renewables Portfolio Standard Procurement Targets For years prior to 2011, under the RPS as enacted by SB 1078 and amended by SB 107, Californiaʹs IOUs, ESPs, SMJUs, and CCAs were required to increase procurement from eligible renewable energy resources by at least 1 percent of their retail sales each year, until they reach 20 percent by 2010.14 SB X1‐2 increased and extended this RPS requirement to 33 percent of retail sales by 2020 and revised the percentage requirements for 2010. For RPS compliance years prior to 2011, three components were used to set each retail seller’s compliance requirements: the initial baseline procurement amount (IBPA), the incremental procurement target (IPT), and the annual procurement target (APT).15
In earlier verification reports, Energy Commission staff calculated retail seller’s initial baseline procurement amounts to be helpful to CPUC staff’s RPS compliance analysis. Because the calculations are performed automatically as part of the CPUC’s current RPS compliance spreadsheet, the Energy Commission staff is not including the baseline calculations in the 2008‐2010 Verification Report.
renewables…” and to report annually to the Energy Commission on their progress (former Public Utilities Code section 387(a), as enacted by SB 1078 and amended by SB 107). With adoption of SB X1‐2, POUs are now required to report RPS claims to the Energy Commission for verification and compliance determinations. The Energy Commission adopted RPS regulations specifying the enforcement procedures for the POUs on June 12, 2013. These regulations will take effect on October 1, 2013. For more information see http://www.energy.ca.gov/portfolio/rps_pou_reports.html.
14 Subject to CPUC rules (Decision 06‐10‐050, R.06‐05‐027, Opinion on Reporting and Compliance Methodology for Renewables Portfolio Standard Program). The 20 percent by 2010 target is also clarified in the above‐referenced CPUC decision.
15 The CPUC implemented these rules in a series of decisions, most notably Decision D.06‐10‐050 for more information and CPUC Compliance and Reporting: http://www.cpuc.ca.gov/PUC/energy/Renewables/compliance.htm

9
CHAPTER 3: Verification Methods This chapter provides an overview of retail sellers’ transition from RPS reporting using the Interim Tracking System (ITS) to using the Western Renewable Energy Generation Information System (WREGIS), as well as specific verification methods used to verify data covered in this report. The ITS was originally characterized as “interim” because the Energy Commission was in the process of developing the WREGIS system as a more robust electronic system to track RPS procurement claims.
WREGIS electronically tracks renewable energy credits (WREGIS Certificates, also known as RECs), representing renewable energy generation. WREGIS has been operational since 2007 and serves as the primary accounting system for the California RPS, as well as for some other states within the region of the Western Electricity Coordinating Council (WECC). Retail sellers authorized WREGIS staff to submit California RPS State/Provincial/Voluntary Compliance Reports (WREGIS Reports) on their behalf to the Energy Commission. The WREGIS Reports provided various retirement subaccount data broken out by monthly megawatt‐hours (MWh) of REC procurement claim amounts listed by RPS‐certified facility and fuel type. For this 2008‐2010 Verification Report, an “RPS claim” or “RPS procurement claim” refers to the amount of electricity a retail seller claimed it procured from a specific RPS‐certified generation facility for the RPS. Appendix A summarizes the information presented.
This verification report is the first one to include data from the WREGIS system. In 2008, about 74 percent of the data reported were through WREGIS with the remaining 26 percent using the ITS. For 2009 and 2010, the majority of claims reported were through WREGIS with 99.9 percent in 2009 and 99.8 percent in 2010.16
Transitioning From the Interim Tracking System to the Western Renewable Energy Generation Information System WREGIS became operational in June 2007. According to the Energy Commission’s RPS Eligibility Guidebook, Third Edition, 17 WREGIS data would replace the ITS for verification of RPS‐eligible energy generated by May 1, 2008. To enable the use of WREGIS, generating facilities, retail sellers, procurement entities, and third parties participating in California’s RPS were required to register as account holders with WREGIS by January 1, 2008, with the exception of the three large IOUs (PG&E, SDG&E, and SCE), which had until May 1, 2008, to register with and begin using WREGIS.
16 By reporting year 2011, retail sellers are expected to be fully transitioned to WREGIS, and POUs will begin transitioning to WREGIS during their first compliance period covering reporting years 2011‐2013.
17 RPS Eligibility Guidebook, Third Edition, see http://www.energy.ca.gov/2007publications/CEC‐300‐2007‐006/CEC‐300‐2007‐006‐ED3‐CMF.PDF.

10
The RPS Eligibility Guidebook, Third Edition, states that, effective January 1, 2008, the Energy Commission requires RPS‐certified facilities, retail sellers, procurement entities and third parties to participate in WREGIS as part of RPS compliance. It also states that qualified reporting entities (QREs)18 must register with WREGIS before they can report generation data on the facilities’ behalf. However, the RPS Eligibility Guidebook, Fourth Edition19 noted that “unforeseen issues faced by many of these companies delayed their registration with WREGIS until the fall of 2008 or later. To accommodate these delays, beginning with the 2008 compliance year and through the 2010 compliance year, the Energy Commission is allowing limited use of the ITS to report RPS procurement claims, with the intention of phasing out the ITS by the 2011 compliance year.”
In certain cases, such as with generation of test energy20 before commencement of a facility’s commercial operations, the Energy Commission allowed generation not tracked in WREGIS to be reported to the Energy Commission for 2009 and 2010 using the ITS. However, to report using the ITS, retail sellers had to provide WREGIS documentation confirming that WREGIS could not accommodate the tracking or reporting of specific monthly generation.21 This documentation was used to validate the need for a retail seller to report claims using the ITS.
Staff scrutinized the ITS claims to protect against RECs being double‐counting. In some cases, staff analyzed RECs from facilities over three years to ensure that kilowatt hours (kWh) of electricity procured was not inadvertently rounded into MWh in WREGIS and thereby double‐counted over time. Many claims initially reported using the ITS were eventually removed by retail sellers after the detailed multiyear analysis demonstrated generation had been incorporated into later year WREGIS Certificates.
PG&E, SCE, and PacifiCorp reported a relatively small amount of procurement using the ITS for 2009 and 2010. These specific ITS claims are described in Chapter 5: Verification Analysis.
For each MWh of electricity generated and reported to WREGIS, WREGIS creates a unique electronic certificate. Certificates are tagged as “California RPS‐Eligible,” as applicable. WREGIS functions much like a banking system, with WREGIS Certificates initially being deposited into a generator’s “active subaccount.” WREGIS Certificates can be transferred between accounts but can reside in only one account at any given time, thereby protecting against double‐counting of renewable energy generation, so long as the certificates continue to be tracked in WREGIS.
18 A qualified reporting entity (QRE) is an individual or an organization providing renewable generation data to WREGIS on a unit‐specific basis for creating WREGIS Certificates.
19 RPS Eligibility Guidebook, Fourth Edition, p. 64 see http://www.energy.ca.gov/2012publications/CEC‐300‐2012‐003/CEC‐300‐2012‐003‐CMF.pdf.
20 For purposes of the RPS, test energy refers to preproduction electricity generation that occurs during the testing period of a facility before it commences commercial operations.
21 WREGIS informed Energy Commission staff that the validation for some facilities would need to be requested by the account administrator for which these units are registered. Letters were then provided by the account administrators specifying the details of generation availability in WREGIS.

11
If a procurement claim is found to be ineligible during the verification process, a retail seller may “withdraw” it from its total procurement amount claimed for the RPS. Using the ITS, a retail seller was able to submit a revised RPS‐Track form removing the ineligible claim. Using WREGIS, however, a retail seller cannot “unretire” certificates and resubmit a revised report unless it is within 12 months since the certificates were retired. WREGIS corrects for over‐ and underallocation of RECs by adjusting the REC creation amount in future months and sometimes future years. As a result, there may be instances when WREGIS data differ from Energy Commission verified data. As described in Chapter 4: Verification Analysis, there are situations wherein a retail seller withdraws ineligible RECs retired in WREGIS for the year they are ineligible. When WREGIS withholds creation of RECs to make its adjustment in a future year, the retail seller may request that the Energy Commission credit the retail seller with the withdrawn RECs to avoid discounting the retail seller twice.
Renewable generators, load‐serving entities, and third parties from the Western United States, Western Canada, and parts of Northern Mexico may participate in WREGIS. As a regional system, WREGIS is designed to verify that reported generation is counted only once in California and throughout the geographic area covered by the WECC.
A QRE reports generation to WREGIS, and retail sellers provide reports generated via WREGIS to the Energy Commission to meet the reporting requirements previously satisfied with the ITS CEC‐RPS‐Track forms. In most cases, the WREGIS reports will replace the need for cross‐references with other databases to ensure that the RPS‐eligible energy is counted only once.22 WREGIS includes functionality to facilitate matching e‐Tag23 data with retired RECs generated by out‐of‐state RPS‐eligible facilities, enabling Energy Commission staff to better verify that the necessary delivery requirements were met. However, there are instances when generation from out‐of‐state RPS‐eligible generation facilities may not be matched using WREGIS, and, until functionality exists in WREGIS to address this issue, reporting using the ITS is allowed in certain cases.24
22 Not all states with RPS programs in the WECC use WREGIS to track and report RPS claims.
23 An e‐Tag is an electronic record that contains the details of a transaction to transfer electricity from a seller to a buyer where the electricity is scheduled for transmission across one or more balancing authority area boundaries. The North American Electric Reliability Corporation (NERC) is the entity responsible for implementating the first energy tagging process.
24 While energy delivery is no longer required to qualify as an eligible renewable energy resource for the RPS under SB X1‐2, e‐Tag data are necessary, in some cases, to verify RPS compliance. RPS Eligibility Guidebook, Seventh Edition http://www.energy.ca.gov/2013publications/CEC‐300‐2013‐005/CEC‐300‐2013‐005‐ED7‐SF.pdf p. 108
12
To track and verify retail sellers’ 2008‐2010 RPS procurement claims, Energy Commission staff applied the approach used since 1998 for the Power Source Disclosure Program.25 The verification steps used for RPS claims covered in this report are described below.
Renewables Portfolio Standard Certification and Eligibility Date The first step in the Energy Commission staff’s verification process is to determine that all generating facilities from which procurement is claimed are RPS‐certified by the Energy Commission. In general, for the period covered in this report, a facility is RPS‐eligible if, as defined in the RPS Eligibility Guidebook, it uses an eligible renewable resource or fuel, satisfies resource‐specific criteria, and is either located within the state or satisfies applicable requirements for out‐of‐state and out‐of‐country facilities. Only RECs from RPS‐certified generation facilities are eligible, upon verification, to meet a retail seller’s RPS compliance obligation
Staff also identified procurement claims made before the “eligibility date” as ineligible. Generation from an RPS‐certified facility is not eligible before the “eligibility date” of the facility.26 For claims made using WREGIS that had been retired for more than 12 months, retail sellers were unable to unretire the ineligible claims. However, in those cases retail sellers submitted letters requesting that Energy Commission staff “withdraw” the ineligible claims, rather than have the claims reported as ineligible.
Sources of Renewables Portfolio Standard Claims Data For the first time since reporting for the RPS program began, retail sellers reported using WREGIS Reports. Retail sellers used the CEC‐RPS‐Track forms when data were not available in WREGIS. For 2008, retail sellers primarily reported using the CEC‐RPS‐Track forms during the first part of the year but reported most data using WREGIS reports by the end of 2008. They reported the majority of 2009 and 2010 data using WREGIS Reports.
In their CEC‐RPS‐Track filings, retail sellers reported how much electricity procurement they claimed in the various calendar years, delineated by RPS‐certified facility and by month, as well as their total annual retail sales.27 In their WREGIS Report filings, retail sellers reported how
25 The Power Source Disclosure Program is implemented under Public Utilities Code Section 398.1, et seq., as enacted by Senate Bill 1305 (Sher, Chapter 796, Statutes of 1997), and the Energy Commission’s regulations as set forth in Title 20 of the California Code of Regulations, Sections 1390‐1394. This law requires retail suppliers of electricity to disclose to consumers ʺaccurate, reliable and simple to understand information on the sources of energy that are (being) used...ʺ (Public Utilities Code Section 398.1[B]).
26 The eligibility date, or beginning‐on date, is the date upon which the Energy Commission deems the first application for a facility received. Generation is typically eligible back to the month containing this beginning‐on date. Section IV B 3: Eligibility Date in the RPS Guidebook, Seventh Edition, provides additional information.
27 The CEC‐RPS‐Track forms were submitted to the Energy Commission by authorized representatives of the retail sellers who could attest to the specific purchases and other procurement claim information

13
many RECs they retired by month and year, the vintage month and year of the RECs, various ID numbers for each RPS‐certified facility, and the facility name and fuel type. The reports also included the REC certificate serial numbers, and other REC identifying information, including e‐Tag identification numbers of the e‐Tags matched to each REC claim, as applicable.
Sources of Generation Data To verify retail sellers’ procurement data, Energy Commission staff collected generation data from various sources, including the Unites States Energy Information Administration’s (U.S. EIA) website. The U.S. EIA website provides annual generation information for generation facilities with a capacity greater than 1 megawatt (MW).28 Staff also used self‐reported generation data submitted from owners of generating facilities larger than 1 MW located in California, as reported to the Energy Commission’s Electricity Analysis Office.
The data collected include the generating facility’s nameplate capacity, fuel type, generation, and fuel usage. Owners of generating facilities with a nameplate capacity of 1 to 10 MW must report annually, while owners of facilities larger than 10 MW must report quarterly. Additionally, staff reviewed data collected from generating facilities that were registered and eligible for funding from the Energy Commission’s Existing or New Renewable Facilities Programs.
In most cases, staff compiled facility generation data from more than one source. If the various data sources showed different generation amounts per facility, staff compared the procurement to the data source showing the highest generation from that facility, since lower generation figures may capture only specific periods of generation from that facility, rather than the entire year.
Additional generation data came from the RPS‐certified facilities. These facilities must submit data annually to the Energy Commission on the facilities’ monthly generation, including any generation sold to an entity that does not qualify as a retail seller under Public Utilities Code section 399.12, subdivision (j), such as POUs. These data were reported to the Energy Commission by June 1 (or the next business day) of each year using the CEC‐RPS‐GEN form, unless the facility is owned by a retail seller or RPS certified by a retail seller on the facility’s behalf.
As stated in the RPS Eligibility Guidebook, Third Edition, the retail seller is responsible for reporting the generation data for the facilities it certifies for the RPS. Therefore, if the facility is certified by a retail seller, the Energy Commission staff accepted the claim amount as reported
presented in the CEC‐RPS‐Track forms. A specific purchase is a purchase of electricity traceable to a specific generation source.
28 Annual generation data from the U.S. EIA can be downloaded from www.eia.doe.gov/cneaf/electricity/page/eia906_920.html.

14
on the CEC‐RPS‐Track form and did not require additional generation data, unless deemed necessary for verification.29
Overclaim Analysis After compiling the RPS claims and the generation data, staff compared the annual amount of RECs claimed by retail sellers from each RPS‐certified facility and the total annual amount of electricity generated by that facility to ensure that the annual amount claimed did not exceed the annual amount generated. If two or more retail sellers claimed procurement from the same facility, staff compared the cumulative amount of RECs claimed from that facility with the total amount of electricity generated by that facility.
If staff found that REC claims exceeded generation by more than 5 percent for a given year, it requested information from the retail seller to support the RPS claim. For example, if data showed that a facility generated 100 MWh and the retail seller reported it procured 108 MWh, staff requested supporting documentation to confirm the RPS claim. The method allows for a 5 percent difference between generation and procurement figures to account for possible reporting differences. These differences may occur for various reasons, such as rounding errors when comparing data sources that use differing energy units, for example, gigawatt‐hours (GWh) versus kWh. Staff used supporting documentation, such as an invoice for procured generation from the facility, as a data source if RPS claims by the retail seller exceeded generation data by more than 5 percent. Without sufficient supporting documentation, the claim was deemed ineligible. During the verification process for this report, staff identified about 38 overclaim issues that were eventually resolved with supporting documentation, such as invoices or meter data.
Renewable Energy Credit Claims Relative to the Vintage of the Credits The overclaim analysis was more complicated for 2008‐2010 than in previous years because a retail seller retired RECs with 2008 and 2009 vintage years for use within the 2010 reporting year.30 In previous years, retail sellers were not allowed to allocate RECs from one vintage year to a later reporting year. However, the CPUC’s RPS decisions and SB X‐1 2 allow retail sellers to retire RECs in years after their vintage year. Therefore, the sum of the 2010 RPS claims was
29 The RPS Eligibility Guidebook, Fourth Edition, states that the Energy Commission no longer accepts an application for certification on the operator’s behalf using a CEC‐RPS‐2 form from retail seller or POUs. The Energy Commission developed the RPS‐2 Form in 2004 to ease the initial application process for the RPS and to accommodate the retail sellers applying for a significant number of facilities on the facilities’ behalf. The Energy Commission will no longer accept the RPS‐2 Form for this purpose or any other purpose.
30 Reporting year refers to a particular year within a compliance period for which the annual generation has already occurred and for which the RECs are being retired and used for RPS compliance. The reporting year is not the year in which the retired RECs are reported; it is the year for which the retired RECs are reported and, on an annual basis, should typically represent the calendar year preceding the reporting due date. Retail sellers reported 2008; 2009; and 2010 RPS claims to the Energy Commission in February 2011, May 2011, and June 2011, respectively.
15
larger than the 2010 generation amount. Staff reconciled these issues by allocating the 2008 and 2009 vintage amounts to the respective 2008 and 2009 reporting years instead of the 2010 reporting year. This approach resolved the overclaim issues for 2010, and staff was able to verify the full amount of 2008 and 2009 vintage RECs with the 2008 and 2009 generation amounts.
Multifuel Analysis Generation from RPS‐certified multifuel facilities using a mix of fuels or energy resources, including fossil fuels, other nonrenewable energy resources, or multiple RPS‐eligible renewable energy resources to generate electricity, may count for the RPS. If certain conditions are met, 100 percent of the electricity generated from a multifuel facility may be counted as RPS‐eligible.31 Staff determined the amount of eligible electricity that may be attributed to each multifuel facility by comparing the renewable and fossil fuel usage amounts with the amount of allowable fossil fuel usage per RPS‐eligible facility. Chapter 3: Verification Issues describes the multifuel analysis and some of the multifuel verification issues that were identified and ultimately resolved.
Biomethane Analysis For the first time, this report covers claims from RPS‐certified generating facilities using biomethane32 for 2008‐2010. Before 2008, there were no RPS claims from facilities using biomethane. Biomethane verification was discussed at the September 21, 2012, RPS Verification Staff Workshop.33 A detailed description of the biomethane analysis is provided in Chapter 3: Verification Issues. Ultimately, Energy Commission staff was able to verify nearly all of the biomethane claims as eligible and in the one situation where a relatively small amount of generation was determined to be ineligible, the retail seller withdrew the claim associated with the ineligible amount.
Delivery Requirements For Out-of-State Facilities For claims through 2010 from RPS‐certified out‐of‐state facilities, staff verified that procurement satisfied RPS delivery requirements. To meet the delivery requirements, retail sellers were required to submit e‐Tag data to demonstrate that a sufficient amount of electricity was delivered into California within the calendar year to coincide with electricity procured from RPS‐certified out‐of‐state facilities. Staff analyzed the delivery information provided, using both
31 See the RPS Eligibility Guidebook, Third Edition, Section II, B, 6 ‐ Renewable Facilities Using Multiple Fuels (p. 19). For more information see: http://www.energy.ca.gov/2007publications/CEC‐300‐2007‐006/CEC‐300‐2007‐006‐ED3‐CMF.PDF.
32 For purposes of this report “biomethane” or “pipeline biomethane” refers to biogas that has been upgraded or otherwise conditioned to meet the gas quality standard applicable to the natural gas transportation pipeline system and is delivered to the generating facility using the natural gas transportation pipeline system in accordance with the RPS Eligibility Guidebook.
33 Staff Workshop on 2008‐2010 RPS Procurement Verification and SB X 1‐2 RPS Procurement Verification http://www.energy.ca.gov/portfolio/documents/index.html#09212012.

16
the CEC‐RPS‐Delivery and the WREGIS NERC e‐Tag Summary Report34 forms, to ensure that the source or “point of receipt” was located outside California and within the WECC; the final sink/load center or “point of delivery” was located in California; the CA RPS ID number of the RPS‐certified facility or facilities with which the delivered electricity was matched was included in the miscellaneous field of the e‐Tag; and the amount of electricity delivered was sufficient to cover the RPS claim amount.
After reviewing the delivery forms, staff requested retail sellers to provide randomly selected e‐Tags as a way to audit the delivery information provided. Through this process, staff identified 13 energy delivery issues where the RPS ID number was not properly indicated on the e‐Tag. These procurement claims were identified as pending at the September 21, 2012, Workshop35 and are listed as pending in this report. Staff recommends that the Energy Commission accept these pending claims as eligible. A description of the verification method used to make this recommendation is described in Chapter 3: Verification Issues.
Verification That Renewable Energy Credits Are Counted Only Once The Energy Commission also verified, to the extent possible, that RPS‐eligible generation was counted only once in California or any other state, using mostly data submitted for the Power Source Disclosure Program (PSDP). If a retail seller claims specific purchases — purchases traceable to specific generation sources — on its Power Content Label, the retail seller is then required to submit an annual report to the Energy Commission listing generating facilities from which it procured specific purchases for the previous year.36 Using data reported to the Energy Commission for the PSDP, retail seller procurement claims were cross‐referenced with retail sales made by other load‐serving entities in California, including POUs.37
34 Although e‐Tags are commonly referenced as ʺNERC e‐Tags,ʺ the North American Electric Reliability Council (NERC) has transferred the e‐Tag system to the North American Energy Standards Board (NAESB). NAESBʹs e‐Tag information may be found at http://www.naesb.org/weq/weq_jiswg_etag_1.8.asp. This Verification Report will refer to the electronic tagging information as e‐Tags; however, it will refer to the “WREGIS NERC e‐Tag Summary Report” as such because this remains the current name of the WREGIS report. WREGIS intends to update the name “WREGIS NERC e‐Tag Summary Report” to remove “NERC” but as of the writing of this report, the update in WREGIS has not occurred.
35 Staff Workshop on 2008‐2010 RPS Procurement Verification and SB X 1‐2 RPS Procurement Verification, http://www.energy.ca.gov/portfolio/documents/index.html#09212012.
36 The “Power Content Label” is the format specified by the Energy Commission for the Power Source Disclosure Program to allow retail electric providers to disclose their fuel source information about electricity product(s) offered for sale to their customers. As specified in Title 20 of the California Code of Regulations, Sections 1390‐1394, specific purchases for the Power Source Disclosure Program refer to wholesale power purchases that the retailer can trace to specific generators and thereby claim that the electricity offered for sale to retail customers is of a particular fuel or resource type.
37 In 2008 there were 34 entities that report to the Energy Commission under the Power Source Disclosure Program; in 2009 there were 40 and in 2010 there were 39. Entities that reported from 2008‐

17
Initial analyses of the 2008‐2010 PSDP data included a review of the PSDP annual reports. There were 34 reporting entities to the PSDP in 2008, 40 in 2009, and 39 in 2010. Data from the PSDP annual reports included procurement from 731 facilities, including 396 facilities that were certified as RPS‐eligible or were “registered” with the Energy Commission as a renewable supplier.38
Staff incorporated the PSDP claims of specific purchases into the RPS claims analyses to check for double‐counting. In all cases where there were overclaims using PSDP data, Energy Commission staff required reporting entities to provide supporting documentation. In doing so, staff discovered that incorrect RPS IDs numbers submitted by the reporting entities resulted in apparent overclaims. The reporting entities corrected their filings, and the overclaim issues were resolved.
Coordinating With Other States to Ensure Against Double-Counting As mentioned above, this 2008‐2010 Verification Report includes information from MJUs. The MJUs in this report include PacifiCorp and Sierra Pacific Power. Energy Commission staff verified, to the extent possible, that the renewable generation claimed by PacifiCorp and Sierra Pacific Power for California RPS compliance was not also claimed by the retail sellers for compliance in other states.
In years past, and using funding provided by a U.S. Department of Energy grant, the Energy Commission collaborated with Oregon and Washington state energy agencies to develop an energy information tracking system. This tracking system supported the administration of the PSDP by enabling the participating states to determine if generation was claimed in more than
2010 include 3 Phases Energy Services, Alameda Municipal Power, Anaheim Public Utilities, Anza Electric Cooperative, Inc., Azusa Light and Water, city of Banning, Bear Valley Electric Service, Biggs Municipal Utilities, Burbank Water and Power, Calpine Power America, city of Cerritos, Colton Public Utilities, Constellation New Energy Inc., city of Corona, Eastside Power Authority, Glendale Water and Power, Gridley Electric Utility, city of Healdsburg, Imperial Irrigation District, Lodi Electric, city of Lompoc, Los Angeles Department of Water and Power, Merced Irrigation District, Modesto Irrigation District, Moreno Valley Electric Utility, PacifiCorp, City of Palo Alto, Pasadena Water and Power, Pacific Gas and Electric Company, City of Pittsburg, (Island Energy), Plumas‐Sierra Rural Electric Cooperative, Port of Oakland, Port of Stockton, Power and Water Resources Pooling Authority, Rancho Cucamonga Municipal Utility, Redding Electric Utility, city of Riverside, Roseville Electric, San Diego Gas & Electric Company, Sempra, Noble Energy Solutions, Shell Energy, Silicon Valley Power, Sacramento Municipal Utility District, Southern California Edison Company, Truckee‐Donner Public Utilities District, Turlock Irrigation District, city of Ukiah, city of Vernon, and city of Victorville.
38 Through 2006, a facility that did not meet the RPS eligibility requirements, or the requirements for funding under the Energy Commission’s New Renewable Facilities Program, could apply to the Energy Commission for “registration” as a renewable supplier if the facility generated then applicable electricity from one or more of the renewable resources consistent with definitions in the Energy Commission’s Overall Program Guidebook (December 2006, Pub, No. CEC‐300‐2006‐008‐ED2). Facilities were also required to report the type and percentage of fossil fuel used, if applicable. Effective March 2007, the Energy Commission no longer registers facilities as renewable suppliers.

18
one of the participating states. While Energy Commission staff was able to obtain data for years up through 2007 using this tracking system, the state of Washington is unable to continue operation of the system. Therefore, this report does not contain an analysis of Washington state’s Power Source Disclosure claims.
Energy Commission staff collaborated with the staff from the Oregon Department of Energy (ODOE) regarding the California and Oregon RPS programs. Oregon’s RPS program allows unlimited banking for its RPS, which may result in 2007‐2010 vintage RECs39 being retired for ODOE’s RPS compliance well into the future. Staff from both agencies will continue to collaborate to help ensure California RPS claims made by retail sellers and/or POUs using the ITS are not later claimed for Oregon’s RPS using WREGIS.
Additionally, Energy Commission staff is coordinating with ODOE staff to determine if any stranded generation40 is claimed for California’s RPS. To assist in this analysis, Energy Commission staff compiled all California RPS claims per generating facility and compared the claims with Oregon stranded generation. No issues were identified as of the writing of this report, but staff from both agencies will continue to collaborate and monitor Oregon stranded generation to ensure it is not claimed for California’s RPS.
Staff collaborated with the Public Utilities Commission of Nevada (PUCN) to confirm that procurement from facilities claimed for both Nevada and California RPS purposes was not double‐counted. Staff at the PUCN provided Energy Commission staff with a list of the procurement amounts from 18 facilities in 2008, 7 facilities in 2009, and 7 facilities in 2010 that were claimed in each state’s RPS program. Energy Commission staff used these data to verify that the total procurement did not exceed generation when the Nevada procurement amounts were combined with the California procurement amounts from these facilities. The procurement amounts that were allocated to Nevada are listed in Sierra Pacific Power Company’s 2008 – 2010 RPS‐Appendix tables in Appendix A.
39 WREGIS tracks the vintage of RECs by the month and year of generation. When referring to the vintage of a REC, the Energy Commission understands this to mean the month and year that the REC was generated.
40 Information on the ODOE website states: WREGIS is the only system available currently to create and guarantee unique RECs for the Oregon RPS. However, WREGIS was not always available for Oregon‐eligible renewable energy generation. There is a gap between the first generation eligibility date under ORS (January 1, 2007) and WREGIS system availability (fall 2007). The generation that occurred during this gap is termed “stranded electricity” or “stranded generation.” Rather than establish an alternate or interim tracking system (see OAR 330‐160‐0030[4]), the ODOE arranged for WREGIS to create RECs retroactively for stranded electricity. Uploaded electricity includes the early 2007 period of generation as well as early test generation and generation from hydropower efficiency upgrades. Under this arrangement, all RECs created through this process must be exclusively used for Oregon RPS compliance.
http://www.oregon.gov/energy/RENEW/Pages/RPS_Stranded_Electricity.aspx.
19
Coordinating With the Voluntary Renewable Energy Credit Market to Ensure Against Double-Counting In addition to working with other states to protect against double counting, Energy Commission staff coordinated with Green‐e41 Energy to verify that California RPS procurement claims for 2008‐2010 were not being counted on the voluntary REC market.
Analysis With Green-e Data for Renewables Portfolio Standard Facilities Located in California Below is the process used to compare RPS claims from facilities located in California against Green‐e voluntary REC claims. As requested by Energy Commission staff, Green‐e staff provided a list of all in‐state generating facilities that participate in the Green‐e program along with the facilities’ Green‐e certified generation amounts. The list includes about 250 facilities, and identifies various facility related information, including: facility location, fuel type, nameplate capacity, and EIA ID or Qualifying Facility (QF) ID number, if available.
Energy Commission staff used the list of Green‐e certified facilities to determine which facilities are also RPS‐certified. It is often difficult to determine if a Green‐e‐certified facility and an RPS‐certified facility are the same facility, because many facilities have similar names, fuel types, and locations.
Once staff confirmed which facilities are both Green‐e and RPS‐certified, staff determined which of those facilities had RPS procurement claims in 2008, 2009, and/or 2010. Staff then made a table for each facility. The tables combined all the RPS procurement claims, PSDP procurement, and the Green‐e‐certified amounts to determine a total procurement claim amount for each facility. This total claim amount was then compared with each facility’s generation amount, which was acquired from other reporting sources such as the Energy Commission’s Electricity Analysis Office, U.S. EIA, or the Energy Commission’s RPS program via the CEC‐RPS‐GEN form and/or CEC‐RPS‐Multifuel forms. The percentage difference between the generation amount and the total procurement claim amount was calculated for each facility. If the result showed that the total procurement was over the generation amount by 5 percent or more, it was considered an overclaim.
Because Green‐e’s transaction data is confidential, Energy Commission staff created a table listing all the overclaims and sent it to Green‐e for review of the final Green‐e‐certified purchaser amounts. Green‐e was able to determine which purchasing entities acquired the Green‐e‐certified generation. In 2008, there were four overclaims associated with Green‐e‐certified facilities, and for each of the overclaims, the same retail seller who had made the RPS or PSDP claims also purchased the Green‐e‐certified generation. For these claims, the Green‐e‐certified claim was no longer included in the total procurement calculation, and the overclaims were resolved. The same is the case with the 2009 and 2010 analyses; in 2009 there were four
41 Green‐e Energy, a program of the Center for Resource Solutions, is an independent consumer protection program for the sale of renewable energy in the voluntary retail market, see www.green‐e.org. Green‐e Energy does not require the use of WREGIS.
20
overclaims, each of which was resolved after receiving feedback from Green‐e about the final Green‐e purchaser, and in 2010 there were also four overclaims that were resolved in the same manner.
Analysis With Green-e Data for RPS Facilities Located Outside California In 2009 and 2010, many more RPS procurement claims from out‐of‐state facilities were made by retail sellers than in previous years, so staff requested that Green‐e provide data for out‐of‐state facilities as well. Staff sent Green‐e a list with all of the out‐of‐state RPS facilities for which there were 2008‐2010 procurement claims, a list totaling 92 facilities, and asked Green‐e to provide Energy Commission staff Green‐e data for the facilities on the list that also participated in the Green‐e program, as was done for the in‐state facilities. Green‐e provided Energy Commission staff a list of 72 facilities and the requested facility information, which staff used to perform the same analysis, as explained in detail above, to determine if there were any overclaims. Staff identified four facilities in 2009 and two facilities in 2010 that had overclaims. There were no overclaim issues identified for the 2008 data. A table with these overclaims was sent back to Green‐e to confirm if the retail seller making the RPS or PSDP procurement claim was also the final purchaser of the Green‐e‐certified generation. Green‐e had concerns with the total procurement amounts from two of the facilities, so Energy Commission staff contacted the facility representatives to obtain data on the end use of the generation. Staff reviewed the end‐use data from each facility and determined that it matched the RPS procurement claims, resolving the overclaim concerns. Staff also shared the facility’s generation end‐use data with Green‐e, and Green‐e staff members confirmed that the data resolved the issues for them as well.
Finalizing Verified Data Staff incorporated comments from the September 21, 2012, workshop into this staff draft 2008‐2010 Verification Report. In addition, comments received on this draft report will be incorporated into the final version of the report adopted by the Energy Commission.
Addressing the transition from the 20 percent RPS by 2010 program to the 33 percent RPS by 2020, the CPUC issued Decision 12‐06‐038, directing retail sellers to file final RPS Compliance Reports for years prior to 2011 following the “closing report” process.42 Within 30 days of the Energy Commission’s adoption and posting of the Final 2008‐2010 RPS Verification Report, retail sellers must file verified RPS compliance reports with the CPUC using Energy Commission‐verified RPS procurement data.43 Retail seller’s RPS compliance reports are served on the service list for the RPS proceeding and made publicly available on the CPUC’s website.44
42 CPUC Decision (D.) 12‐06‐038 http://docs.cpuc.ca.gov/WORD_PDF/FINAL_DECISION/169704.pdf.
43 CPUC, D. 12‐06‐038, June, 21, 2012. Decision Setting Compliance Rules for the Renewables Portfolio Standard ProgramOrdering Paragraph 1. http://docs.cpuc.ca.gov/WORD_PDF/FINAL_DECISION/169704.pdf
44 http://www.cpuc.ca.gov/PUC/energy/Renewables/compliance.htm

21
All WREGIS Certificates must be retired in WREGIS and reported to the Energy Commission before a final closing report may be filed with the CPUC.45
45 CPUC, June, 21, 2012. Decision (D.) 12‐06‐038 Setting Compliance Rules for the Renewables Portfolio Standard Program. Ordering Paragraph 2. http://docs.cpuc.ca.gov/WORD_PDF/FINAL_DECISION/169704.pdf

22
CHAPTER 4: Verification Issues The Energy Commission’s September 21, 2012, RPS Procurement Verification Data Review Workshop presented initial verification results and discussed RPS reporting requirements for years 2011 and thereafter.46 Staff sought public input on three issues related to the verification results:
1. verification of procurement date relative to the vintage of the renewable energy credits for 2008‐2010;
2. verification of biomethane related claims for 2008‐2010; and
3. verification of energy delivery for out‐of state facilities for 2008‐2010.
This section addresses these issues and describes in detail the verification process for multifuel facilities. While there are no outstanding issues associated with multifuel facilities, Energy Commission staff describes the multifuel verification process to highlight some of the issues initially identified and ultimately resolved.
Staff considered public comments during and after the workshop, which are reflected in staff’s recommendation on the pending claims described later in this section.
Verification of Procurement Date Relative to the Vintage of the Renewable Energy Credits During the Energy Commission’s RPS procurement verification process, staff occasionally reviews certain information from retail sellers’ RPS contracts needed for verification of claims. During the 2008‐2010 RPS procurement verification assessment, staff identified instances where retail sellers were claiming generation relative to contracts executed after 2010. For example, in one case a retail seller claimed RECs for the 2009 compliance year that had a 2009 vintage, but the claims were associated with a contract signed in 2011.
For reporting 2008‐2010 procurement data, the RPS Eligibility Guidebook, Fourth Edition,47 states: “The CEC‐RPS‐TRACK forms and/or WREGIS Compliance Reports are due to the Energy Commission on June 1 (or the next business day) of each year for reporting data for the previous calendar year. For the 2008 compliance year, these reports are due February 1, 2011, and for the 2009 compliance year, the reports are due May 1, 2011.”
46 This report does not address RPS reporting and verification under SB X1‐2. For more information about the RPS program for 2011 and thereafter, see the RPS Eligibility Guidebook, Seventh Edition.
47 RPS Eligibility Guidebook, Fourth Edition, http://www.energy.ca.gov/2012publications/CEC‐300‐2012‐003/CEC‐300‐2012‐003‐CMF.pdf (p.67).

23
The RPS Eligibility Guidebook, Fifth Edition48 addressed the CPUC’s decision49 establishing initial rules for how retail sellers may use Tradable Renewable Energy Credits (TRECs) for RPS compliance, requirements for tracking TRECs in WREGIS, and that the generating facilities must be certified by the Energy Commission as RPS‐eligible. The CPUC decision states that TRECs associated with RPS‐eligible electricity generated on or after January 1, 2008, can be procured, traded, and used for RPS compliance. The RPS Eligibility Guidebook notes that TRECs cannot be used for RPS before the 2010 compliance year and directs retail sellers to submit supplemental WREGIS reports for 2010 procurement, as appropriate, to report TRECs from RPS‐certified facilities tracked in WREGIS for 2010.
In the example above, the 2009 RECs were procured after the electricity was generated and, therefore, are considered unbundled RECs, or RECs without the associated electricity – commonly referred to as TRECs. In addition to not being claimed before 2010, per the CPUC decision, the contract date is the deciding factor as to the earliest time frame that the RECs may be used for the RPS.
In some cases, staff identified WREGIS certificates with a vintage year different than the reporting year. This situation may occur when there are mistakes in the meter data, resulting in more WREGIS certificates than there is actual generation. When errors are identified, they need to be corrected, and the QRE will need to input the adjustments amount in WREGIS. This adjusted amount should represent the total number of RECs for the period in question. In such situations, adjustment amounts are written to the WREGIS database, and any “increases” or “decreases” will be applied to the next available WREGIS generation period data. For example, 110 WREGIS certificates with a December 2009 vintage were created, but, after accounting for prior period adjustments, it was found that only 100 WREGIS certificates should have been created. The 10 excess December 2009 vintage certificates would need to be included as part of the January 2010 vintage certificates because WREGIS will withhold creation of 10 certificates in January to correct for the excess certificate error.
Another situation related to the verification of procurement data and the vintage of the renewable energy credits occurred when staff identified 2008 and 2009 vintage year certificates for claims reported for 2010. While this reporting strategy does not appear to violate any specific RPS requirements, it complicates the verification analysis. For example, 2008 vintage‐year certificates for 2010 claims caused overclaims when compared to 2010 RPS‐eligible generation that staff resolved by removing the 2008 vintage amount from 2010 analysis and applying it to the year of generation, which was 2008. Only then could staff conduct a complete analysis to determine if there were any overclaims for 2008. In doing this, the overclaims for 2010 were resolved, and staff was able to verify there were no 2008 overclaims.
48 RPS Eligibility Guidebook, Fifth Edition, http://www.energy.ca.gov/2012publications/CEC‐300‐2012‐002/CEC‐300‐2012‐002‐CMF.pdf (p.70).
49 CPUC Decision 11‐01‐025, January 13, 2011. Rulemaking 06‐02‐012, Order E, updating D.10‐03‐021 Section 4.11. http://docs.cpuc.ca.gov/PUBLISHED/FINAL_DECISION/129517.htm.
24
Staff expects to have a more sophisticated verification system in the future, but until then, vintage‐year certificates for claims reported for a different reporting year will continue to complicate verification efforts.
While both CPUC decisions regarding TRECs and Senate Bill X‐1 2 allow for procurement from one year to be applied to a later year (or a compliance period), procurement from contracts executed after 2010 may not be used for compliance in years during the 2008‐2010 reporting period. Therefore, 2009 vintage WREGIS certificates procured under a contract executed in 2011 may not be used for compliance until the first compliance period (2011‐2013), and in no case can procurement made under a 2011 contract be applied to a compliance obligation prior to 2011.
The execution date of a contract represents the first year for which reporting entities can claim procurement, and, therefore, retail sellers should not report RECs for years that precede the contract execution date. If Energy Commission determines that such claims have been made, the verification results will be amended to count RECs claimed before the contract execution date as ineligible or eligible for another year, if appropriate.
For this 2008‐2010 verification report staff determined that in cases where the contract date was 2011 or later, the retail seller was required to remove the claims. In cases where the reason for the mismatch vintage/reporting year was due to WREGIS functionality, staff accepted the claims. In cases where the vintage year and reporting year did not match, if staff was able to verify that there was no double‐counting, staff accepted the claims.
Multifuel Analysis RPS‐certified multifuel facilities using a mix of fuels or energy resources including fossil fuels, other nonrenewable energy resources, or multiple RPS eligible renewable energy resources to generate electricity may be eligible for the RPS. If certain conditions are met, 100 percent of the electricity generated from the multifuel facility may be counted as RPS‐eligible.50 Staff determined the amount of renewable electricity that may be attributed to each multifuel facility by comparing the renewable and nonrenewable fuel usage amounts with the amount of allowable nonrenewable fuel usage per RPS‐eligible facility.
50 A “de minimis” amount of fossil fuel (in most cases it is 2 percent of total annual fuel usage amount) used and measured on an annual total energy input basis may be counted for the RPS. Until December 31, 2011, RPS‐certified facilities participating in the Energy Commission’s Existing Renewable Facilities Program could use up to 5 percent of all fuels used and measured on an annual energy input basis, and 100 percent of the fuel output could be counted for the RPS. In limited circumstances, such as if a facility was certified and operational as a renewable qualifying small power production facility (QF) under the federal Public Utility Regulatory Policies Act before January 1, 2002, and is currently certified as a renewable QF, the fossil fuel usage may not exceed 25 percent of the total energy input of the facility during a given calendar year. See the RPS Eligibility Guidebook, Third Edition, Section II, B, 6 ‐ Renewable Facilities Using Multiple Fuels (p. 19) for more information. See also http://www.energy.ca.gov/2007publications/CEC‐300‐2007‐006/CEC‐300‐2007‐006‐ED3‐CMF.PDF.
25
Initially, there were 12 multifuel issues identified, where the nonrenewable fuel usage amount exceeded the allowable limit to count 100 percent of the generation as RPS eligible. When staff identifies claims as exceeding the allowable fossil fuel usage, staff notifies the facility owners and provides a multifuel data analysis. Because owners of the multifuel facilities at issue were able to provide additional supporting documentation to demonstrate that the nonrenewable fuel usage amount did not exceed the limit, staff accepted the claims.
In one instance, the multifuel analysis of a group of facilities owned by the same entity indicated that the fuel use of four of the facilities claimed in 2009 and three of the facilities claimed in 2010 exceeded the 25 percent limit.51 However, after working with the facilities’ fuel reporting staff, it was discovered that the Federal Energy Regulatory Commission (FERC) granted this group of facilities a special calculation method for its fossil fuel usage because of the facilities’ unique circumstances, something of which Energy Commission staff was unaware. After staff reviewed supplemental documentation submitted in support of the FERC calculation method and updated its fuel use data analysis, staff determined that the nonrenewable fuel amount for each facility in the group was within the 25 percent allowance and did not exceed the multifuel limit.
In another case, the multifuel analysis showed that, in 2008, a facility used 23.85 percent nonrenewable fuel, which greatly exceeded the facility’s multifuel limit of 5 percent.52 The issue was complicated by the fact that three retail sellers were making procurement claims from the same facility in that year. This issue was resolved after staff collected supplemental documentation, including payment statements for the natural gas used by the facility, to determine the fuel use amounts. After reviewing the documentation and fuel use data collected by other agencies, staff determined that the fuel use data used in the initial calculation had been misreported. Recalculating the facility’s percentage of nonrenewable fuel use with the fuel amounts from the supplemental documentation showed a nonrenewable fuel use of 0.33 percent, well under the facility’s nonrenewable fuel use limit.
In a third example claimed in 2010, the percentage of nonrenewable fuel use of a facility with multifuel limit of 25 percent was calculated as 97.64 percent. After contacting the facility about the fuel use issue, the facility reviewed the data used to calculate the nonrenewable fuel percentage and informed staff that the amount of nonrenewable fuel used was correct, but that the renewable fuel usage amount had been misreported. When the percentage of nonrenewable fuel use was recalculated using the correct renewable fuel use amount, it showed that the facility’s nonrenewable fuel use in 2010 was 7.43 percent, well under the facility’s multifuel limit of 25 percent.
51 These QF facilities met the requirements allowing up to 25 percent fossil fuel usage to count 100 percent of the facility output as renewable.
52 This facility participated in the Energy Commission’s Existing Renewable Facilities Program and, therefore, had a nonrenewable fuel use amount of 5 percent.

26
Of the initial 12 multifuel issues identified during this analysis, all were ultimately shown not to have exceeded the fossil fuel usage limits once staff reviewed additional supporting documentation with accurate fuel usage amounts used to recalculate the facility’s percentage of nonrenewable fuel use. However, there was one outstanding issue with a facility that is RPS‐certified as “renewable‐only,” which means that the facility can count only the generation attributable to the use of renewable fuel as RPS‐eligible. Generation from this facility was claimed by PG&E in 2010. When staff requested that PG&E submit fuel‐usage data for the facility, PG&E provided the data but also informed staff that PG&E had inadvertently retired and reported more WREGIS certificates from this facility than were eligible based on the amount of renewable fuel used by the facility. PG&E requested that the ineligible certificates be counted as withdrawn in the Verification Report, which is identified in Chapter 4: Verification Findings: in Table 5, PG&E’s Summary of RPS Procurement.
Verification Requirements for Biomethane Claims The RPS Eligibility Guidebook, Third Edition, establishes the following requirements for the use of biomethane delivered through the natural gas pipeline system:
1. The gas must be produced from an RPS‐eligible resource, such as biomass or digester gas.
2. The gas must be injected into a natural gas pipeline system that is either within the WECC region or interconnected to a natural gas pipeline system in the WECC region that delivers gas into California.
3. The energy content of the gas produced and supplied to the transportation pipeline system must be measured monthly and reported annually, illustrated by month. Reporting shall be in units of energy (for example, million British Thermal Units [MMBtu]), based on metering of gas volume and adjusted for measured heat content per volume of each gas. In addition, the total amount of gas used at the RPS‐eligible facility must be reported in the same units measured over the same period, and the electricity production must be reported in MWh.
4. The gas must be used at a facility that has been certified as RPS‐eligible. As part of the application for certification, the applicant must attest that the RPS‐eligible gas will be nominated to that facility or nominated to the load‐serving entity‐owned pipeline serving the designated facility.
5. In its annual RPS procurement verification reports, the Energy Commission staff calculates the RPS‐eligible energy produced using the same method discussed above.
In addition to these requirements, the RPS‐certified facility, or the biomethane supplier, must enter into contracts for the delivery or storage of the gas with every pipeline or storage facility operator transporting or storing the gas from the injection point to California (or to the RPS‐certified facility if the RPS‐certified facility is located outside California). This reporting is required to support the analysis preventing natural gas from inadvertently being counted as RPS‐eligible.

27
Requirements for biomethane verification include both physical and contractual verification requirements. The physical verification requirements must come from the biomethane source and from the RPS‐certified facility. The contractual verification requirements include invoices for the injected biomethane and proof of the physical path for biomethane delivery. Staff confirmed that the biomethane used at an RPS‐certified facility met these requirements by requesting, at a minimum, the following information from the RPS‐certified facilities or retail seller:
1. The pipeline delivery path of the biomethane from the gas source to the RPS‐certified facility.
2. Copies of contracts for each pipeline section of the delivery path, as well as the contract for the purchase of the biomethane.
3. Monthly energy content and volume meter data for the gas injected in the pipeline at the source as well as for the gas taken from the pipeline at the generating facility. Invoices cannot be substituted for meter data.
4. Invoices for the purchases of biomethane.
5. In the event that biomethane was stored for later use at the facility, contracts for storage with the pipeline operators and monthly storage statements for this gas.
Figure 1 on the following page shows the required documentation as it relates to the delivery path.
Some of the RPS claims included storage, which required additional documentation to verify. Other claims were made by two retail sellers from the same RPS‐certified facility using two biomethane sources, requiring a comparative analysis to ensure RPS claims were not overclaimed by the two retail sellers.

28
Figure 1: Locations Along Biomethane Delivery Path Where Data Must Be Gathered
Source: Staff analysis based on documentation and comments supplied by load serving entities and other stakeholders.
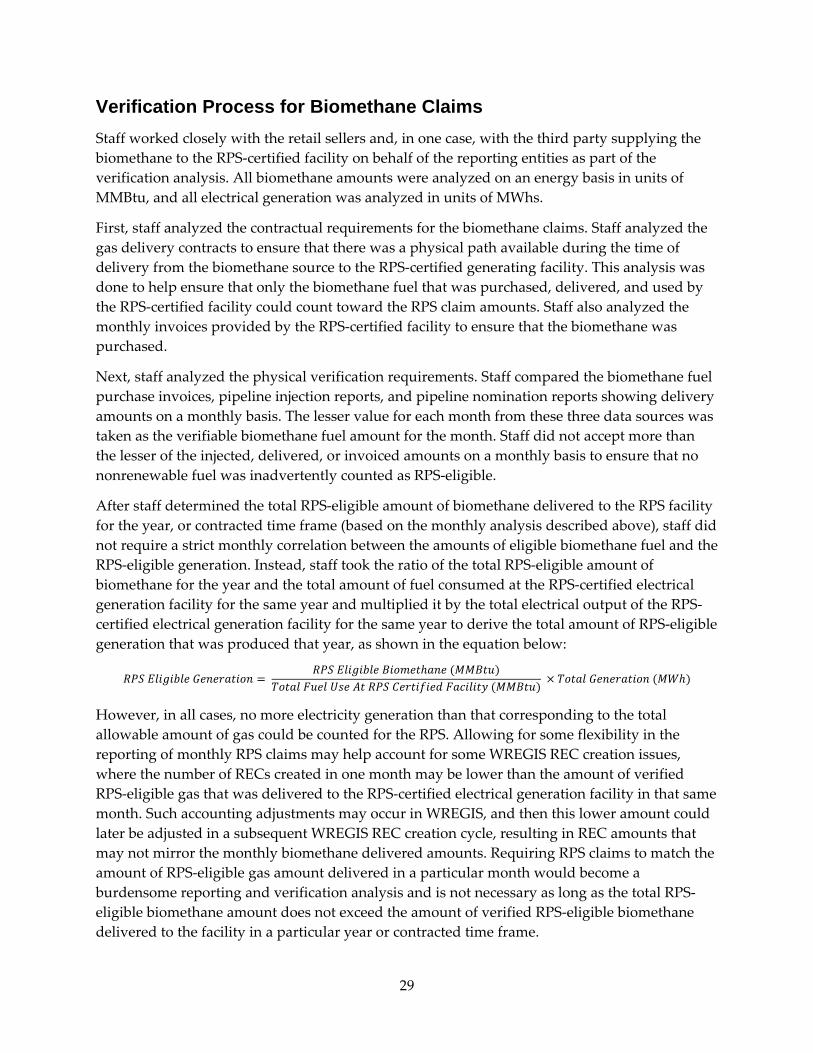
29
Verification Process for Biomethane Claims Staff worked closely with the retail sellers and, in one case, with the third party supplying the biomethane to the RPS‐certified facility on behalf of the reporting entities as part of the verification analysis. All biomethane amounts were analyzed on an energy basis in units of MMBtu, and all electrical generation was analyzed in units of MWhs.
First, staff analyzed the contractual requirements for the biomethane claims. Staff analyzed the gas delivery contracts to ensure that there was a physical path available during the time of delivery from the biomethane source to the RPS‐certified generating facility. This analysis was done to help ensure that only the biomethane fuel that was purchased, delivered, and used by the RPS‐certified facility could count toward the RPS claim amounts. Staff also analyzed the monthly invoices provided by the RPS‐certified facility to ensure that the biomethane was purchased.
Next, staff analyzed the physical verification requirements. Staff compared the biomethane fuel purchase invoices, pipeline injection reports, and pipeline nomination reports showing delivery amounts on a monthly basis. The lesser value for each month from these three data sources was taken as the verifiable biomethane fuel amount for the month. Staff did not accept more than the lesser of the injected, delivered, or invoiced amounts on a monthly basis to ensure that no nonrenewable fuel was inadvertently counted as RPS‐eligible.
After staff determined the total RPS‐eligible amount of biomethane delivered to the RPS facility for the year, or contracted time frame (based on the monthly analysis described above), staff did not require a strict monthly correlation between the amounts of eligible biomethane fuel and the RPS‐eligible generation. Instead, staff took the ratio of the total RPS‐eligible amount of biomethane for the year and the total amount of fuel consumed at the RPS‐certified electrical generation facility for the same year and multiplied it by the total electrical output of the RPS‐certified electrical generation facility for the same year to derive the total amount of RPS‐eligible generation that was produced that year, as shown in the equation below:
However, in all cases, no more electricity generation than that corresponding to the total allowable amount of gas could be counted for the RPS. Allowing for some flexibility in the reporting of monthly RPS claims may help account for some WREGIS REC creation issues, where the number of RECs created in one month may be lower than the amount of verified RPS‐eligible gas that was delivered to the RPS‐certified electrical generation facility in that same month. Such accounting adjustments may occur in WREGIS, and then this lower amount could later be adjusted in a subsequent WREGIS REC creation cycle, resulting in REC amounts that may not mirror the monthly biomethane delivered amounts. Requiring RPS claims to match the amount of RPS‐eligible gas amount delivered in a particular month would become a burdensome reporting and verification analysis and is not necessary as long as the total RPS‐eligible biomethane amount does not exceed the amount of verified RPS‐eligible biomethane delivered to the facility in a particular year or contracted time frame.

30
Verification Analysis of Specific Biomethane Claims Only three retail sellers had biomethane claims from 2008 to 2010: PG&E, Noble Americas Energy Solutions, and Pilot Power Group. Each claim had its unique set of issues that were eventually resolved, as described below.
Noble Americas Energy Solutions and Pilot Power Group Noble and Pilot both made REC claims from the same facility using biomethane fuel in 2010: Calpine Energy Services’ Pastoria Energy facility. This RPS‐certified facility used biomethane that was stored on the natural gas pipeline system. Pastoria was able to provide staff with storage contracts, storage balance receipts, and pipeline nomination reports that showed the biomethane amounts delivered from the biomethane source, being placed into storage, being later removed from storage, and then ultimately delivered to Pastoria. Ultimately, Pastoria produced more than enough eligible generation in 2010 to meet RPS claims for both Noble and Pilot, as seen in Table 1 below:
Table 1: Noble and Pilot 2008-2010 Biomethane Claim Analysis
Year Net Generation (MWh)
RPS‐Eligible Biomethane (MMBtu)
Total Fuel Use (MMBtu)
% Renewable Fuel Use
RPS‐Eligible Generation (MWh)
Original WREGIS Claim (MWh)
2010 708,850 151,989 5,015,589 3.03% 21,481 21,462 Source: Noble and Pilot WREGIS Compliance Reports and supporting documentation.
Pacific Gas and Electric Company PG&E had biomethane claims for 2008, 2009, and 2010 from the Humboldt Bay Power Plant 1, Humboldt Bay Power Plant 2, and Gateway facilities. These facilities share the same two biomethane sources through PG&E’s natural gas pipeline system. Because they shared the same biomethane sources, were connected to the same pipeline, and were claimed only by PG&E, staff determined it was appropriate to analyze them as one large electrical generation facility. This approach eliminated the need for staff to go through the arduous and arbitrary task of allocating portions of gas from the biomethane sources to each facility. The results of the analysis are shown in Table 2 below:
Table 2: PG&E 2008-2010 Biomethane Claim Analysis
Year Net Generation (MWh)
RPS‐Eligible Biomethane (MMBtu)
Total Fuel Use (MMBtu)
RPS‐Eligible Generation (MWh)
Original WREGIS Claim (MWh)
Percent Disallowed
2008 45,891 9,484 589,099 739 753 ‐1.89%
2009 2,501,405 401,560 19,288,292 52,076 52,256 ‐0.34%
2010 1,880,945 249,181 13,256,280 35,357 31,605 0% Source: PG&E CEC-RPS-Track and WREGIS Compliance Reports and supporting biomethane documentation.

31
PG&E was notified of the above overclaims and reduced its RPS claim by the overclaimed amounts.
Verification of Energy Delivery for Out-of-State Facilities Retail sellers claiming procurement from out‐of‐state facilities as RPS‐eligible for 2008 to 2010 must demonstrate that such procurement complies with delivery requirements specified in the RPS Eligibility Guidebook, Third and Fourth Editions.53 An annual matching quantity of electricity must be delivered to a point of delivery in California in a manner consistent with North American Electrical Reliability Corporation (NERC) rules and documented with an e‐Tag.54 Electricity may be delivered into California at a different time than when the RPS‐certified facility generated electricity, under former Public Resources Code section 25741, subdivision (a).55 As explained in the Third Edition RPS Eligibility Guidebook:56
“Further, the electricity delivered into California may be generated at a different location than that of the RPS‐certified facility. In practical terms, out‐of‐state energy may be ’firmed’ or ’shaped’ within the calendar year. Firming and
53 Since the earliest version of the RPS Eligibility Guidebook, there has always been a delivery requirement associated with out‐of‐state facilities. The Third and Fourth RPS Eligibility Guidebook Editions apply to retail sellers for 2008‐2010 data as the Third Edition was adopted December 19, 2007, and the Fourth was adopted on December 15, 2010. However, the Fourth Edition clarifies reporting instructions and includes the CEC‐RPS‐Delivery form that was used to report delivery data not available in WREGIS. Furthermore, e‐Tag data were not available using WREGIS until 2009, so 2008 e‐Tag data were accepted using the CEC‐RPS‐Delivery form. Furthermore, third parties are unable to transfer WREGIS e‐tag data to other parties in WREGIS and until this issue is resolved, retail sellers may be allowed to report delivery information provided by third parties using the ITS. The Fourth Edition clarified reporting instructions when WREGIS e‐Tag data are unavailable, such as in the case of third parties. The Third and Fourth RPS Eligibility Guidebooks are available at http://www.energy.ca.gov/renewables/documents/old_guidebooks.html.
54 The NERC is the entity responsible for the implementation of the first energy tagging process. E‐Tags were formally referred to as “NERC e‐Tags” but are now more widely referred to as “e‐Tags.” An e‐Tag is an electronic record that contains the details of a transaction to transfer electricity from a seller to a buyer where the electricity is scheduled for transmission across one or more balancing authority area boundaries. The North American Energy Standards Board (NAESB) uses an Electric Industry Registry (EIR), known as the OATI webRegistry as the official source of e‐Tag registry data. http://www.naesb.org/weq/weq_eir.asp. The previous EIR was the NERC TSIN Registry, which was expected to cease publishing of registry data on November 13, 2012, with the OATI webRegistry becoming the official source of registry data.
55 Former Public Resources Code section 25741(a), as enacted by SB 107, provided in pertinent part that “… electricity generated by an eligible renewable energy resource may be considered “delivered” regardless of whether the electricity is generated at a different time from consumption by California end‐use retail customers.”
56 Page 23, http://www.energy.ca.gov/2007publications/CEC‐300‐2007‐006/CEC‐300‐2007‐006‐ED3‐CMF.PDF.
32
shaping refers to the process by which resources with variable delivery schedules may be backed up or supplemented with delivery from another source to meet customer load.”
Under the rules in place before implementation of SB X1‐2, various contracting structures could be used to meet the RPS‐delivery requirements, but every arrangement must account for both the RECs and energy delivery into California. The firming and shaping services could be provided by the facility, a third party, or the retail seller, provided both the energy and the RECs were originally procured together and energy delivery occurred within the same calendar year.
There are two processes for submitting e‐Tag data for RPS verification of 2008‐2010 delivery claims. The first process is part of the ITS and is used only when e‐Tags are not available in WREGIS.57 The retail seller must complete a CEC‐RPS‐Delivery form to report the data contained on the e‐Tag, including the Purchasing Selling Entity (PSE) code, Point of Receipt (POR), Point of Delivery (POD), and the monthly and total annual amounts of energy procured. To verify that data reported on the CEC‐RPS‐Delivery form are acceptable, staff requested that retail sellers submit sample e‐Tags associated with the energy delivery for each out‐of‐state claim. During this verification process, the majority of the delivery amounts were sufficient to match the REC claims. In cases where there were more RECs claimed than there was energy delivery, only the amount of RECs with sufficient energy delivery were determined to be eligible.
The second process for verification uses the e‐Tag functionality in WREGIS and includes the retail seller’s submission of a WREGIS NERC e‐Tag Summary Report,58 along with its WREGIS compliance report. This NERC e‐Tag Summary Report pulls data from e‐Tags that are imported into WREGIS, which contain information used to verify delivery.
In 2009, the first year that WREGIS functionality allowed for the use of e‐Tags, NERC e‐Tag Summary Reports were submitted by PG&E, SCE, and SDG&E for a total of 25 procurement claims. In 2010, CNE, Noble Americas, Pilot Power, PG&E, SCE, and SDG&E submitted the reports for a total of 43 out‐of‐state claims. To verify that a sufficient amount of energy delivered to California was matched with the out‐of‐state procurement claims using the NERC
57 WREGIS provides information to verify delivery of energy into California from out‐of‐state facilities. This service, which uses data from e‐Tags to report out‐of‐state delivery information, became available in WREGIS early 2009. However, WREGIS stakeholders identified a technical issue that precludes retail sellers from accessing the e‐Tag in WREGIS if third‐party importers schedule delivery into California. For 2009 and 2010, WREGIS must be used for reporting out‐of‐state facilities’ delivery data; however, Energy Commission staff allowed submission of e‐Tag information using the ITS, CEC‐RPS‐DELIVERY form. See RPS Eligibility Guidebook, Fourth Edition p. 64‐65, http://www.energy.ca.gov/2010publications/CEC‐300‐2010‐007/CEC‐300‐2010‐007‐CMF.PDF.
58 WREGIS intends to update its “NERC e‐Tag Summary Report” to remove NERC but has not done so yet. This verification report will continue to refer to the WREGIS NERC e‐Tag Summary Report as such but will use e‐Tags with references not in connection with the WREGIS NERC e‐Tag Summary Report.

33
e‐Tag Summary Report, staff summed up the total annual amount of e‐Tag MWh used as reported in the NERC e‐Tag Summary Report, and then compared that amount to the total annual amount of out‐of‐state RECs reported in the WREGIS Compliance Report for each retail seller. All of the NERC e‐Tag Summary Reports submitted showed that a sufficient amount of delivered energy was matched with the out‐of‐state procurement claims. For each of these claims, retail sellers also submitted at least one of the e‐Tags matched with the certificates in WREGIS and reported in the NERC e‐Tag Summary Report. Staff used these e‐Tags to verify the other delivery requirements, such as the PSE code, the POR, the POD, and that the RPS ID number of the RPS‐certified facility that the e‐Tag is matched with is in the miscellaneous field of the e‐Tag. Staff also double checked that the data reported for the e‐Tag in the NERC e‐Tag Summary Report was accurate.
Most of the retail sellers submitted sample e‐Tags in the requested e‐Tag format. However, some retail sellers stated they did not have access to the e‐Tag data in the typical e‐Tag format and instead submitted e‐Tag documentation in different formats; most often this consisted of OATI screenshots of the e‐Tag data. Such e‐Tag documentation was considered acceptable by staff.
Pending Claims Table 3 identifies the 2008‐2010 pending claims made by three retail sellers, followed by an explanation of the pending procurement claims and staff’s rationale for accepting these claims as RPS‐eligible.
Table 3: Retail Sellers’ Pending Claims – RPS ID Not in Misc Field, but in Comment Field
Year Retail Seller Facility Justification Claim Amount kWh
2008
Direct Energy
White Creek Wind 1
2nd Edition of RPS Eligibility Guidebook required RPS ID in the comment section of the e‐Tag 84,877,000
CNE White Creek Wind 1
2nd Edition of RPS Eligibility Guidebook required RPS ID in the comment section of the e‐Tag 77,429,000
2009
CNE Wheatfield Wind Farm
Incorrect RPS ID on the e‐Tag (Typo) 31,4000,000
3Phases Energy Services
Simpson Cogen
2nd Edition of RPS Eligibility Guidebook required RPS ID in the comment section of the e‐Tag 9,600,000
Total Pending 485,906,000 Source: RPS staff analysis of retail sellers’ 2008-2010 CEC-RPS-DELIVERY and WREGIS NERC e-Tag Summary Reports, and additional supporting information, including individual e-Tags.

34
Direct Energy Direct Energy’s 2008 claim from White Creek Wind I did not have e‐Tags with the RPS identification number in the Miscellaneous field of the e‐Tag; however, the RPS ID number was in the comment field of the e‐Tags. As allowed under the RPS Eligibility Guidebooks, Third and Fourth Editions, PowerEx, a third‐party marketer of renewable energy products, provided the firming and shaping services.
Direct Energy provided information explaining that PowerEx inadvertently listed the RPS ID number of the facility in the Comment field of the e‐Tag, rather than the Miscellaneous field. In doing so, PowerEx was following the delivery and verification requirements for out‐of‐state RPS‐certified facilities as specified in the RPS Eligibility Guidebook, Second Edition. This edition states that the RPS ID number of the facility must be shown in the comment field of the e‐tag. Subsequent RPS Eligibility Guidebooks specify that the RPS ID number must be in the Miscellaneous field.
Direct Energy provided a list of all the PowerEx 2008 e‐Tags associated with Direct Energy’s White Creek claim, along with six e‐Tags from the list. Direct Energy also submitted a signed attestation with its 2008 CEC‐RPS‐Delivery form for this claim.
Constellation New Energy Constellation New Energy (CNE) had four claims in 2008 and 2009 in which the e‐Tags did not have the RPS ID number in the Miscellaneous field of the e‐Tag. These claims are the 2008 White Creek Wind I claim and the 2009 Big Creek Wind, Goodnoe Hills, and Wheat Field Wind Farm claims.
PowerEx, as a third party, supplied CNE’s 2008 claim from White Creek Wind I procurement and, as a result, provided both the explanation as to why the e‐Tags failed to include White Creek’s RPS ID number and the requested supplemental documentation. PowerEx explained that it followed the RPS Eligibility Guidebook, Second Edition, direction to place the RPS ID number in the Comment field rather than the Miscellaneous field, as was specified in the RPS Eligibility Guidebook, Third Edition.
On behalf of CNE, PowerEx provided supporting information that included a list of all the 2008 e‐Tags associated with CNE’s White Creek claim and copies of nine e‐Tags from the list. CNE submitted a revised CEC‐RPS‐Delivery form correcting the POR and POD listings and a signed attestation.
CNE’s 2009 claim from Wheatfield Wind Farm did have e‐Tags with an RPS ID number in the Miscellaneous field; however, the number on the e‐Tags was 6075A, and Wheatfield Wind Farms RPS ID number is 60750A. CNE submitted an e‐mail to staff explaining that the incorrect RPS ID number entered on the e‐Tag was a typographical error carried over from the original purchase contract which was subsequently carried forward into subsequent contracts and used for scheduling/tagging purposes. CNE provided a list of e‐Tags demonstrating delivery into California sufficient to cover the Wheatfield Wind Farm claims along with a delivery form attesting to the delivery amount.
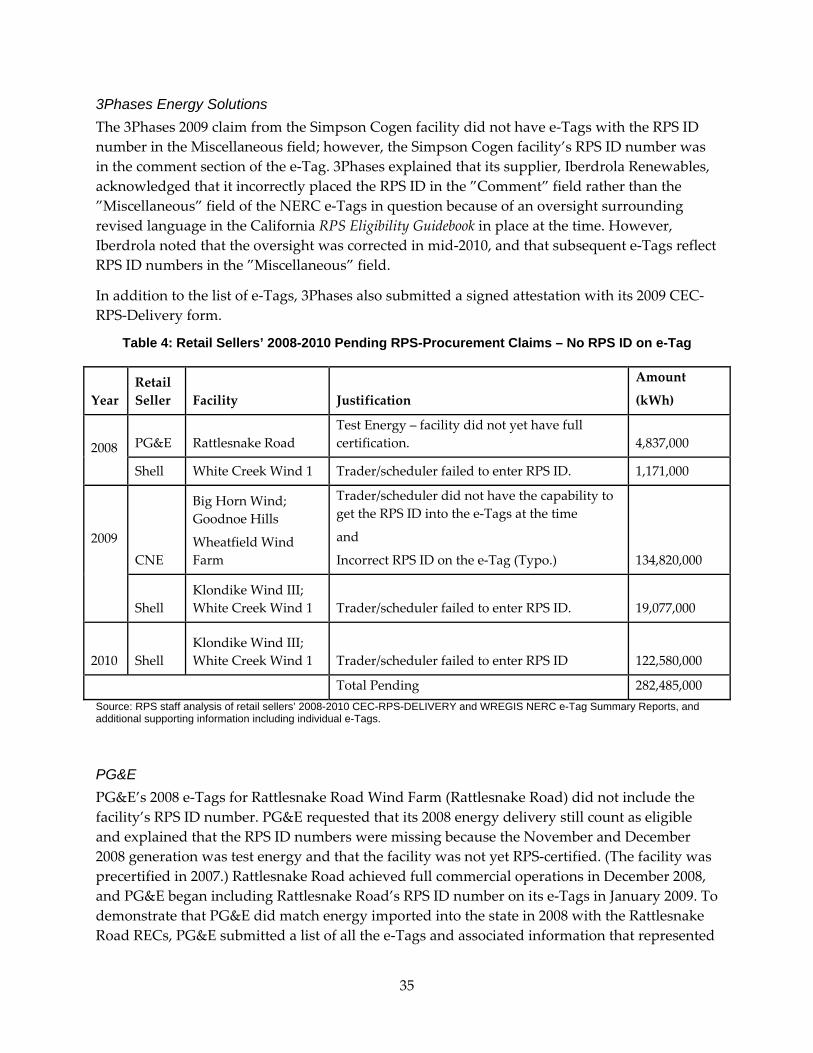
35
3Phases Energy Solutions The 3Phases 2009 claim from the Simpson Cogen facility did not have e‐Tags with the RPS ID number in the Miscellaneous field; however, the Simpson Cogen facility’s RPS ID number was in the comment section of the e‐Tag. 3Phases explained that its supplier, Iberdrola Renewables, acknowledged that it incorrectly placed the RPS ID in the ”Comment” field rather than the ”Miscellaneous” field of the NERC e‐Tags in question because of an oversight surrounding revised language in the California RPS Eligibility Guidebook in place at the time. However, Iberdrola noted that the oversight was corrected in mid‐2010, and that subsequent e‐Tags reflect RPS ID numbers in the ”Miscellaneous” field.
In addition to the list of e‐Tags, 3Phases also submitted a signed attestation with its 2009 CEC‐RPS‐Delivery form.
Table 4: Retail Sellers’ 2008-2010 Pending RPS-Procurement Claims – No RPS ID on e-Tag
Year Retail Seller Facility Justification
Amount
(kWh)
2008
PG&E Rattlesnake Road Test Energy – facility did not yet have full certification. 4,837,000
Shell White Creek Wind 1 Trader/scheduler failed to enter RPS ID. 1,171,000
2009
CNE
Big Horn Wind; Goodnoe Hills
Wheatfield Wind Farm
Trader/scheduler did not have the capability to get the RPS ID into the e‐Tags at the time
and
Incorrect RPS ID on the e‐Tag (Typo.) 134,820,000
Shell Klondike Wind III; White Creek Wind 1 Trader/scheduler failed to enter RPS ID. 19,077,000
2010 Shell Klondike Wind III; White Creek Wind 1 Trader/scheduler failed to enter RPS ID 122,580,000
Total Pending 282,485,000 Source: RPS staff analysis of retail sellers’ 2008-2010 CEC-RPS-DELIVERY and WREGIS NERC e-Tag Summary Reports, and additional supporting information including individual e-Tags.
PG&E PG&E’s 2008 e‐Tags for Rattlesnake Road Wind Farm (Rattlesnake Road) did not include the facility’s RPS ID number. PG&E requested that its 2008 energy delivery still count as eligible and explained that the RPS ID numbers were missing because the November and December 2008 generation was test energy and that the facility was not yet RPS‐certified. (The facility was precertified in 2007.) Rattlesnake Road achieved full commercial operations in December 2008, and PG&E began including Rattlesnake Road’s RPS ID number on its e‐Tags in January 2009. To demonstrate that PG&E did match energy imported into the state in 2008 with the Rattlesnake Road RECs, PG&E submitted a list of all the e‐Tags and associated information that represented

36
the imported energy, an e‐Tag from that list, and the signed attestation from the CEC‐RPS‐Delivery form.
Shell Energy Shell Energy’s 2008 and 2009 e‐Tags did not include the RPS ID numbers in the “Miscellaneous” field. When submitting its sample of 2008 e‐Tags, Shell Energy informed staff of the issue and requested that its energy deliveries still be considered eligible. Shell Energy explained that the trader/scheduler failed to enter the RPS ID on the e‐Tags. When submitting 2009 energy delivery data to the Energy Commission, Shell Energy reminded staff of this issue and reiterated that, although the e‐Tags did not have the RPS ID number in the Miscellaneous field, the energy amounts delivered were intended to be associated with its 2009 RPS procurement. Shell’s reported vintage 2010 procurement did have the correct RPS ID numbers in the Miscellaneous field of the associated e‐Tags for the out‐of‐state procurement claims.
Shell has claims with vintage 2008 procurement from White Creek Wind I in 2008 and 2010, and claims with vintage 2009 procurement from four facilities (Klondike Wind Power III, Klondike Wind Power IIIA, White Creek Wind I [as referenced above], and Harvest Wind Project) that did not satisfy the guidebook requirement of having the RPS ID number in the Miscellaneous field. To support its claims, Shell submitted, for each claim, a list of all the e‐Tags, a random e‐Tag from the list of e‐Tags, and an attestation explaining that all the out‐of‐state renewable claims were matched with generation delivered from an existing out‐of‐state contract. Shell submitted documentation for each of the five vintage 2008 and 2009 procurement contracts.
Constellation New Energy CNE’s 2009 Big Horn Wind claims were procured from Shell Energy. CNE provided documentation explaining that Shell, acting as a third party, imported energy into California to match with the RECs purchased from the Big Horn Wind Project. Shell did not yet have a process in place to ensure that the RPS ID numbers were entered on all of the import e‐Tags for the replacement energy delivered to California. A list of e‐Tags associated with the Big Horn energy delivery, and an e‐Tag from the list of e‐Tags was provided.
For CNE’s 2009 claim from Goodnoe Hills, CNE explained that it was unclear why the energy supplier omitted the RPS ID number from the e‐Tags; however, CNE provided the CEC‐RPS‐Delivery form and a signed attestation supporting its claim. CNE also submitted a list of e‐Tags for the claim. However, the list of e‐Tags showed an insufficient amount of energy delivery into California to cover the Goodnoe Hills procurement claim. CNE requested that the portion of the claim unsupported by the list of e‐Tag be counted as withdrawn. Due to this, CNE’s pending Goodnoe Hills claim is reduced by 4,267,147 kWh.
Recommendation to Accept Pending Claims Energy Commission staff audited all out‐of‐state claims to verify that there were sufficient e‐Tags to support the requirement that energy be delivered into California. Those that provided e‐Tags that did not meet the guidebook requirements then provided additional supporting documentation. The different circumstances in which verification of energy delivery did not meet the RPS Eligibility Guidebook requirements are described in detail in the sections above.

37
In all cases, the e‐Tags used to demonstrate delivery into California did not include the RPS ID number in the Miscellaneous field of the e‐Tag as specified in the RPS Eligibility Guidebook. The requirement to include the RPS ID number on an e‐Tag is a way to virtually commit energy delivery and associate the delivered energy with generation claimed from a particular RPS‐certified facility. Entities may include up to 10 RPS ID numbers on an e‐Tag, but WREGIS will not allow an e‐Tag to be used more than once. Moreover, WREGIS will not import e‐Tag data without an RPS ID number in the Miscellaneous field. Any typos or similar errors can prohibit the e‐Tag data from transferring into WREGIS. Furthermore, WREGIS will not import e‐Tag data if the same RPS ID number is listed on the e‐Tag twice.
As summarized in Table 3, 3Phases, CNE and Direct Energy had e‐Tags that included the RPS ID number, but in the Comment field instead of the Miscellaneous field of the e‐Tag. The RPS Eligibility Guidebook, Second Edition, directed retail sellers to include the RPS ID number in the Comment field of the e‐Tag. Affected parties explained that there was a lag in switching to the new RPS Eligibility Guidebook, Third Edition, requirements. However, the presence of the RPS ID number on the e‐Tag essentially demonstrates the intention to associate the e‐Tag with generation from the RPS‐eligible facility. The retail sellers also provided lists of the e‐Tags and the CEC‐RPS‐Delivery forms, which include signed attestations stating that there was sufficient energy delivered into California to cover the claims and that the energy used for delivery was not used for reasons other than to comply with California’s RPS.
In Table 4 above, while there was no RPS ID number on the e‐Tags, in all cases, the retail sellers provided lists of e‐Tags used to meet the firming and shaping requirements. Furthermore, the CEC‐RPS‐Delivery forms include signed attestations stating that sufficient energy was delivered into California to match the REC claims and that the energy used for this delivery requirement was not used for reasons other than to comply with California’s RPS.
As explained above, there are various reasons why the RPS ID numbers were not in the Miscellaneous field of the e‐Tags, or not on the e‐Tags at all. Each retail seller in this situation provided additional supporting documentation to demonstrate adequate and timely energy delivery into California to match the out‐of‐state RPS claims. Moreover, with each CEC‐RPS‐Delivery form, retail sellers attested that the energy deliveries met the Energy Commission’s RPS energy delivery requirements, the energy delivered for RPS compliance was not delivered elsewhere or used to satisfy obligations in jurisdictions other than California, and they were not used for reasons other than to comply with California’s RPS. Accordingly, staff recommends that, without evidence to the contrary, the pending out‐of‐state claims that did not have the RPS ID number in the Miscellaneous field of the e‐Tag be accepted as RPS‐eligible in the final Energy Commission‐approved 2008‐2010 RPS Verification Report. If the Energy Commission adopts this recommendation, the final version of this Energy Commission 2008‐2010 Verification Report will remove all pending claims, which will be included as part of the eligible RPS procurement claim amounts for each retail seller as applicable.

38
CHAPTER 5: Verification Findings This chapter presents procurement verification findings for retail sellers (IOUs, MJUs, ESPs, and CCAs) and updates findings presented in the 2007 Verification Report for Southern California Edison Company (SCE) and Noble Americas Energy Solutions. A facility must be certified by the Energy Commission for its generation to be eligible for the RPS. Staff has identified RPS claim amounts, that are disallowed, pending, withdrawn, and/or eligible, along with a brief description of the particular issue affecting these claims. In some cases, the retail seller requested that Energy Commission staff withdraw an ineligible claim amount. In some cases, as described in the retail seller’s section below, this withdrawal is made to address claims expected to be made in future verification reports.
The following subsections provide the verified data necessary for the CPUC to determine retail seller’s compliance with RPS procurement obligations for years prior to 2011. Specifically, the subsections compare procurement claims from each retail seller with available generation data for 2008‐2010 and reports on the eligibility of those RPS claims. For Noble Americas Energy Solutions, updates for 2007 are provided; for SCE, updates for 2001 and 2003‐2010 are provided.
Renewables Portfolio Standard Verification Results Following the discussion of pending claims are tables with staff’s verification determinations of the retail sellers organized by IOUs, MJUs, ESPs, and one CCA.
Summary Tables The following summary tables show RPS procurement for 2008‐2010 and include:
• Total RPS Procurement Claimed.
• Disallowances.
• Total Disallowances.
• Pending Allowances.
• Total Pending Allowances.
• Withdrawn Procurement Claims (included only on tables with withdrawn claims).
• Total Withdrawn Procurement (included only on tables with withdrawn claims).
• Verified Procurement Eligible Toward the RPS.
Table 5 through Table 8 summarize each IOU’s 2008‐2010 RPS procurement claims, with the exception of SCE, which includes updates for 2001 and 2003‐2010. Table 9 and Table 10 are summaries of each MJU’s 2008‐2010 RPS procurement claims, while Table 11 through Table 21 summarize ESP and CCA 2008‐2010 RPS procurement claims, with the exception of Noble, which includes an update for 2007.
For ease of viewing, Figure 2 provides a template of the RPS procurement summary table with footnotes explaining the headers for each row title in the tables that follow. However, only retail

39
sellers requesting that procurement be withdrawn have the “Withdrawn Procurement Claims” section on their tables. These retail sellers are PG&E, SDG&E, SCE, and Pilot Power. Appendix A: Retail Sellers’ Modified RPS Track Forms and WREGIS Reports provides modified CEC‐RPS‐Track forms and WREGIS Report data for all retail sellers. The appendix shows each retail seller’s procurement claim for each facility with the generation totals from each facility, when available. Please note, that earlier verification reports included the retail sellers’ annual retail sales amounts for informational purposes and to assist in CPUC staff’s RPS compliance analysis. However, because the retail sales amounts are reported in the CPUC’s current RPS compliance spreadsheet, the Energy Commission staff is not including the retail sales amounts in the 2008‐2010 Verification Report.

40
Figure 2: Template Summary of RPS Procurement (kWh)
DRAFT Template Summary of RPS Procurement (kWh)Total RPS Procurement Claimed1 Disallowances Procurement From Facilities Without RPS‐Certification2
Procurement From Facilities in Which Procurement Claims Exceed Generation by 5 Percent or Greater3Procurement From Distributed Generation Facilities4Procurement of Energy Only5 Procurement From Facilities That Exceeded Fossil Fuel Usage Limit6Procurement Claimed Before the Facilityʹs Beginning On Date7Procurement with Insufficient Energy Delivery8
Total Disallowances Pending Allowances Procurement With Outstanding Issues Regarding Electricity Delivery Verification9
Procurement With Outstanding Issues Regarding Biomethane Gas Delivery Verification10 Total Pending Allowances Withdrawn Procurement Claims11 Procurement Amount Requested to be Withdrawn from LSEʹs RPS Filing via Letter. Excess REC Amount to be Reduced in WREGIS in a Future Year. LSE will submit letter Requesting Amount to be Readjusted into LSEʹs Future Verification Report so as to not be Discredited Twice. Procurement Amount Requested to be Withdrawn from LSEʹs RPS Filing via Letter. Fossil Fuel RECs Not Eligible for CA RPS – Retired and Removed Total Withdrawn Procurement Procurement Eligible Toward the RPS12 1 This amount was reported to the Energy Commission by the retail seller in the WREGIS State/Provincial/voluntary Compliance Report and/or RPS‐Track form.
2 Facilities must be certified as RPS‐eligible with the California Energy Commission for procurement to be counted toward the RPS.
3 Procurement from each facility was compared to generation reported for that facility to either the United States Energy Information Administration or various reporting programs at the Energy Commission. For facilities with more than one data source available for the generation amount, the highest amount was selected. In cases where the RPS claims exceed generation by 5 percent or greater, unless the retail seller provides documentation to support the RPS procurement claim, such as an invoice, the procurement amount exceeding the generation amount is not counted as RPS‐eligible.

41
Energy Commission staff requires supporting documentation for claims exceeding generation by 5 percent or greater.
4 Procurement from distributed generation facilities was not eligible during 2008‐2010. Page 4 of the RPS Eligibility Guidebook, Fourth Edition, states, ʺThe Energy Commission will certify distributed generation as RPS‐eligible only if and when the CPUC authorizes applying tradable RECs toward RPS obligation.ʺ The Fifth Edition of the RPS Eligibility Guidebook, which was adopted May 9, 2012, was updated to allow for distributed generation facilities to apply for RPS certification. 5 Energy without the RECs is not eligible for the RPS program. To be eligible, the generation must come from an RPS‐certified facility and, in accordance with CPUC Decision 11‐01‐025, until reporting year 2010, RPS claims must have included both the REC and energy to count for the RPS. When there are competing claims for RECs, staff verifies that the retail seller has the right to claim the REC and does not own just the energy alone.
6 Page 19 of the RPS Eligibility Guidebook, Fourth Edition, states that “If the annual fossil fuel use at the facility does NOT exceed a de minimus amount, then 100 percent of the electricity production from the facility may count as RPS‐eligible.ʺ
7 Page 42 of the RPS Eligibility Guidebook, Fourth Edition, states, ʺProcurement may count toward a retail seller’s RPS obligation if the generating facility was RPS certified at the time of procurement or applied for RPS certification or precertification at the time of procurement. The electricity will not be considered eligible, however, and will not be counted toward meeting an RPS obligation until the facility is actually certified by the Energy Commission as being eligible for the RPS.ʺ
8 Page 71 of the RPS Eligibility Guidebook, Fourth Edition, states, ʺThe Energy Commission will compare the total amount generated in the previous calendar year with the total amount delivered in the previous calendar year, and the lesser of the two may be accounted for as RPS‐eligible,” and “if the amount generated exceeds the annual amount that was delivered as demonstrated by the NERC e‐Tag, the Energy Commission will assume some of the generation was delivered elsewhere and will count as RPS‐eligible only the amount of procurement supported by the NERC e‐Tag data.”
9 Page 71 of the RPS Eligibility Guidebook, Fourth Edition, states, ʺThe California RPS‐certification number must be shown on the Miscellaneous filed of the NERC e‐Tag.ʺ This requirement is to help ensure that the e‐Tag data gets transferred into WREGIS and to identify e‐Tags as being designated for a particular RPS claim requiring delivery verification.
10 Page 20 of the RPS Eligibility Guidebook, Fourth Edition, states that any production or acquisition of biomethane that is directly supplied to the gas transportation pipeline system and used to produce electricity may generate RPS‐eligible electricity if various requirements have been met.
11 Retail Seller requested that this amount be removed from ʺTotal RPS Procurement Claimedʺ because this amount cannot be withdrawn from the retail sellerʹs WREGIS Compliance Report filing. In cases in which WREGIS reduces the amount of certificates available in a future year to correct an error, as appropriate, this amount will be added in as eligible RPS procurement in the year that WREGIS reduces certificates.
12 This is the total RPS procurement for each year that excludes ineligible RPS procurement claims.

42
Verification Results for Investor-Owned Utilities Pacific Gas and Electric Company
Table 5: PG&E Summary of RPS Procurement (kWh)
2008 2009 2010
Total RPS Procurement Claimed1 9,808,584,095 11,486,389,000 12,336,777,606
Disallowances
Procurement From Facilities Without RPS‐Certification2 0 0 0
Procurement From Facilities in Which Procurement Claims Exceed Generation by 5 Percent or Greater3
0 0
Procurement From Distributed Generation Facilities4 0 0 0
Procurement of Energy Only5 0 0 0
Procurement From Facilities That Exceeded Fossil Fuel Usage Limit6
0 0 0
Procurement Claimed Before the Facilityʹs Beginning‐On Date7
0 0 0
Procurement with Insufficient Energy Delivery8 0 0 0
Total Disallowances 0 0 0
Pending Allowances
Procurement With Outstanding Issues Regarding Electricity Delivery Verification9
4,837,000 0 0
Total Pending Allowances 4,851,200 0 0
Withdrawn Procurement Claims11
Procurement Amount Requested to be withdrawn due to erroneous certificate creation in WREGIS. Amount to be reduced in WREGIS in a future year and reapplied by PG&E for RPS credit when this WREGIS readjustment occurs
3,896,000 127,160 1,609,890
Procurement Amount Requested to be Withdrawn due to Fossil Fuel RECs Not Eligible for CA RPS – Retired and Removed from Circulation in WREGIS.
0 0 18,000
Procurement Amount Requested to be withdrawn due to insufficient supporting documentation for verification related to the delivery of biomethane.
14,000 1,912,000 0
Total Withdrawn Procurement 3,910,000 2,039,160 1,627,890
Procurement Eligible Toward the RPS12 9,799,837,095 11,484,349,840 12,335,149,716Source: RPS staff analysis of PG&E’s 2008-2010 CEC-RPS-Track Forms, WREGIS Compliance Reports and supporting documentation.
During the verification process for 2008‐2010, PG&E revised its procurement amounts claimed in the RPS Track forms and WREGIS reports for different reasons, such as removing

43
procurement from its 2008, 2009, and 2010 CEC‐RPS‐Track forms that were found to be available in WREGIS, and resubmitting the WREGIS Reports to add the procurement that was removed from the CEC‐RPS‐Track forms. Staff found some procurement that PG&E retired and claimed in its WREGIS Reports to be ineligible, but since the WREGIS certificates had been retired more than 12 months prior to that determination, PG&E could not unretire and remove the RECs from its WREGIS Reports. As a result, PG&E requested that the ineligible procurement be withdrawn from its claim. These procurement amounts are shown in the Withdrawn Procurement Claims section of PG&E’s Summary of RPS Procurement Table above.
Five of the claims in which a portion of the procurement was requested to be withdrawn involved RECs that, for various reasons, were erroneously created in WREGIS. To correct the errors, WREGIS will withhold creation of an equal number of RECs for each facility’s 2011 or 2012 REC amounts. Energy Commission staff determined that PG&E could correct the error in a future year by requesting to apply the “withdrawn “claim amount in a future year to account for when WREGIS reduces the amount of RECs created for these particular facilities. This process allows the RPS Verification Report to reflect the eligible claim amounts. Moreover, by allowing the withdrawn amount to be counted in a future Verification Report, this process prevents PG&E from being doubly discredited when WREGIS withholds creation of an equivalent amount of RECs from the specific facilities to correct the error. The withdrawn claims in Table 6 below show the amounts to be reduced per facility by WREGIS in future years. These withdrawn claim amounts will be credited to PG&E in a future Verification Report.
Table 6: PG&E Withdrawn Claims to Be Added In Future Verification Reports (kWh)
Year Facility Name RPS ID
PG&Eʹs Original Claim (kWh)
Amount Ineligible – Will Be Counted as Withdrawn (kWh)
Amount Eligible (kWh)
Amount to Be Added into Future Verification Report (kWh)
Year that WREGIS Reduced Certificate Amounts
2008 Waste Management Renewable Energy 60096 46,511,218 3,896,000 4,2615,218 3,896,000 2011
2009 Amedee Geothermal Venture I 60111 3,819,000 1,510 3,817,490 1,510 2012
2009 Wineagle Developers 1 60193 3,078,000 125,650 2,952,350 125,650 2012
2010 Amedee Geothermal Venture I 60111 1,070,050 336,280 733,770 336,280 2012
2010 Wineagle Developers 1 60193 4,052,000 1,273,610 2,778,390 1,273,610 2012
Source: RPS staff analysis of PG&E’s 2008-2010 WREGIS Compliance Reports and letter from PG&E requesting the amounts to be withdrawn from its RPS filing and after WREGIS makes an adjustment to correct the WREGIS amounts. PG&E may request that the Energy Commission apply the withdrawn REC amounts to account for WREGIS reducing the REC creation amount.

44
PG&E requested that a portion of the procurement amount be withdrawn from a facility originally certified as a multifuel facility but later corrected to be certified as a renewable‐only facility. During the 2007 RPS Procurement Verification process, staff discovered that the facility was using more fossil fuel than what would have been allowable to count the facility’s entire generation amount as renewable. The facility’s certification status has been changed to allow only generation from renewable fuel to count as RPS‐eligible. However, the change to the facility’s multifuel status was not made in WREGIS until after 2010. During the multifuel analysis of the RPS procurement verification process, PG&E informed staff it had inadvertently claimed more RECs than were eligible. Since these RECs could not be unretired and removed from PG&E’s WREGIS Compliance Report, PG&E requested that the Energy Commission report the procurement as withdrawn.
PG&E had claims from three facilities during 2008 – 2010 that used pipeline biomethane, as discussed in detail in Chapter 3: Verification Issues. Energy Commission staff determined that a portion of the amount claimed for all three years is disallowed because there was not sufficient documentation to verify the full claim amounts. PG&E agreed to withdraw the disallowed claim amount.
PG&E has pending procurement claims because the e‐Tags associated with its out‐of‐state claims did not have the RPS ID number of the RPS‐certified facility listed in the Miscellaneous field of the e‐Tags, as required by the RPS Eligibility Guidebooks, Third and Fourth Editions. As discussed in Chapter 3: Verification Issues, PG&E submitted a list of the e‐Tags to show energy delivery into California, along with the CEC‐RPS‐Delivery form and the signed attestation. If the Energy Commission accepts staff’s recommendation to accept the pending claims as eligible, the final version of this 2008‐2010 Verification Report will remove PG&E’s pending claim amount and include it as part of the eligible RPS procurement claim amount.
San Diego Gas & Electric Company Table 7 summarizes SDG&E’s 2008 – 2010 procurement eligible to count for the RPS. In 2009, SDG&E inadvertently retired WREGIS RECs with generation (vintage) dates that were before the facilities’ RPS eligibility beginning‐on dates. When staff informed SDG&E that the procurement was ineligible, SDG&E requested to report the procurement as “withdrawn” in the RPS Verification Report because the RECs had been retired for more than 12 months before the determination and could not be unretired, as would have been preferred, from SDG&E’s WREGIS Report.

45
Table 7: SDG&E Summary of RPS Procurement (kWh)
2008 2009 2010
Total RPS Procurement Claimed1 1,047,427,926 2,098,398,000 2,229,190,000
Disallowances
Procurement From Facilities Without RPS‐Certification2
0 0
Procurement From Facilities in Which Procurement Claims Exceed Generation by 5 Percent or Greater3
0 0
Procurement From Distributed Generation Facilities4
0 0 0
Procurement of Energy Only5 0 0 0
Procurement From Facilities That Exceeded Fossil Fuel Usage Limit6
0 0 0
Procurement Claimed Before the Facilityʹs Beginning‐On Date7
0 0 0
Procurement with Insufficient Energy Delivery8
0 0 0
Total Disallowances 0 0 0
Pending Allowances Procurement With Outstanding Issues Regarding Electricity Delivery Verification9
0 0 0
Procurement With Outstanding Issues Regarding Biomethane Gas Delivery Verification10
0 0 0
Total Pending Allowances 0 0 0 Withdrawn Procurement Claims11 Procurement Amount Requested to be Withdrawn from LSEʹs RPS Filing via Letter. Procurement Claimed Before the Facilityʹs Beginning On Date7
101,000 0
Total Withdrawn Procurement 0 101,000 0
Procurement Eligible Toward the RPS12 1,047,427,926 2,098,297,000 2,229,190,000 Source: RPS staff analysis of SDG&Es 2008-2010 CEC-RPS-Track Forms, WREGIS Compliance Reports and supporting documentation

46
Southern California Edison Company Table 8 summarizes SCE’s 2008 – 2010 procurement eligible to count toward the RPS.
Table 8: SCE Summary of RPS Procurement (kWh)
2008 2009 2010 Total RPS Procurement Claimed1 12,486,567,655 13,581,066,384 14,604,252,010
Disallowances Procurement From Facilities Without RPS‐Certification2
0 0 0
Procurement From Facilities in Which Procurement Claims Exceed Generation by 5 Percent or Greater3
0 0 0
Procurement From Distributed Generation Facilities 4
0 0 0
Procurement of Energy Only5 0 0 0
Procurement From Facilities That Exceeded Fossil Fuel Usage Limit6
0 0 0
Procurement Claimed Before the Facilityʹs Beginning‐On Date7
0 0 0
Procurement with Insufficient Energy Delivery8 0 0 0 Total Disallowance 0 0 0 Pending Allowances
Procurement With Outstanding Issues Regarding Electricity Delivery Verification9
0 0 0
Procurement With Outstanding Issues Regarding Biomethane Gas Delivery Verification10
0 0 0
Total Pending Allowances 0 0 0
Withdrawn Procurement Claims11 Procurement Amount Requested to be Withdrawn from LSEʹs RPS Filing via Letter. Procurement Claimed Before the Facilityʹs Beginning On Date 7
66,606,000 71,095,000 116,112,000
Procurement Amount Requested to be Withdrawn from LSEʹs RPS Filing via Letter due to on‐site load not eligible for the RPS – Retired and Removed from Circulation in WREGIS.
8,590 14,719 18,128
Procurement Amount Requested to be Withdrawn from LSEʹs RPS Filing via Letter due to capacity adjustments of the facilities – Retired and Removed from Circulation in WREGIS
9,734,569 44,101,000 44,092,000
Total Withdrawn Procurement 76,349,159 115,210,719 160,222,128 Procurement Eligible Toward the RPS12 12,410,218,496 13,465,855,665 14,444,029,882
Source: RPS staff analysis of SCE’s 2008-2010 CEC-RPS-Track Forms, WREGIS Compliance Reports and supporting documentation

47
During the 2008‐2010 RPS procurement verification process, SCE revised its 2008 – 2010 CEC‐RPS‐Track and WREGIS Reports by removing claims staff deemed ineligible and by adding additional procurement originally not included. Some ineligible procurement could not be removed from SCE’s 2008‐2010 WREGIS Reports because the RECs had been retired for more than 12 months prior to the ineligible determination. SCE requested that this procurement be counted as withdrawn in the Verification Report. However, none of the withdrawn procurement involves corrections made in WREGIS, so the withdrawn procurement amounts listed in Table 8 above will not be added back into RPS procurement totals in future years.
One of SCE’s 2008 – 2010 withdrawn procurement claims was from an RPS‐certified facility, “Section 7 Trust”(RPS ID 60389), and revisions to the procurement claims from this facility were from 2001 and 2003 – 2007. SCE resubmitted its earlier years’ CEC‐RPS‐Track forms to remove the ineligible procurement. This issue was discovered while conducting the 2008 overclaim analysis. SCE was asked to provide documentation to support an overclaim from Section 7 Trust, in which SCE’s claim was 29 percent greater than the generation data provided by EIA for the facility. However, the documentation that SCE submitted showed that two RPS‐certified facilities, Section 7 Trust and San Gorgonio Farms Wind Farm (RPS ID 60371), connect to the grid at the same point before a shared meter and serve each other’s onsite load. Initially, these were two wind facilities that were located very close together but were not physically connected to each other. After Section 7 Trust was built, the decision was made to connect the two facilities together and make one facility. However, this decision has resulted in two RPS‐certified facilities that connect to the grid at the same point before a shared meter, which enabled them to serve each other’s onsite load.
SCE initially claimed the generation that went to onsite load was RPS‐eligible because it offset electricity that otherwise would have been pulled from the grid. However, WREGIS rules require that to claim any such generation, it must be separately metered and verified. These two facilities have no such metering arrangement, so such generation cannot be counted, and SCE has agreed to not claim any generation that was used to serve onsite load. Staff determined that the only way to verify the eligible procurement amounts from both facilities was to treat them as one facility and require that the generation claimed from both facilities together cannot exceed what actually went to the grid. SCE agreed to follow this approach and revise its claims from Section 7 Trust to remove the generation used onsite from its claim. SCE was able to remove the ineligible 2008 procurement from the amounts claimed on the 2008 CEC‐RPS‐Track form; however, the 2009 and 2010 claims were both made through WREGIS. Since the time had passed in which SCE could request that the WREGIS RECs be unretired, SCE requested that the ineligible amounts be withdrawn in the Verification Report.
SCE also updated its Total RPS Procurement Claimed amounts for 2001 and 2003‐2007 by submitting revised 2001 and 2003‐2007 CEC‐RPS‐Track forms, which removed all its procurement claims determined to be ineligible in the 2006 and 2007 Verification Reports, including ineligible procurement from Section 7 Trust. Details of the procurement claims and SCE’s updated 2001 and 2003 – 2007 Procurement Eligible for the RPS can be found in Tables 22 and 23.
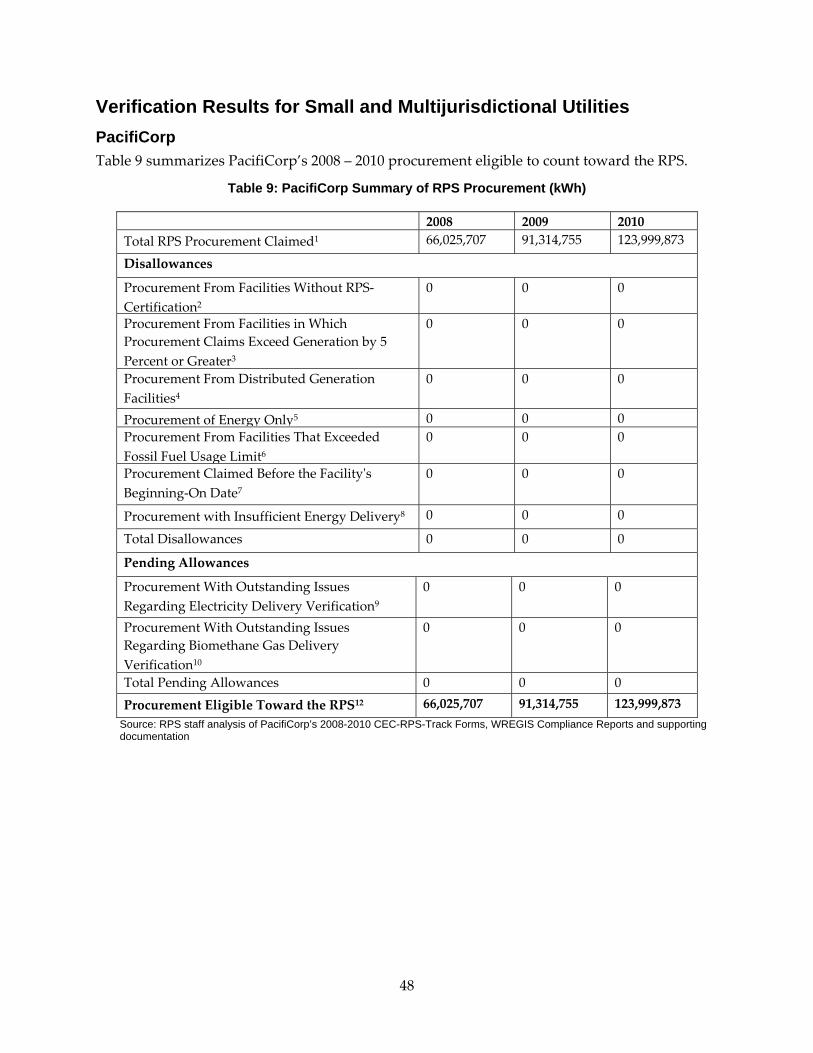
48
Verification Results for Small and Multijurisdictional Utilities PacifiCorp Table 9 summarizes PacifiCorp’s 2008 – 2010 procurement eligible to count toward the RPS.
Table 9: PacifiCorp Summary of RPS Procurement (kWh)
2008 2009 2010 Total RPS Procurement Claimed1 66,025,707 91,314,755 123,999,873
Disallowances
Procurement From Facilities Without RPS‐Certification2
0 0 0
Procurement From Facilities in Which Procurement Claims Exceed Generation by 5 Percent or Greater3
0 0 0
Procurement From Distributed Generation Facilities4
0 0 0
Procurement of Energy Only5 0 0 0 Procurement From Facilities That Exceeded Fossil Fuel Usage Limit6
0 0 0
Procurement Claimed Before the Facilityʹs Beginning‐On Date7
0 0 0
Procurement with Insufficient Energy Delivery8 0 0 0
Total Disallowances 0 0 0
Pending Allowances
Procurement With Outstanding Issues Regarding Electricity Delivery Verification9
0 0 0
Procurement With Outstanding Issues Regarding Biomethane Gas Delivery Verification10
0 0 0
Total Pending Allowances 0 0 0
Procurement Eligible Toward the RPS12 66,025,707 91,314,755 123,999,873 Source: RPS staff analysis of PacifiCorp’s 2008-2010 CEC-RPS-Track Forms, WREGIS Compliance Reports and supporting documentation

49
Sierra Pacific Power Company Table 10 summarizes Sierra Pacific’s 2008 – 2010 procurement eligible to count toward the RPS.
Table 10:Sierra Pacific Summary of RPS Procurement (kWh)
2008 2009 2010
Total RPS Procurement Claimed1 85,685,393 117,346,000 99,499,000
Disallowances Procurement From Facilities Without RPS‐Certification2
0 0 0
Procurement From Facilities in Which Procurement Claims Exceed Generation by 5 Percent or Greater3
0 0 0
Procurement From Distributed Generation Facilities4
0 0 0
Procurement of Energy Only5 0 0 0
Procurement From Facilities That Exceeded Fossil Fuel Usage Limit6
0 0 0
Procurement Claimed Before the Facilityʹs Beginning‐On Date7
0 0 0
Procurement with Insufficient Energy Delivery8 0 0 0
Total Disallowances 0 0 0
Pending Allowances
Procurement With Outstanding Issues Regarding Electricity Delivery Verification9
0 0 0
Procurement With Outstanding Issues Regarding Biomethane Gas Delivery Verification10
0 0 0
Total Pending Allowances 0 0 0
Procurement Eligible Toward the RPS12 85,685,393 117,346,000 99,499,000 Source: RPS staff analysis of Sierra Pacific’s 2008-2010 CEC-RPS-Track Forms, WREGIS Compliance Reports and supporting documentation

50
Verification Results for Electric Service Providers and Community Choice Aggregation APS Energy Services Table 11 summarizes APS Energy Services’ (ASPES) 2008 procurement eligible to count toward the RPS. APSES exited the California electric retail market on June 30, 2008. In addition, APSES was sold to another company in August 2011 and is now doing business as Ameresco Southwest.
Table 11: APSES Summary of RPS Procurement (kWh) for 2008
2008
Total RPS Procurement Claimed1 4,121,000
Disallowances
Procurement From Facilities Without RPS‐Certification2 0
Procurement From Facilities in Which Procurement Claims Exceed Generation by 5 Percent or Greater3
0
Procurement From Distributed Generation Facilities4 0
Procurement of Energy Only5 0
Procurement From Facilities That Exceeded Fossil Fuel Usage Limit6 0
Procurement Claimed Before the Facilityʹs Beginning‐On Date7 0
Procurement with Insufficient Energy Delivery8 0
Total Disallowances 0
Pending Allowances
Procurement With Outstanding Issues Regarding Electricity Delivery Verification9
0
Procurement With Outstanding Issues Regarding Biomethane Gas Delivery Verification10
0
Total Pending Allowances 0
Procurement Eligible Toward the RPS12 4,121,000 Source: RPS staff analysis of APS’s 2008-2010 CEC-RPS-Track Forms, WREGIS Compliance Reports and supporting documentation

51
3Phases Energy Services Table 12 summarizes 3Phases Energy Services’ 2008 and 2009 procurement eligible to count toward the RPS.
Table 12: 3Phases Summary of RPS Procurement (kWh)
2008 2009
Total RPS Procurement Claimed1 38,196,600 10,100,000
Disallowances
Procurement From Facilities Without RPS‐Certification2 0 0
Procurement From Facilities in Which Procurement Claims Exceed Generation by 5 Percent or Greater3
0 0
Procurement From Distributed Generation Facilities4 0 0
Procurement of Energy Only5 0 0
Procurement From Facilities That Exceeded Fossil Fuel Usage Limit6
0 0
Procurement Claimed Before the Facilityʹs Beginning‐On Date7 0 0
Procurement with Insufficient Energy Delivery8 0 0
Total Disallowances 0 0
Pending Allowances
Procurement With Outstanding Issues Regarding Electricity Delivery Verification9
0 9,600,000
Procurement With Outstanding Issues Regarding Biomethane Gas Delivery Verification10
0 0
Total Pending Allowances 0 9,600,000
Procurement Eligible Toward the RPS12 38,196,600 500,000Source: RPS staff analysis of 3Phases’ 2008-2010 CEC-RPS-Track Forms, WREGIS Compliance Reports and supporting documentation
3Phases did not submit RPS procurement claims for 2010. 3Phases has pending procurement claims because the e‐Tags associated with its out‐of‐state claims did not have the RPS ID number of the RPS‐certified facility listed in the miscellaneous field of the e‐Tags, as required by the RPS Eligibility Guidebooks, Third and Fourth Editions. The e‐Tags did have the RPS ID number listed in the comment section of the e‐Tag, which was the requirement in the RPS Eligibility Guidebook, Second Edition.
As discussed in Chapter 3, 3Phases submitted a list of the e‐Tags to show energy delivery into California, along with the CEC‐RPS‐Delivery form and signed attestation. If the Energy Commission votes to accept the recommendation to accept the pending claims as eligible, the final version of this 2008‐2010 Verification Report will remove 3Phases’ pending claim amount and include it as part of the eligible RPS procurement claim amount.

52
Calpine PowerAmerica-CA Table 13 summarizes Calpine’s 2009 and 2010 procurement eligible to count toward the RPS. Calpine did not report RPS procurement claims for 2008.
Table 13: Calpine PowerAmerica-CA, LLC, Summary of RPS Procurement (kWh)
2009 2010
Total RPS Procurement Claimed1 79,999,000 118,180,000Disallowances
Procurement From Facilities Without RPS‐Certification2 0 0
Procurement From Facilities in Which Procurement Claims Exceed Generation by 5 Percent or Greater3
0 0
Procurement From Distributed Generation Facilities4 0 0
Procurement of Energy Only5 0 0
Procurement From Facilities That Exceeded Fossil Fuel Usage Limit6 0 0
Procurement Claimed Before the Facilityʹs Beginning‐On Date7 0 0
Procurement with Insufficient Energy Delivery8 0 0
Total Disallowances 0 0
Pending Allowances
Procurement With Outstanding Issues Regarding Electricity Delivery Verification9
0 0
Procurement With Outstanding Issues Regarding Biomethane Gas Delivery Verification10
0 0
Total Pending Allowances 0 0
Procurement Eligible Toward the RPS12 79,999,000 118,180,000Source: RPS staff analysis of Calpine’s 2008-2010 CEC-RPS-Track Forms, WREGIS Compliance Reports and supporting
documentation.
Constellation New Energy CNE’s 2008 – 2010 procurement eligible to count for the RPS is shown in Table 14 CNE has pending procurement claims because the e‐Tags associated with its out‐of‐state claims did not have the RPS ID number of the RPS‐certified facility listed in the Miscellaneous field of the e‐Tags, as required by the RPS Eligibility Guidebooks, Third and Fourth Editions. In two cases, the e‐Tags provided did have the RPS ID number listed in the comment section of the e‐Tag, which was the requirement in the Second Edition of the RPS Eligibility Guidebook.
As discussed in Chapter 3: Verification Issues, CNE agreed to submit a list of the e‐Tags to show energy delivery into California, along with the CEC‐RPS‐Delivery form and the signed attestation. If Energy Commission staff receives this information from CNE and the Energy Commission votes to accept the recommendation to accept the pending claims as eligible, the final version of this Energy Commission 2008‐2010 Verification Report will remove CNEs’ pending claim amount and include it as part of the eligible RPS procurement claim amount.
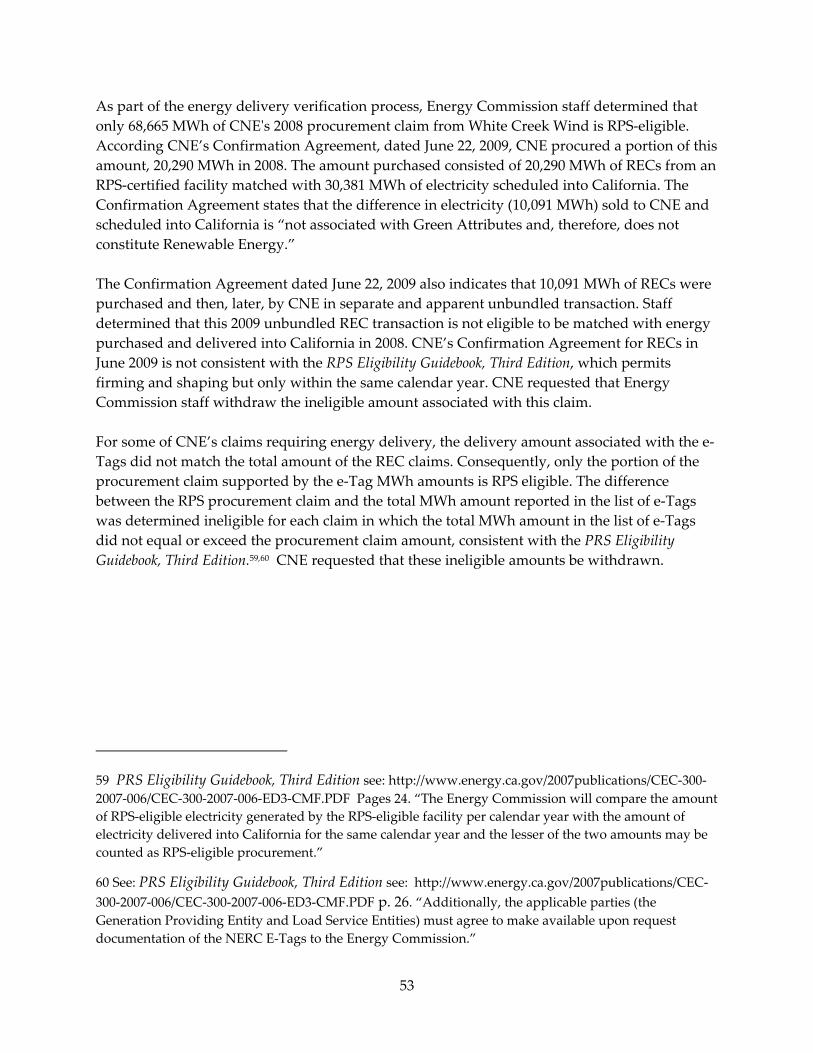
53
As part of the energy delivery verification process, Energy Commission staff determined that only 68,665 MWh of CNEʹs 2008 procurement claim from White Creek Wind is RPS‐eligible. According CNE’s Confirmation Agreement, dated June 22, 2009, CNE procured a portion of this amount, 20,290 MWh in 2008. The amount purchased consisted of 20,290 MWh of RECs from an RPS‐certified facility matched with 30,381 MWh of electricity scheduled into California. The Confirmation Agreement states that the difference in electricity (10,091 MWh) sold to CNE and scheduled into California is “not associated with Green Attributes and, therefore, does not constitute Renewable Energy.” The Confirmation Agreement dated June 22, 2009 also indicates that 10,091 MWh of RECs were purchased and then, later, by CNE in separate and apparent unbundled transaction. Staff determined that this 2009 unbundled REC transaction is not eligible to be matched with energy purchased and delivered into California in 2008. CNE’s Confirmation Agreement for RECs in June 2009 is not consistent with the RPS Eligibility Guidebook, Third Edition, which permits firming and shaping but only within the same calendar year. CNE requested that Energy Commission staff withdraw the ineligible amount associated with this claim. For some of CNE’s claims requiring energy delivery, the delivery amount associated with the e‐Tags did not match the total amount of the REC claims. Consequently, only the portion of the procurement claim supported by the e‐Tag MWh amounts is RPS eligible. The difference between the RPS procurement claim and the total MWh amount reported in the list of e‐Tags was determined ineligible for each claim in which the total MWh amount in the list of e‐Tags did not equal or exceed the procurement claim amount, consistent with the PRS Eligibility Guidebook, Third Edition.59,60 CNE requested that these ineligible amounts be withdrawn.
59 PRS Eligibility Guidebook, Third Edition see: http://www.energy.ca.gov/2007publications/CEC‐300‐2007‐006/CEC‐300‐2007‐006‐ED3‐CMF.PDF Pages 24. “The Energy Commission will compare the amount of RPS‐eligible electricity generated by the RPS‐eligible facility per calendar year with the amount of electricity delivered into California for the same calendar year and the lesser of the two amounts may be counted as RPS‐eligible procurement.”
60 See: PRS Eligibility Guidebook, Third Edition see: http://www.energy.ca.gov/2007publications/CEC‐300‐2007‐006/CEC‐300‐2007‐006‐ED3‐CMF.PDF p. 26. “Additionally, the applicable parties (the Generation Providing Entity and Load Service Entities) must agree to make available upon request documentation of the NERC E‐Tags to the Energy Commission.”

54
Table 14: CNE Summary of RPS Procurement (kWh)
2008 2009 2010
Total RPS Procurement Claimed1 190,203,000 1,091,304,000 531,193,000
Disallowances
Procurement From Facilities Without RPS‐Certification2
0 0 0
Procurement From Facilities in Which Procurement Claims Exceed Generation by 5 Percent or Greater3
0 0 0
Procurement From Distributed Generation Facilities4
0 0 0
Procurement of Energy Only5 0 0
Procurement From Facilities That Exceeded Fossil Fuel Usage Limit6
0 0 0
Procurement Claimed Before the Facilityʹs Beginning‐On Date7
0 0 0
Procurement with Insufficient Energy Delivery8 0 0 0
Total Disallowances 0 0 0
Withdrawn Procurement Claims11
Procurement amount requested to be withdrawn from LSEʹs RPS filing via letter due to procurement of energy only5
10,091,000 0 0
Procurement amount requested to be withdrawn from LSEʹs RPS filing via letter due to procurement with insufficient energy delivery8
0 21,660,000 0
Total Withdrawn Procurement Claims 10,091,000 21,660,000 0
Pending Allowances
Procurement With Outstanding Issues Regarding Electricity Delivery Verification9
68,665,000 134,820,000 0
Procurement With Outstanding Issues Regarding Biomethane Gas Delivery Verification10
0 0 0
Total Pending Allowances 68,665,000 134,820,000 0
Procurement Eligible Toward the RPS12 111,447,000 934,824,000 531,193,000 Source: CNE’s 2008-2010 CEC-RPS Track, WREGIS Compliance Reports, and supporting documentation.

55
Commerce Energy, Inc. Table 15 summarizes Commerce’s 2008 – 2010 procurement eligible to count toward the RPS.
Table 15: Commerce Summary of RPS Procurement (kWh)
2008 2009 2010
Total RPS Procurement Claimed1 9,373,000 38,986,000 74,200,000
Disallowances
Procurement From Facilities Without RPS‐Certification2 0 0 0
Procurement From Facilities in Which Procurement Claims Exceed Generation by 5 Percent or Greater3
0 0 0
Procurement From Distributed Generation Facilities4 0 0 0
Procurement of Energy Only5 0 0 0
Procurement From Facilities That Exceeded Fossil Fuel Usage Limit6
0 0 0
Procurement Claimed Before the Facilityʹs Beginning‐On Date7 0 0 0
Procurement with Insufficient Energy Delivery8 0 0 0
Total Disallowances 0 0 0
Pending Allowances
Procurement With Outstanding Issues Regarding Electricity Delivery Verification9
0 0 0
Procurement With Outstanding Issues Regarding Biomethane Gas Delivery Verification10
0 0 0
Total Pending Allowances 0 0 0
Procurement Eligible Toward the RPS12 9,373,000 38,986,000 74,200,000Source: Commerce’s 2008-2010 CEC-RPS Track, WREGIS Compliance Reports, and supporting documentation.

56
Direct Energy Business, LLC Table 16 summarizes Direct Energy’s 2008 – 2010 procurement eligible to count toward the RPS. Direct Energy has a 2008 pending procurement claim because the e‐Tags used in the energy delivery of the claim did not have the RPS ID number of the RPS‐certified facility listed in the Miscellaneous field of the e‐Tags, as required by the RPS Eligibility Guidebooks, Third and Fourth Editions. The e‐Tags did have the RPS ID number listed in the comment section of the e‐Tag, which was the requirement in the Second Edition of the RPS Eligibility Guidebook.
Table 16: Direct Energy Business, LLC, Summary of RPS Procurement (kWh)
2008 2009 2010
Total RPS Procurement Claimed1 84,877,000 444,587,000 293,219,000
Disallowances
Procurement From Facilities Without RPS‐Certification2
0 0 0
Procurement From Facilities in Which Procurement Claims Exceed Generation by 5 Percent or Greater3
0 0 0
Procurement From Distributed Generation Facilities4
0 0 0
Procurement of Energy Only5 0 0 0
Procurement From Facilities That Exceeded Fossil Fuel Usage Limit6
0 0 0
Procurement Claimed Before the Facilityʹs Beginning‐On Date7
0 0 0
Procurement with Insufficient Energy Delivery8 0 0 0
Total Disallowances 0 0 0
Pending Allowances
Procurement With Outstanding Issues Regarding Electricity Delivery Verification9
84,877,000 0 0
Procurement With Outstanding Issues Regarding Biomethane Gas Delivery Verification10
0 0 0
Total Pending Allowances 84,877,000 0 0
Procurement Eligible Toward the RPS12 0 444,587,000 293,219,000Source: RPS staff analysis of Direct Energy Business, LLC, 2008-2010 CEC-RPS-Track Forms, WREGIS Compliance Reports and supporting documentation
As discussed in Chapter 3, Direct Energy submitted a list of the e‐Tags to show energy delivery into California, along with the CEC‐RPS‐Delivery form and signed attestation. If the Energy Commission votes to accept the recommendation to accept the pending claims as eligible, the

57
final version of this 2008‐2010 Verification Report will remove Direct Energy’s pending claim amount and include it as part of the eligible RPS procurement claim amount.
Marin Energy Authority (Community Choice Aggregation) Table 17 summarizes Marin Energy Authority’s 2010 procurement eligible to count toward the RPS.
Table 17: Marin Energy Authority Summary of RPS Procurement (kWh)
2010
Total RPS Procurement Claimed1 24,182,000
Disallowances
Procurement From Facilities Without RPS‐Certification2 0
Procurement From Facilities in Which Procurement Claims Exceed Generation by 5 Percent or Greater3 0
Procurement From Distributed Generation Facilities4 0
Procurement of Energy Only5 0
Procurement From Facilities That Exceeded Fossil Fuel Usage Limit6 0
Procurement Claimed Before the Facilityʹs Beginning‐On Date7 0
Procurement with Insufficient Energy Delivery8 0
Total Disallowances 0
Pending Allowances
Procurement With Outstanding Issues Regarding Electricity Delivery Verification9 0
Procurement With Outstanding Issues Regarding Biomethane Gas Delivery Verification10 0
Total Pending Allowances 0
Procurement Eligible Toward the RPS12 24,182,000Source: Marin Energy Authority’s 2010 WREGIS Compliance Reports, and supporting documentation.

58
Noble Americas Energy Solutions Table 18 summarizes Noble’s 2008 – 2010 procurement eligible to count toward the RPS.
Table 18: Noble Americas Summary of RPS Procurement (kWh)
2008 2009 2010
Total RPS Procurement Claimed1 98,165,000 307,132,000 923,102,000
Disallowances
Procurement From Facilities Without RPS‐Certification2
0 0 0
Procurement From Facilities in Which Procurement Claims Exceed Generation by 5 Percent or Greater3
0 0 0
Procurement From Distributed Generation Facilities4
0 0 0
Procurement of Energy Only5 0 0 0
Procurement From Facilities That Exceeded Fossil Fuel Usage Limit6
0 0 0
Procurement Claimed Before the Facilityʹs Beginning‐On Date7
0 0 0
Procurement with Insufficient Energy Delivery8 0 0 0
Total Disallowances 0 0 0
Pending Allowances
Procurement With Outstanding Issues Regarding Electricity Delivery Verification9
0 0 0
Procurement With Outstanding Issues Regarding Biomethane Gas Delivery Verification10
0 0 0
Total Pending Allowances 0 0 0
Procurement Eligible Toward the RPS12 98,165,000 307,132,000 923,102,000Source: Noble Americans Energy Solutions 2008-2010 CEC-RPS Track, WREGIS Compliance Reports, and supporting documentation.
Noble had a 2010 procurement claim from Pastoria Energy Facility (Pastoria), a facility that uses biomethane. Energy Commission staff reported the Pastoria claim as a pending claim at the 2008 – 2010 RPS Procurement Verification Workshop, in which Energy Commission staff presented the initial verification findings and discussed outstanding issues. However, after thorough review of documentation detailing the pipeline path and biomethane delivery amounts, staff determined Noble’s 2010 procurement claim from Pastoria to be RPS‐eligible, and it is no longer listed as pending.
Noble also updated its Total RPS Procurement Claimed amounts for 2007 to add procurement not reported during the 2007 RPS procurement verification process. Noble submitted a revised 2007 CEC‐RPS‐Track form with the additional procurement claim, as well as a copy of the contract for the procurement to confirm that the contract date and generation term of the procurement were in 2007, thus making the procurement eligible to be claimed for 2007. Details

59
of the procurement claim and Direct Energy’s updated 2007 Procurement Eligible for the RPS can be found in Tables 18 and Tables 22 and 23 in the section Revisions to Previous Years’ Procurement Claims.
Pilot Power Group Table 19 summarizes Pilot Power’s 2008 – 2010 procurement eligible to count toward the RPS.
Table 19: Pilot Power Summary of RPS Procurement (kWh)
2008 2009 2010 Total RPS Procurement Claimed1 47,642,900 90,546,000 137,128,000
Disallowances
Procurement From Facilities Without RPS‐Certification2
0 0 0
Procurement From Facilities in Which Procurement Claims Exceed Generation by 5
0 0 0
Procurement From Distributed Generation Facilities4
0 0 0
Procurement of Energy Only5 0 0 0
Procurement From Facilities That Exceeded Fossil Fuel Usage Limit6
0 0 0
Procurement Claimed Before the Facilityʹs Beginning‐On Date7
0 0 0
Procurement with Insufficient Energy Delivery8 0 0 0
Total Disallowances 0 0 0
Pending Allowances
Procurement With Outstanding Issues Regarding Electricity Delivery Verification9
0 0 0
Procurement With Outstanding Issues Regarding Biomethane Gas Delivery Verification10
0 0 0
Total Pending Allowances 0 0 0
Withdrawn Procurement Claims11
Procurement Amount Requested to be Withdrawn from LSEʹs RPS Filing via Letter. Hopkins Ridge Wind Project, RPS ID 60745 Procurement Claimed Before the Contract Execution Date – to Be Credited to Pilot in a future Verification Report
0 43,000,000 0
Total Withdrawn Procurement 0 43,000,000 0 Procurement Eligible Toward the RPS12 47,642,900 47,546,000 137,128,000
Source: Pilot Power’s 2008-2010 CEC-RPS Track, WREGIS Compliance Reports, and supporting documentation.
Pilot had a 2009 procurement claim from the out‐of‐state facility Hopkins Ridge Wind Project, RPS ID 60745. In verifying that the energy delivery requirements met the Third Edition of the

60
RPS Eligibility Guidebook, staff discovered that the contract execution date of this procurement claim occurred in 2011. Energy Commission staff determined that this claim was ineligible for RPS procurement in 2009. Pilot Power requested that the procurement be counted as “withdrawn” instead of “disallowed” because the claim was made through WREGIS and the certificates could not be unretired. Although the claim is not eligible for 2009, it may be eligible to be claimed for reporting year 2011 or later (within the CPUC’s 36 month retirement requirement). Upon request from Pilot, Energy Commission staff will add the withdrawn amount into a future RPS Verification Report.
Pilot also had a 2010 procurement claim from Pastoria Energy Facility, a facility that uses biomethane as discussed in detail in Chapter 3: Verification Issues, Verification Requirements for Biomethane Claims. Pilot’s claim from Pastoria was initially reported as a pending claim in the 2008 – 2010 RPS Procurement Verification Workshop. After thorough review of documentation detailing the pipeline path and biomethane delivery amounts, staff determined Pilot’s 2010 procurement claim from Pastoria Energy Facility to be RPS‐eligible, so it is no longer listed as pending.
Praxair Plainfield Inc. Table 20 summarizes Praxair’s 2008 procurement eligible to count toward the RPS.
Table 20: Praxair Plainfield Summary of RPS Procurement (kWh)
2008Total RPS Procurement Claimed1 3,700,000 Disallowances Procurement From Facilities Without RPS‐Certification2 0 Procurement From Facilities in Which Procurement Claims Exceed Generation by 5 Percent or Greater3
0
Procurement From Distributed Generation Facilities4 0 Procurement of Energy Only5 0 Procurement From Facilities That Exceeded Fossil Fuel Usage Limit6 0 Procurement Claimed Before the Facilityʹs Beginning‐On Date7 0 Procurement with Insufficient Energy Delivery8 0 Total Disallowances 0 Pending Allowances Procurement With Outstanding Issues Regarding Electricity Delivery Verification9 0 Procurement With Outstanding Issues Regarding Biomethane Gas Delivery Verification10
0
Total Pending Allowances 0 Procurement Eligible Toward the RPS12 3,700,000
Source: Praxair Plainfield Inc. 2008-2010 CEC-RPS Track, WREGIS Compliance Reports, and supporting documentation.
Shell Energy North America Table 21 summarizes Shell’s 2008 – 2010 procurement eligible to count toward the RPS.
Table 21: Shell Energy Summary of RPS Procurement (kWh)
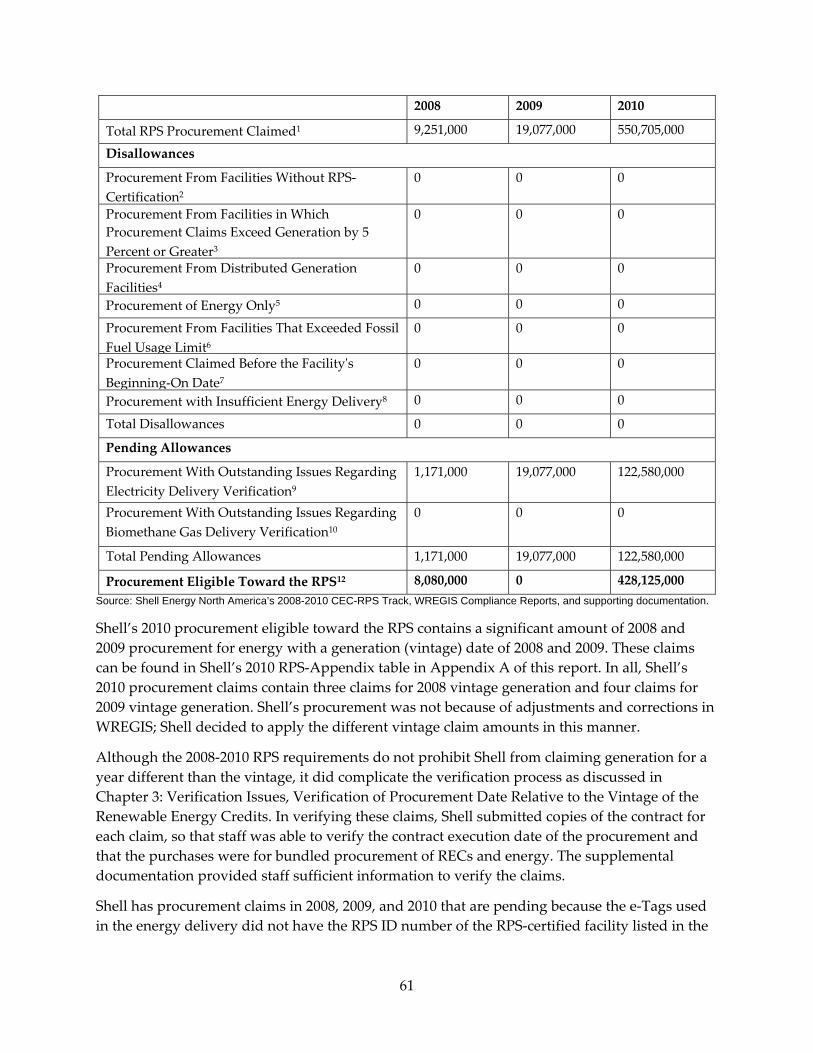
61
2008 2009 2010
Total RPS Procurement Claimed1 9,251,000 19,077,000 550,705,000
Disallowances
Procurement From Facilities Without RPS‐Certification2
0 0 0
Procurement From Facilities in Which Procurement Claims Exceed Generation by 5 Percent or Greater3
0 0 0
Procurement From Distributed Generation Facilities4
0 0 0
Procurement of Energy Only5 0 0 0
Procurement From Facilities That Exceeded Fossil Fuel Usage Limit6
0 0 0
Procurement Claimed Before the Facilityʹs Beginning‐On Date7
0 0 0
Procurement with Insufficient Energy Delivery8 0 0 0
Total Disallowances 0 0 0
Pending Allowances
Procurement With Outstanding Issues Regarding Electricity Delivery Verification9
1,171,000 19,077,000 122,580,000
Procurement With Outstanding Issues Regarding Biomethane Gas Delivery Verification10
0 0 0
Total Pending Allowances 1,171,000 19,077,000 122,580,000
Procurement Eligible Toward the RPS12 8,080,000 0 428,125,000Source: Shell Energy North America’s 2008-2010 CEC-RPS Track, WREGIS Compliance Reports, and supporting documentation.
Shell’s 2010 procurement eligible toward the RPS contains a significant amount of 2008 and 2009 procurement for energy with a generation (vintage) date of 2008 and 2009. These claims can be found in Shell’s 2010 RPS‐Appendix table in Appendix A of this report. In all, Shell’s 2010 procurement claims contain three claims for 2008 vintage generation and four claims for 2009 vintage generation. Shell’s procurement was not because of adjustments and corrections in WREGIS; Shell decided to apply the different vintage claim amounts in this manner.
Although the 2008‐2010 RPS requirements do not prohibit Shell from claiming generation for a year different than the vintage, it did complicate the verification process as discussed in Chapter 3: Verification Issues, Verification of Procurement Date Relative to the Vintage of the Renewable Energy Credits. In verifying these claims, Shell submitted copies of the contract for each claim, so that staff was able to verify the contract execution date of the procurement and that the purchases were for bundled procurement of RECs and energy. The supplemental documentation provided staff sufficient information to verify the claims.
Shell has procurement claims in 2008, 2009, and 2010 that are pending because the e‐Tags used in the energy delivery did not have the RPS ID number of the RPS‐certified facility listed in the

62
Miscellaneous field of the e‐Tags, as required by the RPS Eligibility Guidebooks, Third and Fourth Editions.
As discussed in Chapter 3: Verification Issues, Shell submitted a list of the e‐Tags to show energy delivery into California, along with the CEC‐RPS‐Delivery form and the signed attestation. If the Energy Commission votes to accept the recommendation to accept the pending claims as eligible, the final version of this 2008‐2010 Verification Report will remove Shell’s pending claim amount and include it as part of the eligible RPS procurement claim amount.
Revisions to Previous Years’ Procurement Claims During the verification process, two retail sellers, Noble and SCE, contacted Energy Commission staff to request that updates be made to their earlier year procurement claims amounts. Both Noble and SCE revised their previous years’ RPS‐Track forms to make the requested updates. Because these changes affect procurement claims from previously reported years, staff is including tables showing the changes to the data for previous years. Furthermore, Noble and SCE should adjust these values in their closing reports filed with the CPUC pursuant to D.12‐06‐038 to account for these changes.
Southern California Edison Company As mentioned above, SCE removed ineligible procurement from its Section 7 Trust (RPS ID 60389) claims that was found to be onsite generation, which did not meet the WERGIS and Energy Commission eligibility requirements. This issue also affected SCE’s 2001 and 2003 – 2007 Section 7 Trust claims, and as a result, SCE revised its 2001 and 2003 – 2007 CEC‐RPS‐Track forms to remove the ineligible generation.
Moreover, SCE informed staff that since it is updating its 2001 and 2003 – 2007 CEC‐RPS‐Track forms to remove the ineligible Section 7 Trust generation, it will also remove the procurement claims that were counted as ineligible in the 2006 and 2007 Verification Reports. These claims include the 2003 – 2007 ineligible procurement from the Mountain View I and II facilities, the 2007 ineligible procurement from Colmac Energy Mecca, and the 2007 ineligible procurement from Geo East Mesa (GEM). SCE also updated the certifications of Ormesa Geothermal I and Ormesa Geothermal II to correct the nameplate capacities of each, and as a result, SCE also updated the 2007 procurement claims from these facilities to reflect the name plate capacity corrections. In the tables below, Table 22 lists SCE’s updated procurement claims by year for each of these facilities, and Table 23 lists SCE’s initial and updated RPS Procurement amounts as eligible to count toward SCE’s APT. SCE should adjust the values in its closing report filed with the CPUC to account for these changes.

63
Table 22: Southern California Edison’s Updated RPS Procurement Claims by Year (kWh)
Facility Name RPS ID number Fuel Type 2001 2003 2004 2005 2006 2007
Section 7 Trust 60398 Wind 81,282,701 61,632,866 57,086,529 61,664,796 59,274,021 60,337,845
Mountain View I 60284 Wind N/A 0 0 0 0 0
Mountain View II 60285 Wind N/A N/A 0 0 0 0
Colmac Energy Mecca Plant 60286 Biomass N/A N/A N/A N/A N/A 316,323,580
Ormesa Geothermal I 60311 Geothermal N/A N/A N/A N/A N/A 2,224,484,678
Ormesa Geothermal II 60312 Geothermal N/A N/A N/A N/A N/A 85,730,358
GEM N/A N/A N/A N/A N/A 0 Source: RPS staff analysis of SCE’s 2001 and 2003-2007 CEC-RPS-Track Forms.
Table 23: Southern California Edison's Updated 2001 and 2003-2007 RPS-Eligible Procurement
2001 2003 2004 2005 2006 2007
Total RPS Procurement Claimed as Reported in 2006 and 2007 RPS Procurement Verification Reports
11,129,330,344 12,615,019,955 13,375,487,396 13,041,778,881 12,707,592,146
Procurement Eligible Toward the APT as Reported in 2006 and 2007 RPS Procurement Verification Reports
11,129,330,344 12,421,140,554 13,182,062,223 12,822,188,624 12,485,998,397 12,211,145,024
Updated Total RPS Procurement Claimed 11,129,295,651 12,421,136,541 13,182,058,213 12,821,920,025 12,485,993,807 12,211,134,722
Updated Procurement Eligible Toward the RPS
11,129,295,651 12,421,136,541 13,182,058,213 12,821,920,025 12,485,993,807 12,211,134,722
Source: RPS staff analysis of SCE’s 2001 and 2003-2007 CEC-RPS-Track Forms.

64
Noble Americas Energy Solutions While submitting supporting documentation during the 2008 – 2010 RPS verification process, Noble informed staff that it recently became aware of 2007 procurement from Calpine Geothermal Units 5 & 6 that it did not report on its 2007 RPS Track form and requested that staff accept the additional 2007 RPS procurement claim. To support the claim, Noble submitted a copy of the purchase contract. Staff reviewed the contract and included the procurement amount in with other 2007 procurement claims from Calpine Geothermal Units 5 & 6 to compare with the facility’s generation data and determined that the additional procurement did not cause an overclaim. After reviewing the documentation, staff determined that the procurement claim is eligible for the RPS. Noble submitted a revised 2007 CEC‐RPS‐Track form with the claim added in. Table 24 lists Noble’s initial 2007 RPS procurement amount claimed, the additional procurement claim, Noble’s updated 2007 RPS procurement amount claimed, and updated procurement eligible toward the APT. Noble should adjust the values in its closing report filed with the CPUC pursuant to D. 12‐06‐038 to account for this change.
Table 24: Noble Americas Energy Solution’s Updated 2007 RPS-Eligible Procurement
2007
Total RPS Procurement Claimed as reported in 2006 and 2007 RPS Procurement Verification Reports 180,084,068
Calpine Geothermal Unit 5/6 (RPS ID 60002) procurement claim 18,600,000
Updated Total RPS Procurement Claimed 198,684,068
Updated Procurement Eligible Toward the RPS 198,684,068 Source: RPS staff analysis of Noble Americas Energy Solution’s 2007 CEC-RPS-Track Forms, and supplemental documentation.

65
CHAPTER 6: Verification Analysis Energy Commission staff verifies the accuracy of RPS procurement claims with generation data reported to various programs within the Energy Commission and/or to the U.S. Energy Information Administration (EIA). This chapter analyzes the RPS procurement claim data to demonstrate RPS‐eligible procurement by resource type, including a chart specific to the use of various RPS‐eligible biofuels. The subsections also include information on the amount of 2008‐2010 RPS claims from new and repowered RPS‐certified facilities and the dramatic reduction in ITS reporting from 2008‐2010.
RPS-Eligible Procurement by Resource Type Increasing the diversity of California’s energy mix is an important goal of the RPS program.61 For those interested in which technologies are being used to meet the RPS, Table 25 below presents the amounts of renewable by year for each fuel type.62
A list of RPS‐eligible resource categories can be found on page 14 in the RPS Eligibility Guidebook, Fourth Edition. The majority of these resources are listed in Table 25 below. Other RPS‐eligible resources not listed in Table 25 include biodiesel, Municipal Solid Waste conversion, ocean wave, ocean thermal, and tidal current. There were no procurement claims using these resource types during 2008‐2010. Table 25 lists 2008‐2010 resource types as procured by the retail sellers. The ESP and CCA amounts have been aggregated for ease of viewing.
Staff’s data analysis demonstrates a diverse renewable resource mix used to satisfy retail sellers’ RPS requirements over the years. Proportionally, the total amounts by fuel type have remained fairly consistent, with geothermal remaining the largest renewable fuel type used in each year. Wind went from making up 20 percent of the renewable fuel mix in 2008 to 34 percent of the renewable fuel mix by 2010.
61 Public Utilities Code section 399.11.
62 For 2001 and 2003‐2004 see the 2006 RPS Procurement Verification Report. For years 2005‐2007 see the 2007 RPS Procurement Verification Report.

66
Table 25: 2008-2010 RPS-Eligible Procurement by Resource Type (MWh63)
PG&E SCE SDG&E PacifiCorp Sierra Pacific
ESPs and CCA64
Total65
Biomass 2,830,676 364,741 318,941 2,426 6,543 33,818 3,557,146Biomethane 739 0 0 0 0 0 739Conduit Hydro 60,782 115,624 30,883 7,957 3,625 17,824 236,695Digester Gas 4,518 1,366 12,917 0 0 0 18,800Geothermal 3,337,612 7,674,125 0 4,461 71,650 136,227 11,224,075Landfill Gas 141,227 539,942 195,318 0 0 67,923 944,410MSW, Combustion 119,449 0 0 0 0 0 119,449Photovoltaic 445 438 0 0 0 0 883Small Hydroelectric 1,882,835 411,759 0 31,025 0 60,253 2,385,871Solar Thermal 0 730,258 0 0 3,867 0 734,125Wind 1,421,555 2,545,243 489,368 20,157 0 181,384 4,657,7072008 Total 9,799,837 12,383,496 1,047,428 66,026 85,685 497,429 23,879,900Biomass 3,128,907 408,584 341,361 2,843 0 13,835 3,895,530Biomethane 50,344 0 0 0 0 0 50,344 Conduit Hydro 33,000 80,105 24,439 7,064 0 21,677 166,285 Digester Gas 3,774 1,390 13,516 0 0 0 18,680 Geothermal 3,410,602 7,625,051 0 4,850 117,346 431,479 11,589,328 Landfill Gas 135,720 492,553 191,505 0 0 65,189 884,967 MSW, Combustion 132,644 0 0 0 0 0 132,644 Photovoltaic 22,201 5,412 809 0 0 0 28,422 Small Hydroelectric 2,011,469 484,673 0 34,698 0 225,701 2,756,541 Solar Thermal 0 839,799 0 0 0 0 839,799 Wind 2,555,689 3,528,288 1,526,667 41,860 0 1,398,607 9,051,111 2009 Total 11,484,350 13,465,856 2,098,297 91,315 117,346 2,156,488 29,413,651Biomass 2,996,126 437,158 339,899 3,154 0 42,923 3,819,260Biomethane 31,605 0 0 0 0 21,462 53,067 Conduit Hydro 34,678 94,980 22,367 5,898 0 22,986 180,909 Digester Gas 4,264 1,470 21,986 0 0 0 27,720 Geothermal 3,764,967 7,587,817 183,000 4,639 99,499 197,481 11,837,403 Landfill Gas 131,749 513,999 188,081 0 0 121,101 954,930 MSW, Combustion 123,090 0 0 0 0 0 123,090 Photovoltaic 62,979 54,475 1,577 0 0 0 119,031 Small Hydro 2,222,752 601,328 0 48,820 0 184,994 3,057,894 Solar Thermal 0 879,080 0 0 0 0 879,080 Wind 2,962,939 4,253,386 1,472,280 61,489 0 1,899,555 10,649,649 2010 Total 12,335,150 14,423,693 2,229,190 124,000 99,499 2,490,502 31,702,034
Source: RPS staff analysis of 2008-2010 CEC-RPS-Track Forms and WREGIS Reports.
63 Amounts converted from kWh to MWh. Rounding may result in total amounts listed differing slightly from the total procurement eligible toward the RPS in retail sellers’ Summary of RPS Procurement table.
64 Aggregated ESPs and CCA procurement claims for 2008, 2009, and 2010.
66 For purposes of the RPS‐Eligible Procurement by Resource Type analysis, generation that was claimed in a year other than the year it was generated is included with the resource type for the year generated not the year claimed.

67
Figure 3: Annual Procurement by Fuel Type for 2008 to 2010
Source: RPS staff analysis of 2008-2010 CEC-RPS-Track Forms and WREGIS Reports.
While there was much focus on the use of biomethane for purposes of the RPS, it made up only 0.11 percent of the total 2008‐2010 renewable resource mix. The pie chart below lists the retail sellers’ aggregated procurement from each resiurce type.
Figure 4: Total Procurement for Entire Compliance Period (2008 to 2010) by Fuel Type
Source: RPS staff analysis of 2008-2010 CEC-RPS-Track Forms and WREGIS Reports

68
New and Repowered Facilities Beginning on January 1, 2007, amendments to Public Resources Code sections 25741 and 25743 by SB 107 changed the definition of new and repowered renewable facilities to require an initial operation of repowering date of January 1, 2005, from the previous initial operation of repowering date of January 1, 2002.
Based on the information submitted using the CEC‐RPS‐Track and WREGIS Compliance reporting forms for procurement of generation that staff determined to be RPS‐eligible (including claims listed in this draft report as pending), the table below shows the amount of new and repowered renewable procurement. This table shows 2008‐2010 procurement from new and repowered facilities. New and repowered RPS procurement increased significantly each year.
Table 26: New and Repowered RPS Procurement
Utility 2008 Procurement (MWh)
2009 Procurement (MWh)
2010 Procurement (MWh)
3Phases Energy Services 10,188 10,098 0
Calpine Power America 0 14,945 49,547
Commerce Energy 0 372 74,200
Constellation NewEnergy, Inc. 127,945 982,534 531,193
Direct Energy 84,877 298,060 144,287
Marin Energy Authority 0 0 19,265
Noble Americas 8,179 9,264 780,578
Pilot Power 0 0 27,891
Praxair Plainfield 20 0 0
Shell Energy 6,079 19,077 389,298
PacifiCorp 17,451 40,062 59,787
Sierra Pacific Power Company 31,914 48,035 41,556
PG&E 696,603 2,289,296 2,815,414
SCE 980,151 1,718,565 2,428,351
SDG&E 250,710 980,583 1,049,798
Total 2,214,117 6,410,891 8,411,164
Amounts have been converted from kWh to MWh for ease of reading As a result of rounding, the total amounts listed in this table may differ slightly from the total procurement eligible toward the RPS listed in the retail sellers’ Summary of RPS Procurement table..
Source: RPS staff analysis of 2008-2010 CEC-RPS-Track Forms and WREGIS Reports.

69
Figure 5: Chart Showing the Amount of Generation (MWh) Procured From New and Repowered Facilities for Each Year From 2008 to 2010.
Source: RPS staff analysis of 2008-2010 CEC-RPS-Track Forms and WREGIS Reports.
Transitioning From Interim Tracking System to the Western Renewable Energy Generation Information System As discussed throughout this Verification Report, there were two reporting systems: the transitional ITS and WREGIS. The years covered in this report represent the transitional period from the ITS to WREGIS for retail sellers. By 2010 nearly all claims were reported using WREGIS; a few minor exceptions allowed retail sellers to report using the ITS, but documentation was required to demonstrate that the generation was not available using WREGIS. The use of the ITS for reporting amounts to less than 0.2 percent of all reported procurement by 2010.
Figure 6: Usage of Each Reporting System as a Percentage of Total Procurement
Source: RPS staff analysis of 2008-2010 CEC-RPS-Track Forms and WREGIS Reports.

70
Renewable Energy Certificate Vintage and Retirement Date During the verification of the 2008‐2010 RPS procurement data, staff checked the time between the vintage date, which is the month and year in which the generation occurred, and the retirement date, which is the month and year each batch of WREGIS certificates is retired. This analysis is simplified with the use of WREGIS because both dates are reported for each batch of WREGIS certificates in the WREGIS Compliance Report.
Table 27 below shows the batches of WREGIS certificates in which the date of retirement exceeded the allowable time frame.66 Each quantity listed in the tables represents a portion of the retail seller’s claim from the facility. The CPUC is responsible for compliance determinations, which include application of any applicable REC retirement rules.
Table 27: WREGIS Claims That Exceeded REC Retirement Requirement Limits
Year Retail Seller Generator Name
WREGIS
ID RPS ID
WREGIS Certificate Quantity (MWh)
Vintage Year/Month
Retirement Action Date
2010 Southern California Edison
Borel ‐ Unit 3 W554 60450 1,239 5/1/2008 6/1/2011
2009 Commerce Energy, Inc.
Calistoga Power Plant
W486 60117 6,144 2/1/2009 6/21/2012
2009 Commerce Energy, Inc.
Calistoga Power Plant
W486 60117 1,440 4/1/2009 6/21/2012
2009 Southern California Edison
Kern River 1 W330 60455 3,151 8/1/2009 8/1/2012
Source: RPS staff analysis of Commerce Energy’s and Southern California Edison’s 2008 and 2008-2010 RPS Updates WREGIS Compliance Reports.
Staff did this same retirement date check for claims reported on the CEC‐RPS‐Track form. Because the CEC‐RPS‐Track form does not report a separate retirement date for each monthly claim, staff used the date that the CEC‐RPS‐Track form attestation was signed as the retirement date for all the monthly claims reported on the form. Staff considers the attestation date the “worst case scenario” for purposes of reporting REC retirement, since REC retirement can be no later than the date of the report identifying such retirement. All 2008 CEC‐RPS‐Track form
66 The CPUC set a limit on the amount of time a REC may be traded before being retired for RPS compliance. See Decisions (D.)10‐03‐021, Section 4.9.1, Ordering Paragraph 10, D.11‐01‐025, Ordering Paragraph 10, and D.12‐06‐038, Ordering Paragraph 23. For 2008 vintage RECs, the retirement date was extended from December 31, 2010, to February 28, 2011 (by the CPUC’s Executive Director letter, dated February 18, 2011).

71
attestations had signature dates of February 28, 2011 or earlier, with the exception of PacifiCorp’s 2008 CEC‐RPS‐Track form, which had an attestation date of March 18, 2011.
However, the circumstances surrounding the submission of PacifiCorp’s 2008 CEC‐RPS‐Track form justify special treatment. On January 27, 2011, in advance of the February 28, 2011 reporting due date for 2008 RPS procurement reports, PacifiCorp requested that Energy Commission staff grant an extension for reporting using the 2008 CEC‐RPS‐Track reporting form. At that time, there was an outstanding eligibility issue with PacifiCorp’s procurement claims from the Hills Air Force Base facility. Energy Commission staff agreed to this time extension request to allow PacifiCorp to remove claims from this facility, which were ultimately determined to be ineligible. This extension enabled PacifiCorp to remove Hills Air Force Base facility claims from its 2008 CEC‐RPS‐Track form and avoid having to revise and resubmit its 2008 CEC‐RPS‐Track forms after the claim was ultimately determined in eligible.
The issue with PacifiCorp’s RPS procurement claims from Hills Air Force Base is discussed in detail in the 2007 Verification Report. Due to this pending eligibility issue at the time, Energy Commission staff accepted PacifiCorp’s request for an extension until Energy Commission staff made a final determination regarding the eligibility of the Hills Air Force Base procurement. Further, PacifiCorp submitted its 2008 WREGIS report on January 28, 2011 well before the February 28, 2011 due date. And, if not for approval from Energy Commission staff to delay reporting using the 2008 CEC‐RPS‐Track form, PacifiCorp would have submitted the 2008 CEC‐RPS‐Track form in accordance with the reporting due date. This reporting delay was a mutually agreed upon approach for more efficient reporting and verification. Energy Commission staff recommends that the Energy Commission, in this particular case, determine that PacifiCorp’s 2008 CEC‐RPS‐Track form was effectively submitted on January 27, 2011 for purposes of determining the REC retirement date. Using this date is consistent with PacifiCorp’s intention to report its 2008 RPS procurement accurately and in a timely manner.
If the “worst case scenario” approach is used for PacifiCorp, several claims reported in its 2008 CEC‐RPS‐Track form would be disallowed, because the attestation date on this form is March 18, 2011, and exceeds the CPUC’s February 28, 2011 retirement date for 2008 vintage RECs. Claims reported on PacifiCorp’s CEC‐RPS‐Track form include RECs with vintage dates of January, February, and March 2008. Energy Commission staff recommend that January 27, 2011, the date that PacifiCorp requested an extension for reporting 2008 data be considered PacifiCorp’s retirement date.

72
CHAPTER 7: Verification Limitations and Future Efforts This chapter describes limitations associated with the Interim Tracking System and describes how future verification efforts will change as a result of SB X1‐2.
Limitations of the Interim Tracking System This report presents Energy Commission staff’s verified RPS procurement data results; however, some limitations should be noted.
The Interim Tracking System restricts the extent to which the Energy Commission staff can cross‐reference California RPS procurement with other specific purchases. As discussed in Chapter 2, Energy Commission staff coordinates with staff from energy agencies in Washington, Oregon, and Nevada to cross‐reference California RPS procurement with retail claims made in these states. Coordination with Oregon and Washington has focused largely on an energy information tracking system that was funded by a U.S. Department of Energy grant.
This interstate tracking system was developed to support administration of the Power Source Disclosure Program by enabling participating states to determine if generation was claimed in more than one of these states. Energy Commission staff was able to obtain energy procurement data for 2007 produced by this tracking system; however, the state of Washington is no longer able to operate the tracking system. Starting with the 2008 compliance year, Energy Commission staff will be primarily using WREGIS to track generation and procurement and will no longer rely on the tracking system mentioned above. However, Energy Commission staff continues to coordinate with staff from Oregon and Washington, where possible.
Staff also collaborated with the Public Utilities Commission of Nevada to confirm that procurement from the 18 facilities located in Nevada and being claimed for California RPS purposes did not exceed generation when Nevada procurement amounts were combined with California procurement amounts.
In addition, staff’s ability to protect against double‐counting is limited to the reporting requirements for each state and the availability of data from these states. With PacifiCorp and Sierra Pacific Power Company submitting procurement claims for this report and more procurement anticipated from out of state, coordination with other states is important for verification. Fortunately, staff anticipates concerns about double‐counting of RPS procurement claimed in California and in other states will be reduced with the switch from the Interim Tracking System to WREGIS.
Further, staff has limited information about specific purchases made in which RECs are sold separately from the associated electricity.67 “Unbundled” RECs were determined eligible for
67 RECs represent the “renewable” quality of electricity generated from a renewable facility. A REC is created when a specific amount of renewable energy is generated; 1 MWh of renewable energy represents

73
RPS compliance in California with the CPUC’s January 2011 T‐REC decision. 68,69 Energy Commission staff updated RPS Guidebooks to incorporate this decision, as well as to implement the RPS reporting and procurement requirements of SB X1‐2.
In other regulatory and nonregulatory markets, however, generators, marketers, or brokers may sell unbundled RECs as a separate commodity to individuals, companies, utilities, or other organizations. The Energy Commission does not track these voluntary transactions but collaborates with Green‐e Energy, one of the leading voluntary REC organizations.70 As a result of this collaboration, Energy Commission staff is able to cross‐check some, but not all, RPS procurement claims with unbundled RECs sold in the voluntary market, as Green‐e Energy does not certify the entire voluntary REC market.
The robustness of the ITS is also limited by the quality of the generation data. In most cases, the generation data used for this report are self‐reported and not independently verified by third parties. WREGIS helps address many of these data limitations because it tracks renewable energy transactions throughout the WECC (not just California, Nevada, Oregon, and Washington) and is supported in most cases by generation data from qualified reporting entities, rather than self‐reported generation data. For retail sellers, WREGIS will be used for RPS verification for years 2011 and forward. POUs will transition from the ITS to WREGIS for RPS claims not tracked in WREGIS before October 2012.
Another challenge with the ITS is the ability of staff to analyze energy delivery documentation when data is not available in WREGIS. Third parties providing energy delivery services to retail sellers are currently unable to match e‐Tag data with WREGIS Certificates. Until this problem is fixed in WREGIS, retail sellers may report using the CEC‐RPS‐Delivery form. Energy Commission staff audits information on the CEC‐RPS‐Delivery form by requesting randomly selected e‐Tags and, in some cases, the entire list of e‐tags associated with the energy delivery amounts. Because WREGIS prevents against the matching e‐Tags more than once, Energy Commission staff expects verification using e‐Tag data to be better streamlined once the WREGIS e‐Tag Summary reports are fully available in WREGIS.
Procurement Verification Staff developed an Access® database that allows for more accurate and efficient verification of RPS procurement claims. Using the database, if staff found a discrepancy in which the total annual procurement from a specific facility appeared to exceed total annual generation from
1 REC. The voluntary REC market is not regulated in California. RECs are also commonly referred to as “renewable attributes” and “green tags.”
68 Public Utilities Code Section 399.16, as enacted by SB 107, allows the CPUC to authorize the use of unbundled RECs once a tracking system is developed and other conditions are met.
69 See: D.11‐01‐025 http://docs.cpuc.ca.gov/word_pdf/FINAL_DECISION/129517.pdf
70 Green‐e Energy, a program of the Center for Resource Solutions, is an independent consumer protection program for the sale of renewable energy in the voluntary retail market. www.green‐e.org/.

74
that facility by 5 percent or greater, staff requested supporting information from the retail seller(s) making the procurement claim(s).
Following this approach, Energy Commission staff requested supporting information from the retail sellers and received supplemental information in all of these cases. In some cases, staff adjusted the procurement claims downward to match the invoices; in cases where the supporting data matched the procurement claim, the claims were accepted.
Conversely, Energy Commission staff’s comparison of generation and procurement found that in some cases the generation exceeded procurement claims by 5 percent or greater. In such cases, staff did not conduct further research to identify the source of the discrepancy, but rather was satisfied that the available generation data supported the specific purchase claim; the facility produced as much or more energy than was claimed by the retail seller for that year.
Possible explanations for generation discrepancies may include excess generation being sold to another utility, trader, or other entity. Also, the amount procured may reflect line losses such that more energy is generated than is delivered to the load. Furthermore, verifying procurement claims with generation data is especially difficult for wind facilities. For example, wind turbines within a group of turbines that collectively comprise a wind facility are sometimes sold to new parties. This sale leads to difficulties locating owners of facilities who could provide generation data and can result in variances in recordkeeping by the retail sellers and the facility owners. Some wind facilities report to the EIA differently than they report the generation to the retail sellers. In some cases, multiple facilities report under one EIA ID number. Further, for all technologies, the comparison of generation and procurement requires an element of professional judgment. For example, the retail seller may report a project by one name, but sources of generation data may identify a project by a different name. Energy Commission staff must be able to determine which facilities use multiple names by cross‐referencing various ID numbers.
While the Energy Commission recognizes the limitations of the ITS, it is important to recognize that this verification report reflects staff’s review of more than 2,300 RPS claims reported by retail sellers and checked against entities with RPS claims in other states and entities participating in the voluntary REC market for 2008‐2010. The method and results have benefited from public input, and staff believes they are as accurate as possible at this time.
Upon notice of availability of this verification report, reporting retail sellers must submit Verified Compliance Reports to the CPUC within 30 days.
For information regarding retail sellers’ official RPS progress and status, interested parties should refer to the CPUC’s website.71
71 http://www.cpuc.ca.gov/PUC/energy/Renewables/index.htm

75
Long-Term Verification The RPS Eligibility Guidebook, Seventh Edition,72 clarifies the RPS reporting requirements for retail sellers and POUs starting in 2011. For retail sellers, the RECs retired for the 2011 reporting year73 must be reported to the Energy Commission within 90 days after the adoption of this guidebook, and RECs reported for 2012 must be reported within 120 days after the adoption of the guidebook For 2013 forward, the due date for reporting RECs retired for the previous year is July 1 of the following year.
POUs must report RECs claimed for the 2011 and 2012 reporting years and all other required information (as described in the Energy Commission’s regulations establishing Enforcement Procedures for the Renewables Portfolio Standard for Local Publicly Owned Electric Utilities)74 by 30 calendar days after the effective date of these POU regulations. The regulations take effect on October 1, 2013, so POU reports are due October 31, 2013. For 2013 and thereafter, RPS procurement retired for the previous reporting year must be reported by July 1 of the following year.
Because e‐Tag data are necessary to determine RPS compliance with the portfolio content categories,75 beginning with the 2011 reporting year Energy Commission staff will review e‐Tag data for POUs, while CPUC staff will review e‐Tag data for retail sellers. RPS verification reports for retail sellers will continue to verify the amount of eligible claims made from RPS‐certified facilities but will not address portfolio content categories or specific procurement requirements. The CPUC will use the Energy Commission’s Verification Report to determine
72 See http://www.energy.ca.gov/2013publications/CEC‐300‐2013‐005/CEC‐300‐2013‐005‐ED7‐CMF.pdf Section V. Reporting Tracking Systems, Reporting and Verification.
73 The RPS Eligibility Guidebook, Seventh Edition, (see link above, p.125) provides the following definition for the term “reporting year:” “Reporting Year — refers to a particular year within a compliance period for which the annual generation has already occurred and for which the RECs are being retired and used for RPS compliance. The reporting year is not the year in which the retired RECs are reported; it is the year for which the retired RECs are reported and, on an annual basis, represents the calendar year preceding the July 1 reporting due date.”
74 The Energy Commission’s adopted POU Regulations are codified in Title 20 of the California Code of Regulations sections 1240, and 3200‐3208. These regulations are posted at this link: http://www.energy.ca.gov/portfolio/pou_rulemaking/documents/
75 The RPS Eligibility Guidebook, Seventh Edition, provides the following explanation for PCC 1 e‐Tag data: “RPS‐certified facilities with generation scheduled into a CBA may use another source to provide the real‐time ancillary services required to maintain an hourly or subhourly import schedule into a CBA, but only the fraction of the schedule actually generated by the RPS facility may count toward PCC 1. The final schedule amount as indicated on an e‐Tag may be larger than the actual generation amount from the facility; however, only the amount actually generated by the facility and scheduled into a CBA may be classified as PCC 1 in accordance with the Enforcement Procedures for the RPS for POUs.” (pg. 102).For PCC2, contractual information along with e‐Tag data is used to demonstrate incremental electricity used to firm and shape RECs. (pgs.107‐108).

76
retail sellers’ RPS compliance. The Energy Commission will determine RPS compliance for the POUs, which will include analyzing e‐Tag data related to the portfolio content categories. Energy Commission staff will produce a separate RPS Verification and Compliance Report for POUs. If, in conjunction with the preparation of this report, Energy Commission staff determines a POU has failed to comply with an RPS requirement, staff will recommend that a complaint be filed against the POU in accordance with the Enforcement Procedures for the RPS for POUs.76
Because of the technical complexity of SB X1‐2, the Energy Commission has made interim improvements to its current database system, which will assist staff with 2011 and future RPS data analyses while steps are being taken to develop a more robust, streamlined, and user‐friendly RPS certification and verification/compliance database for RPS data analysis well into the future.
Outlook for Future Reports The Energy Commission intends to verify RPS procurement claims for each retail seller and POU annually for each year of a multiyear compliance period. This process will begin with an Energy Commission staff analysis of annual procurement data as submitted by the retail seller or POU for the preceding reporting year.
The Energy Commission will verify whether procurement is consistent with the requirements of the current edition of the RPS Guidebook and other applicable RPS Guidebooks and, for POUs only, consistent with the Energy Commission’s regulations for Enforcement Procedures for the RPS for POUs.
Staff will work with each retail seller and POU to verify the reported procurement claims and conduct an annual public workshop to present staff findings and discuss outstanding issues. It is yet to be determined if the workshop will combine the findings for both retail sellers and POUs, or if there will be two workshops, one for retail sellers and one for POUs. The Energy Commission plans to post the findings on its website.
Following the end of each compliance period, the Energy Commission staff will combine the verification results of the intervening years with those for the final year of the compliance period and prepare RPS verification reports summarizing the results. Because reporting for 2011 and 2012 was delayed, Energy Commission staff may initially combine the verification results for multiple years in a single workshop, particularly if it will lead to overall efficiencies in processing and presenting the data.
The Energy Commission expects to prepare two RPS reports per compliance period, one for retail sellers, RPS Verification Report for Retail Sellers, and one for POUs, RPS Verification and Compliance Report for POUs.
76 Refer to section 1240 of the POU regulations.

77
Glossary AB — Assembly Bill − A Chaptered Bill that is part of the California Code that
originated in the California State Assembly. To become law, an assembly bill must win majority approval in both the California State Assembly and the California State Senate. If the bill requires an appropriation or takes effect immediately, then it require 54 votes in the California State Assembly and 27 votes in the California State Senate to be passed. If both houses approve a bill, it then goes to the Governor. The Governor has three choices. The Governor can sign the bill into law, allow it to become law without his or her signature, or veto it. A governorʹs veto can be overridden by a two thirds vote in both houses. Most bills go into effect on the first day of January of the next year. Urgency measures take effect immediately after they are signed or allowed to become law without signature.
APT — annual procurement target − A retail seller’s APT is the amount of renewable generation the retail seller must procure in that year. Generally an APT is calculated using the following equation:
For 2010 and beyond, all retail sellers have an APT of 20 percent.
CCA — community choice aggregator − As defined in Public Utilities Code Section 331.1, a community choice aggregator refers to any of the following entities, if that entity is not within the jurisdiction of a local publicly owned electric utility that provided electrical service as of January 1, 2003: any city, county, or city and county whose governing board elects to combine the loads of its residents, businesses, and municipal facilities in a communitywide electricity buyers’ program or any group of cities, counties, or cities and counties whose governing boards have elected to combine the loads of their programs, through the formation of a joint powers agency established under Chapter 5 (commencing with Section 6500) of Division 7 of Title 1 of the Government Code.
CPUC — California Public Utilities Commission − an agency that regulates privately owned public utilities California, including electric power, telecommunications, natural gas, and water companies. Energy Commission and the California Public Utilities Commission staff have been designated as having special status to work collaboratively and participate in confidential deliberations concerning decision‐making on the implementation of the Renewables Portfolio Standard.
DG — distributed generation − a small‐scale electricity generation facility that is interconnected to a distribution network and is generally 20 MW or smaller.
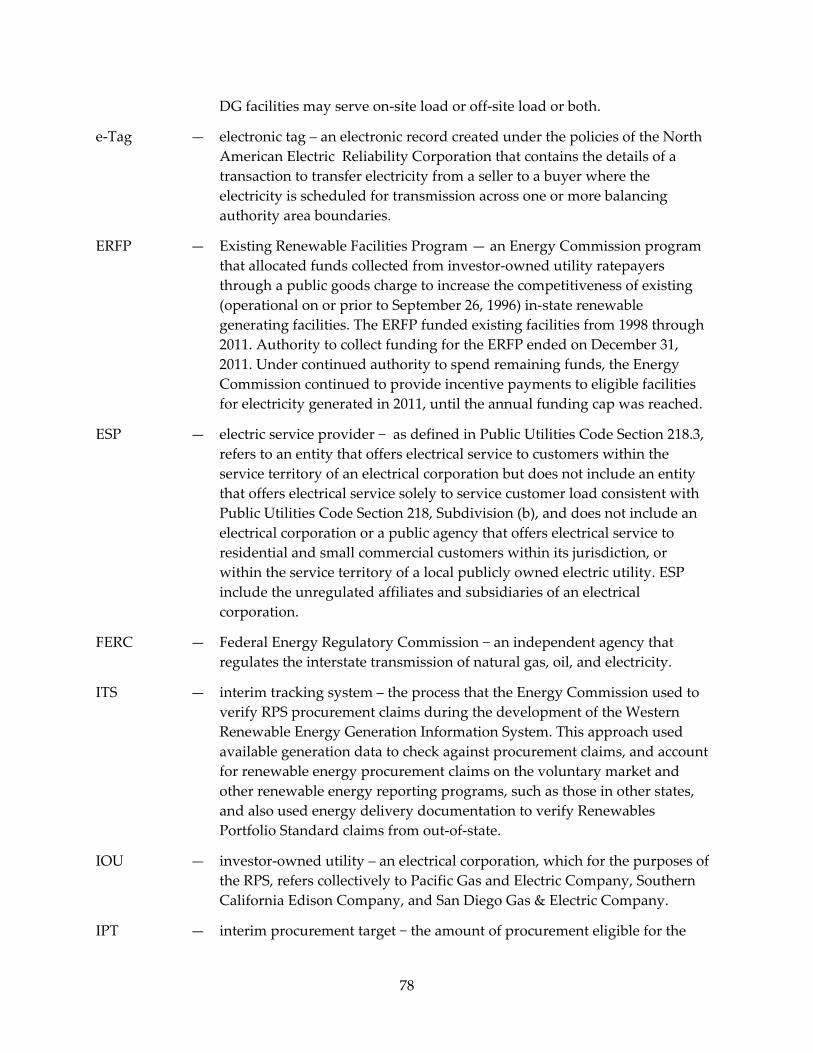
78
DG facilities may serve on‐site load or off‐site load or both.
e‐Tag — electronic tag – an electronic record created under the policies of the North American Electric Reliability Corporation that contains the details of a transaction to transfer electricity from a seller to a buyer where the electricity is scheduled for transmission across one or more balancing authority area boundaries.
ERFP — Existing Renewable Facilities Program — an Energy Commission program that allocated funds collected from investor‐owned utility ratepayers through a public goods charge to increase the competitiveness of existing (operational on or prior to September 26, 1996) in‐state renewable generating facilities. The ERFP funded existing facilities from 1998 through 2011. Authority to collect funding for the ERFP ended on December 31, 2011. Under continued authority to spend remaining funds, the Energy Commission continued to provide incentive payments to eligible facilities for electricity generated in 2011, until the annual funding cap was reached.
ESP — electric service provider − as defined in Public Utilities Code Section 218.3, refers to an entity that offers electrical service to customers within the service territory of an electrical corporation but does not include an entity that offers electrical service solely to service customer load consistent with Public Utilities Code Section 218, Subdivision (b), and does not include an electrical corporation or a public agency that offers electrical service to residential and small commercial customers within its jurisdiction, or within the service territory of a local publicly owned electric utility. ESP include the unregulated affiliates and subsidiaries of an electrical corporation.
FERC — Federal Energy Regulatory Commission − an independent agency that regulates the interstate transmission of natural gas, oil, and electricity.
ITS — interim tracking system – the process that the Energy Commission used to verify RPS procurement claims during the development of the Western Renewable Energy Generation Information System. This approach used available generation data to check against procurement claims, and account for renewable energy procurement claims on the voluntary market and other renewable energy reporting programs, such as those in other states, and also used energy delivery documentation to verify Renewables Portfolio Standard claims from out‐of‐state.
IOU — investor‐owned utility – an electrical corporation, which for the purposes of the RPS, refers collectively to Pacific Gas and Electric Company, Southern California Edison Company, and San Diego Gas & Electric Company.
IPT — interim procurement target − the amount of procurement eligible for the

79
Renewables Portfolio Standard that the retail seller must purchase, in a given year, above the total amount the retail seller was required to procure in the prior year. A retail seller’s IPT equals at least 1 percent of the previous year’s total electric retail sales, up to 2009.
kWh — kilowatt‐hour − the most commonly used unit of measure telling the amount of electricity consumed over time. It means one kilowatt of electricity supplied for one hour. A typical California household consumes about 500 kWh in an average month.
LSE — Load‐serving entity − an entity that provides electric service to end‐users and wholesale customers.
MJU — multijurisdictional utility − an electrical corporation with 60,000 or fewer customer accounts in California as of January 1, 2010, and that serves retail end‐use customers outside California, is located in a control area that is not under the control of a California balancing authority, receives the majority of its electrical requirements from generating facilities located outside California, and is subject to the provisions of Public Utilities Code Section 399.17. Sierra Pacific Power and PacifiCorp are the only MJU’s covered in this report.
MW — Megawatt − 1,000 kilowatts. One megawatt is about the amount of power required to meet the peak demand of a large hotel.
MWh — Megawatt hour − a unit of measure describing the amount of electricity consumed over time. It means 1 megawatt of electricity supplied for one hour. Two typical California households consume a combined total of about 1 MWh in an average month, one household consumes about 0.5 MWh.
NERC — North American Electric Reliability Corporation − a not‐for‐profit entity whose mission is to ensure the reliability of the Bulk‐Power System in North America, including the continental United States, Canada and the northern portion of Baja California, Mexico. NERC was responsible for the implementation of the e‐Tag system, but transferred responsibility for the e‐Tag system to the North American Energy Standards Board on October 27, 2009.
PG&E — Pacific Gas and Electric Company – a California IOU that operates in the northern two‐thirds of California. PG&E has reported renewable energy procurement to the Renewables Portfolio Standard program since 2001.
PSDP — Power Source Disclosure Program – a program implemented under Public Utilities Code Section 398.1, et seq., as enacted by Senate Bill 1305 (Sher, Chapter 796, Statutes of 1997), and the Energy Commission’s regulations as set forth in Title 20 of the California Code of Regulations, Sections 1390‐
80
1394. This law requires retail suppliers of electricity to disclose to consumers ʺaccurate, reliable and simple to understand information on the sources of energy that are (being) used...ʺ (Public Utilities Code Section 398.1[B]).
PURPA — Public Utilities Regulatory Policies Act – an act of Congress passed as part of the National Energy Act in 1978 to promote greater use of domestic renewable energy by requiring regulated electric utilities to buy power from other more efficient producers, if that cost was less than the utilityʹs own ʺavoided costʺ rate to the consumer. PURPA was amended in 2005 by the federal Energy Policy Act of 2005 by sections 1251 through 1254.
QF — Qualifying Small Power Production Facility – a facility eligible for certification under Section 292.207 of Title 18 of the Code of Federal Regulations.
REC — Renewable Energy Credit/Certificate – as defined in Public Utilities Code Section 399.12, Subdivision (h)(1), to mean a certificate of proof, issued through the accounting system established by the Energy Commission under Section 399.25, that one unit of electricity was generated and delivered by an eligible renewable energy resource. As specified in Section 399.12, Subdivision (h)(2), a REC includes all renewable and environmental attributes associated with the production of electricity from an eligible renewable energy resource, except for an emissions reduction credit issued pursuant to Section 40709 of the Health and Safety Code and any credits or payments associated with the reduction of solid waste and treatment benefits created by the use of biomass or biogas fuels. As specified in Section 399.12, Subdivision (h)(3), electricity generated by an eligible renewable energy resource attributable to the use of nonrenewable fuels, beyond a de minimis quantity, as determined by the Energy Commission, shall not result in the creation of a REC.
As defined by the CPUC in Decision D.08‐08‐028, a REC for compliance with the California Renewables Portfolio Standard is “a certificate of proof, issued through the Western Renewable Generation Information System [sic], that one megawatt‐hour of electricity was generated by an RPS‐eligible renewable energy resource and delivered for consumption by California end‐use retail customers. A REC includes all renewable and environmental attributes associated with the production of electricity from the eligible renewable energy resource, including any avoided emission of pollutants to the air, soil or water; any avoided emissions of carbon dioxide, methane, nitrous oxide, hydrofluorocarbons, perfluorocarbons, sulfur hexafluoride, or any other greenhouse gases that have been determined by the United Nations Intergovernmental Panel on Climate Change, or otherwise by law, to contribute to the actual or potential threat of global

81
climate change; and the reporting rights to these avoided emissions, such as Green Tag reporting rights. A REC does not include any emissions reduction credit issued pursuant to § 40709 of the Health and Safety Code or any credits or payments associated with the reduction of solid waste or treatment benefits created by the utilization of biomass or biogas fuels. A REC also does not include any energy, capacity, reliability or other power attributes of the generation; any tax credits or other financial incentives in the form of credits, reductions, or allowances associated with the generation that are applicable to a state or federal income taxation obligation; any fuelrelated subsidies or ʺtipping feesʺ or local subsidies received by the generator for the destruction of particular preexisting pollutants or the promotion of local environmental benefits; or emission reduction credits (whether issued pursuant to § 40709 of the Health and Safety Code or any other authority) that are encumbered or used by the generator for compliance with local, state, or federal operating and/or air quality permits.
In accordance with Public Utilities Code Section 399.21, Subdivision (a)(4), no REC may be created based on any electricity generated pursuant to any contract with a California retail seller or a local publicly owned electric utility executed before January 1, 2005, unless the contract contains explicit terms and conditions specifying the ownership or disposition of the RECs. In accordance with Public Utilities Code Section 399.21, Subdivision (a)(4), a REC may not be created based on any electricity generated pursuant to a contract with a qualifying facility pursuant to the Public Utility Regulatory Policies Act of 1978 that was executed after January 1, 2005. A REC cannot be created with respect to electricity generated by an eligible renewable energy resource attributable to the use of nonrenewable fuels, beyond a de minimis quantity as determined by the CEC.”
REP — Renewable Energy Program – a program implemented by the Energy Commission’s Renewable Energy Office.
RPS — Renewables Portfolio Standard – California’s Renewables Portfolio Standard as established in Public Utilities Code Section 399.11, et seq. and defined in Public Utilities Code Section 399.12, Subdivision (i), to mean the specified percentage of electricity generated by eligible renewable energy resources that a retail seller or local publicly owned electric utility is required to procure pursuant to Public Utilities Code Section 399.11 et seq. Under the RPS, a retail seller or local publicly owned electric utility must increase its total procurement of eligible renewable energy resources so that 33 percent of its retail sales are procured from eligible energy resources no later than December 31, 2020.
SB — Senate Bill – A Chaptered Bill that is part of the California Code that originated in the California State Senate. To become law, a senate bill must

82
win majority approval in both the California State Senate and the California State Assembly. (See Assembly Bill above for more details on process).
SCE — Southern California Edison Company – a California IOU that is the primary electricity supply company for much of Southern California. SCE has reported renewable energy procurement to the RPS program since 2001.
SDG&E — San Diego Gas & Electric Company – a California IOU that provides natural gas and electricity to San Diego County and southern Orange County. SDG&E has reported renewable energy procurement to the RPS program since 2001.
SMJU — small and multijurisdictional utility – an electrical corporation with 60,000 or fewer customer accounts in California as of January 1, 2010. Sierra Pacific Power and PacifiCorp are the only SMJU’s covered in this report.
WECC — Western Electricity Coordinating Council – formed on April 18, 2002, by the merger of the Western Systems Coordinating Council, Southwest Regional Transmission Association, and Western Regional Transmission Association. WECC is responsible for coordinating and promoting electric system reliability, assuring open and nondiscriminatory transmission access among members, and providing a forum for resolving transmission access disputes.
WREGIS — Western Renewable Energy Generation Information System – The Western Governors’ Association developed the WREGIS in association with the Energy Commission and using Energy Commission funding. WREGIS is an independent renewable energy tracking system for the region covered by the WECC. WREGIS electronically tracks RECs (WREGIS Certificates) representing renewable energy generation and, beginning with 2008 data, is used for RPS reporting and verification.

A‐1
APPENDIX A: Retail Sellers’ Modified RPS Track Forms and WREGIS Reports Appendix A is the Individual Retail Sellers’ Modified RPS Track Forms. It includes modified versions of the CEC‐RPS‐Track form filings for PG&E, SCE, SDG&E, PacifiCorp, Sierra Pacific Power Company, and certain ESPs. Examples of the modifications include a column that was added to the tables to show procurement from generating facilities by other retail sellers, such as ESPs and POUs that reported to the Power Source Disclosure Program and voluntary market programs. The sum of the information reported to the Power Source Disclosure Program, voluntary market programs, and the procurement information reported to the Energy Commission in the CEC‐RPS‐Track forms was compared to generation totals reported to the Energy Commission and/or the EIA. Another example is that a column was added to indicate the source of the generation data used for this comparison.
The modified CEC‐RPS‐Track form filings compare each retail sellers’ procurement claim for each facility with the generation totals as available. For utility‐certified facilities, an asterisk is listed with the RPS ID numbers indicating that it is a utility‐certified facility. As provided in the RPS Guidebook, CEC‐RPS‐Track form claims are accepted as the reported generation for utility‐certified facilities.
For ease of viewing, staff has provided the template below with footnotes explaining the headers for each column title in the tables that follow. This template was used for every retail seller, with the exception of PacifiCorp and Sierra Pacific Power where staff compared RPS procurement claims with public disclosure statements made in other states. For PacifiCorp and Sierra Pacific Power, the column titled Procurement Reported to Power Source Disclosure Program/ Voluntary Programs (kWh) is titled “Procurement Reported to Power Source Disclosure/ Voluntary Programs/ RECs Allocated to Other States.” As necessary, there are some individualized footnotes found on specific tables.

A‐2
2008-2010 RPS Procurement Claims Appendix Table Template
CEC RPS ID Number1
Facility Name2 Fuel Type3
Annual Generation Procured (kWh)4
RPS Procurement Claims by Other Retail Sellers (kWh)5
Procurement Reported to Power Source
Disclosure Program/ Voluntary Programs (kWh)6
Generation Data Used
for Comparison
With Procurement (kWh)7
Percent Difference Between Generation
and Procurement8
Generation Data Source9
Facilityʹs Beginning On Date10
1 The California Energy Commission assigns this RPS Certification identification number to the generating facility when it certifies the facility as RPS‐eligible.
* RPS identification numbers that show No Data in the column ʺGeneration Data Used for Comparison with Procurementʺ are utility‐certified facilities with no independently reported generation. As stated on page 68 in the RPS Eligibility Guidebook, Fourth Edition, with the use of the interim tracking system (ITS) the retail seller is responsible for reporting the generation data for the facilities it certifies. This reporting requirement will be satisfied though the CEC‐RPS‐Track forms. Therefore, the asterisk indicates that the facility is utility‐certified and that the procurement amount reported is accepted as reported on the RPS‐Track form.
2 This is the facility name as listed on the California’s Renewables Portfolio Standard (RPS) Eligible Facilities database, which can be found at: http://www.energy.ca.gov/portfolio/documents/LIST_RPS_CERT.PDF. In some cases the facility name may be different than what was reported on the RPS‐Track form. Energy Commission staff has attempted to match the name of the facility to match the name in the Energy Commission RPS Certification Database.
3 This is the fuel type as listed on the California’s Renewables Portfolio Standard (RPS) Eligible Facilities database, which can be found at: http://www.energy.ca.gov/portfolio/documents/LIST_RPS_CERT.PDF In some cases, the fuel type may be different than what was reported in the WREGIS State/Provincial/Voluntary Compliance Report and/or CEC‐RPS‐Track form. Energy Commission staff has attempted to match the fuel type to match with what is listed in the Energy Commission RPS Certification Database.
4 The procurement amount shown in this column is the amount reported by the retail seller to the Energy Commission in the WREGIS State/Provincial/Voluntary Compliance Report and/or CEC‐RPS‐Track form.
5 The figures reported in this column are the total specific purchases reported in the WREGIS State/Provincial/Voluntary Compliance Report and/or CEC‐RPS‐Track form from other retail sellers.

A‐3
6 This column lists procurement claims from specific purchases from other load serving entities for the same facilities, if applicable. Claims were reported to the Energy Commissionʹs Power Source Disclosure Program, which collects Annual Reports from load serving entities, including Publicly Owned Utilties. Energy Commission staff compare the sources of power retailers claimed to the actual sources used for electricity that is consumed in California. Energy Commission also collaborates with the Voluntary REC market, where possible. Additionally, the Energy Commission collaborates with other states. Please note that for PacifiCorp and Sierra Pacific, the header includes “Procurement Reported to Other States for Power Source Disclosure Programs.”
7 The generation totals in this column are taken from various sources that collect facility‐level generation information. These agencies are listed in the footnote under “Generation Data Sources.” If multiple sources had generation data for the same facility, the highest generation total was used for comparison with the procurement claim(s).
8 The percentages that appear in this column represent the differences between the data source with the highest generation amount and the annual procurement claim.
9 Energy Commission staff the Energy Commission compares RPS procurement claims with generation data obtained from the various sources listed below: United States Electricity Information Association (EIA); Energy Commission’s Electricity Analysis Office (EAO); Energy Commission’s Public Interest Energy Research (PIER) Renewable Wind Program; Invoice or Supporting Documentation (Inv/SD); Energy Commission’s Existing Renewable Funding Program (ERFP).
10 This is the date at which procurement from a facility becomes RPS eligible. Because the Energy Commission receives monthly data, once certified, generation from the entire month that the application is received is considered RPS eligible.

A‐4
3Phases Energy Services RPS Procurement Claims Analysis 2008 RPS Procurement Claims
CEC RPS ID
Number1 Facility Name2 Fuel Type3
Annual Generation Procured (kWh)4
RPS Procurement Claims by Other Retail Sellers (kWh)5
Procurement Reported to Power Source Disclosure Program/ Voluntary Programs (kWh)6
Generation Data Used
for Comparison
With Procurement (kWh)7
Percent Difference Between Generation
and Procurement8
Generation Data Source9
Facilityʹs Beginning On Date10
60471 Chowchilla II Biomass 10,998,000 6,126,000 0 20,702,000 21% EAO 7/25/200560473 El Nido Biomass 10,188,000 20,000 0 14,502,000 42% EAO 7/25/200560576 SPI – Sonora Biomass 8,932,000 0 0 40,645,910 355% EIA 4/23/2007
60023 Central Disposal Site LFG Power Plant Phase 3
Landfill Gas 124,600 0 0 3,855,000 2994% EIA 8/19/2004
60107 Monterey Regional Waste Mgt Dist
Landfill Gas 7,954,000 16,665,887 0 31,573,000 28% EIA 12/17/2004
2009 RPS Procurement Claims
CEC RPS ID
Number1 Facility Name2 Fuel Type3
Annual Generation Procured (kWh)4
RPS Procurement Claims by Other Retail Sellers (kWh)5
Procurement Reported to Power Source Disclosure Program/ Voluntary Programs (kWh)6
Generation Data Used
for Comparison
With Procurement (kWh)7
Percent Difference Between Generation
and Procurement8
Generation Data Source9
Facilityʹs Beginning On Date10
60473 El Nido Biomass 498,000 48,314,000 0 48,811,707 0% RPS 7/25/2005 60697 Simpson Cogen Biomass 9,600,000 0 9,600,000 164,357,000 756% EIA 6/2/2008
60005 Calpine Geothermal Unit 13
Geothermal 2,000 469,127,000 1,729 484,391,000 3% EAO 6/14/2004

A‐5
APS Energy Services RPS Procurement Claims Analysis 2008 RPS Procurement Claims
CEC RPS ID
Number1 Facility Name2 Fuel Type3
Annual Generation Procured (kWh)4
RPS Procurement Claims by Other Retail Sellers (kWh)5
Procurement Reported to Power Source Disclosure Program/ Voluntary Programs (kWh)6
Generation Data Used
for Comparison
With Procurement (kWh)7
Percent Difference Between Generation
and Procurement8
Generation Data Source9
Facilityʹs Beginning On Date10
60107 Monterey Regional Waste Mgt Dist
Landfill Gas 4,121,000 20,498,887 0 31,573,000 28% EIA 12/17/2004
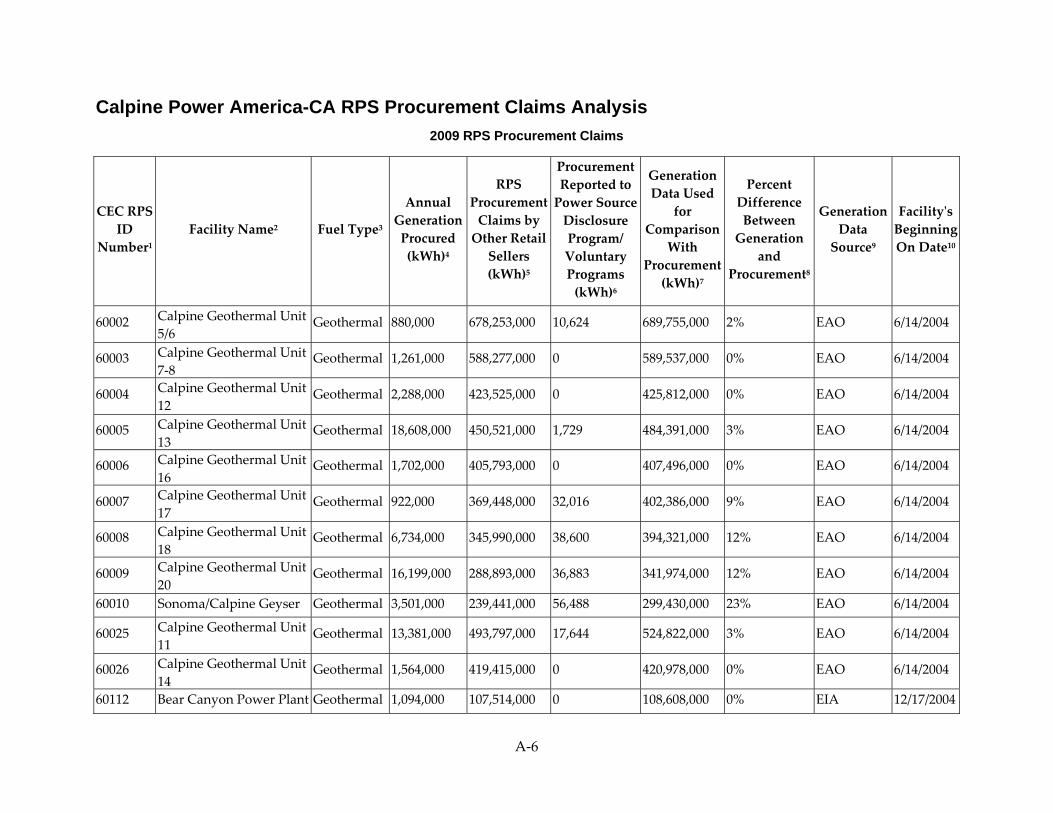
A‐6
Calpine Power America-CA RPS Procurement Claims Analysis 2009 RPS Procurement Claims
CEC RPS ID
Number1 Facility Name2 Fuel Type3
Annual Generation Procured (kWh)4
RPS Procurement Claims by Other Retail Sellers (kWh)5
Procurement Reported to Power Source Disclosure Program/ Voluntary Programs (kWh)6
Generation Data Used
for Comparison
With Procurement (kWh)7
Percent Difference Between Generation
and Procurement8
Generation Data Source9
Facilityʹs Beginning On Date10
60002 Calpine Geothermal Unit 5/6
Geothermal 880,000 678,253,000 10,624 689,755,000 2% EAO 6/14/2004
60003 Calpine Geothermal Unit 7‐8
Geothermal 1,261,000 588,277,000 0 589,537,000 0% EAO 6/14/2004
60004 Calpine Geothermal Unit 12
Geothermal 2,288,000 423,525,000 0 425,812,000 0% EAO 6/14/2004
60005 Calpine Geothermal Unit 13
Geothermal 18,608,000 450,521,000 1,729 484,391,000 3% EAO 6/14/2004
60006 Calpine Geothermal Unit 16
Geothermal 1,702,000 405,793,000 0 407,496,000 0% EAO 6/14/2004
60007 Calpine Geothermal Unit 17
Geothermal 922,000 369,448,000 32,016 402,386,000 9% EAO 6/14/2004
60008 Calpine Geothermal Unit 18
Geothermal 6,734,000 345,990,000 38,600 394,321,000 12% EAO 6/14/2004
60009 Calpine Geothermal Unit 20
Geothermal 16,199,000 288,893,000 36,883 341,974,000 12% EAO 6/14/2004
60010 Sonoma/Calpine Geyser Geothermal 3,501,000 239,441,000 56,488 299,430,000 23% EAO 6/14/2004
60025 Calpine Geothermal Unit 11
Geothermal 13,381,000 493,797,000 17,644 524,822,000 3% EAO 6/14/2004
60026 Calpine Geothermal Unit 14
Geothermal 1,564,000 419,415,000 0 420,978,000 0% EAO 6/14/2004
60112 Bear Canyon Power Plant Geothermal 1,094,000 107,514,000 0 108,608,000 0% EIA 12/17/2004

A‐7
60114 West Ford Flat Power Plant Geothermal 1,000 222,484,000 0 222,486,000 0%
EIA 12/17/2004
60115 Aidlin Power Plant Geothermal 1,000 144,097,000 0 144,099,000 0% EAO 12/17/2004
60117 Calistoga Power Plant Geothermal 11,863,000 450,725,000 0 493,339,000 7% EAO 12/17/2004
2010 RPS Procurement Claims
CEC RPS ID
Number1 Facility Name2 Fuel Type3
Annual Generation Procured (kWh)4
RPS Procurement Claims by Other Retail Sellers (kWh)5
Procurement Reported to Power Source Disclosure Program/ Voluntary Programs (kWh)6
Generation Data Used
for Comparison
With Procurement (kWh)7
Percent Difference Between Generation
and Procurement8
Generation Data Source9
Facilityʹs Beginning On Date10
60003 Calpine Geothermal Unit 7‐8
Geothermal 2,000 636,486,000 0 636,489,000 0% EAO 6/14/2004
60005 Calpine Geothermal Unit 13
Geothermal 1,550,000 485,561,000 0 487,108,000 0% EAO 6/14/2004
60008 Calpine Geothermal Unit 18
Geothermal 4,288,000 377,485,000 0 381,773,000 0% EAO 6/14/2004
60009 Calpine Geothermal Unit 20
Geothermal 17,590,000 312,076,000 0 329,676,000 0% EAO 6/14/2004
60010 Sonoma/Calpine Geyser Geothermal 18,979,000 290,071,000 0 309,051,000 0% EAO 6/14/2004
60025 Calpine Geothermal Unit 11
Geothermal 8,747,000 467,975,000 0 476,738,000 0% EAO 6/14/2004
60117 Calistoga Power Plant Geothermal 184,000 538,581,000 0 538,765,000 0% EIA 12/17/200460908 Geothermal 1, Unit 1 Geothermal 9,043,000 8,913,000 15,936,000 251,093,000 641% RPS 11/5/200960909 Geothermal 1, Unit 2 Geothermal 915,000 2,171,000 12,899,000 203,530,000 1173% RPS 11/5/200960910 Geothermal 2, Unit 3 Geothermal 30,000 0 5,332,000 84,630,000 1478% RPS 11/5/2009 60911 Geothermal 2, Unit 4 Geothermal 16,052,000 25,541,000 19,467,000 306,858,000 403% RPS 11/5/2009
61034 Elkhorn Valley Wind Farm
Wind 40,800,000 0 0 312,848,000 667% EIA 11/20/2007

A‐8
Commerce Energy, Inc., RPS Procurement Claims Analysis 2008 RPS Procurement Claims
CEC RPS ID
Number1 Facility Name2 Fuel Type3
Annual Generation Procured (kWh)4
RPS Procurement Claims by Other Retail Sellers (kWh)5
Procurement Reported to Power Source Disclosure Program/ Voluntary Programs (kWh)6
Generation Data Used
for Comparison
With Procurement (kWh)7
Percent Difference Between Generation
and Procurement8
Generation Data Source9
Facilityʹs Beginning On Date10
60005 Calpine Geothermal Unit 13
Geothermal 4,634,000 390,274,265 22,053 435,641,000 10% EAO 6/14/2004
60009 Calpine Geothermal Unit 20
Geothermal 1,504,000 254,792,614 83,087 358,231,000 40% EAO 6/14/2004
60117 Calistoga Power Plant Geothermal 3,235,000 538,544,494 0 555,134,000 2% EIA 12/17/2004
2009 RPS Procurement Claims
CEC RPS ID
Number1 Facility Name2 Fuel Type3
Annual Generation Procured (kWh)4
RPS Procurement Claims by Other Retail Sellers (kWh)5
Procurement Reported to Power Source Disclosure Program/ Voluntary Programs (kWh)6
Generation Data Used
for Comparison
With Procurement (kWh)7
Percent Difference Between Generation
and Procurement8
Generation Data Source9
Facilityʹs Beginning On Date10
60004 Calpine Geothermal Unit 12
Geothermal 3,648,000 422,165,000 0 425,812,000 0% EAO 6/14/2004
60005 Calpine Geothermal Unit 13
Geothermal 12,912,000 458,711,000 1,729 484,391,000 3% EAO 6/14/2004
60007 Calpine Geothermal Unit 17
Geothermal 454,000 369,916,000 32,016 402,386,000 9% EAO 6/14/2004
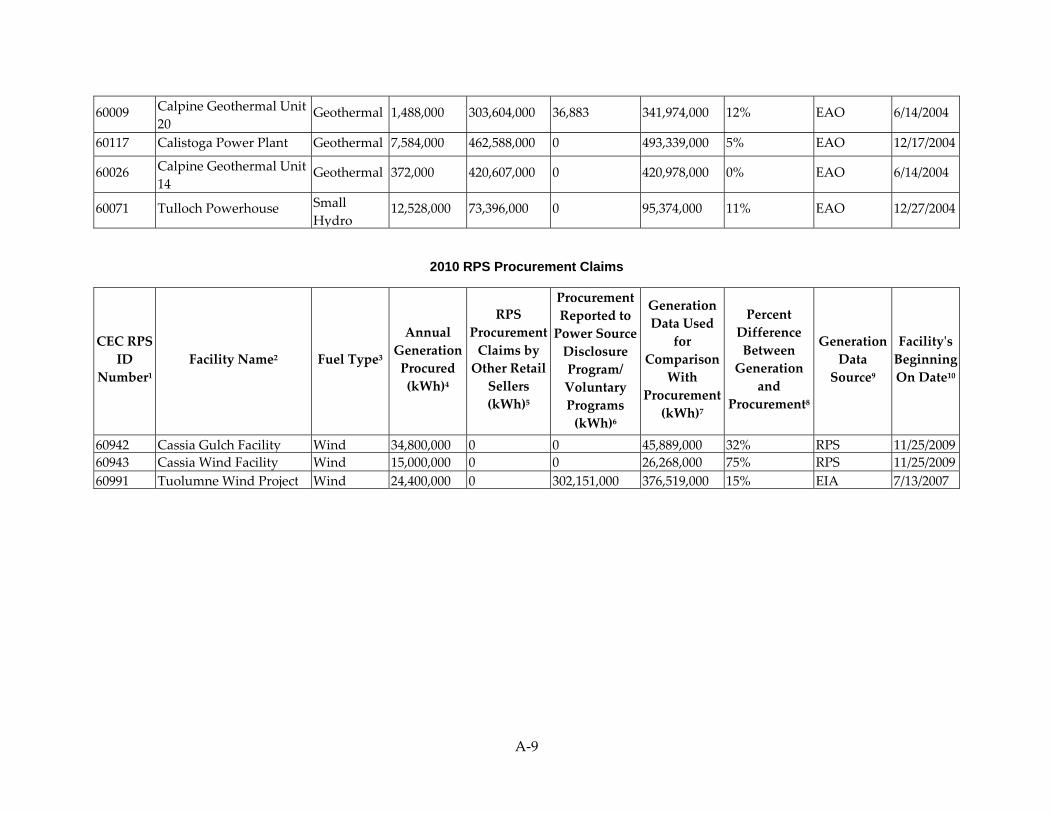
A‐9
60009 Calpine Geothermal Unit 20
Geothermal 1,488,000 303,604,000 36,883 341,974,000 12% EAO 6/14/2004
60117 Calistoga Power Plant Geothermal 7,584,000 462,588,000 0 493,339,000 5% EAO 12/17/2004
60026 Calpine Geothermal Unit 14
Geothermal 372,000 420,607,000 0 420,978,000 0% EAO 6/14/2004
60071 Tulloch Powerhouse Small Hydro
12,528,000 73,396,000 0 95,374,000 11% EAO 12/27/2004
2010 RPS Procurement Claims
CEC RPS ID
Number1 Facility Name2 Fuel Type3
Annual Generation Procured (kWh)4
RPS Procurement Claims by Other Retail Sellers (kWh)5
Procurement Reported to Power Source Disclosure Program/ Voluntary Programs (kWh)6
Generation Data Used
for Comparison
With Procurement (kWh)7
Percent Difference Between Generation
and Procurement8
Generation Data Source9
Facilityʹs Beginning On Date10
60942 Cassia Gulch Facility Wind 34,800,000 0 0 45,889,000 32% RPS 11/25/200960943 Cassia Wind Facility Wind 15,000,000 0 0 26,268,000 75% RPS 11/25/200960991 Tuolumne Wind Project Wind 24,400,000 0 302,151,000 376,519,000 15% EIA 7/13/2007
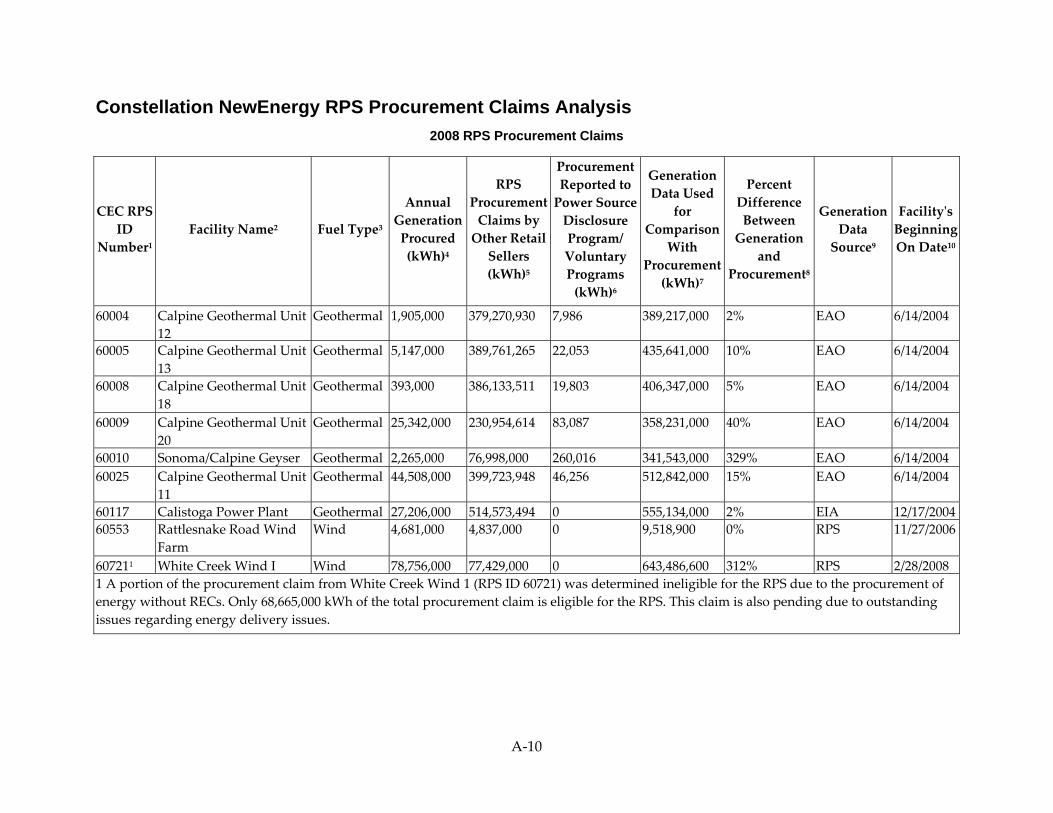
A‐10
Constellation NewEnergy RPS Procurement Claims Analysis 2008 RPS Procurement Claims
CEC RPS ID
Number1 Facility Name2 Fuel Type3
Annual Generation Procured (kWh)4
RPS Procurement Claims by Other Retail Sellers (kWh)5
Procurement Reported to Power Source Disclosure Program/ Voluntary Programs (kWh)6
Generation Data Used
for Comparison
With Procurement (kWh)7
Percent Difference Between Generation
and Procurement8
Generation Data Source9
Facilityʹs Beginning On Date10
60004 Calpine Geothermal Unit 12
Geothermal 1,905,000 379,270,930 7,986 389,217,000 2% EAO 6/14/2004
60005 Calpine Geothermal Unit 13
Geothermal 5,147,000 389,761,265 22,053 435,641,000 10% EAO 6/14/2004
60008 Calpine Geothermal Unit 18
Geothermal 393,000 386,133,511 19,803 406,347,000 5% EAO 6/14/2004
60009 Calpine Geothermal Unit 20
Geothermal 25,342,000 230,954,614 83,087 358,231,000 40% EAO 6/14/2004
60010 Sonoma/Calpine Geyser Geothermal 2,265,000 76,998,000 260,016 341,543,000 329% EAO 6/14/2004 60025 Calpine Geothermal Unit
11 Geothermal 44,508,000 399,723,948 46,256 512,842,000 15% EAO 6/14/2004
60117 Calistoga Power Plant Geothermal 27,206,000 514,573,494 0 555,134,000 2% EIA 12/17/200460553 Rattlesnake Road Wind
Farm Wind 4,681,000 4,837,000 0 9,518,900 0% RPS 11/27/2006
607211 White Creek Wind I Wind 78,756,000 77,429,000 0 643,486,600 312% RPS 2/28/20081 A portion of the procurement claim from White Creek Wind 1 (RPS ID 60721) was determined ineligible for the RPS due to the procurement of energy without RECs. Only 68,665,000 kWh of the total procurement claim is eligible for the RPS. This claim is also pending due to outstanding issues regarding energy delivery issues.

A‐11
2009 RPS Procurement Claims
CEC RPS ID
Number1 Facility Name2 Fuel Type3
Annual Generation Procured (kWh)4
RPS Procurement Claims by Other Retail Sellers (kWh)5
Procurement Reported to Power Source Disclosure Program/ Voluntary Programs (kWh)6
Generation Data Used
for Comparison
With Procurement (kWh)7
Percent Difference Between Generation
and Procurement8
Generation Data Source9
Facilityʹs Beginning On Date10
60505 Mid‐Valley Landfill Gas 9,493,000 4,510,000 0 13,415,000 ‐4% EAO 6/27/2006
60506 Milliken Landfill Gas 8,150,000 3,570,000 0 12,542,000 7% EAO 6/27/2006
60071 Tulloch Powerhouse Small Hydro
52,654,000 39,892,000 0 95,374,000 3% EAO 12/27/2004
60072 Beardsley Powerhouse Small Hydro 31,569,000 28,086,000 0 59,753,000 0% EIA 12/27/2004
605621 Leaning Juniper Wind 12,162,000 172,474,000 0 258,672,000 40% EIA 11/1/2006
605642 Wolverine Creek Wind 10,920,000 80,954,000 0 153,791,000 67% EIA 6/7/2007
60721 White Creek Wind I Wind 120,219,000 200,763,000 5,366,000 551,471,000 69% EIA 2/28/2008
60724 Hay Canyon Wind Wind 23,537,000 0 0 198,472,000 743% EIA 9/8/2008
607293 Marengo Wind 26,792,000 188,986,000 0 474,831,000 120% EIA 10/21/2008
607304 Marengo II Wind 13,407,000 93,225,000 0 474,831,000 345% EIA 10/21/2008
60743 Blue Trail Wind Farm Wind 27,463,000 0 0 27,463,740 0% RPS 12/3/2008
607505 Wheat Field Wind Farm Wind 31,400,000 142,978,000 0 173,576,000 0% EIA 12/12/2008
607756 Spring Canyon Energy Wind 109,868,000 0 0 197,114,140 79% RPS 1/30/2009
607767 Big Horn Wind Project Wind 98,891,000 75,000,000 69,075,000 512,480,560 111% EIA 1/5/2009
60803 Nine Canyon Wind Project‐Nine Canyon Phase 3
Wind 6,904,000 0 0 233,636,000 3284% EIA 1/9/2009
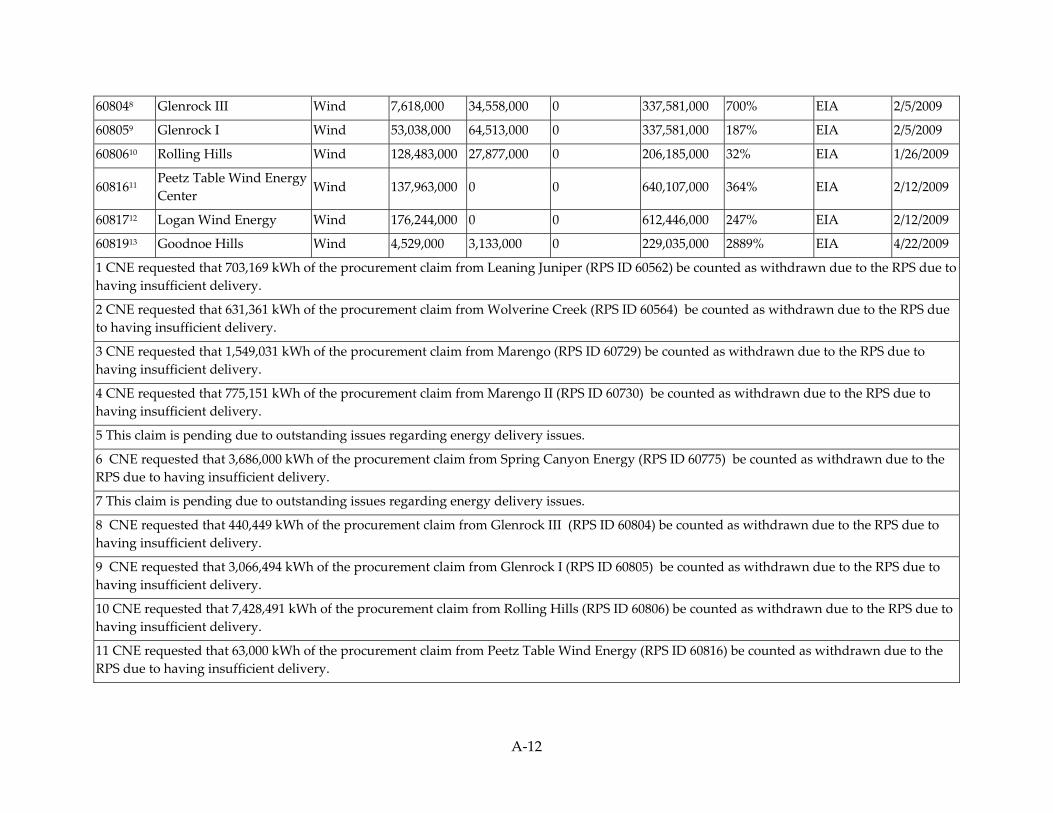
A‐12
608048 Glenrock III Wind 7,618,000 34,558,000 0 337,581,000 700% EIA 2/5/2009
608059 Glenrock I Wind 53,038,000 64,513,000 0 337,581,000 187% EIA 2/5/2009
6080610 Rolling Hills Wind 128,483,000 27,877,000 0 206,185,000 32% EIA 1/26/2009
6081611 Peetz Table Wind Energy Center
Wind 137,963,000 0 0 640,107,000 364% EIA 2/12/2009
6081712 Logan Wind Energy Wind 176,244,000 0 0 612,446,000 247% EIA 2/12/2009
6081913 Goodnoe Hills Wind 4,529,000 3,133,000 0 229,035,000 2889% EIA 4/22/2009
1 CNE requested that 703,169 kWh of the procurement claim from Leaning Juniper (RPS ID 60562) be counted as withdrawn due to the RPS due to having insufficient delivery.
2 CNE requested that 631,361 kWh of the procurement claim from Wolverine Creek (RPS ID 60564) be counted as withdrawn due to the RPS due to having insufficient delivery.
3 CNE requested that 1,549,031 kWh of the procurement claim from Marengo (RPS ID 60729) be counted as withdrawn due to the RPS due to having insufficient delivery.
4 CNE requested that 775,151 kWh of the procurement claim from Marengo II (RPS ID 60730) be counted as withdrawn due to the RPS due to having insufficient delivery.
5 This claim is pending due to outstanding issues regarding energy delivery issues.
6 CNE requested that 3,686,000 kWh of the procurement claim from Spring Canyon Energy (RPS ID 60775) be counted as withdrawn due to the RPS due to having insufficient delivery.
7 This claim is pending due to outstanding issues regarding energy delivery issues.
8 CNE requested that 440,449 kWh of the procurement claim from Glenrock III (RPS ID 60804) be counted as withdrawn due to the RPS due to having insufficient delivery.
9 CNE requested that 3,066,494 kWh of the procurement claim from Glenrock I (RPS ID 60805) be counted as withdrawn due to the RPS due to having insufficient delivery.
10 CNE requested that 7,428,491 kWh of the procurement claim from Rolling Hills (RPS ID 60806) be counted as withdrawn due to the RPS due to having insufficient delivery.
11 CNE requested that 63,000 kWh of the procurement claim from Peetz Table Wind Energy (RPS ID 60816) be counted as withdrawn due to the RPS due to having insufficient delivery.
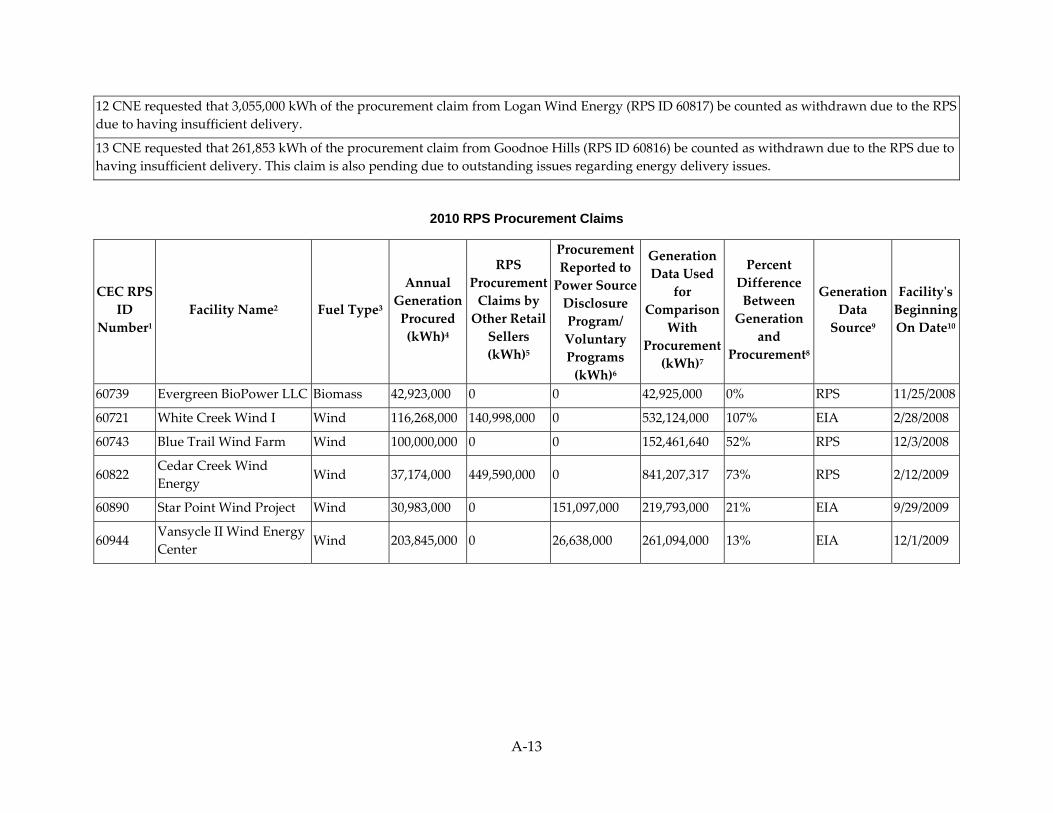
A‐13
12 CNE requested that 3,055,000 kWh of the procurement claim from Logan Wind Energy (RPS ID 60817) be counted as withdrawn due to the RPS due to having insufficient delivery.
13 CNE requested that 261,853 kWh of the procurement claim from Goodnoe Hills (RPS ID 60816) be counted as withdrawn due to the RPS due to having insufficient delivery. This claim is also pending due to outstanding issues regarding energy delivery issues.
2010 RPS Procurement Claims
CEC RPS ID
Number1 Facility Name2 Fuel Type3
Annual Generation Procured (kWh)4
RPS Procurement Claims by Other Retail Sellers (kWh)5
Procurement Reported to Power Source Disclosure Program/ Voluntary Programs (kWh)6
Generation Data Used
for Comparison
With Procurement (kWh)7
Percent Difference Between Generation
and Procurement8
Generation Data Source9
Facilityʹs Beginning On Date10
60739 Evergreen BioPower LLC Biomass 42,923,000 0 0 42,925,000 0% RPS 11/25/2008
60721 White Creek Wind I Wind 116,268,000 140,998,000 0 532,124,000 107% EIA 2/28/2008
60743 Blue Trail Wind Farm Wind 100,000,000 0 0 152,461,640 52% RPS 12/3/2008
60822 Cedar Creek Wind Energy Wind 37,174,000 449,590,000 0 841,207,317 73% RPS 2/12/2009
60890 Star Point Wind Project Wind 30,983,000 0 151,097,000 219,793,000 21% EIA 9/29/2009
60944 Vansycle II Wind Energy Center Wind 203,845,000 0 26,638,000 261,094,000 13% EIA 12/1/2009

A‐14
Direct Energy Business, LLC RPS Procurement Claims Analysis 2008 RPS Procurement Claims
CEC RPS ID
Number1 Facility Name2 Fuel Type3
Annual Generation Procured (kWh)4
RPS Procurement Claims by Other Retail Sellers (kWh)5
Procurement Reported to Power Source Disclosure Program/ Voluntary Programs (kWh)6
Generation Data Used
for Comparison
With Procurement (kWh)7
Percent Difference Between Generation
and Procurement8
Generation Data Source9
Facilityʹs Beginning On Date10
607211 White Creek Wind I Wind 84,877,000 84,835,000 0 643,486,600 279% RPS 2/28/2008
1 This claim is pending due to outstanding issues regarding energy delivery issues.
2009 RPS Procurement Claims
CEC RPS ID
Number1 Facility Name2 Fuel Type3
Annual Generation Procured (kWh)4
RPS Procurement Claims by Other Retail Sellers (kWh)5
Procurement Reported to Power Source Disclosure Program/ Voluntary Programs (kWh)6
Generation Data Used
for Comparison
With Procurement (kWh)7
Percent Difference Between Generation
and Procurement8
Generation Data Source9
Facilityʹs Beginning On Date10
60473 El Nido Biomass 3,737,000 44,577,000 498,000 48,811,707 0% RPS 7/25/2005
60005 Calpine Geothermal Unit 13
Geothermal 5,518,000 463,611,000 1,729 484,391,000 3% EAO 6/14/2004
60009 Calpine Geothermal Unit 20 Geothermal 71,016,000 234,076,000 36,883 341,974,000 12% EAO 6/14/2004
60010 Sonoma/Calpine Geyser Geothermal 36,288,000 206,654,000 56,488 299,430,000 23% EAO 6/14/2004
60025 Calpine Geothermal Unit Geothermal 243,000 506,935,000 17,644 524,822,000 3% EAO 6/14/2004
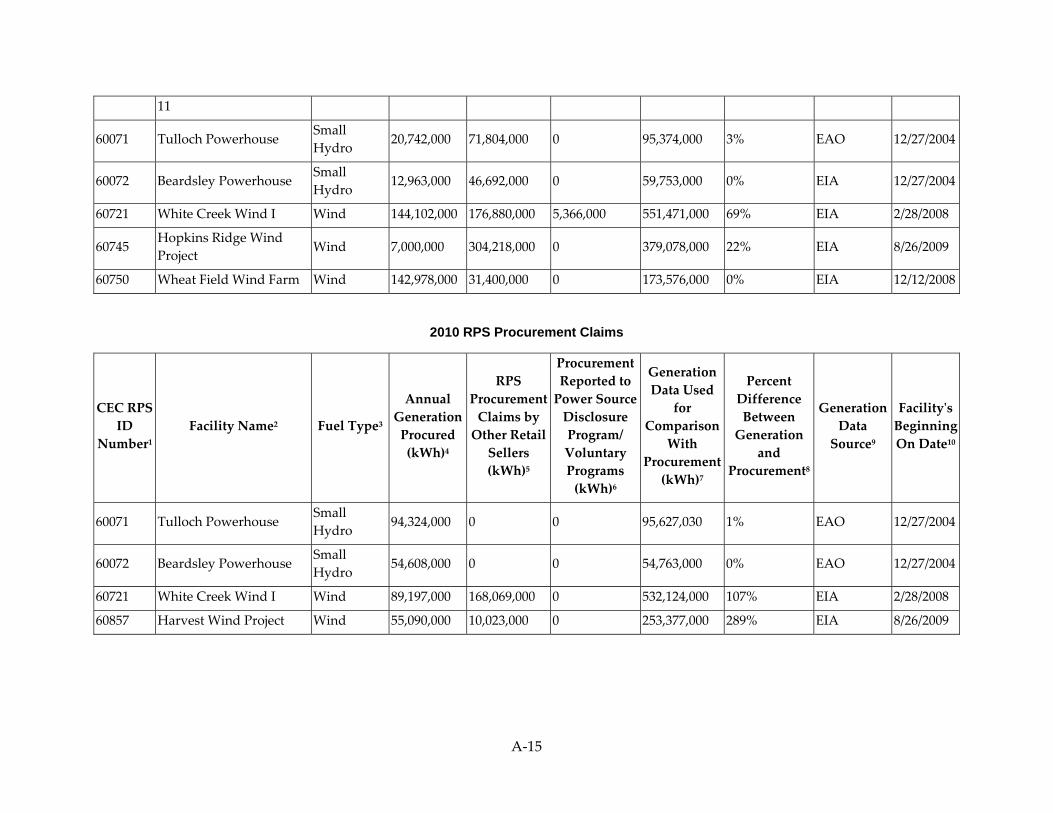
A‐15
11
60071 Tulloch Powerhouse Small Hydro 20,742,000 71,804,000 0 95,374,000 3% EAO 12/27/2004
60072 Beardsley Powerhouse Small Hydro
12,963,000 46,692,000 0 59,753,000 0% EIA 12/27/2004
60721 White Creek Wind I Wind 144,102,000 176,880,000 5,366,000 551,471,000 69% EIA 2/28/2008
60745 Hopkins Ridge Wind Project Wind 7,000,000 304,218,000 0 379,078,000 22% EIA 8/26/2009
60750 Wheat Field Wind Farm Wind 142,978,000 31,400,000 0 173,576,000 0% EIA 12/12/2008
2010 RPS Procurement Claims
CEC RPS ID
Number1 Facility Name2 Fuel Type3
Annual Generation Procured (kWh)4
RPS Procurement Claims by Other Retail Sellers (kWh)5
Procurement Reported to Power Source Disclosure Program/ Voluntary Programs (kWh)6
Generation Data Used
for Comparison
With Procurement (kWh)7
Percent Difference Between Generation
and Procurement8
Generation Data Source9
Facilityʹs Beginning On Date10
60071 Tulloch Powerhouse Small Hydro 94,324,000 0 0 95,627,030 1% EAO 12/27/2004
60072 Beardsley Powerhouse Small Hydro
54,608,000 0 0 54,763,000 0% EAO 12/27/2004
60721 White Creek Wind I Wind 89,197,000 168,069,000 0 532,124,000 107% EIA 2/28/2008
60857 Harvest Wind Project Wind 55,090,000 10,023,000 0 253,377,000 289% EIA 8/26/2009

A‐16
Marin Energy Authority RPS Procurement Claims Analysis 2010 RPS Procurement Claims
CEC RPS ID
Number1 Facility Name2 Fuel Type3
Annual Generation Procured (kWh)4
RPS Procurement Claims by Other Retail Sellers (kWh)5
Procurement Reported to Power Source Disclosure Program/ Voluntary Programs (kWh)6
Generation Data Used
for Comparison
With Procurement (kWh)7
Percent Difference Between Generation
and Procurement8
Generation Data Source9
Facilityʹs Beginning On Date10
60994 Columbia Ridge Landfill Electric Generating Facility
Landfill Gas 19,265,000 9,953,000 0 50,955,000 74% RPS 1/14/2010
60803 Nine Canyon Wind Project‐Nine Canyon Phase 3
Wind 4,917,000 0 0 222,903,000 4433% EIA 1/9/2009

A‐17
Noble Americas Energy Solutions LLC RPS Procurement Claims Analysis 2008 RPS Procurement Claims
CEC RPS ID
Number1 Facility Name2 Fuel Type3
Annual Generation Procured (kWh)4
RPS Procurement Claims by Other Retail Sellers (kWh)5
Procurement Reported to Power Source Disclosure Program/ Voluntary Programs (kWh)6
Generation Data Used
for Comparison
With Procurement (kWh)7
Percent Difference Between Generation
and Procurement8
Generation Data Source9
Facilityʹs Beginning On Date10
60520 Angels Unit Conduit Hydro
4,957,000 0 0 4,957,000 0% EIA 4/19/2006
60521 Murphys Unit Conduit Hydro
12,867,000 0 0 12,868,000 0% EIA 4/19/2006
60006 Calpine Geothermal Unit 16
Geothermal 8,059,000 416,397,610 0 424,557,000 0% EAO 6/14/2004
60009 Calpine Geothermal Unit 20
Geothermal 3,850,000 252,446,614 83,087 358,231,000 40% EAO 6/14/2004
60025 Calpine Geothermal Unit 11
Geothermal 8,179,000 436,052,948 46,256 512,842,000 15% EAO 6/14/2004
60601 El Dorado Powerhouse (Akin Powerhouse)
Small Hydro
60,253,000 0 0 60,253,593 0% RPS 2/23/2007
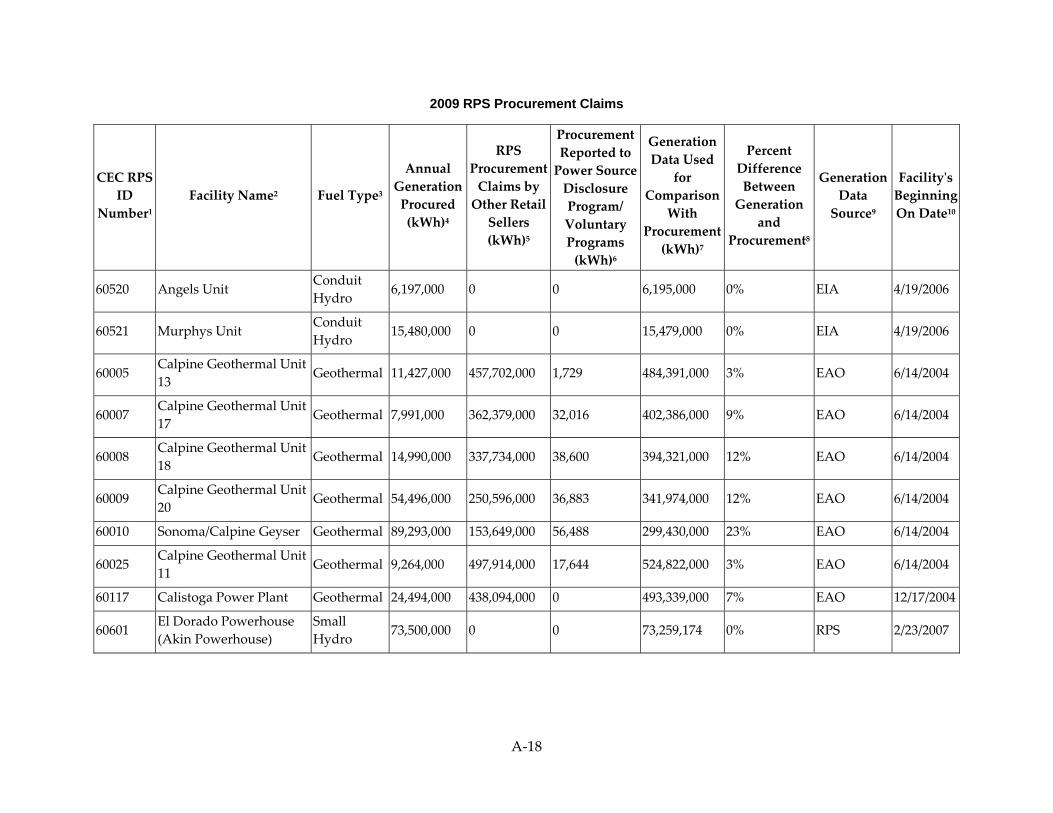
A‐18
2009 RPS Procurement Claims
CEC RPS ID
Number1 Facility Name2 Fuel Type3
Annual Generation Procured (kWh)4
RPS Procurement Claims by Other Retail Sellers (kWh)5
Procurement Reported to Power Source Disclosure Program/ Voluntary Programs (kWh)6
Generation Data Used
for Comparison
With Procurement (kWh)7
Percent Difference Between Generation
and Procurement8
Generation Data Source9
Facilityʹs Beginning On Date10
60520 Angels Unit Conduit Hydro
6,197,000 0 0 6,195,000 0% EIA 4/19/2006
60521 Murphys Unit Conduit Hydro
15,480,000 0 0 15,479,000 0% EIA 4/19/2006
60005 Calpine Geothermal Unit 13 Geothermal 11,427,000 457,702,000 1,729 484,391,000 3% EAO 6/14/2004
60007 Calpine Geothermal Unit 17 Geothermal 7,991,000 362,379,000 32,016 402,386,000 9% EAO 6/14/2004
60008 Calpine Geothermal Unit 18
Geothermal 14,990,000 337,734,000 38,600 394,321,000 12% EAO 6/14/2004
60009 Calpine Geothermal Unit 20 Geothermal 54,496,000 250,596,000 36,883 341,974,000 12% EAO 6/14/2004
60010 Sonoma/Calpine Geyser Geothermal 89,293,000 153,649,000 56,488 299,430,000 23% EAO 6/14/2004
60025 Calpine Geothermal Unit 11 Geothermal 9,264,000 497,914,000 17,644 524,822,000 3% EAO 6/14/2004
60117 Calistoga Power Plant Geothermal 24,494,000 438,094,000 0 493,339,000 7% EAO 12/17/2004
60601 El Dorado Powerhouse (Akin Powerhouse)
Small Hydro 73,500,000 0 0 73,259,174 0% RPS 2/23/2007

A‐19
2010 RPS Procurement Claims
CEC RPS ID
Number1 Facility Name2 Fuel Type3
Annual Generation Procured (kWh)4
RPS Procurement Claims by Other Retail Sellers (kWh)5
Procurement Reported to Power Source
Disclosure Program/ Voluntary Programs
Generation Data Used
for Comparison
With Procurement (kWh)7
Percent Difference Between Generation
and Procurement
8
Generation Data Source9
Facilityʹs Beginning On Date10
61064 Pastoria Energy Facility Biogas 13,296,000 8,166,000 0 4,383,185,000 20323% EIA 4/20/2010
60520 Angels Unit Conduit Hydro
6,658,000 0 0 6,658,000 0% EAO 4/19/2006
60521 Murphys Unit Conduit Hydro 16,328,000 0 0 16,327,000 0% EAO 4/19/2006
60008 Calpine Geothermal Unit 18 Geothermal 7,462,000 374,311,000 0 381,773,000 0% EAO 6/14/2004
60009 Calpine Geothermal Unit 20
Geothermal 8,441,000 321,225,000 0 329,676,000 0% EAO 6/14/2004
60010 Sonoma/Calpine Geyser Geothermal 67,573,000 241,477,000 0 309,051,000 0% EAO 6/14/2004
60866 Calabasas Gas‐To‐Energy Facility Landfill Gas 19,271,000 0 0 19,271,000 0% Inv 12/7/2009
60601 El Dorado Powerhouse (Akin Powerhouse)
Small Hydro 36,062,000 33,605,000 0 79,792,664 15% RPS 2/23/2007
60816 Peetz Table Wind Energy Center
Wind 65,255,000 154,059,000 0 618,409,495 182% RPS 2/12/2009
60817 Logan Wind Energy Wind 128,527,000 72,358,000 0 582,146,000 190% EIA 2/12/2009
60822 Cedar Creek Wind Energy Wind 449,590,000 37,174,000 0 841,207,317 73% RPS 2/12/2009
60898 Northern Colorado Wind 1 Wind 104,639,000 0 35,412,000 432,413,017 209% RPS 10/7/2009
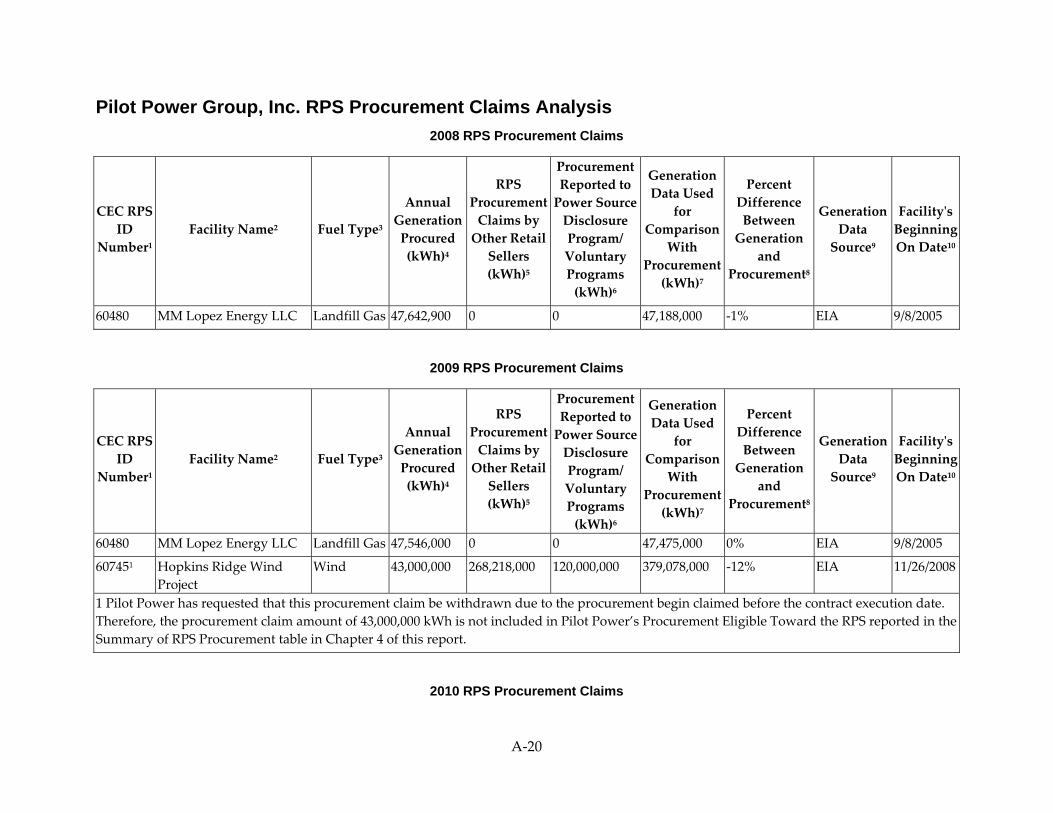
A‐20
Pilot Power Group, Inc. RPS Procurement Claims Analysis 2008 RPS Procurement Claims
CEC RPS ID
Number1 Facility Name2 Fuel Type3
Annual Generation Procured (kWh)4
RPS Procurement Claims by Other Retail Sellers (kWh)5
Procurement Reported to Power Source Disclosure Program/ Voluntary Programs (kWh)6
Generation Data Used
for Comparison
With Procurement (kWh)7
Percent Difference Between Generation
and Procurement8
Generation Data Source9
Facilityʹs Beginning On Date10
60480 MM Lopez Energy LLC Landfill Gas 47,642,900 0 0 47,188,000 ‐1% EIA 9/8/2005
2009 RPS Procurement Claims
CEC RPS ID
Number1 Facility Name2 Fuel Type3
Annual Generation Procured (kWh)4
RPS Procurement Claims by Other Retail Sellers (kWh)5
Procurement Reported to Power Source Disclosure Program/ Voluntary Programs (kWh)6
Generation Data Used
for Comparison
With Procurement (kWh)7
Percent Difference Between Generation
and Procurement8
Generation Data Source9
Facilityʹs Beginning On Date10
60480 MM Lopez Energy LLC Landfill Gas 47,546,000 0 0 47,475,000 0% EIA 9/8/2005
607451 Hopkins Ridge Wind Project
Wind 43,000,000 268,218,000 120,000,000 379,078,000 ‐12% EIA 11/26/2008
1 Pilot Power has requested that this procurement claim be withdrawn due to the procurement begin claimed before the contract execution date. Therefore, the procurement claim amount of 43,000,000 kWh is not included in Pilot Power’s Procurement Eligible Toward the RPS reported in the Summary of RPS Procurement table in Chapter 4 of this report.
2010 RPS Procurement Claims

A‐21
CEC RPS ID
Number1 Facility Name2 Fuel Type3
Annual Generation Procured (kWh)4
RPS Procurement Claims by Other Retail Sellers (kWh)5
Procurement Reported to Power Source Disclosure Program/ Voluntary Programs (kWh)6
Generation Data Used
for Comparison
With Procurement (kWh)7
Percent Difference Between Generation
and Procurement8
Generation Data Source9
Facilityʹs Beginning On Date10
61064 Pastoria Energy Facility Biogas 8,166,000 0 13,296,000 4,383,185,000 20323% EIA 4/20/2010
60908 Geothermal 1, Unit 1 Geothermal 8,913,000 9,043,000 15,936,000 251,093,000 641% RPS 11/5/2009
60909 Geothermal 1, Unit 2 Geothermal 2,171,000 915,000 12,899,000 203,530,000 1173% RPS 11/5/2009
60911 Geothermal 2, Unit 4 Geothermal 25,541,000 16,052,000 19,467,000 306,858,000 403% RPS 11/5/2009
60480 MM Lopez Energy LLC Landfill Gas 46,648,000 0 0 46,625,000 0% EAO 9/8/2005
60505 Mid‐Valley Landfill Gas 13,833,000 0 0 13,314,000 ‐4% EAO 6/27/2006
60506 Milliken Landfill Gas 12,131,000 0 0 11,703,000 ‐4% EAO 6/27/2006
60602 & 60694
Klondike Wind Power III & Klondike Wind Power IIIA
Wind 9,702,000 545,594,000 0 735,364,000 32% EIA 7/5/2007 & 5/2/2008
60857 Harvest Wind Project Wind 10,023,000 55,090,000 0 253,377,000 289% EIA 8/26/2009
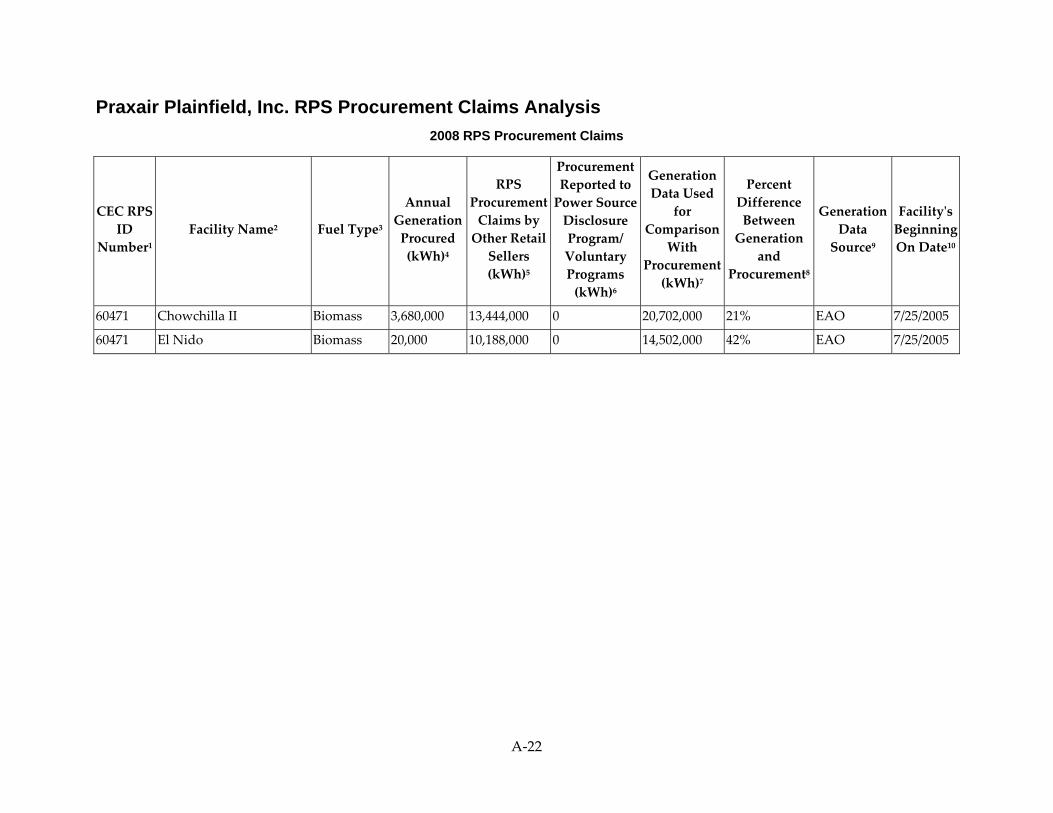
A‐22
Praxair Plainfield, Inc. RPS Procurement Claims Analysis 2008 RPS Procurement Claims
CEC RPS ID
Number1 Facility Name2 Fuel Type3
Annual Generation Procured (kWh)4
RPS Procurement Claims by Other Retail Sellers (kWh)5
Procurement Reported to Power Source Disclosure Program/ Voluntary Programs (kWh)6
Generation Data Used
for Comparison
With Procurement (kWh)7
Percent Difference Between Generation
and Procurement8
Generation Data Source9
Facilityʹs Beginning On Date10
60471 Chowchilla II Biomass 3,680,000 13,444,000 0 20,702,000 21% EAO 7/25/2005
60471 El Nido Biomass 20,000 10,188,000 0 14,502,000 42% EAO 7/25/2005

A‐23
Shell Energy RPS Procurement Claims Analysis 2008 RPS Procurement Claims
CEC RPS ID
Number1
Facility Name2 Fuel Type3
Annual Generation Procured (kWh)4
2008 Vintage
Procurement Claimed in 2010 (kWh)*
RPS Procurement Claims by Other Retail Sellers (kWh)5
Procurement Reported to Power Source Disclosure/ Voluntary Programs (kWh)6
Generation Data Used
for Comparison
With Procurement (kWh)7
Percent Difference Between Generation
and Procurement8
Generation Data Source9
Facilityʹs Beginning On Date10
60505 Mid‐Valley Landfill Gas 4,510,000 0 0 13,048,000 189% EAO 6/27/2006
60506 Milliken Landfill Gas 3,570,000 0 0 9,030,000 153% EAO 6/27/2006
607211 White Creek Wind I
Wind 1,171,000 4,908,000 150,106,000 0 643,486,600 312% RPS 2/28/2008
*The amount shown in this column is 2008 vintage procurement that is being claimed in 2010.
1 This claim is pending due to outstanding issues regarding energy delivery issues.

A‐24
2009 RPS Procurement Claims
CEC RPS ID
Number1 Facility Name2
Fuel Type3
Annual Generation Procured (kWh)4
2009 Vintage
Procurement Claimed in 2010 (kWh)*
RPS Procurement Claims by Other Retail Sellers (kWh)5
Procurement Reported to Power Source Disclosure/ Voluntary Programs (kWh)6
Generation Data Used
for Comparison
With Procurement (kWh)7
Percent Difference Between Generation
and Procurement8
Generation Data Source9
Facilityʹs Beginning On Date10
60602 & 606941
Klondike Wind Power III & Klondike Wind Power IIIA
Wind 15,882,000 116,527,000 440,123,000 541,862,000 766,641,850 ‐31% EIA 7/5/2007 & 5/2/2008
607212 White Creek Wind I
Wind 3,195,000 316,616,000 5,366,000 551,471,000 70% EIA 2/28/2008
*The amount shown in this column is 2009 vintage procurement that is being claimed in 2010.
1 This claim is pending due to outstanding issues regarding energy delivery issues.
2 This claim is pending due to outstanding issues regarding energy delivery issues.
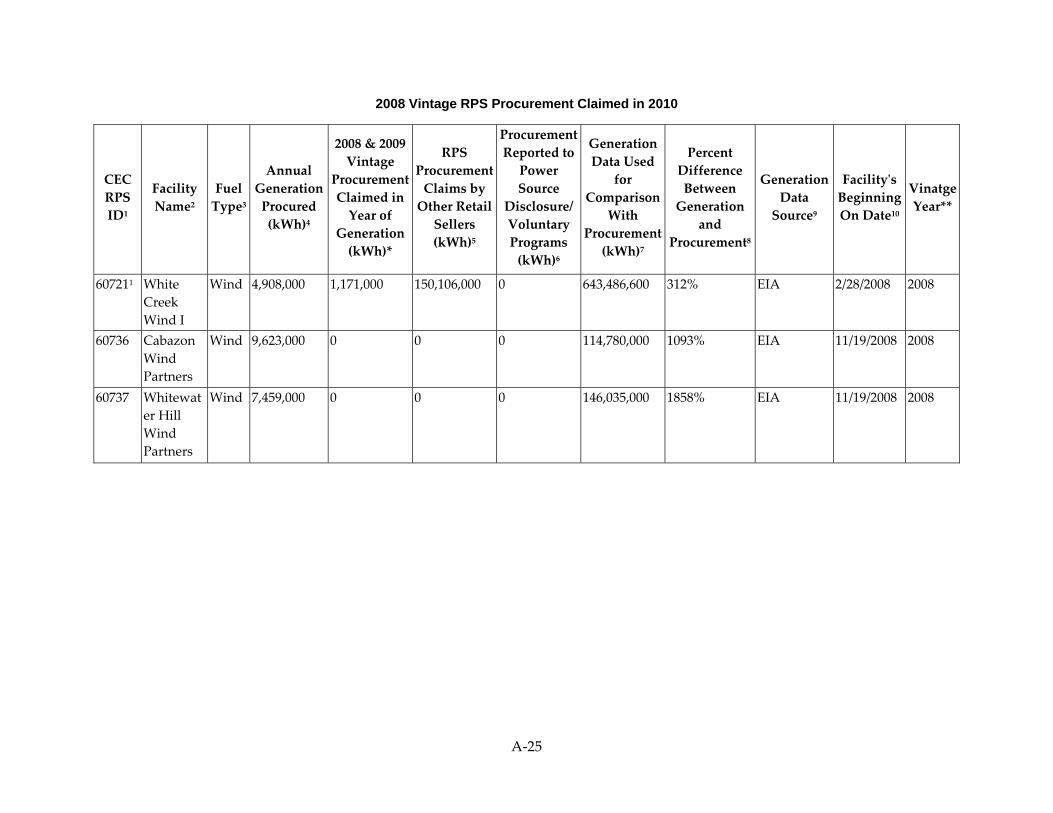
A‐25
2008 Vintage RPS Procurement Claimed in 2010
CEC RPS ID1
Facility Name2
Fuel Type3
Annual Generation Procured (kWh)4
2008 & 2009 Vintage
Procurement Claimed in Year of
Generation (kWh)*
RPS Procurement Claims by Other Retail Sellers (kWh)5
Procurement Reported to Power Source
Disclosure/ Voluntary Programs (kWh)6
Generation Data Used
for Comparison
With Procurement (kWh)7
Percent Difference Between Generation
and Procurement8
Generation Data Source9
Facilityʹs Beginning On Date10
Vinatge Year**
607211 White Creek Wind I
Wind 4,908,000 1,171,000 150,106,000 0 643,486,600 312% EIA 2/28/2008 2008
60736 Cabazon Wind Partners
Wind 9,623,000 0 0 0 114,780,000 1093% EIA 11/19/2008 2008
60737 Whitewater Hill Wind Partners
Wind 7,459,000 0 0 0 146,035,000 1858% EIA 11/19/2008 2008

A‐26
2009 Vintage RPS Procurement Claimed in 2010
CEC RPS ID1
Facility Name2
Fuel Type3
Annual Generation Procured (kWh)4
2008 & 2009 Vintage
Procurement Claimed in Year of
Generation (kWh)*
RPS Procurement Claims by Other Retail Sellers (kWh)5
Procurement Reported to Power Source
Disclosure/ Voluntary Programs (kWh)6
Generation Data Used
for Comparison
With Procurement (kWh)7
Percent Difference Between Generation
and Procurement8
Generation Data Source9
Facilityʹs Beginning On Date10
Vinatge Year**
60071 Tulloch Powerhouse
Small Hydro
6,622,000 0 85,924,000 0 95,374,000 3% EAO 12/27/2004 2009
60072 Beardsley Powerhouse
Small Hydro
15,123,000 0 44,532,000 0 59,753,000 0% EAO 12/27/2004 2009
608572 Harvest Wind Project
Wind 1,145,000 0 0 0 8/26/2009 2009
60602 & 606943
Klondike Wind Power III & Klondike Wind Power IIIA
Wind 116,527,000 15,882,000 440,123,000 766,641,850 34% EIA 7/5/2007 & 5/2/2008
2009

A‐27
RPS Procurement Claimed in 2010
CEC RPS ID
Number1
Facility Name2
Fuel Type3
Annual Generation Procured (kWh)4
2008 & 2009 Vintage
Procurement Claimed in Year of
Generation (kWh)*
RPS Procurement Claims by Other Retail Sellers (kWh)5
Procurement Reported to Power Source
Disclosure/ Voluntary Programs (kWh)6
Generation Data Used
for Comparison
With Procurement (kWh)7
Percent Difference Between Generation
and Procurement8
Generation Data Source9
Facilityʹs Beginning On Date10
Vinatge Year**
60994 Columbia Ridge Landfill Electric Generating Facility
Biogas 9,953,000 0 19,265,000 0 50,955,000 74% RPS 1/14/2010 2010
60775 Spring Canyon Energy
Wind 34,626,000 0 0 0 202,348,663 484% RPS 1/30/2009 2010
60816 Peetz Table Wind Energy Center
Wind 154,059,000 0 65,255,000 0 618,409,495 182% RPS 2/12/2009 2010
60817 Logan Wind Energy
Wind 72,358,000 0 128,527,000 0 582,146,000 190% EIA 2/12/2009 2010
60818 Twin Buttes Wind
Wind 56,915,000 0 0 269,833,127 374% RPS 3/5/2009 2010
60857 Harvest Wind Project
Wind 25,975,000 0 66,258,000 0 253,377,000 175% EIA 8/27/2009 2010

A‐28
60897 Northern Colorado Wind II
Wind 35,412,000 0 0 0 72,668,514 105% RPS 10/14/2009 2010
*The amount shown in this column is 2008 and 2009 vintage procurement that is being claimed for the year in which the procurement was generated.
**This is the year in which the procurement was generated.
1 This claim is pending due to outstanding issues regarding energy delivery issues.
2 This claim is pending due to outstanding issues regarding energy delivery issues.
3 This claim is pending due to outstanding issues regarding energy delivery issues.

A‐29
PacifiCorp RPS Procurement Claims Analysis 2008 RPS Procurement Claims
CEC RPS ID
Number1 Facility Name2 Fuel Type3
Annual Generation Procured (kWh)4
RPS Procurement Claims by Other Retail Sellers (kWh)5
Procurement Reported to Power Source Disclosure Program/ Voluntary Programs (kWh)6
Generation Data Used
for Comparison
With Procurement (kWh)7
Percent Difference Between Generation
and Procurement8
Generation Data Source9
Facilityʹs Beginning On Date10
60510 Dillard Cogeneration Facility
Biomass 2,426,077 0 0 172,563,430 7013% RPS 6/12/2006
60509 Eagle Point Conduit Hydro
304,000 0 0 17,350,000 5607% EIA 7/19/2006
60537 Copco 1 Conduit Hydro
1,708,000 0 0 97,312,000 5597% EIA 11/1/2006
60538 Copco 2 Conduit Hydro
2,109,000 0 0 120,286,000 5603% EIA 11/1/2006
60540 Iron Gate Conduit Hydro
2,200,000 0 0 125,383,000 5599% EIA 11/1/2006
60582* Fountain Green Conduit Hydro
8,000 0 0 N/A N/A No Data 10/27/2006
60583 Granite Conduit Hydro
110,000 0 0 6,341,000 5665% EIA 10/27/2006
60584* Gunlock Conduit Hydro
16,000 0 0 N/A N/A No Data 10/27/2006
60588* Sand Cove Conduit Hydro
15,000 0 0 N/A N/A No Data 10/27/2006
60593* Veyo Conduit 12,000 0 0 N/A N/A No Data 10/27/2006

A‐30
Hydro
60594 Viva Naughton Conduit Hydro
13,000 0 0 6,819,000 52354% EIA 10/27/2006
60779* Ralphs Ranch Conduit Hydro
240,060 0 0 N/A N/A No Data 4/27/2009
60780* Bogus Creek ‐ Lower Cold Springs
Conduit Hydro
769,905 0 0 N/A N/A No Data 4/27/2009
60781* Bogus Creek ‐ Upper Cold Springs
Conduit Hydro
165,959 0 0 N/A N/A No Data 4/27/2009
60782* Luckey, Paul Conduit Hydro
286,160 0 0 N/A N/A No Data 4/27/2009
60820 Blundell I Geothermal 3,289,000 0 0 254,277,000 7631% EIA 5/1/2009
60821 Blundell II Geothermal 1,172,000 0 0 254,277,000 21596% EIA 5/1/2009
60507 Clearwater 1 Small Hydro
741,000 0 0 104,503,000 14003% EAO 7/19/2006
60508 Clearwater 2 Small Hydro
761,000 0 0 43,375,000 5600% EIA 7/19/2006
60513 Fish Creek Small Hydro
571,000 0 0 32,544,000 5599% EIA 7/19/2006
60514 Prospect 3 Small Hydro
720,000 0 0 41,051,000 5602% EIA 7/19/2006
60515 Slide Creek Small Hydro
1,570,000 0 0 89,523,000 5602% EIA 7/19/2006
60516 Soda Springs Small Hydro
996,000 0 0 56,787,000 5602% EIA 7/19/2006
60517 Wallowa Falls Small Hydro
118,000 0 0 6,819,000 5679% EIA 7/19/2006
60522 Bend Small Hydro
52,000 0 0 2,917,000 5510% EIA 10/19/2006
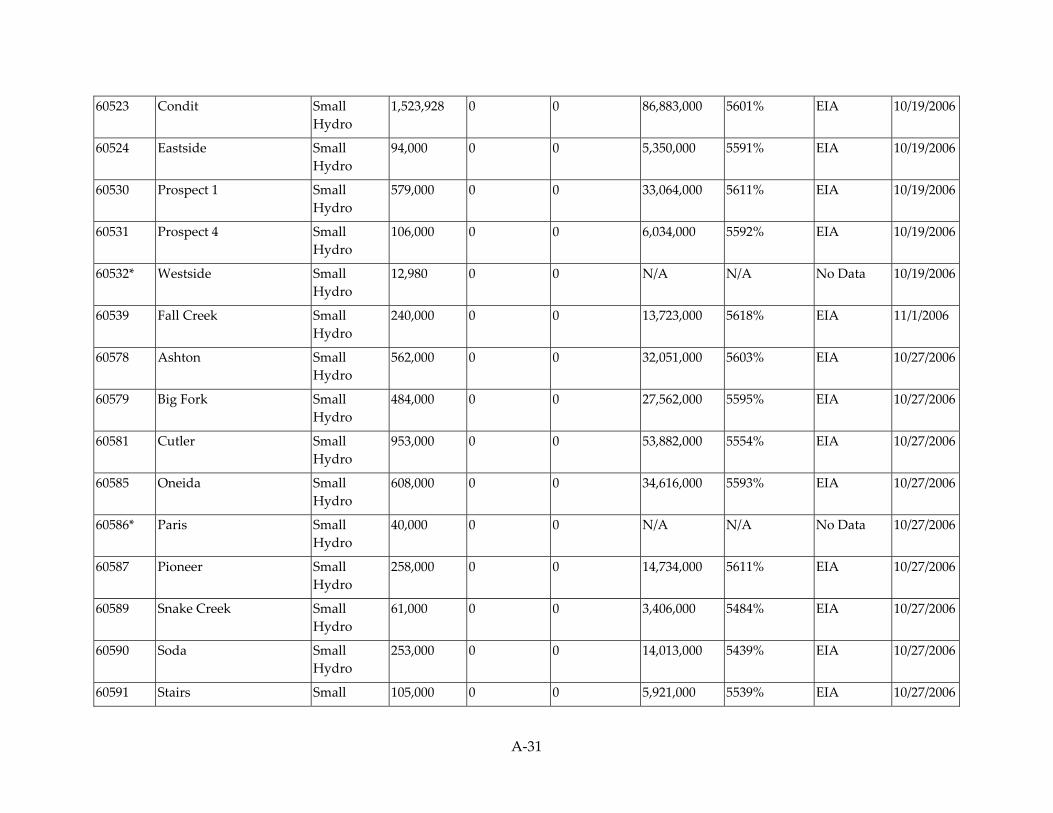
A‐31
60523 Condit Small Hydro
1,523,928 0 0 86,883,000 5601% EIA 10/19/2006
60524 Eastside Small Hydro
94,000 0 0 5,350,000 5591% EIA 10/19/2006
60530 Prospect 1 Small Hydro
579,000 0 0 33,064,000 5611% EIA 10/19/2006
60531 Prospect 4 Small Hydro
106,000 0 0 6,034,000 5592% EIA 10/19/2006
60532* Westside Small Hydro
12,980 0 0 N/A N/A No Data 10/19/2006
60539 Fall Creek Small Hydro
240,000 0 0 13,723,000 5618% EIA 11/1/2006
60578 Ashton Small Hydro
562,000 0 0 32,051,000 5603% EIA 10/27/2006
60579 Big Fork Small Hydro
484,000 0 0 27,562,000 5595% EIA 10/27/2006
60581 Cutler Small Hydro
953,000 0 0 53,882,000 5554% EIA 10/27/2006
60585 Oneida Small Hydro
608,000 0 0 34,616,000 5593% EIA 10/27/2006
60586* Paris Small Hydro
40,000 0 0 N/A N/A No Data 10/27/2006
60587 Pioneer Small Hydro
258,000 0 0 14,734,000 5611% EIA 10/27/2006
60589 Snake Creek Small Hydro
61,000 0 0 3,406,000 5484% EIA 10/27/2006
60590 Soda Small Hydro
253,000 0 0 14,013,000 5439% EIA 10/27/2006
60591 Stairs Small 105,000 0 0 5,921,000 5539% EIA 10/27/2006

A‐32
Hydro
60595 Weber Small Hydro
290,000 0 0 16,470,000 5579% EIA 10/27/2006
60777 Slate Creek Small Hydro
6,646,094 0 0 8,657,000 30% EAO 4/27/2009
60778* Lake Siskiyou Small Hydro
12,312,545 0 0 N/A N/A No Data 4/27/2009
60791 Last Chance Small Hydro
46,000 0 0 2,488,000 5309% EIA 5/12/2009
60792 Olmstead Small Hydro
321,000 0 0 18,229,000 5579% EIA 5/12/2009
60561 Foote Creek 1 Wind 1,125,000 0 0 136,107,000 11998% EIA 11/1/2006
60562 Leaning Juniper Wind 5,485,000 0 0 376,243,000 6759% EIA 11/1/2006
60563* Rock River 1 Wind 2,753,000 0 0 N/A N/A No Data 6/7/2007
60564 Wolverine Creek Wind 2,987,000 0 0 170,268,000 5600% EIA 6/7/2007
60729 Marengo Wind 7,020,000 0 0 478,702,000 6719% EIA 10/21/2008
60730 Marengo II Wind 787,000 0 0 478,702,000 60726% EIA 10/21/2008
* RPS identification numbers that end in the suffix E and show No Data in the column ʺGeneration Data Used for Comparison with Procurementʺ are utility‐certified facilities with no independently reported generation. As stated on page 47 in the RPS Eligibility Guidebook, Third Edition, the retail seller is responsible for reporting the generation data for the facilities it certifies. This reporting requirement will be satisfied through the CEC‐RPS‐Track forms. Therefore, the asterisk indicates that the facility is utility‐certified and that the procurement amount reported is accepted as reported on the RPS‐Track form.

A‐33
2009 RPS Procurement Claims
CEC RPS ID Number
1
Facility Name2 Fuel Type3
Annual Generation Procured (kWh)4
RPS Procurement Claims by Other Retail Sellers (kWh)5
Procurement Reported to Power Source Disclosure Program/ Voluntary Programs (kWh)6
Generation Data Used
for Comparison
With Procurement (kWh)7
Percent Difference Between Generation
and Procurement8
Generation Data Source9
Facilityʹs Beginning On Date10
60510 Dillard Cogeneration Facility
Biomass 2,843,000 0 0 145,580,000 5021% EIA 6/12/2006
60509 Eagle Point Conduit Hydro
302,000 0 0 17,375,000 5653% EIA 7/19/2006
60537 Copco 1 Conduit Hydro
1,386,000 0 0 79,739,000 5653% EIA 11/1/2006
60538 Copco 2 Conduit Hydro
1,702,000 0 0 97,920,000 5653% EIA 11/1/2006
60540 Iron Gate Conduit Hydro
1,958,000 0 0 112,647,000 5653% EIA 11/1/2006
60582* Fountain Green Conduit Hydro
13,000 0 0 N/A N/A No Data 10/27/2006
60583 Granite Conduit Hydro
128,000 0 0 7,339,000 5634% EIA 10/27/2006
60584* Gunlock Conduit Hydro
27,000 0 0 N/A N/A No Data 10/27/2006
60588* Sand Cove Conduit Hydro
23,000 0 0 N/A N/A No Data 10/27/2006
60593* Veyo Conduit Hydro
18,000 0 0 N/A N/A No Data 10/27/2006

A‐34
60594 Viva Naughton Conduit Hydro
15,000 0 0 6,656,000 44273% EIA 10/27/2006
60779* Ralphs Ranch Conduit Hydro
198,480 0 0 N/A N/A No Data 4/27/2009
60780* Bogus Creek ‐ Lower Cold Springs
Conduit Hydro
709,360 0 0 N/A N/A No Data 4/27/2009
60781* Bogus Creek ‐ Upper Cold Springs
Conduit Hydro
296,640 0 0 N/A N/A No Data 4/27/2009
60782* Luckey, Paul Conduit Hydro
287,400 0 0 N/A N/A No Data 4/27/2009
60820 Blundell I Geothermal 3,404,000 0 0 279,121,000 8100% EIA 5/1/2009
60821 Blundell II Geothermal 1,446,000 0 0 279,121,000 19203% EIA 5/1/2009
60507 Clearwater 1 Small Hydro
621,000 0 0 96,210,000 15393% EAO 7/19/2006
60508 Clearwater 2 Small Hydro
730,000 0 0 41,993,000 5652% EIA 7/19/2006
60513 Fish Creek Small Hydro
581,000 0 0 33,450,000 5657% EIA 7/19/2006
60514 Prospect 3 Small Hydro
619,000 0 0 35,639,000 5658% EIA 7/19/2006
60515 Slide Creek Small Hydro
1,397,000 0 0 80,364,000 5653% EIA 7/19/2006
60516 Soda Springs Small Hydro
888,000 0 0 51,112,000 5656% EIA 7/19/2006
60517 Wallowa Falls Small Hydro
116,000 0 0 6,656,000 5638% EIA 7/19/2006
60522 Bend Small Hydro
55,000 0 0 3,169,000 5662% EIA 10/19/2006

A‐35
60523 Condit Small Hydro
1,421,637 0 0 81,802,000 5654% EIA 10/19/2006
60524 Eastside Small Hydro
133,000 0 0 7,656,000 5656% EIA 10/19/2006
60530 Prospect 1 Small Hydro
504,000 0 0 29,008,000 5656% EIA 10/19/2006
60531 Prospect 4 Small Hydro
41,000 0 0 2,379,000 5702% EIA 10/19/2006
60532* Westside Small Hydro
18,769 0 0 N/A N/A No Data 10/19/2006
60539 Fall Creek Small Hydro
255,000 0 0 14,701,000 5665% EIA 11/1/2006
60578 Ashton Small Hydro
586,000 0 0 33,735,000 5657% EIA 10/27/2006
60579 Big Fork Small Hydro
504,000 0 0 28,977,000 5649% EIA 10/27/2006
60581 Cutler Small Hydro
1,547,000 0 0 88,528,000 5623% EIA 10/27/2006
60585 Oneida Small Hydro
579,000 0 0 33,079,000 5613% EIA 10/27/2006
60586* Paris Small Hydro
49,000 0 0 N/A N/A No Data 10/27/2006
60587 Pioneer Small Hydro
429,000 0 0 24,695,000 5656% EIA 10/27/2006
60589 Snake Creek Small Hydro
62,000 0 0 3,588,000 5687% EIA 10/27/2006
60590 Soda Small Hydro
216,000 0 0 11,824,000 5374% EIA 10/27/2006
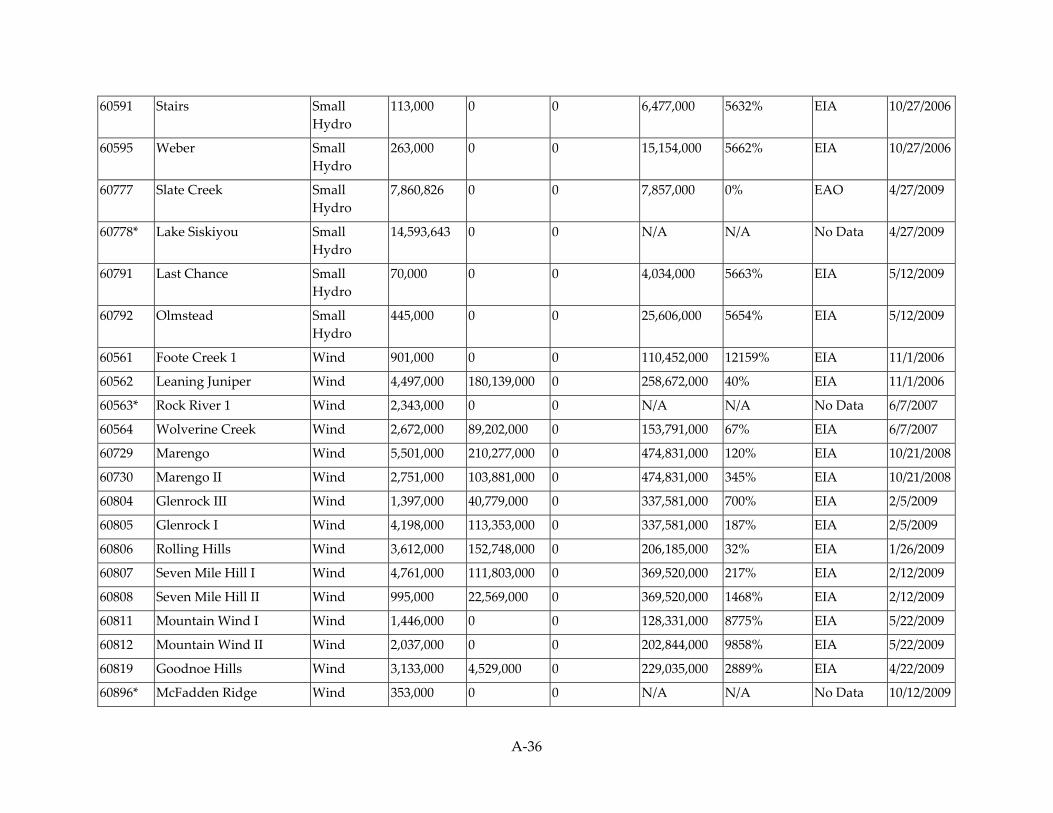
A‐36
60591 Stairs Small Hydro
113,000 0 0 6,477,000 5632% EIA 10/27/2006
60595 Weber Small Hydro
263,000 0 0 15,154,000 5662% EIA 10/27/2006
60777 Slate Creek Small Hydro
7,860,826 0 0 7,857,000 0% EAO 4/27/2009
60778* Lake Siskiyou Small Hydro
14,593,643 0 0 N/A N/A No Data 4/27/2009
60791 Last Chance Small Hydro
70,000 0 0 4,034,000 5663% EIA 5/12/2009
60792 Olmstead Small Hydro
445,000 0 0 25,606,000 5654% EIA 5/12/2009
60561 Foote Creek 1 Wind 901,000 0 0 110,452,000 12159% EIA 11/1/2006
60562 Leaning Juniper Wind 4,497,000 180,139,000 0 258,672,000 40% EIA 11/1/2006
60563* Rock River 1 Wind 2,343,000 0 0 N/A N/A No Data 6/7/2007
60564 Wolverine Creek Wind 2,672,000 89,202,000 0 153,791,000 67% EIA 6/7/2007
60729 Marengo Wind 5,501,000 210,277,000 0 474,831,000 120% EIA 10/21/2008
60730 Marengo II Wind 2,751,000 103,881,000 0 474,831,000 345% EIA 10/21/2008
60804 Glenrock III Wind 1,397,000 40,779,000 0 337,581,000 700% EIA 2/5/2009
60805 Glenrock I Wind 4,198,000 113,353,000 0 337,581,000 187% EIA 2/5/2009
60806 Rolling Hills Wind 3,612,000 152,748,000 0 206,185,000 32% EIA 1/26/2009
60807 Seven Mile Hill I Wind 4,761,000 111,803,000 0 369,520,000 217% EIA 2/12/2009
60808 Seven Mile Hill II Wind 995,000 22,569,000 0 369,520,000 1468% EIA 2/12/2009
60811 Mountain Wind I Wind 1,446,000 0 0 128,331,000 8775% EIA 5/22/2009
60812 Mountain Wind II Wind 2,037,000 0 0 202,844,000 9858% EIA 5/22/2009
60819 Goodnoe Hills Wind 3,133,000 4,529,000 0 229,035,000 2889% EIA 4/22/2009
60896* McFadden Ridge Wind 353,000 0 0 N/A N/A No Data 10/12/2009

A‐37
60899* High Plains Wind 1,263,000 0 0 N/A N/A No Data 9/28/2009
* RPS identification numbers that end in the suffix E and show No Data in the column ʺGeneration Data Used for Comparison with Procurementʺ are utility‐certified facilities with no independently reported generation. As stated on page 47 in the RPS Eligibility Guidebook, Third Edition, the retail seller is responsible for reporting the generation data for the facilities it certifies. This reporting requirement will be satisfied through the CEC‐RPS‐Track forms. Therefore, the asterisk indicates that the facility is utility‐certified and that the procurement amount reported is accepted as reported on the RPS‐Track form.
2010 RPS Procurement Claims
CEC RPS ID
Number1 Facility Name2 Fuel Type3
Annual Generation Procured (kWh)4
RPS Procurement Claims by Other Retail Sellers (kWh)5
Procurement Reported to Power Source Disclosure Program/ Voluntary Programs (kWh)6
Generation Data Used
for Comparison
With Procurement (kWh)7
Percent Difference Between Generation
and Procurement8
Generation Data Source9
Facilityʹs Beginning On Date10
60501 Weed Generator Project Biomass 303,000 0 0 302,493 0% RPS 5/26/2006
60510 Dillard Cogeneration Facility
Biomass 2,851,000 0 0 150,961,000 5195% EIA 6/12/2006
60509* Eagle Point Conduit Hydro
291,000 0 0 N/A N/A No Data 7/19/2006
60537 Copco 1 Conduit Hydro
1,142,000 0 0 67,544,000 5815% EAO 11/1/2006
60538 Copco 2 Conduit Hydro
1,501,000 0 0 88,801,010 5816% EAO 11/1/2006
60540* Iron Gate Conduit Hydro
1,627,000 0 0 N/A N/A No Data 11/1/2006
60582* Fountain Green Conduit Hydro
11,000 0 0 N/A N/A No Data 10/27/2006
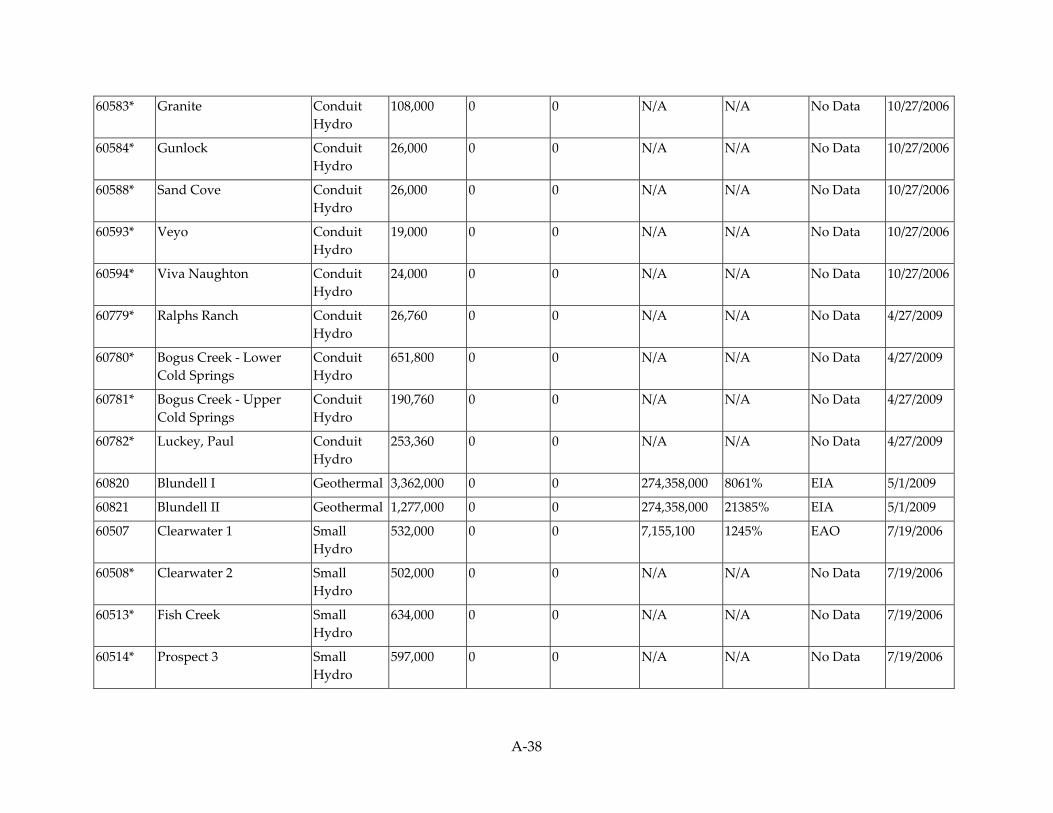
A‐38
60583* Granite Conduit Hydro
108,000 0 0 N/A N/A No Data 10/27/2006
60584* Gunlock Conduit Hydro
26,000 0 0 N/A N/A No Data 10/27/2006
60588* Sand Cove Conduit Hydro
26,000 0 0 N/A N/A No Data 10/27/2006
60593* Veyo Conduit Hydro
19,000 0 0 N/A N/A No Data 10/27/2006
60594* Viva Naughton Conduit Hydro
24,000 0 0 N/A N/A No Data 10/27/2006
60779* Ralphs Ranch Conduit Hydro
26,760 0 0 N/A N/A No Data 4/27/2009
60780* Bogus Creek ‐ Lower Cold Springs
Conduit Hydro
651,800 0 0 N/A N/A No Data 4/27/2009
60781* Bogus Creek ‐ Upper Cold Springs
Conduit Hydro
190,760 0 0 N/A N/A No Data 4/27/2009
60782* Luckey, Paul Conduit Hydro
253,360 0 0 N/A N/A No Data 4/27/2009
60820 Blundell I Geothermal 3,362,000 0 0 274,358,000 8061% EIA 5/1/2009
60821 Blundell II Geothermal 1,277,000 0 0 274,358,000 21385% EIA 5/1/2009
60507 Clearwater 1 Small Hydro
532,000 0 0 7,155,100 1245% EAO 7/19/2006
60508* Clearwater 2 Small Hydro
502,000 0 0 N/A N/A No Data 7/19/2006
60513* Fish Creek Small Hydro
634,000 0 0 N/A N/A No Data 7/19/2006
60514* Prospect 3 Small Hydro
597,000 0 0 N/A N/A No Data 7/19/2006

A‐39
60515* Slide Creek Small Hydro
1,337,000 0 0 N/A N/A No Data 7/19/2006
60516* Soda Springs Small Hydro
877,000 0 0 N/A N/A No Data 7/19/2006
60517* Wallowa Falls Small Hydro
134,000 0 0 N/A N/A No Data 7/19/2006
60522* Bend Small Hydro
41,000 0 0 N/A N/A No Data 10/19/2006
60523* Condit Small Hydro
1,609,885 0 0 N/A N/A No Data 10/19/2006
60524* Eastside Small Hydro
74,000 0 0 N/A N/A No Data 10/19/2006
60530* Prospect 1 Small Hydro
380,000 0 0 N/A N/A No Data 10/19/2006
60531* Prospect 4 Small Hydro
66,000 0 0 N/A N/A No Data 10/19/2006
60532* Westside Small Hydro
5,309 0 0 N/A N/A No Data 10/19/2006
60539* Fall Creek Small Hydro
187,000 0 0 N/A N/A No Data 11/1/2006
60578* Ashton Small Hydro
384,000 0 0 N/A N/A No Data 10/27/2006
60579* Big Fork Small Hydro
545,000 0 0 N/A N/A No Data 10/27/2006
60581* Cutler Small Hydro
853,000 0 0 N/A N/A No Data 10/27/2006
60585* Oneida Small Hydro
482,000 0 0 N/A N/A No Data 10/27/2006

A‐40
60586* Paris Small Hydro
38,000 0 0 N/A N/A No Data 10/27/2006
60587* Pioneer Small Hydro
262,000 0 0 N/A N/A No Data 10/27/2006
60589* Snake Creek Small Hydro
52,000 0 0 N/A N/A No Data 10/27/2006
60590* Soda Small Hydro
236,000 0 0 N/A N/A No Data 10/27/2006
60591* Stairs Small Hydro
94,000 0 0 N/A N/A No Data 10/27/2006
60595* Weber Small Hydro
259,000 0 0 N/A N/A No Data 10/27/2006
60777 Slate Creek Small Hydro
15,289,000 0 0 15,766,000 3% EAO 4/27/2009
60778* Lake Siskiyou Small Hydro
22,983,000 0 0 N/A N/A No Data 4/27/2009
60791* Last Chance Small Hydro
55,000 0 0 N/A N/A No Data 5/12/2009
60792* Olmstead Small Hydro
312,000 0 0 N/A N/A No Data 5/12/2009
60561* Foote Creek 1 Wind 945,000 0 0 N/A N/A No Data 11/1/2006
60562 Leaning Juniper Wind 3,780,000 161,057,000 0 223,558,000 36% EIA 11/1/2006
60563* Rock River 1 Wind 2,337,000 0 0 N/A N/A No Data 6/7/2007
60564* Wolverine Creek Wind 2,741,000 60,173,000 0 N/A N/A No Data 6/7/2007

A‐41
60729* Marengo Wind 5,595,000 232,421,000 0 N/A N/A No Data 10/21/2008
60730* Marengo II Wind 2,798,000 107,288,000 0 N/A N/A No Data 10/21/2008
60804 Glenrock III Wind 1,690,000 48,139,000 0 387,908,000 678% EIA 2/5/2009
60805 Glenrock I Wind 4,868,000 156,395,000 0 387,908,000 141% EIA 2/5/2009
60806 Rolling Hills Wind 4,272,000 210,868,000 0 252,669,000 17% EIA 1/26/2009
60807 Seven Mile Hill I Wind 5,480,000 150,033,000 0 391,845,000 152% EIA 2/12/2009
60808 Seven Mile Hill II Wind 1,145,000 47,820,000 0 391,845,000 700% EIA 2/12/2009
60811 Mountain Wind I Wind 2,526,000 0 0 149,424,000 5815% EIA 5/22/2009
60812 Mountain Wind II Wind 3,416,000 0 0 202,072,000 5815% EIA 5/22/2009
60819 Goodnoe Hills Wind 3,589,000 150,016,000 0 212,268,000 38% EIA 4/22/2009
60896* McFadden Ridge Wind 1,308,000 0 0 N/A N/A No Data 10/12/2009
60899* High Plains Wind 4,351,000 0 0 N/A N/A No Data 9/28/2009
60975* Chevron Casper Wind Farm
Wind 652,000 0 0 N/A N/A No Data 1/19/2010
61017* Campbell Hill ‐ Three Buttes
Wind 5,072,000 0 0 N/A N/A No Data 1/7/2010

A‐42
61188* Dunlap I Wind 1,732,000 0 0 N/A N/A No Data 9/1/2010
61199* Top of the World Wind 3,192,000 0 0 N/A N/A No Data 9/1/2010
* RPS identification numbers that end in the suffix E and show No Data in the column ʺGeneration Data Used for Comparison with Procurementʺ are utility‐certified facilities with no independently reported generation. As stated on page 47 in the RPS Eligibility Guidebook, Third Edition, the retail seller is responsible for reporting the generation data for the facilities it certifies. This reporting requirement will be satisfied through the CEC‐RPS‐Track forms. Therefore, the asterisk indicates that the facility is utility‐certified and that the procurement amount reported is accepted as reported on the RPS‐Track form.

A‐43
Sierra Pacific Power RPS Procurement Claims Analysis 2008 RPS Procurement Claims
CEC RPS ID Number1
Facility Name2 Fuel Type3
Annual Generation Procured (kWh)4
RPS Procurement Claims by Other Retail Sellers (kWh)5
Procurement Reported to Power Source Disclosure Program/ Voluntary Programs (kWh)6
Generation Data Used
for Comparison
With Procurement (kWh)7
Percent Difference Between Generation
and Procurement
8
Generation Data Source9
Facilityʹs Beginning On Date10
60677 Beowawe Power, LLC Geothermal 9,535,000 0 19,814,485 111,811,000 281% EIA 2/19/2008
60674 Brady Geothermal 6,797,000 0 16,782,753 82,487,000 250% EIA 2/19/2008
60668 Empire Farms Geothermal 1,696,000 0 0 19,761,000 1065% EIA 2/19/2008
60704 Fleish Hydroelectric Plant
Conduit Hydro
926,000 0 756,158 8,494,000 405% EIA 2/26/2008
60696* Frank Hooper Conduit Hydro
136,999 0 465,229 N/A N/A No Data 2/26/2008
60764 Galena 3 Geothermal 13,141,000 0 12,307,983 144,007,000 466% EIA 2/27/2009
60671 Homestretch I Geothermal 274,000 0 559,160 6,211,000 645% EIA 2/19/2008
60666 Homestretch II Geothermal 271,000 0 674,886 6,211,000 557% EIA 2/19/2008
60765 Nevada Solar One Solar Thermal
3,867,000 0 17,621,620 123,598,000 475% EIA 2/26/2009
60664 Richard Burdette Geothermal Plant
Geothermal 14,906,000 0 19,135,533 175,477,000 415% EIA 2/20/2008
60672 Soda Lake 1 & 2 Geothermal 5,209,000 0 13,019,688 60,909,000 234% EIA 2/19/2008
60570 SPI ‐ Loyalton Biomass 6,543,300 0 11,484,726 78,778,000 337% EAO 4/11/2007
60673 Steamboat 1A Geothermal 21,000 0 229,316 250,316 0% Inv 2/19/2008

A‐44
60676 Steamboat 2 Geothermal 5,212,000 0 7,444,296 60,870,000 381% EIA 2/19/2008
60675 Steamboat 3 Geothermal 6,946,000 0 14,534,368 80,791,000 276% EIA 2/19/2008
60667 Steamboat Hills Geothermal 4,525,000 0 3,653,881 53,102,000 549% EIA 2/19/2008
60669 Stillwater 1 Geothermal 3,117,094 0 11,867,071 36,550,000 144% EIA 2/19/2008
60705 Verdi Hydroelectric Plant
Conduit Hydro
1,473,000 0 2,008,482 17,275,000 396% EIA 2/26/2008
60706 Washoe Hydroelectric Plant
Conduit Hydro
1,089,000 0 688,799 3,604,000 103% EIA 2/26/2008
* RPS identification numbers that end in the suffix E and show No Data in the column ʺGeneration Data Used for Comparison with Procurementʺ are utility‐certified facilities with no independently reported generation. As stated on page 47 in the RPS Eligibility Guidebook, Third Edition, the retail seller is responsible for reporting the generation data for the facilities it certifies. This reporting requirement will be satisfied through the CEC‐RPS‐Track forms. Therefore, the asterisk indicates that the facility is utility‐certified and that the procurement amount reported is accepted as reported on the RPS‐Track form.
2009 RPS Procurement Claims
CEC RPS ID
Number1 Facility Name2 Fuel Type3
Annual Generation Procured (kWh)4
RPS Procurement Claims by Other Retail Sellers (kWh)5
Procurement Reported to Power Source Disclosure Program/ Voluntary Programs (kWh)6
Generation Data Used
for Comparison
With Procurement (kWh)7
Percent Difference Between Generation
and Procurement
8
Generation Data Source9
Facilityʹs Beginning On Date10
60664 Richard Burdette Geothermal Plant
Geothermal 22,325,000 0 137,118,894 159,972,000 0% EIA 2/20/2008
60667 Steamboat Hills Geothermal 10,701,000 0 64,026,215 74,720,000 0% EIA 2/19/2008
60674 Brady Geothermal 11,843,000 0 71,289,356 84,198,000 1% EIA 2/19/2008
60675 Steamboat 3 Geothermal 16,172,000 0 97,594,333 112,890,000 ‐1% EIA 2/19/2008

A‐45
60676 Steamboat 2 Geothermal 15,047,000 0 90,434,549 105,103,000 0% EIA 2/19/2008
60677 Beowawe Power, LLC Geothermal 15,548,000 0 95,492,263 111,043,000 0% EIA 2/19/2008
60764 Galena 3 Geothermal 25,710,000 0 157,904,169 183,736,000 0% EIA 2/27/2009
2010 RPS Procurement Claims
CEC RPS ID
Number1 Facility Name2 Fuel Type3
Annual Generation Procured (kWh)4
RPS Procurement Claims by Other Retail Sellers (kWh)5
Procurement Reported to Power Source Disclosure Program/ Voluntary Programs (kWh)6
Generation Data Used
for Comparison
With Procurement (kWh)7
Percent Difference Between Generation
and Procurement
8
Generation Data Source9
Facilityʹs Beginning On Date10
60664 Richard Burdette Geothermal Plant
Geothermal 19,902,000 0 144,679,850 164,582,868 0% RPS 2/20/2008
60667* Steamboat Hills Geothermal 9,465,000 0 68,809,148 N/A N/A No Data 2/19/2008
60674 Brady Geothermal 9,154,000 0 66,542,748 75,697,000 0% EIA 2/19/2008
60675* Steamboat 3 Geothermal 13,457,000 0 97,823,655 N/A N/A No Data 2/19/2008
60676* Steamboat 2 Geothermal 12,787,000 0 92,959,866 N/A N/A No Data 2/19/2008
60677 Beowawe Power, LLC Geothermal 13,080,000 0 95,090,709 108,170,714 0% RPS 2/19/2008
60764 Galena 3 Geothermal 21,654,000 0 157,413,047 179,067,000 0% EIA 2/27/2009

A‐46
Pacific Gas and Electric RPS Procurement Claims Analysis 2008 RPS Procurement Claims
CEC RPS ID
Number1 Facility Name2 Fuel Type3
Annual Generation Procured (kWh)4
RPS Procurement Claims by Other Retail Sellers (kWh)5
Procurement Reported to Power Source Disclosure Program/ Voluntary Programs (kWh)6
Generation Data Used
for Comparison
With Procurement (kWh)7
Percent Difference Between Generation
and Procurement8
Generation Data Source9
Facilityʹs Beginning On Date10
60073 Burney Forest Products Biomass 237,785,486 0 0 237,786,876 0% ERFP 12/17/2004
60074 Collins Pine Biomass 30,674,832 0 0 47,020,000 53% EIA 12/17/2004
60076 DG Fairhaven Power Co Biomass 114,422,898 0 0 114,792,000 0% EIA 12/17/2004
60077 Honey Lake Power Company
Biomass 173,671,043 0 0 173,673,000 0% EAO 12/17/2004
60078 Mendota Biomass Power Ltd
Biomass 174,237,901 0 0 172,148,000 ‐1% EIA 12/17/2004
60079 Ogden Power Pacific, Inc. (Burney)
Biomass 79,978,021 0 0 79,976,000 0% EIA 12/17/2004
60080 Ogden Power Pacific, Inc. (CS)
Biomass 118,540,201 0 0 118,460,000 0% EIA 12/17/2004
60081 Ogden Power Pacific, Inc. (Mt Lsn)
Biomass 76,756,112 0 0 76,821,000 0% EAO 12/17/2004
60082 Ogden Power Pacific, Inc. (Oroville)
Biomass 124,000,226 0 0 124,000,000 0% EIA 12/17/2004
60083 Pacific Lumber Co. Biomass 65,428,073 0 0 82,042,000 25% EIA 12/17/2004
60084 Rio Bravo Fresno Biomass 141,215,463 0 0 141,562,000 0% EIA 12/17/2004
60085 Rio Bravo Rocklin Biomass 162,786,450 0 0 163,041,000 0% EAO 12/17/2004

A‐47
60086 SPI Anderson I Biomass 5,959,754 0 0 35,905,520 502% EIA 12/17/2004
60087 SPI Burney Biomass 96,930,037 0 0 114,988,000 19% EAO 12/17/2004
60088 SPI Lincoln Biomass 80,555,972 0 0 115,895,000 44% EAO 12/17/2004
60089 SPI Quincy Biomass 141,862,401 0 0 192,287,592 36% EIA 12/17/2004
60091 Thermal Energy Development Corp.
Biomass 148,884,702 0 0 150,382,003 1% EIA 12/17/2004
60092 Wadham Energy Limited Partnership
Biomass 130,947,546 0 0 131,110,000 0% EIA 12/17/2004
60094 Wheelabrator Shasta Energy Co
Biomass 395,343,478 0 0 395,399,000 0% EAO 12/17/2004
60095 Woodland Biomass Power, Ltd.
Biomass 166,388,324 0 0 165,312,000 ‐1% EIA 12/17/2004
60272 Community Renewable Energy Service
Biomass 80,253,732 0 0 80,935,000 1% EAO 12/17/2004
60273 Madera Power Biomass 18,238,000 0 0 19,367,000 6% EAO 12/17/2004
60274 Sierra Power Corporation
Biomass 32,886,058 0 0 36,526,000 11% EIA 12/17/2004
60471 Chowchilla II Biomass 2,446,000 14,678,000 0 20,702,000 21% EAO 7/25/2005
60492 Big Valley Power Biomass 30,483,199 0 0 30,483,921 0% RPS 2/14/2006
606371 Humboldt Bay Power Plant Unit 1
Biomethane 325,000 0 0 521,879,000 160478% EAO 9/24/2007
606381 Humboldt Bay Power Plant Unit 2
Biomethane 428,000 0 0 521,879,000 121834% EAO 9/24/2007
60198 Calaveras Yuba Hydro #1
Conduit Hydro
394,174 0 0 450,827 14% RPS 12/17/2004
60199 Calaveras Yuba Hydro #2
Conduit Hydro
371,052 0 0 376,681 2% RPS 12/17/2004
60200 Calaveras Yuba Hydro Conduit 212,561 0 0 212,730 0% RPS 12/17/2004

A‐48
#3 Hydro
60271 Etiwanda Small Conduit Hydroelectric Power Plant
Conduit Hydro
57,392,000 0 0 61,039,000 6% EIA 12/17/2004
60607 Nacimiento Hydroelectric Project
Conduit Hydro
2,051,000 0 0 14,316,000 598% EIA 5/29/2007
60567* Buckeye Power Plant Conduit Hydro
361,000 0 0 N/A N/A No Data 4/23/2007
60108 Monterey Regional Water
Digester Gas
351,461 0 0 7,948,000 2161% EIA 12/17/2004
60101* MWWTP Power Generation Station
Digester Gas
3,761,790 0 0 N/A N/A No Data 12/17/2004
60190* City Of Watsonville Digester Gas
33,287 0 0 N/A N/A No Data 12/17/2004
60191* Langerwerf Dairy Digester Gas
371,321 0 0 N/A N/A No Data 12/17/2004
60002 Calpine Geothermal Unit 5/6
Geothermal 681,677,363 0 0 681,675,000 0% EAO 6/14/2004
60003 Calpine Geothermal Unit 7‐8
Geothermal 600,217,079 0 0 600,706,000 0% EAO 6/14/2004
60004 Calpine Geothermal Unit 12
Geothermal 33,348,300 347,825,300 7,986 389,217,000 2% EAO 6/14/2004
60005 Calpine Geothermal Unit 13
Geothermal 379,416,765 15,491,500 22,053 435,641,000 10% EAO 6/14/2004
60006 Calpine Geothermal Unit 16
Geothermal 4,995,643 419,460,600 0 424,557,000 0% EAO 6/14/2004
60007 Calpine Geothermal Unit 17
Geothermal 386,000 426,215,150 0 427,360,000 0% EAO 6/14/2004

A‐49
60008 Calpine Geothermal Unit 18
Geothermal 336,568,511 49,958,000 19,803 406,347,000 5% EAO 6/14/2004
60009 Calpine Geothermal Unit 20
Geothermal 166,042,317 90,252,700 83,087 358,231,000 40% EAO 6/14/2004
60010 Sonoma/Calpine Geyser Geothermal 48,071,000 31,192,000 260,016 341,543,000 329% EAO 6/14/2004
60025 Calpine Geothermal Unit 11
Geothermal 6,593,000 437,637,680 46,256 512,842,000 15% EAO 6/14/2004
60026 Calpine Geothermal Unit 14
Geothermal 1,053,023 423,988,070 0 425,088,000 0% EAO 6/14/2004
60111 Amedee Geothermal Venture I
Geothermal 4,903,254 0 0 4,903,655 0% Inv 12/17/2004
60112 Bear Canyon Power Plant
Geothermal 87,350,607 0 0 115,664,000 32% EIA 12/17/2004
60113 Calpine Geysers Company (KW #2)
Geothermal 27,998,244 0 0 115,663,000 313% EAO 12/17/2004
60114 West Ford Flat Power Plant
Geothermal 209,613,708 0 0 209,614,000 0% EAO 12/17/2004
60115 Aidlin Power Plant Geothermal 137,022,139 0 0 136,980,000 0% EIA 12/17/2004
60117 Calistoga Power Plant Geothermal 511,338,494 30,441,000 0 555,134,000 2% EIA 12/17/2004
60193* Wineagle Developers 1 Geothermal 2,702,082 0 0 N/A N/A No Data 12/17/2004
60604 Bottle Rock Power Plant Geothermal 98,314,097 0 0 99,625,713 1% RPS 7/26/2007
600962 Waste Management Renewable Energy
Landfill Gas 46,511,218 0 0 48,149,000 4% EIA 12/17/2004
60098 Covanta Pacific Power (Salinas)
Landfill Gas 7,727,334 0 0 7,999,000 4% EIA 12/17/2004
60100* Covanta Pacific Power (Stockton)
Landfill Gas 5,086,335 0 0 N/A N/A No Data 12/17/2004

A‐50
60102 Gas Recovery System‐ American Canyon
Landfill Gas 7,424,503 0 0 7,403,000 0% EIA 12/17/2004
60103 Gas Recovery System‐ Guadalupe
Landfill Gas 17,826,090 0 0 17,818,000 0% EIA 12/17/2004
60104 Gas Recovery System‐ Menlo Park
Landfill Gas 10,403,584 0 0 10,405,000 0% EIA 12/17/2004
60105 Gas Recovery System‐ Newby Island II
Landfill Gas 32,396,643 0 0 32,412,000 0% EAO 12/17/2004
60106* Gas Recovery System‐ Santa Cruz
Landfill Gas 5,202,629 0 0 N/A N/A No Data 12/17/2004
60107 Monterey Regional Waste Mgt Dist
Landfill Gas 12,544,887 12,075,000 0 31,573,000 28% EIA 12/17/2004
60110 Stanislaus Resource Recovery Facility
MSW, Combustion
119,449,155 0 0 119,748,000 0% EAO 12/17/2004
60255* Robin Williams Solar Power Gen
Photovoltaic 326 0 0 N/A N/A No Data 12/17/2004
60634* AT&T Park Solar Arrays Photovoltaic 160,378 0 0 N/A N/A No Data 9/24/2007
60635* San Francisco Service Center Solar Array 1
Photovoltaic 103,280 0 0 N/A N/A No Data 9/24/2007
60636* San Francisco Service Center Solar Array 2
Photovoltaic 181,152 0 0 N/A N/A No Data 9/24/2007
60032 A.G. Wishon PH Small Hydro
46,168,435 0 0 49,418,000 7% EIA 12/21/2004
60033 Alta PH Small Hydro
3,585,352 0 0 3,563,000 ‐1% EIA 12/21/2004
60034 Centerville PH Small Hydro
11,726,825 0 0 11,727,000 0% EIA 12/21/2004
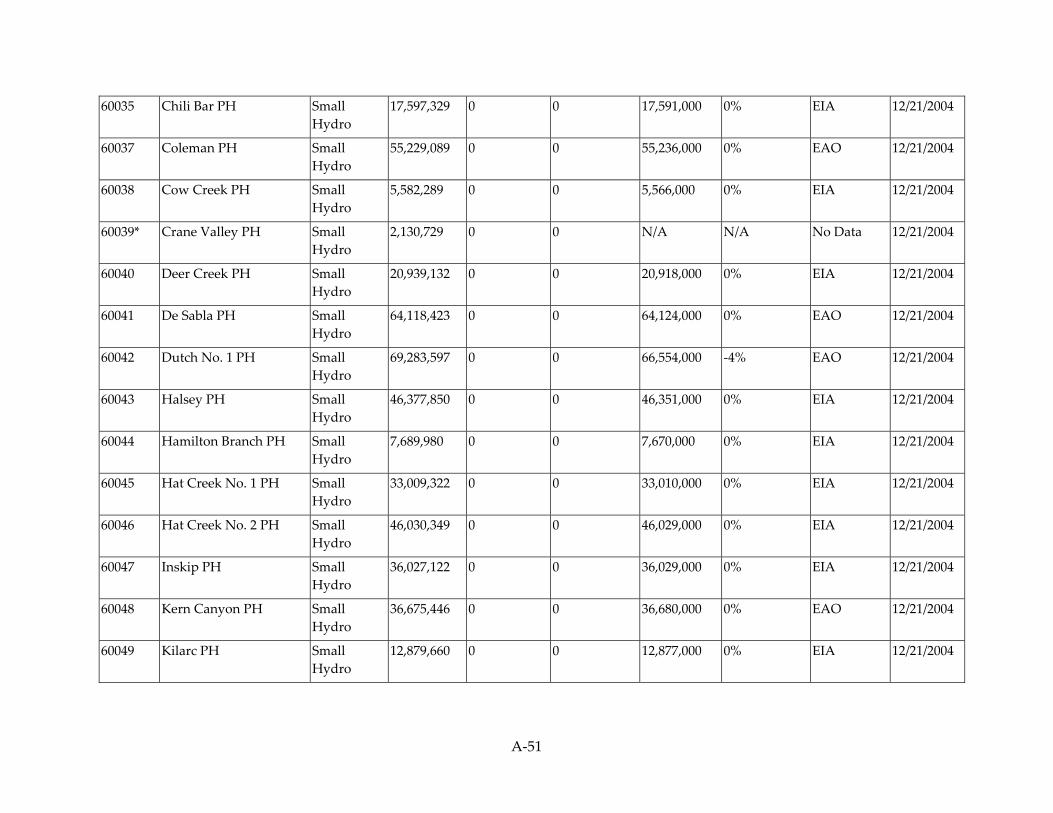
A‐51
60035 Chili Bar PH Small Hydro
17,597,329 0 0 17,591,000 0% EIA 12/21/2004
60037 Coleman PH Small Hydro
55,229,089 0 0 55,236,000 0% EAO 12/21/2004
60038 Cow Creek PH Small Hydro
5,582,289 0 0 5,566,000 0% EIA 12/21/2004
60039* Crane Valley PH Small Hydro
2,130,729 0 0 N/A N/A No Data 12/21/2004
60040 Deer Creek PH Small Hydro
20,939,132 0 0 20,918,000 0% EIA 12/21/2004
60041 De Sabla PH Small Hydro
64,118,423 0 0 64,124,000 0% EAO 12/21/2004
60042 Dutch No. 1 PH Small Hydro
69,283,597 0 0 66,554,000 ‐4% EAO 12/21/2004
60043 Halsey PH Small Hydro
46,377,850 0 0 46,351,000 0% EIA 12/21/2004
60044 Hamilton Branch PH Small Hydro
7,689,980 0 0 7,670,000 0% EIA 12/21/2004
60045 Hat Creek No. 1 PH Small Hydro
33,009,322 0 0 33,010,000 0% EIA 12/21/2004
60046 Hat Creek No. 2 PH Small Hydro
46,030,349 0 0 46,029,000 0% EIA 12/21/2004
60047 Inskip PH Small Hydro
36,027,122 0 0 36,029,000 0% EIA 12/21/2004
60048 Kern Canyon PH Small Hydro
36,675,446 0 0 36,680,000 0% EAO 12/21/2004
60049 Kilarc PH Small Hydro
12,879,660 0 0 12,877,000 0% EIA 12/21/2004

A‐52
60050 Lime Saddle PH Small Hydro
4,814,736 0 0 4,809,000 0% EAO 12/21/2004
60051 Merced Falls PH Small Hydro
8,976,055 0 0 8,926,000 ‐1% EIA 12/21/2004
60052 Narrows No. 1 PH Small Hydro
41,871,035 0 0 41,813,000 0% EAO 12/21/2004
60053 Newcastle PH Small Hydro
17,731,051 0 0 17,731,000 0% EIA 12/21/2004
60054 Phoenix PH Small Hydro
10,416,169 0 0 10,412,000 0% EIA 12/21/2004
60055 Potter Valley PH Small Hydro
23,084,640 0 0 23,084,000 0% EIA 12/21/2004
60056* San Joaquin No. 1‐A PH Small Hydro
3,249,000 0 0 N/A N/A No Data 12/21/2004
60057 San Joaquin No. 2 PH Small Hydro
6,335,537 0 0 6,337,000 0% EIA 12/21/2004
60058 San Joaquin No. 3 PH Small Hydro
9,173,008 0 0 9,175,000 0% EIA 12/21/2004
60059 South PH Small Hydro
43,108,822 0 0 43,113,000 0% EIA 12/21/2004
60060 Spaulding No. 1 PH Small Hydro
21,337,034 0 0 24,825,000 16% EIA 12/21/2004
60061 Spaulding No. 2 PH Small Hydro
12,101,889 0 0 12,158,000 0% EAO 12/21/2004
60062 Spaulding No. 3 PH Small Hydro
26,291,265 0 0 26,285,000 0% EAO 12/21/2004
60063 Spring Gap PH Small Hydro
33,873,181 0 0 33,866,000 0% EAO 12/21/2004

A‐53
60064 Toadtown PH Small Hydro
3,507,251 0 0 3,483,000 ‐1% EIA 12/21/2004
60065 Tule PH Small Hydro
20,388,860 0 0 20,369,000 0% EIA 12/21/2004
60066 Volta No. 1 PH Small Hydro
36,723,201 0 0 36,727,000 0% EIA 12/21/2004
60067 Volta No. 2 PH Small Hydro
3,755,922 0 0 3,755,000 0% EAO 12/21/2004
60068 West Point PH Small Hydro
63,804,585 0 0 63,794,000 0% EIA 12/21/2004
60069 Wise No. 1 PH Small Hydro
75,149,677 0 0 83,102,000 11% EAO 12/21/2004
60070 Wise No. 2 PH Small Hydro
7,983,623 0 0 83,102,000 941% EAO 12/21/2004
60071 Tulloch Powerhouse Small Hydro
88,473,376 0 0 93,297,000 5% EIA 12/27/2004
60072 Beardsley Powerhouse Small Hydro
38,078,625 0 0 37,196,000 ‐2% EIA 12/27/2004
60150* American Energy, Inc. (San Luis Byp)
Small Hydro
112 0 0 N/A N/A No Data 12/17/2004
60151* American Energy, Inc (Wolfsen)
Small Hydro
1,990,712 0 0 N/A N/A No Data 12/17/2004
60152* Baker Station Associates L.P.
Small Hydro
3,329,780 0 0 N/A N/A No Data 12/17/2004
60153 Calaveras City Water District
Small Hydro
7,057,311 0 0 8,235,000 17% EAO 12/17/2004
60154 El Dorado (Montgomery Crk)
Small Hydro
6,300,908 0 0 6,302,000 0% EIA 12/17/2004
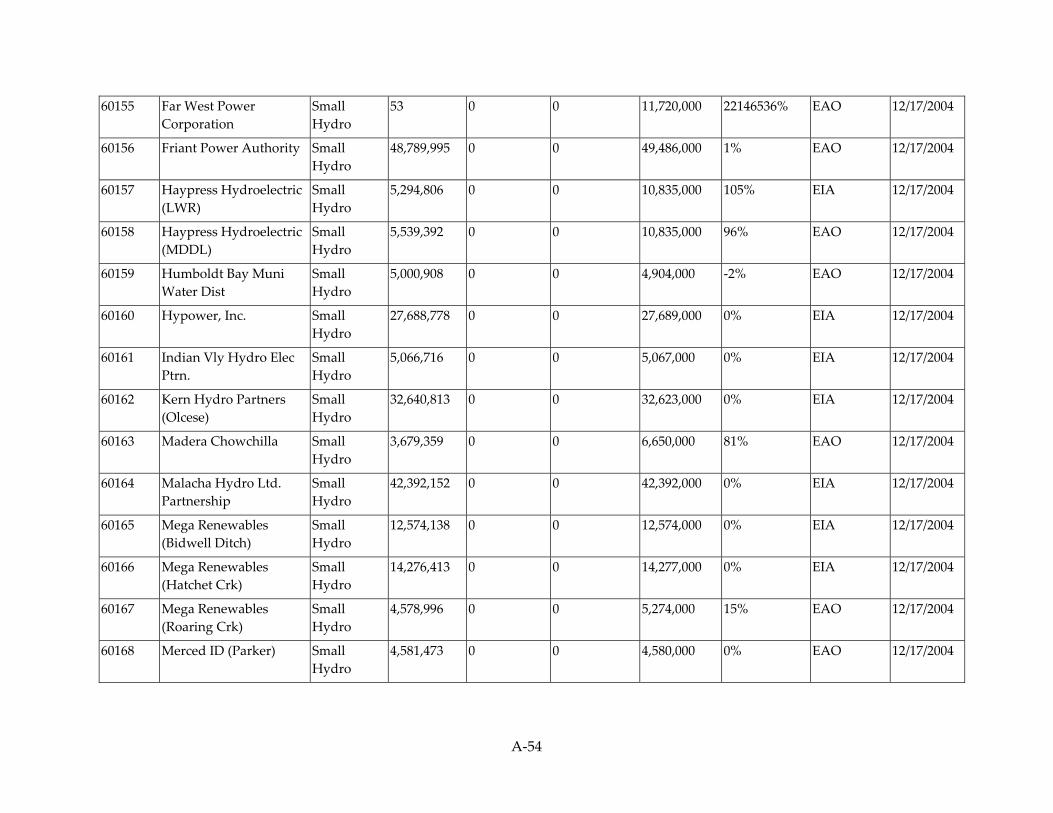
A‐54
60155 Far West Power Corporation
Small Hydro
53 0 0 11,720,000 22146536% EAO 12/17/2004
60156 Friant Power Authority Small Hydro
48,789,995 0 0 49,486,000 1% EAO 12/17/2004
60157 Haypress Hydroelectric (LWR)
Small Hydro
5,294,806 0 0 10,835,000 105% EIA 12/17/2004
60158 Haypress Hydroelectric (MDDL)
Small Hydro
5,539,392 0 0 10,835,000 96% EAO 12/17/2004
60159 Humboldt Bay Muni Water Dist
Small Hydro
5,000,908 0 0 4,904,000 ‐2% EAO 12/17/2004
60160 Hypower, Inc. Small Hydro
27,688,778 0 0 27,689,000 0% EIA 12/17/2004
60161 Indian Vly Hydro Elec Ptrn.
Small Hydro
5,066,716 0 0 5,067,000 0% EIA 12/17/2004
60162 Kern Hydro Partners (Olcese)
Small Hydro
32,640,813 0 0 32,623,000 0% EIA 12/17/2004
60163 Madera Chowchilla Small Hydro
3,679,359 0 0 6,650,000 81% EAO 12/17/2004
60164 Malacha Hydro Ltd. Partnership
Small Hydro
42,392,152 0 0 42,392,000 0% EIA 12/17/2004
60165 Mega Renewables (Bidwell Ditch)
Small Hydro
12,574,138 0 0 12,574,000 0% EIA 12/17/2004
60166 Mega Renewables (Hatchet Crk)
Small Hydro
14,276,413 0 0 14,277,000 0% EIA 12/17/2004
60167 Mega Renewables (Roaring Crk)
Small Hydro
4,578,996 0 0 5,274,000 15% EAO 12/17/2004
60168 Merced ID (Parker) Small Hydro
4,581,473 0 0 4,580,000 0% EAO 12/17/2004

A‐55
60169 Monterey County Water Res Agency
Small Hydro
12,266,280 0 0 14,452,000 18% EAO 12/17/2004
60170 Nelson Creek Power Inc. Small Hydro
2,513,787 0 0 2,444,000 ‐3% EIA 12/17/2004
60171 Nevada Power Authority
Small Hydro
8,019,714 0 0 8,067,000 1% EIA 12/17/2004
60172 NID/Combie South Small Hydro
3,256,153 0 0 3,256,000 0% EIA 12/17/2004
60173 Scotts Flat Powerhouse Small Hydro
3,142,200 0 0 3,142,000 0% EIA 12/17/2004
60175 Olsen Power Partners, Inc.
Small Hydro
3,849,664 0 0 4,175,000 8% EAO 12/17/2004
60176 Rock Creek Limited Partnership
Small Hydro
650,422 0 0 633,000 ‐3% EIA 12/17/2004
60177 Snow Mountain Hydro LLC (Burney)
Small Hydro
2,203,774 0 0 2,203,000 0% EIA 12/17/2004
60178 Snow Mountain Hydro LLC (Cove)
Small Hydro
10,966,341 0 0 10,996,000 0% EAO 12/17/2004
60179 Lost Creek 1 Small Hydro
5,930,515 0 0 5,975,000 1% EAO 12/17/2004
60180* Lost Creek 2 Small Hydro
2,823,085 0 0 N/A N/A No Data 12/17/2004
60181 Snow Mntn Hydro LLC (Ponderosa)
Small Hydro
573,281 0 0 573,000 0% EIA 12/17/2004
60182 Sonoma County Water Agency
Small Hydro
14,018,985 0 0 14,020,000 0% EIA 12/17/2004
60183 South S J ID (Frankenheimer)
Small Hydro
15,715,610 0 0 15,716,000 0% EAO 12/17/2004

A‐56
60184 South San Joaquin ID (Woodward)
Small Hydro
5,719,553 0 0 5,720,000 0% EAO 12/17/2004
60185 STS Hydropower Ltd. (Kanaka)
Small Hydro
527,219 0 0 514,000 ‐3% EIA 12/17/2004
60186 STS Hydropower Ltd. (Kekawaka)
Small Hydro
5,799,419 0 0 5,800,000 0% EIA 12/17/2004
60187 TKO Power (South Fork Bear)
Small Hydro
2,530,349 0 0 2,536,000 0% EIA 12/17/2004
60188 Tri‐Dam Authority (Sandbar)
Small Hydro
51,992,200 0 0 54,140,000 4% EIA 12/17/2004
60189 Yuba County Water Small Hydro
375,392 0 0 375,378 0% Inv 12/17/2004
60194* Arbuckle Mountain Hydro
Small Hydro
299,059 0 0 N/A N/A No Data 12/17/2004
60195* Bailey Creek Ranch Small Hydro
876,220 0 0 N/A N/A No Data 12/17/2004
60196* Bertha Wright Bertillion Small Hydro
5,226 0 0 N/A N/A No Data 12/17/2004
60197* Browns Valley ID Small Hydro
1,482,879 0 0 N/A N/A No Data 12/17/2004
60201* Canal Creek Power Plant (Reta)
Small Hydro
446,000 0 0 N/A N/A No Data 12/17/2004
60202* Charcoal Ravine Small Hydro
13,014 0 0 N/A N/A No Data 12/17/2004
60206* Digger Creek Ranch Small Hydro
2,535,660 0 0 N/A N/A No Data 12/17/2004
60207* E J M McFadden Small Hydro
264,535 0 0 N/A N/A No Data 12/17/2004
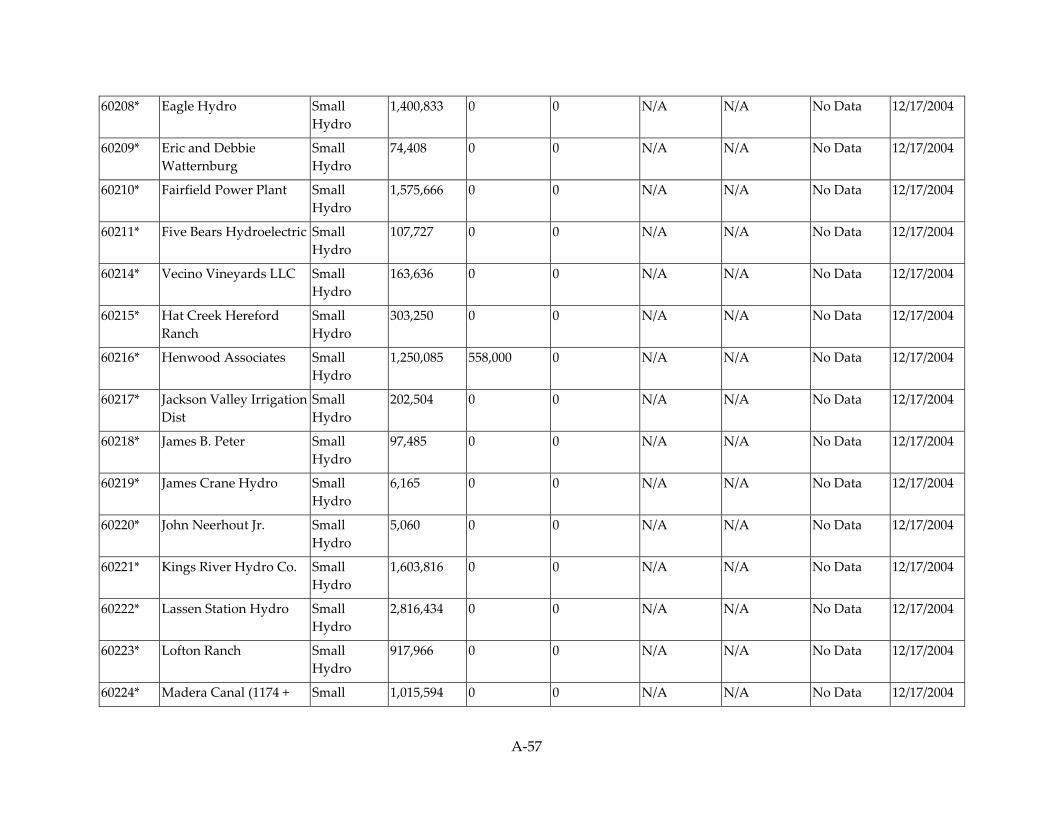
A‐57
60208* Eagle Hydro Small Hydro
1,400,833 0 0 N/A N/A No Data 12/17/2004
60209* Eric and Debbie Watternburg
Small Hydro
74,408 0 0 N/A N/A No Data 12/17/2004
60210* Fairfield Power Plant Small Hydro
1,575,666 0 0 N/A N/A No Data 12/17/2004
60211* Five Bears Hydroelectric Small Hydro
107,727 0 0 N/A N/A No Data 12/17/2004
60214* Vecino Vineyards LLC Small Hydro
163,636 0 0 N/A N/A No Data 12/17/2004
60215* Hat Creek Hereford Ranch
Small Hydro
303,250 0 0 N/A N/A No Data 12/17/2004
60216* Henwood Associates Small Hydro
1,250,085 558,000 0 N/A N/A No Data 12/17/2004
60217* Jackson Valley Irrigation Dist
Small Hydro
202,504 0 0 N/A N/A No Data 12/17/2004
60218* James B. Peter Small Hydro
97,485 0 0 N/A N/A No Data 12/17/2004
60219* James Crane Hydro Small Hydro
6,165 0 0 N/A N/A No Data 12/17/2004
60220* John Neerhout Jr. Small Hydro
5,060 0 0 N/A N/A No Data 12/17/2004
60221* Kings River Hydro Co. Small Hydro
1,603,816 0 0 N/A N/A No Data 12/17/2004
60222* Lassen Station Hydro Small Hydro
2,816,434 0 0 N/A N/A No Data 12/17/2004
60223* Lofton Ranch Small Hydro
917,966 0 0 N/A N/A No Data 12/17/2004
60224* Madera Canal (1174 + Small 1,015,594 0 0 N/A N/A No Data 12/17/2004

A‐58
84) Hydro
60225* Madera Canal (1923) Small Hydro
1,249,000 0 0 N/A N/A No Data 12/17/2004
60226* Madera Canal Station 1302
Small Hydro
706,397 0 0 N/A N/A No Data 12/17/2004
60227* Mega Hydro #1 (Clover Creek)
Small Hydro
2,823,492 0 0 N/A N/A No Data 12/17/2004
60228* Mega Hydro (Goose Valley Ranch)
Small Hydro
308,920 0 0 N/A N/A No Data 12/17/2004
60229* Mega Renewables (Silver Springs)
Small Hydro
1,578,948 0 0 N/A N/A No Data 12/17/2004
60230* Mill & Sulphur Creek Small Hydro
1,728,597 0 0 N/A N/A No Data 12/17/2004
60231* NID/Combie North Small Hydro
477,843 0 0 N/A N/A No Data 12/17/2004
60232 Orange Cove Irrigation District ‐ Friant Fishwater Release Hydroelectric Facility
Small Hydro
3,241,055 0 0 3,240,683 0% RPS 12/17/2004
60234* Placer County Water Agency
Small Hydro
3,442,917 0 0 N/A N/A No Data 12/17/2004
60236* Rock Creek Water District
Small Hydro
1,115,776 0 0 N/A N/A No Data 12/17/2004
60238 Schaads Hydro Small Hydro
450,443 0 0 450,817 0% Inv 12/17/2004
60239* Shamrock Utilities (Cedar Flat)
Small Hydro
1,059,245 0 0 N/A N/A No Data 12/17/2004
60240* Shamrock Utilities (Clover Leaf)
Small Hydro
408,250 0 0 N/A N/A No Data 12/17/2004

A‐59
60242 Sierra Energy Small Hydro
8,867 0 0 3,442,000 38720% EAO 12/17/2004
60243* South Sutter Water Small Hydro
516,447 0 0 N/A N/A No Data 12/17/2004
60244* Steve & Bonnie Tetrick Small Hydro
192,133 0 0 N/A N/A No Data 12/17/2004
60246* Sutterʹs Mill Small Hydro
669,875 0 0 N/A N/A No Data 12/17/2004
60247* Swiss America Small Hydro
325,903 0 0 N/A N/A No Data 12/17/2004
60249 Tom Benninghoven Small Hydro
74,513 0 0 N/A N/A No Data 12/17/2004
60250* Water Wheel Ranch Small Hydro
2,179,811 0 0 N/A N/A No Data 12/17/2004
60251* Youth with a Mission/Spgs Of Lv Wat
Small Hydro
160,077 0 0 N/A N/A No Data 12/17/2004
60252* Yuba County Water Agency
Small Hydro
719,114 0 0 N/A N/A No Data 12/17/2004
60263 MID (McSwain) Small Hydro
20,377,525 0 0 20,503,000 1% EIA 12/17/2004
60264 NID (Dutch Flat #2) Small Hydro
75,754,555 0 0 75,769,000 0% EIA 12/17/2004
60265 NID (Rollins) Small Hydro
57,815,414 0 0 57,824,000 0% EIA 12/17/2004
60266 Kelly Ridge Powerhouse Small Hydro
68,408,297 0 0 68,640,000 0% EIA 12/17/2004
60267 Sly Creek Powerhouse Small Hydro
21,236,975 0 0 21,196,000 0% EIA 12/17/2004

A‐60
60268 PCWA (French Meadows)
Small Hydro
31,978,703 0 0 31,979,783 0% Inv 12/17/2004
60269 PCWA (Oxbow) Small Hydro
16,064,992 0 0 15,911,000 ‐1% EAO 12/17/2004
60270 SID (Monticello) Small Hydro
40,284,134 0 0 40,235,000 0% EAO 12/17/2004
60276 Oak Flat PH Small Hydro
4,877,030 0 0 4,868,000 0% EIA 1/13/2005
60502 Three Forks Water Power Project
Small Hydro
6,199,964 0 0 6,397,540 3% RPS 3/7/2006
60030 Diablo Winds Wind 61,444,602 0 0 61,444,000 0% EIA 11/19/2004
60118 Altamont Midway Ltd Wind 11,987,686 0 0 11,872,000 ‐1% EIA 12/17/2004
60119* Altamont Power LLC (3‐4)
Wind 8,276,978 0 0 N/A N/A No Data 12/17/2004
60120* Altamont Power LLC (4‐4)
Wind 34,993,648 0 0 N/A N/A No Data 12/17/2004
60122* Altamont Power LLC (6‐4)
Wind 33,054,698 0 0 N/A N/A No Data 12/17/2004
60124 Buena Vista Wind Farm Wind 100,761,000 0 0 100,762,000 0% EIA 12/17/2004
60125* Green Ridge Power LLC (10MW)
Wind 26,441,248 0 0 N/A N/A No Data 12/17/2004
60126* Green Ridge Power LLC (100MW‐A)
Wind 81,249,791 0 0 N/A N/A No Data 12/17/2004
60127* Green Ridge Power LLC (100MW‐B)
Wind 1,064,188 0 0 N/A N/A No Data 12/17/2004
60128* Green Ridge Power LLC (100MW‐C)
Wind 12,581,744 0 0 N/A N/A No Data 12/17/2004
60129* Green Ridge Power LLC (100MW‐D)
Wind 19,099,871 0 0 N/A N/A No Data 12/17/2004

A‐61
60130* Green Ridge Power LLC (110MW)
Wind 269,718,804 0 0 N/A N/A No Data 12/17/2004
60131* Green Ridge Power LLC (23.8MW)
Wind 18,005,935 0 0 N/A N/A No Data 12/17/2004
60132* Green Ridge Power LLC (30MW)
Wind 640,297 0 0 N/A N/A No Data 12/17/2004
60133* Green Ridge Power LLC (5.9MW)
Wind 11,224,572 0 0 N/A N/A No Data 12/17/2004
60134* Green Ridge Power LLC (70MW‐A)
Wind 439,187 0 0 N/A N/A No Data 12/17/2004
60135* Green Ridge Power LLC (70MW‐B)
Wind 27,566,835 0 0 N/A N/A No Data 12/17/2004
60136* Green Ridge Power LLC (70MW‐C)
Wind 42,268,368 0 0 N/A N/A No Data 12/17/2004
60137* Green Ridge Power LLC (70MW‐D)
Wind 2,237,758 0 0 N/A N/A No Data 12/17/2004
60138* Green Ridge Power LLC (70MW)
Wind 81,182,566 0 0 N/A N/A No Data 12/17/2004
60139 International Turbine Research
Wind 23,041,730 0 0 22,352,000 ‐3% EIA 12/17/2004
60140 Northwind Energy Inc. Wind 10,183,567 0 0 10,184,541 0% Inv 12/17/2004
60141* Patterson Pass Windfarm LLC
Wind 35,624,704 0 0 N/A N/A No Data 12/17/2004
60142* Seawest Energy (Altech) Wind 2,592,480 0 0 N/A N/A No Data 12/17/2004
60143* Seawest Energy (CWES) Wind 674,194 0 0 N/A N/A No Data 12/17/2004
60144* Seawest Energy (Seawest)
Wind 27,170 0 0 N/A N/A No Data 12/17/2004
60145* Seawest Energy (Taxvest)
Wind 4,807,632 0 0 N/A N/A No Data 12/17/2004
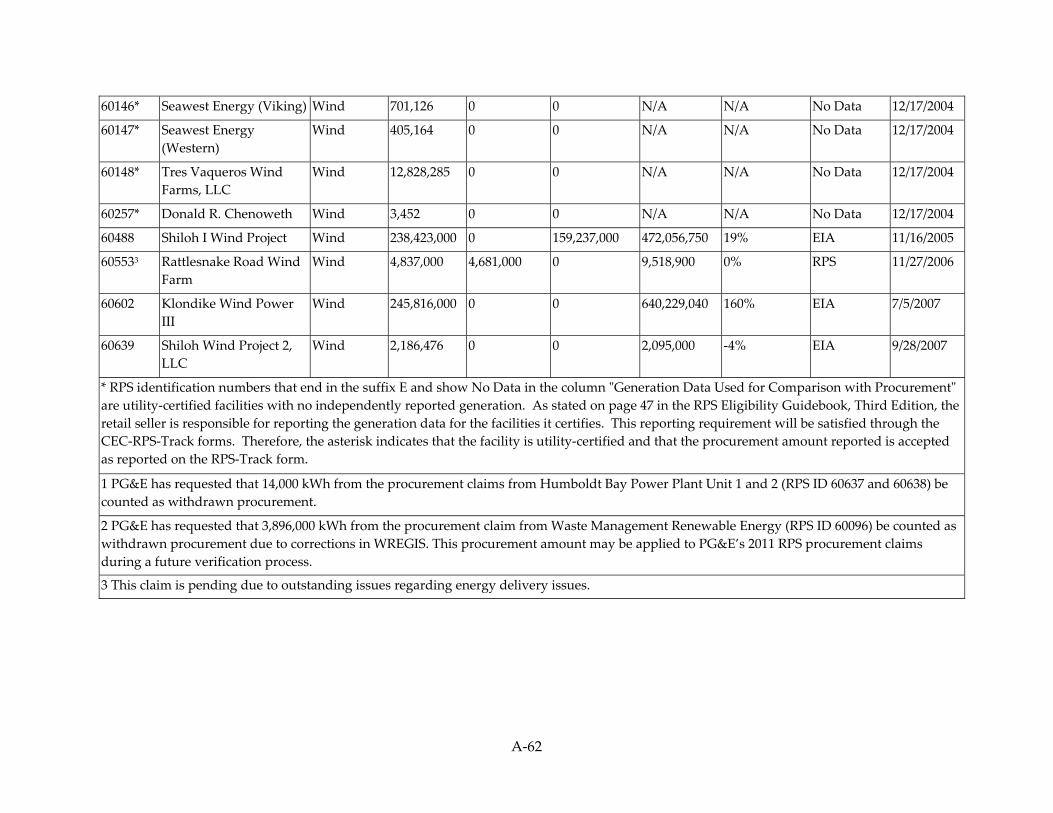
A‐62
60146* Seawest Energy (Viking) Wind 701,126 0 0 N/A N/A No Data 12/17/2004
60147* Seawest Energy (Western)
Wind 405,164 0 0 N/A N/A No Data 12/17/2004
60148* Tres Vaqueros Wind Farms, LLC
Wind 12,828,285 0 0 N/A N/A No Data 12/17/2004
60257* Donald R. Chenoweth Wind 3,452 0 0 N/A N/A No Data 12/17/2004
60488 Shiloh I Wind Project Wind 238,423,000 0 159,237,000 472,056,750 19% EIA 11/16/2005
605533 Rattlesnake Road Wind Farm
Wind 4,837,000 4,681,000 0 9,518,900 0% RPS 11/27/2006
60602 Klondike Wind Power III
Wind 245,816,000 0 0 640,229,040 160% EIA 7/5/2007
60639 Shiloh Wind Project 2, LLC
Wind 2,186,476 0 0 2,095,000 ‐4% EIA 9/28/2007
* RPS identification numbers that end in the suffix E and show No Data in the column ʺGeneration Data Used for Comparison with Procurementʺ are utility‐certified facilities with no independently reported generation. As stated on page 47 in the RPS Eligibility Guidebook, Third Edition, the retail seller is responsible for reporting the generation data for the facilities it certifies. This reporting requirement will be satisfied through the CEC‐RPS‐Track forms. Therefore, the asterisk indicates that the facility is utility‐certified and that the procurement amount reported is accepted as reported on the RPS‐Track form.
1 PG&E has requested that 14,000 kWh from the procurement claims from Humboldt Bay Power Plant Unit 1 and 2 (RPS ID 60637 and 60638) be counted as withdrawn procurement.
2 PG&E has requested that 3,896,000 kWh from the procurement claim from Waste Management Renewable Energy (RPS ID 60096) be counted as withdrawn procurement due to corrections in WREGIS. This procurement amount may be applied to PG&E’s 2011 RPS procurement claims during a future verification process.
3 This claim is pending due to outstanding issues regarding energy delivery issues.
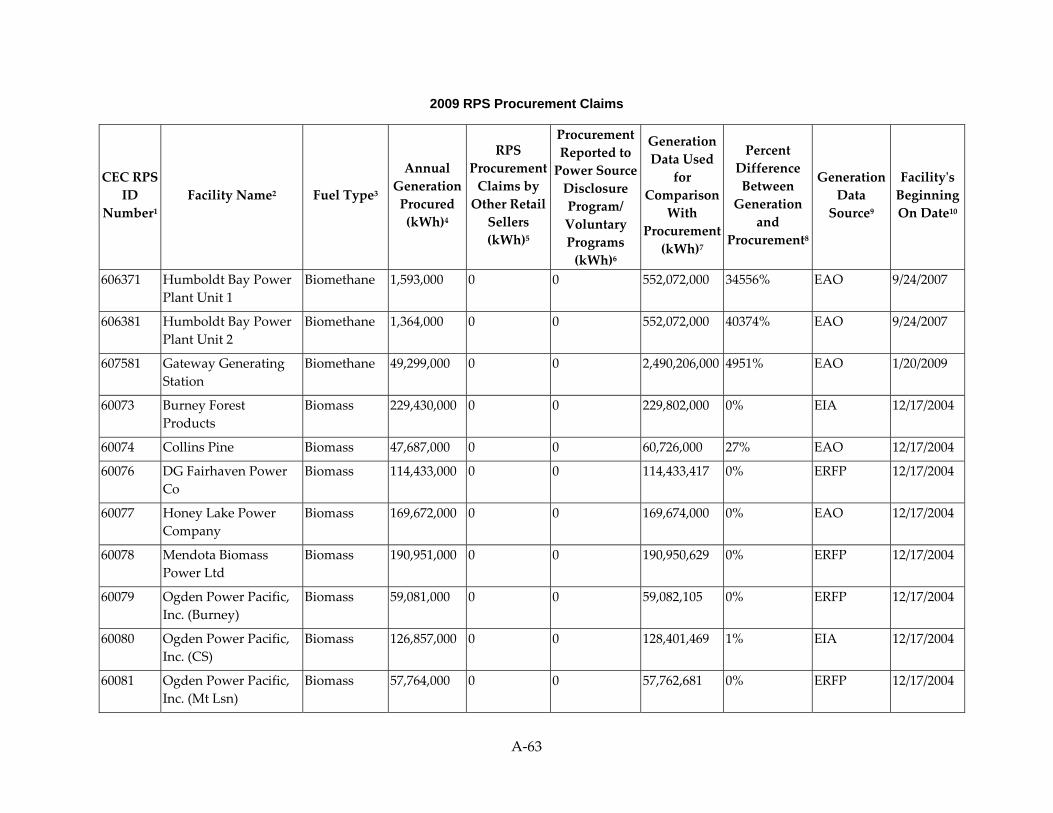
A‐63
2009 RPS Procurement Claims
CEC RPS ID
Number1 Facility Name2 Fuel Type3
Annual Generation Procured (kWh)4
RPS Procurement Claims by Other Retail Sellers (kWh)5
Procurement Reported to Power Source Disclosure Program/ Voluntary Programs (kWh)6
Generation Data Used
for Comparison
With Procurement (kWh)7
Percent Difference Between Generation
and Procurement8
Generation Data Source9
Facilityʹs Beginning On Date10
606371 Humboldt Bay Power Plant Unit 1
Biomethane 1,593,000 0 0 552,072,000 34556% EAO 9/24/2007
606381 Humboldt Bay Power Plant Unit 2
Biomethane 1,364,000 0 0 552,072,000 40374% EAO 9/24/2007
607581 Gateway Generating Station
Biomethane 49,299,000 0 0 2,490,206,000 4951% EAO 1/20/2009
60073 Burney Forest Products
Biomass 229,430,000 0 0 229,802,000 0% EIA 12/17/2004
60074 Collins Pine Biomass 47,687,000 0 0 60,726,000 27% EAO 12/17/2004
60076 DG Fairhaven Power Co
Biomass 114,433,000 0 0 114,433,417 0% ERFP 12/17/2004
60077 Honey Lake Power Company
Biomass 169,672,000 0 0 169,674,000 0% EAO 12/17/2004
60078 Mendota Biomass Power Ltd
Biomass 190,951,000 0 0 190,950,629 0% ERFP 12/17/2004
60079 Ogden Power Pacific, Inc. (Burney)
Biomass 59,081,000 0 0 59,082,105 0% ERFP 12/17/2004
60080 Ogden Power Pacific, Inc. (CS)
Biomass 126,857,000 0 0 128,401,469 1% EIA 12/17/2004
60081 Ogden Power Pacific, Inc. (Mt Lsn)
Biomass 57,764,000 0 0 57,762,681 0% ERFP 12/17/2004

A‐64
60082 Ogden Power Pacific, Inc. (Oroville)
Biomass 130,558,000 0 0 130,560,000 0% EAO 12/17/2004
60083 Pacific Lumber Co. Biomass 77,097,000 0 0 117,094,182 52% EIA 12/17/2004
60084 Rio Bravo Fresno Biomass 182,715,000 0 0 183,116,000 0% EAO 12/17/2004
60085 Rio Bravo Rocklin Biomass 181,167,000 0 0 181,305,000 0% EIA 12/17/2004
60086 SPI Anderson I Biomass 8,955,000 0 0 30,954,000 246% EIA 12/17/2004
60087 SPI Burney Biomass 90,667,000 0 0 108,836,000 20% EIA 12/17/2004
60088 SPI Lincoln Biomass 86,513,000 0 0 124,860,000 44% EAO 12/17/2004
60089 SPI Quincy Biomass 120,122,000 0 0 159,598,980 33% EIA 12/17/2004
60091 Thermal Energy Development Corp.
Biomass 132,632,000 0 0 133,366,000 1% EIA 12/17/2004
60092 Wadham Energy Limited Partnership
Biomass 173,193,000 0 0 173,678,000 0% EIA 12/17/2004
60094 Wheelabrator Shasta Energy Co
Biomass 394,720,000 0 0 395,383,000 0% EAO 12/17/2004
60095 Woodland Biomass Power, Ltd.
Biomass 159,517,000 0 0 159,528,000 0% EIA 12/17/2004
60272 Community Renewable Energy Service
Biomass 62,846,000 0 0 63,352,000 1% EAO 12/17/2004
60273 Madera Power Biomass 135,342,000 0 0 135,322,552 0% ERFP 12/17/2004
60274 Sierra Power Corporation
Biomass 43,191,000 0 0 48,150,000 11% EIA 12/17/2004
60471 Chowchilla II Biomass 51,339,000 0 0 51,795,000 1% EAO 7/25/2005
60473 El Nido Biomass 44,577,000 4,235,000 498,000 48,811,707 ‐1% RPS 7/25/2005
60492 Big Valley Power Biomass 1,589,000 0 0 1,588,635 0% RPS 2/14/2006
60576 SPI ‐ Sonora Biomass 17,870,000 0 7,959,700 34,947,160 65% EIA 4/23/2007

A‐65
60695 Mt. Poso Cogeneration Plant
Biomass 38,422,000 0 0 38,422,823 0% Inv 5/12/2008
60198 Calaveras Yuba Hydro #1
Conduit Hydroelectric
361,000 0 0 361,194 0% Inv 12/17/2004
60199 Calaveras Yuba Hydro #2
Conduit Hydroelectric
355,000 0 0 355,858 0% RPS 12/17/2004
60200 Calaveras Yuba Hydro #3
Conduit Hydroelectric
181,000 0 0 182,283 1% RPS 12/17/2004
60271 Etiwanda Small Conduit Hydroelectric Power Plant
Conduit Hydroelectric
28,664,000 0 0 30,426,000 6% EIA 12/17/2004
60567 Buckeye Power Plant Conduit Hydroelectric
1,651,000 0 0 1,665,013 1% RPS 4/23/2007
60568 Tunnel Hill Power Plant
Conduit Hydroelectric
1,567,000 0 0 1,568,708 0% RPS 4/23/2007
60814 Combie North Powerhouse
Conduit Hydroelectric
221,000 0 0 221,705 0% RPS 7/13/2009
60101 MWWTP Power Generation Station
Digester Gas 2,627,000 0 0 34,920,064 1229% RPS 12/17/2004
60108 Monterey Regional Water
Digester Gas 254,000 0 0 6,321,000 2389% EIA 12/17/2004
60190* City Of Watsonville Digester Gas 63,000 0 0 N/A N/A No Data 12/17/2004
60191* Langerwerf Dairy Digester Gas 123,000 0 0 N/A N/A No Data 12/17/2004
60628 Castelanelli Bros Dairy Digester Gas 707,000 0 0 685,000 ‐3% RPS 8/2/2007
60002 Calpine Geothermal Unit 5/6
Geothermal 678,253,000 880,000 10,624 689,755,000 2% EAO 6/14/2004
60003 Calpine Geothermal Unit 7‐8
Geothermal 585,687,000 3,851,000 0 589,537,000 0% EAO 6/14/2004

A‐66
60004 Calpine Geothermal Unit 12
Geothermal 512,000 425,301,000 0 425,812,000 0% EAO 6/14/2004
60005 Calpine Geothermal Unit 13
Geothermal 423,156,000 48,467,000 1,729 484,391,000 3% EAO 6/14/2004
60006 Calpine Geothermal Unit 16
Geothermal 2,561,000 404,934,000 0 407,496,000 0% EAO 6/14/2004
60007 Calpine Geothermal Unit 17
Geothermal 34,425,000 335,945,000 32,016 402,386,000 9% EAO 6/14/2004
60008 Calpine Geothermal Unit 18
Geothermal 75,713,000 277,011,000 38,600 394,321,000 12% EAO 6/14/2004
60009 Calpine Geothermal Unit 20
Geothermal 142,027,000 163,065,000 36,883 341,974,000 12% EAO 6/14/2004
60010 Sonoma/Calpine Geyser
Geothermal 113,071,000 129,871,000 56,488 299,430,000 23% EAO 6/14/2004
60025 Calpine Geothermal Unit 11
Geothermal 352,735,000 154,443,000 17,644 524,822,000 3% EAO 6/14/2004
60026 Calpine Geothermal Unit 14
Geothermal 7,305,000 413,674,000 0 420,978,000 0% EAO 6/14/2004
601112 Amedee Geothermal Venture I
Geothermal 3,819,000 0 0 3,699,000 ‐3% EIA 12/17/2004
60112 Bear Canyon Power Plant
Geothermal 107,514,000 1,094,000 0 108,608,000 0% EIA 12/17/2004
60114 West Ford Flat Power Plant
Geothermal 222,484,000 1,000 0 222,486,000 0% EIA 12/17/2004
60115 Aidlin Power Plant Geothermal 144,097,000 1,000 0 144,099,000 0% EAO 12/17/2004
60117 Calistoga Power Plant Geothermal 426,231,000 43,941,000 0 493,339,000 5% EAO 12/17/2004
60193*3 Wineagle Developers 1 Geothermal 3,078,000 0 0 N/A N/A No Data 12/17/2004
60604 Bottle Rock Power Plant
Geothermal 88,061,000 0 0 88,259,000 0% RPS 7/26/2007

A‐67
60096 Waste Management Renewable Energy
Landfill Gas 35,573,000 0 0 43,646,000 23% EIA 12/17/2004
60098 Covanta Pacific Power (Salinas)
Landfill Gas 5,697,000 0 0 5,989,000 5% EIA 12/17/2004
60100* Covanta Pacific Power (Stockton)
Landfill Gas 5,345,000 0 0 N/A N/A No Data 12/17/2004
60102 Gas Recovery System‐ American Canyon
Landfill Gas 6,699,000 0 0 6,710,000 0% EIA 12/17/2004
60103 Gas Recovery System‐ Guadalupe
Landfill Gas 17,574,000 0 0 17,568,000 0% EIA 12/17/2004
60104 Gas Recovery System‐ Menlo Park
Landfill Gas 8,886,000 0 0 8,897,000 0% EIA 12/17/2004
60105 Gas Recovery System‐ Newby Island II
Landfill Gas 31,852,000 0 0 31,854,000 0% EAO 12/17/2004
60106 Gas Recovery System‐ Santa Cruz
Landfill Gas 707,000 0 0 1,861,018 163% RPS 12/17/2004
60107 Monterey Regional Waste Mgt Dist
Landfill Gas 23,387,000 0 4,010,000 30,185,000 10% EAO 12/17/2004
60110 Stanislaus Resource Recovery Facility
MSW, Combustion
132,644,000 0 0 132,372,000 0% EAO 12/17/2004
60255* Robin Williams Solar Power Gen
Photovoltaic 2,000 0 0 N/A N/A No Data 12/17/2004
60634* AT&T Park Solar Arrays
Photovoltaic 165,000 0 0 N/A N/A No Data 9/24/2007
60635* San Francisco Service Center Solar Array 1
Photovoltaic 102,000 0 0 N/A N/A No Data 9/24/2007
60636* San Francisco Service Center Solar Array 2
Photovoltaic 186,000 0 0 N/A N/A No Data 9/24/2007

A‐68
60713 El Dorado Energy (Solar Expansion)
Photovoltaic 21,695,000 0 0 21,695,120 0% RPS 7/21/2008
60966* Vaca Dixon Solar Station
Photovoltaic 51,000 0 0 N/A N/A No Data 12/21/2009
60032 A.G. Wishon PH Small Hydro 40,267,000 0 0 41,121,000 2% EIA 12/21/2004
60033 Alta PH Small Hydro 4,131,000 0 0 4,129,000 0% EIA 12/21/2004
60034 Centerville PH Small Hydro 10,387,000 0 0 10,278,000 ‐1% EIA 12/21/2004
60035 Chili Bar PH Small Hydro 26,062,000 0 0 26,046,000 0% EIA 12/21/2004
60037 Coleman PH Small Hydro 48,068,000 0 0 48,069,000 0% EAO 12/21/2004
60038 Cow Creek PH Small Hydro 5,957,000 0 0 5,954,000 0% EAO 12/21/2004
60039* Crane Valley PH Small Hydro 2,308,000 0 0 N/A N/A No Data 12/21/2004
60040 Deer Creek PH Small Hydro 23,238,000 0 0 23,226,000 0% EIA 12/21/2004
60041 De Sabla PH Small Hydro 68,600,000 0 0 68,601,000 0% EAO 12/21/2004
60042 Dutch No. 1 PH Small Hydro 89,411,000 0 0 86,305,000 ‐3% EAO 12/21/2004
60043 Halsey PH Small Hydro 49,341,000 0 0 49,331,000 0% EIA 12/21/2004
60044 Hamilton Branch PH Small Hydro 8,076,000 0 0 8,052,000 0% EIA 12/21/2004
60045 Hat Creek No. 1 PH Small Hydro 30,643,000 0 0 30,643,000 0% EIA 12/21/2004
60046 Hat Creek No. 2 PH Small Hydro 41,807,000 0 0 41,802,000 0% EIA 12/21/2004
60047 Inskip PH Small Hydro 37,874,000 0 0 37,872,000 0% EIA 12/21/2004
60048 Kern Canyon PH Small Hydro 52,459,000 0 0 52,460,000 0% EAO 12/21/2004
60049 Kilarc PH Small Hydro 11,335,000 0 0 11,329,000 0% EIA 12/21/2004
60050 Lime Saddle PH Small Hydro 5,050,000 0 0 5,039,000 0% EAO 12/21/2004
60051 Merced Falls PH Small Hydro 10,932,000 0 0 10,890,000 0% EIA 12/21/2004
60052 Narrows No. 1 PH Small Hydro 77,135,000 0 0 77,128,000 0% EAO 12/21/2004
60053 Newcastle PH Small Hydro 21,839,000 0 0 21,839,030 0% EAO 12/21/2004
60054 Phoenix PH Small Hydro 9,429,000 0 0 9,416,000 0% EIA 12/21/2004

A‐69
60055 Potter Valley PH Small Hydro 19,715,000 0 0 19,712,000 0% EIA 12/21/2004
60056* San Joaquin No. 1‐A PH
Small Hydro 855,000 0 0 N/A N/A No Data 12/21/2004
60057 San Joaquin No. 2 PH Small Hydro 8,811,000 0 0 8,810,000 0% EIA 12/21/2004
60058 San Joaquin No. 3 PH Small Hydro 11,099,000 0 0 11,097,000 0% EIA 12/21/2004
60059 South PH Small Hydro 42,665,000 0 0 42,665,000 0% EIA 12/21/2004
60060 Spaulding No. 1 PH Small Hydro 29,783,000 0 0 41,185,000 38% EIA 12/21/2004
60061 Spaulding No. 2 PH Small Hydro 15,745,000 0 0 15,178,000 ‐4% EAO 12/21/2004
60062 Spaulding No. 3 PH Small Hydro 32,981,000 0 0 32,979,000 0% EIA 12/21/2004
60063 Spring Gap PH Small Hydro 38,579,000 0 0 38,573,000 0% EIA 12/21/2004
60064 Toadtown PH Small Hydro 3,347,000 0 0 3,312,000 ‐1% EIA 12/21/2004
60065 Tule PH Small Hydro 17,809,000 0 0 17,803,000 0% EIA 12/21/2004
60066 Volta No. 1 PH Small Hydro 31,279,000 0 0 31,279,000 0% EIA 12/21/2004
60067 Volta No. 2 PH Small Hydro 2,258,000 0 0 2,250,000 0% EIA 12/21/2004
60068 West Point PH Small Hydro 86,547,000 0 0 86,535,000 0% EIA 12/21/2004
60069 Wise No. 1 PH Small Hydro 76,873,000 0 0 80,470,060 5% EAO 12/21/2004
60070 Wise No. 2 PH Small Hydro 3,616,000 0 0 80,470,060 2125% EAO 12/21/2004
60151* American Energy, Inc (Wolfsen)
Small Hydro 843,000 0 0 N/A N/A No Data 12/17/2004
60152* Baker Station Associates L.P.
Small Hydro 2,761,000 0 0 N/A N/A No Data 12/17/2004
60153 Calaveras City Water District
Small Hydro 5,000,000 0 0 5,127,000 3% EAO 12/17/2004
60154 El Dorado (Montgomery Crk)
Small Hydro 6,442,000 0 0 6,427,000 0% EAO 12/17/2004
60155 Far West Power Corporation
Small Hydro 87,000 0 0 22,145,000 25354% EAO 12/17/2004

A‐70
60156 Friant Power Authority
Small Hydro 97,858,000 0 0 97,853,000 0% EAO 12/17/2004
60157 Haypress Hydroelectric (LWR)
Small Hydro 7,435,000 0 0 14,906,140 100% EAO 12/17/2004
60158 Haypress Hydroelectric (MDDL)
Small Hydro 7,472,000 0 0 14,906,140 99% EAO 12/17/2004
60159 Humboldt Bay Muni Water Dist
Small Hydro 4,107,000 0 0 4,107,231 0% Inv 12/17/2004
60160 Hypower, Inc. Small Hydro 31,446,000 0 0 39,604,000 26% EAO 12/17/2004
60161 Indian Vly Hydro Elec Ptrn.
Small Hydro 1,309,000 0 0 1,309,000 0% EIA 12/17/2004
60162 Kern Hydro Partners (Olcese)
Small Hydro 32,792,000 0 0 32,781,000 0% EIA 12/17/2004
60163 Madera Chowchilla Small Hydro 5,218,000 0 0 9,021,000 73% EAO 12/17/2004
60164 Malacha Hydro Ltd. Partnership
Small Hydro 32,065,000 0 0 32,066,000 0% EIA 12/17/2004
60165 Mega Renewables (Bidwell Ditch)
Small Hydro 11,654,000 0 0 11,654,316 0% EAO 12/17/2004
60166 Mega Renewables (Hatchet Crk)
Small Hydro 12,436,000 0 0 12,423,000 0% EIA 12/17/2004
60167 Mega Renewables (Roaring Crk)
Small Hydro 3,691,000 0 0 3,691,000 0% EAO 12/17/2004
60168 Merced ID (Parker) Small Hydro 5,821,000 0 0 5,816,000 0% EAO 12/17/2004
60169 Monterey County Water Res Agency
Small Hydro 9,859,000 0 0 9,956,000 1% EAO 12/17/2004
60170 Nelson Creek Power Inc.
Small Hydro 2,202,000 0 0 2,203,000 0% EAO 12/17/2004
60171 Nevada Power Authority
Small Hydro 12,675,000 0 0 12,689,000 0% EIA 12/17/2004
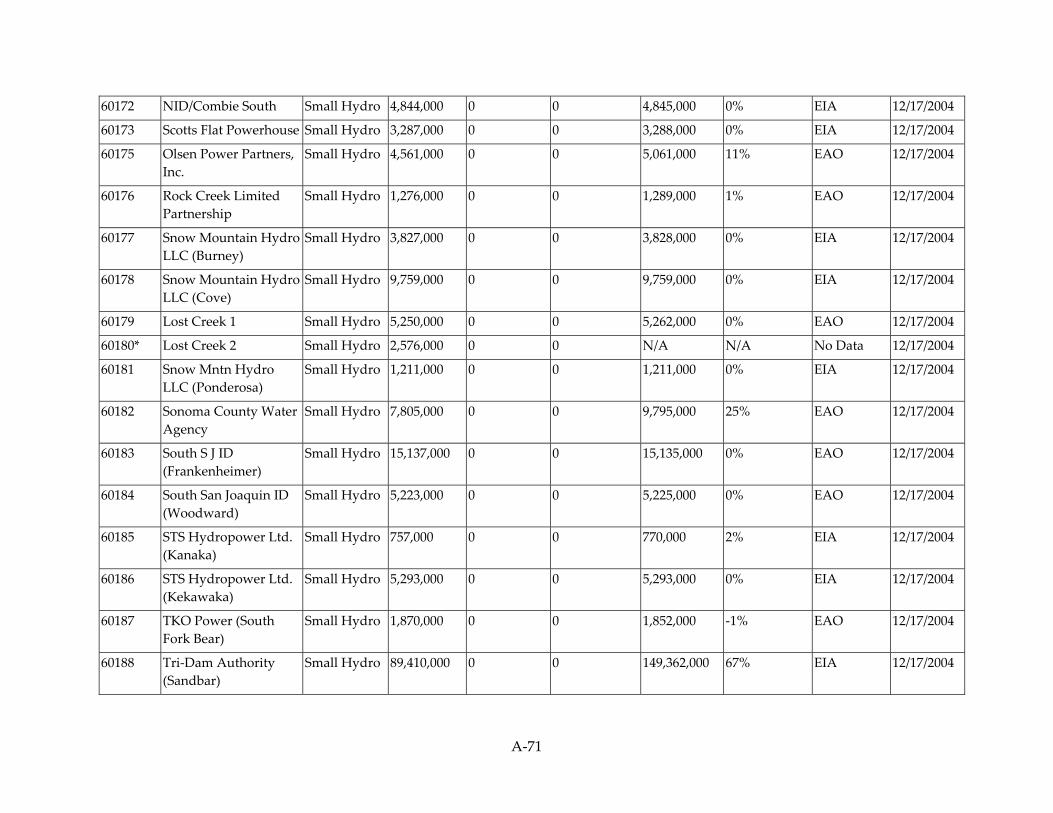
A‐71
60172 NID/Combie South Small Hydro 4,844,000 0 0 4,845,000 0% EIA 12/17/2004
60173 Scotts Flat Powerhouse Small Hydro 3,287,000 0 0 3,288,000 0% EIA 12/17/2004
60175 Olsen Power Partners, Inc.
Small Hydro 4,561,000 0 0 5,061,000 11% EAO 12/17/2004
60176 Rock Creek Limited Partnership
Small Hydro 1,276,000 0 0 1,289,000 1% EAO 12/17/2004
60177 Snow Mountain Hydro LLC (Burney)
Small Hydro 3,827,000 0 0 3,828,000 0% EIA 12/17/2004
60178 Snow Mountain Hydro LLC (Cove)
Small Hydro 9,759,000 0 0 9,759,000 0% EIA 12/17/2004
60179 Lost Creek 1 Small Hydro 5,250,000 0 0 5,262,000 0% EAO 12/17/2004
60180* Lost Creek 2 Small Hydro 2,576,000 0 0 N/A N/A No Data 12/17/2004
60181 Snow Mntn Hydro LLC (Ponderosa)
Small Hydro 1,211,000 0 0 1,211,000 0% EIA 12/17/2004
60182 Sonoma County Water Agency
Small Hydro 7,805,000 0 0 9,795,000 25% EAO 12/17/2004
60183 South S J ID (Frankenheimer)
Small Hydro 15,137,000 0 0 15,135,000 0% EAO 12/17/2004
60184 South San Joaquin ID (Woodward)
Small Hydro 5,223,000 0 0 5,225,000 0% EAO 12/17/2004
60185 STS Hydropower Ltd. (Kanaka)
Small Hydro 757,000 0 0 770,000 2% EIA 12/17/2004
60186 STS Hydropower Ltd. (Kekawaka)
Small Hydro 5,293,000 0 0 5,293,000 0% EIA 12/17/2004
60187 TKO Power (South Fork Bear)
Small Hydro 1,870,000 0 0 1,852,000 ‐1% EAO 12/17/2004
60188 Tri‐Dam Authority (Sandbar)
Small Hydro 89,410,000 0 0 149,362,000 67% EIA 12/17/2004

A‐72
60189 Yuba County Water Small Hydro 1,801,000 0 0 1,823,000 1% EIA 12/17/2004
60194* Arbuckle Mountain Hydro
Small Hydro 117,000 0 0 N/A N/A No Data 12/17/2004
60195* Bailey Creek Ranch Small Hydro 958,000 0 0 N/A N/A No Data 12/17/2004
60196* Bertha Wright Bertillion
Small Hydro 36,000 0 0 N/A N/A No Data 12/17/2004
60197* Browns Valley ID Small Hydro 1,910,000 0 0 N/A N/A No Data 12/17/2004
60201* Canal Creek Power Plant (Reta)
Small Hydro 1,152,000 0 0 N/A N/A No Data 12/17/2004
60202* Charcoal Ravine Small Hydro 17,000 0 0 N/A N/A No Data 12/17/2004
60206* Digger Creek Ranch Small Hydro 2,537,000 0 0 N/A N/A No Data 12/17/2004
60207* E J M McFadden Small Hydro 216,000 0 0 N/A N/A No Data 12/17/2004
60208* Eagle Hydro Small Hydro 2,027,000 0 0 N/A N/A No Data 12/17/2004
60209* Eric and Debbie Watternburg
Small Hydro 188,000 0 0 N/A N/A No Data 12/17/2004
60210* Fairfield Power Plant Small Hydro 2,097,000 0 0 N/A N/A No Data 12/17/2004
60211* Five Bears Hydroelectric
Small Hydro 258,000 0 0 N/A N/A No Data 12/17/2004
60214* Vecino Vineyards LLC Small Hydro 40,000 0 0 N/A N/A No Data 12/17/2004
60215* Hat Creek Hereford Ranch
Small Hydro 292,000 0 0 N/A N/A No Data 12/17/2004
60216* Henwood Associates Small Hydro 1,678,000 171,000 0 N/A N/A No Data 12/17/2004
60217* Jackson Valley Irrigation Dist
Small Hydro 210,000 0 0 N/A N/A No Data 12/17/2004
60218* James B. Peter Small Hydro 102,000 0 0 N/A N/A No Data 12/17/2004
60219* James Crane Hydro Small Hydro 5,000 0 0 N/A N/A No Data 12/17/2004
60220* John Neerhout Jr. Small Hydro 10,000 0 0 N/A N/A No Data 12/17/2004
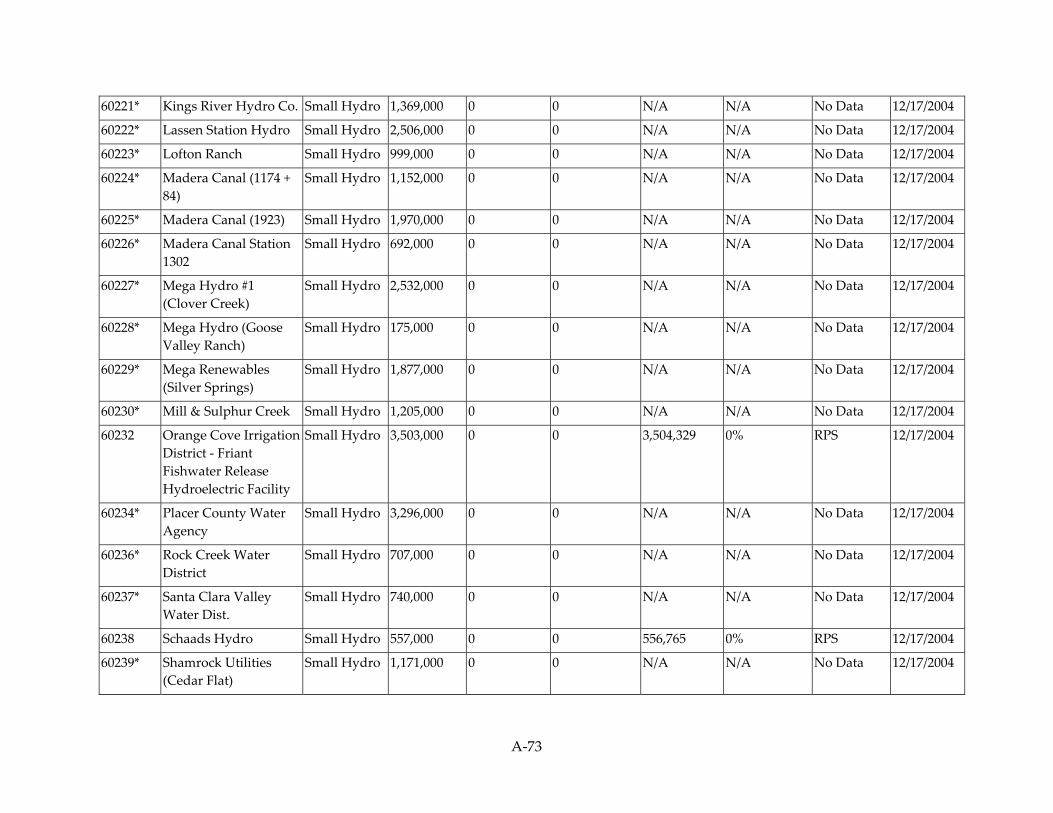
A‐73
60221* Kings River Hydro Co. Small Hydro 1,369,000 0 0 N/A N/A No Data 12/17/2004
60222* Lassen Station Hydro Small Hydro 2,506,000 0 0 N/A N/A No Data 12/17/2004
60223* Lofton Ranch Small Hydro 999,000 0 0 N/A N/A No Data 12/17/2004
60224* Madera Canal (1174 + 84)
Small Hydro 1,152,000 0 0 N/A N/A No Data 12/17/2004
60225* Madera Canal (1923) Small Hydro 1,970,000 0 0 N/A N/A No Data 12/17/2004
60226* Madera Canal Station 1302
Small Hydro 692,000 0 0 N/A N/A No Data 12/17/2004
60227* Mega Hydro #1 (Clover Creek)
Small Hydro 2,532,000 0 0 N/A N/A No Data 12/17/2004
60228* Mega Hydro (Goose Valley Ranch)
Small Hydro 175,000 0 0 N/A N/A No Data 12/17/2004
60229* Mega Renewables (Silver Springs)
Small Hydro 1,877,000 0 0 N/A N/A No Data 12/17/2004
60230* Mill & Sulphur Creek Small Hydro 1,205,000 0 0 N/A N/A No Data 12/17/2004
60232 Orange Cove Irrigation District ‐ Friant Fishwater Release Hydroelectric Facility
Small Hydro 3,503,000 0 0 3,504,329 0% RPS 12/17/2004
60234* Placer County Water Agency
Small Hydro 3,296,000 0 0 N/A N/A No Data 12/17/2004
60236* Rock Creek Water District
Small Hydro 707,000 0 0 N/A N/A No Data 12/17/2004
60237* Santa Clara Valley Water Dist.
Small Hydro 740,000 0 0 N/A N/A No Data 12/17/2004
60238 Schaads Hydro Small Hydro 557,000 0 0 556,765 0% RPS 12/17/2004
60239* Shamrock Utilities (Cedar Flat)
Small Hydro 1,171,000 0 0 N/A N/A No Data 12/17/2004

A‐74
60240* Shamrock Utilities (Clover Leaf)
Small Hydro 478,000 0 0 N/A N/A No Data 12/17/2004
60242 Sierra Energy Small Hydro 94,000 0 0 2,603,000 2669% EAO 12/17/2004
60243* South Sutter Water Small Hydro 706,000 0 0 N/A N/A No Data 12/17/2004
60244* Steve & Bonnie Tetrick Small Hydro 183,000 0 0 N/A N/A No Data 12/17/2004
60246* Sutterʹs Mill Small Hydro 639,000 0 0 N/A N/A No Data 12/17/2004
60247* Swiss America Small Hydro 275,000 0 0 N/A N/A No Data 12/17/2004
60249 Tom Benninghoven Small Hydro 66,000 0 0 N/A N/A No Data 12/17/2004
60250* Water Wheel Ranch Small Hydro 2,582,000 0 0 N/A N/A No Data 12/17/2004
60251* Youth with a Mission/Spgs Of Lv Wat
Small Hydro 151,000 0 0 N/A N/A No Data 12/17/2004
60252* Yuba County Water Agency
Small Hydro 1,055,000 0 0 N/A N/A No Data 12/17/2004
60263 MID (McSwain) Small Hydro 24,670,000 0 0 105,396,000 327% EAO 12/17/2004
60264 NID (Dutch Flat #2) Small Hydro 82,618,000 0 0 82,615,000 0% EIA 12/17/2004
60265 NID (Rollins) Small Hydro 66,725,000 0 0 66,721,000 0% EIA 12/17/2004
60266 Kelly Ridge Powerhouse
Small Hydro 72,137,000 0 0 72,385,000 0% EIA 12/17/2004
60267 Sly Creek Powerhouse Small Hydro 32,279,000 0 0 32,209,000 0% EAO 12/17/2004
60268 PCWA (French Meadows)
Small Hydro 55,968,000 0 0 54,336,000 ‐3% EAO 12/17/2004
60269 PCWA (Oxbow) Small Hydro 26,631,000 0 0 26,668,000 0% EIA 12/17/2004
60270 SID (Monticello) Small Hydro 40,409,000 0 0 39,665,000 ‐2% EIA 12/17/2004
60276 Oak Flat PH Small Hydro 6,207,000 0 0 6,203,000 0% EIA 1/13/2005
60502 Three Forks Water Power Project
Small Hydro 5,924,000 0 0 6,076,400 3% RPS 3/7/2006
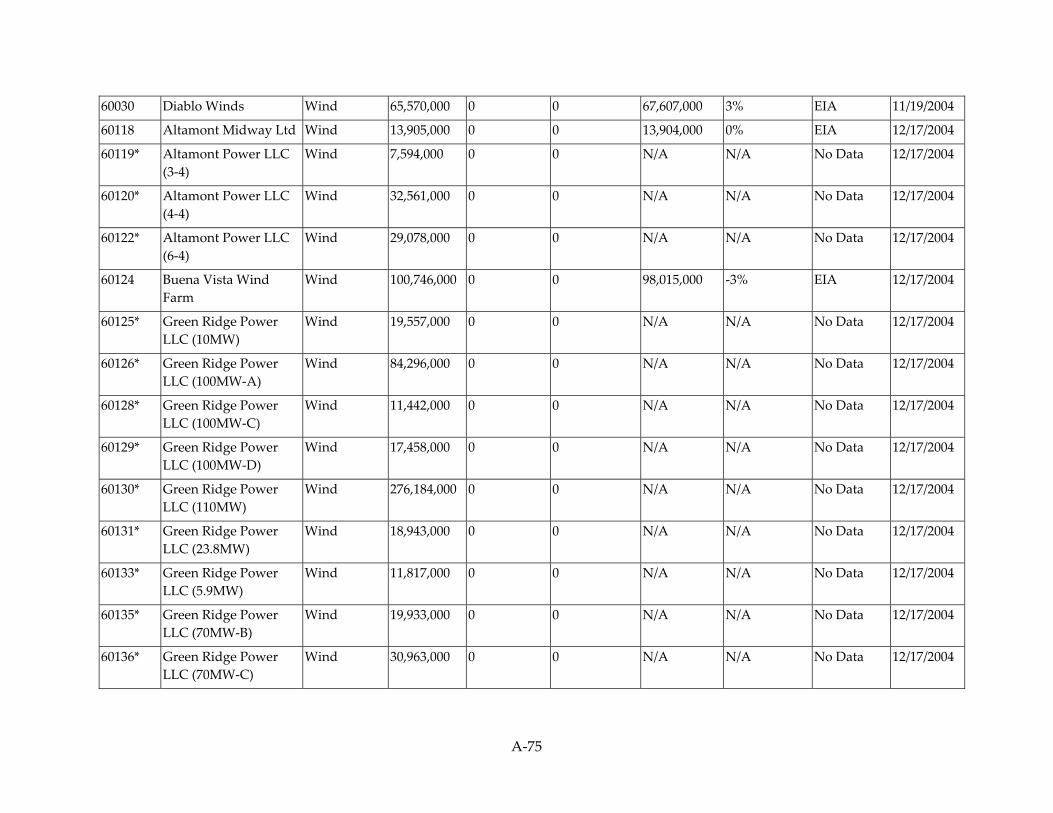
A‐75
60030 Diablo Winds Wind 65,570,000 0 0 67,607,000 3% EIA 11/19/2004
60118 Altamont Midway Ltd Wind 13,905,000 0 0 13,904,000 0% EIA 12/17/2004
60119* Altamont Power LLC (3‐4)
Wind 7,594,000 0 0 N/A N/A No Data 12/17/2004
60120* Altamont Power LLC (4‐4)
Wind 32,561,000 0 0 N/A N/A No Data 12/17/2004
60122* Altamont Power LLC (6‐4)
Wind 29,078,000 0 0 N/A N/A No Data 12/17/2004
60124 Buena Vista Wind Farm
Wind 100,746,000 0 0 98,015,000 ‐3% EIA 12/17/2004
60125* Green Ridge Power LLC (10MW)
Wind 19,557,000 0 0 N/A N/A No Data 12/17/2004
60126* Green Ridge Power LLC (100MW‐A)
Wind 84,296,000 0 0 N/A N/A No Data 12/17/2004
60128* Green Ridge Power LLC (100MW‐C)
Wind 11,442,000 0 0 N/A N/A No Data 12/17/2004
60129* Green Ridge Power LLC (100MW‐D)
Wind 17,458,000 0 0 N/A N/A No Data 12/17/2004
60130* Green Ridge Power LLC (110MW)
Wind 276,184,000 0 0 N/A N/A No Data 12/17/2004
60131* Green Ridge Power LLC (23.8MW)
Wind 18,943,000 0 0 N/A N/A No Data 12/17/2004
60133* Green Ridge Power LLC (5.9MW)
Wind 11,817,000 0 0 N/A N/A No Data 12/17/2004
60135* Green Ridge Power LLC (70MW‐B)
Wind 19,933,000 0 0 N/A N/A No Data 12/17/2004
60136* Green Ridge Power LLC (70MW‐C)
Wind 30,963,000 0 0 N/A N/A No Data 12/17/2004

A‐76
60137* Green Ridge Power LLC (70MW‐D)
Wind 1,616,000 0 0 N/A N/A No Data 12/17/2004
60138* Green Ridge Power LLC (70MW)
Wind 87,921,000 0 0 N/A N/A No Data 12/17/2004
60139 International Turbine Research
Wind 25,941,000 0 0 26,164,000 1% EIA 12/17/2004
60140 Northwind Energy Inc. Wind 15,261,000 0 0 15,260,000 0% EIA 12/17/2004
60141* Patterson Pass Windfarm LLC
Wind 40,003,000 0 0 N/A N/A No Data 12/17/2004
60142* Seawest Energy (Altech)
Wind 6,010,000 0 0 N/A N/A No Data 12/17/2004
60143* Seawest Energy (CWES)
Wind 2,000 0 0 N/A N/A No Data 12/17/2004
60144* Seawest Energy (Seawest)
Wind 68,000 0 0 N/A N/A No Data 12/17/2004
60145* Seawest Energy (Taxvest)
Wind 758,000 0 0 N/A N/A No Data 12/17/2004
60146* Seawest Energy (Viking)
Wind 1,763,000 0 0 N/A N/A No Data 12/17/2004
60147* Seawest Energy (Western)
Wind 2,814,000 0 0 N/A N/A No Data 12/17/2004
60148* Tres Vaqueros Wind Farms, LLC
Wind 11,442,000 0 0 N/A N/A No Data 12/17/2004
60257* Donald R. Chenoweth Wind 11,000 0 0 N/A N/A No Data 12/17/2004
60488 Shiloh I Wind Project Wind 197,999,000 0 132,160,590 395,797,880 20% EIA 11/16/2005
60553 Rattlesnake Road Wind Farm
Wind 227,666,000 0 0 225,337,000 ‐1% EIA 11/27/2006
60564 Wolverine Creek Wind 24,570,000 67,304,000 0 153,791,000 67% EIA 6/7/2007

A‐77
60639 Shiloh Wind Project 2, LLC
Wind 408,052,000 0 0 407,961,000 0% EIA 9/28/2007
60602 & 60694
Klondike Wind Power III & Klondike Wind Power IIIA
Wind 440,123,000 132,409,000 0 766,641,850 34% EIA 7/5/2007
60721 White Creek Wind I Wind 52,295,000 267,516,000 0 551,471,000 72% EIA 2/28/2008
60776 Big Horn Wind Project Wind 75,000,000 98,891,000 69,075,000 512,480,560 111% EIA 1/5/2009
60804 Glenrock III Wind 33,161,000 9,015,000 0 337,581,000 700% EIA 2/5/2009
60805 Glenrock I Wind 28,794,000 88,757,000 0 337,581,000 187% EIA 2/5/2009
60807 Seven Mile Hill I Wind 111,803,000 4,761,000 0 369,520,000 217% EIA 2/12/2009
60808 Seven Mile Hill II Wind 22,569,000 995,000 0 369,520,000 1468% EIA 2/12/2009
* RPS identification numbers that end in the suffix E and show No Data in the column ʺGeneration Data Used for Comparison with Procurementʺ are utility‐certified facilities with no independently reported generation. As stated on page 47 in the RPS Eligibility Guidebook, Third Edition, the retail seller is responsible for reporting the generation data for the facilities it certifies. This reporting requirement will be satisfied through the CEC‐RPS‐Track forms. Therefore, the asterisk indicates that the facility is utility‐certified and that the procurement amount reported is accepted as reported on the RPS‐Track form.
1 PG&E has requested that 1,912,000 kWh from the procurement claims from Humboldt Bay Power Plant Unit 1 and 2 (RPS ID 60637 and 60638), and Gateway Generating Station (RPS ID 60758) be counted as withdrawn procurement.
2 PG&E has requested that 1.51 0 kWh from the procurement claim from Amedee Geothermal Venture I (RPS ID 60111) be counted as withdrawn procurement due to corrections in WREGIS. This procurement amount may be applied to PG&E’s 2012 RPS procurement claims during a future verification process.
3 PG&E has requested that 125,650 kWh from the procurement claim from Wineagle Developers 1(RPS ID 60193) be counted as withdrawn procurement due to corrections in WREGIS. This procurement amount may be applied to PG&E’s 2012 RPS procurement claims during a future verification process.

A‐78
2010 RPS Procurement Claims
CEC RPS ID
Number1 Facility Name2 Fuel Type3
Annual Generation Procured (kWh)4
RPS Procurement Claims by Other Retail Sellers (kWh)5
Procurement Reported to Power Source Disclosure Program/ Voluntary Programs (kWh)6
Generation Data Used
for Comparison
With Procurement (kWh)7
Percent Difference Between Generation
and Procurement
8
Generation Data Source9
Facilityʹs Beginning On Date10
60758 Gateway Generating Station
Biogas 31,605,000 0 0 3,099,375,000 9707% EAO 1/20/2009
60073 Burney Forest Products Biomass 222,269,000 0 0 222,269,132 0% ERFP 12/17/2004
60074 Collins Pine Biomass 43,604,000 0 0 57,565,000 32% EAO 12/17/2004
60076 DG Fairhaven Power Co
Biomass 97,549,000 0 0 97,304,020 0% EAO 12/17/2004
60077 Honey Lake Power Company
Biomass 168,804,000 0 0 168,834,000 0% EAO 12/17/2004
60078 Mendota Biomass Power Ltd
Biomass 173,936,000 0 0 173,935,645 0% ERFP 12/17/2004
60079 Ogden Power Pacific, Inc. (Burney)
Biomass 65,486,000 0 0 65,485,020 0% EAO 12/17/2004
60080 Ogden Power Pacific, Inc. (CS)
Biomass 112,908,000 0 0 112,908,614 0% ERFP 12/17/2004
60081 Ogden Power Pacific, Inc. (Mt Lsn)
Biomass 64,051,000 0 0 65,754,010 3% EAO 12/17/2004
60082 Ogden Power Pacific, Inc. (Oroville)
Biomass 69,472,000 0 0 69,472,060 0% EAO 12/17/2004
60083 Pacific Lumber Co. Biomass 98,241,000 0 0 122,860,080 25% EAO 12/17/2004
60084 Rio Bravo Fresno Biomass 177,925,000 0 0 177,965,000 0% EAO 12/17/2004
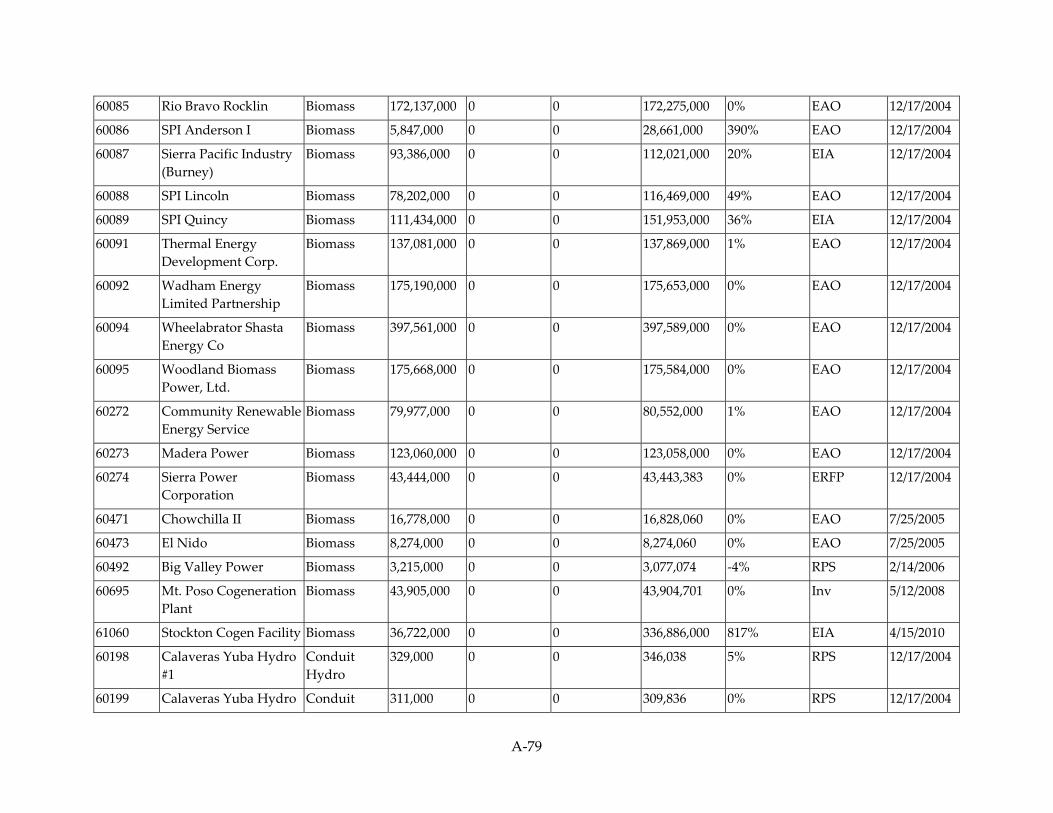
A‐79
60085 Rio Bravo Rocklin Biomass 172,137,000 0 0 172,275,000 0% EAO 12/17/2004
60086 SPI Anderson I Biomass 5,847,000 0 0 28,661,000 390% EAO 12/17/2004
60087 Sierra Pacific Industry (Burney)
Biomass 93,386,000 0 0 112,021,000 20% EIA 12/17/2004
60088 SPI Lincoln Biomass 78,202,000 0 0 116,469,000 49% EAO 12/17/2004
60089 SPI Quincy Biomass 111,434,000 0 0 151,953,000 36% EIA 12/17/2004
60091 Thermal Energy Development Corp.
Biomass 137,081,000 0 0 137,869,000 1% EAO 12/17/2004
60092 Wadham Energy Limited Partnership
Biomass 175,190,000 0 0 175,653,000 0% EAO 12/17/2004
60094 Wheelabrator Shasta Energy Co
Biomass 397,561,000 0 0 397,589,000 0% EAO 12/17/2004
60095 Woodland Biomass Power, Ltd.
Biomass 175,668,000 0 0 175,584,000 0% EAO 12/17/2004
60272 Community Renewable Energy Service
Biomass 79,977,000 0 0 80,552,000 1% EAO 12/17/2004
60273 Madera Power Biomass 123,060,000 0 0 123,058,000 0% EAO 12/17/2004
60274 Sierra Power Corporation
Biomass 43,444,000 0 0 43,443,383 0% ERFP 12/17/2004
60471 Chowchilla II Biomass 16,778,000 0 0 16,828,060 0% EAO 7/25/2005
60473 El Nido Biomass 8,274,000 0 0 8,274,060 0% EAO 7/25/2005
60492 Big Valley Power Biomass 3,215,000 0 0 3,077,074 ‐4% RPS 2/14/2006
60695 Mt. Poso Cogeneration Plant
Biomass 43,905,000 0 0 43,904,701 0% Inv 5/12/2008
61060 Stockton Cogen Facility Biomass 36,722,000 0 0 336,886,000 817% EIA 4/15/2010
60198 Calaveras Yuba Hydro #1
Conduit Hydro
329,000 0 0 346,038 5% RPS 12/17/2004
60199 Calaveras Yuba Hydro Conduit 311,000 0 0 309,836 0% RPS 12/17/2004

A‐80
#2 Hydro
60200 Calaveras Yuba Hydro #3
Conduit Hydro
151,000 0 0 152,436 1% RPS 12/17/2004
60271 Etiwanda Small Conduit Hydroelectric Power Plant
Conduit Hydro
28,282,000 0 0 30,141,000 7% EAO 12/17/2004
60567 Buckeye Power Plant Conduit Hydro
1,499,000 0 0 1,499,356 0% RPS 4/23/2007
60568 Tunnel Hill Power Plant
Conduit Hydro
2,149,000 0 0 2,149,677 0% RPS 4/23/2007
60814 Combie North Powerhouse
Conduit Hydro
1,922,000 0 0 1,922,513 0% RPS 7/13/2009
60970 SGE Site #1 Conduit Hydro
35,000 0 0 35,590 2% RPS 12/8/2009
60101 MWWTP Power Generation Station
Digester Gas 2,290,000 0 0 36,166,207 1479% RPS 12/17/2004
60108 Monterey Regional Water
Digester Gas 378,000 0 0 7,623,000 1917% EAO 12/17/2004
60190*1 City Of Watsonville Digester Gas 92,000 0 0 N/A N/A No Data 12/17/2004
60191* Langerwerf Dairy Digester Gas 171,000 0 0 N/A N/A No Data 12/17/2004
60628 Castelanelli Bros Dairy Digester Gas 1,327,000 0 0 1,327,000 0% RPS 8/2/2007
61148 Blakeʹs Landing Farms Digester Gas 24,000 0 0 24,275 1% Inv 9/14/2010
60002 Calpine Geothermal Unit 5/6
Geothermal 694,417,000 0 0 694,416,000 0% EAO 6/14/2004
60003 Calpine Geothermal Unit 7‐8
Geothermal 636,486,000 2,000 0 636,489,000 0% EAO 6/14/2004
60004 Calpine Geothermal Unit 12
Geothermal 12,534,000 402,491,000 0 415,025,000 0% EAO 6/14/2004

A‐81
60005 Calpine Geothermal Unit 13
Geothermal 477,463,000 9,648,000 0 487,108,000 0% EAO 6/14/2004
60006 Calpine Geothermal Unit 16
Geothermal 90,000 396,136,000 0 396,226,000 0% EAO 6/14/2004
60008 Calpine Geothermal Unit 18
Geothermal 111,351,000 270,422,000 0 381,773,000 0% EAO 6/14/2004
60009 Calpine Geothermal Unit 20
Geothermal 207,763,000 121,903,000 0 329,676,000 0% EAO 6/14/2004
60010 Sonoma/Calpine Geyser
Geothermal 143,580,000 165,470,000 0 309,051,000 0% EAO 6/14/2004
60025 Calpine Geothermal Unit 11
Geothermal 393,142,000 83,580,000 0 476,738,000 0% EAO 6/14/2004
60026 Calpine Geothermal Unit 14
Geothermal 1,054,000 418,462,000 0 419,517,000 0% EAO 6/14/2004
60111*2 Amedee Geothermal Venture I
Geothermal 1,070,000 0 0 N/A N/A No Data 12/17/2004
60112 Bear Canyon Power Plant
Geothermal 103,615,000 0 0 103,612,000 0% EAO 12/17/2004
60114 West Ford Flat Power Plant
Geothermal 224,862,000 0 0 224,864,000 0% EAO 12/17/2004
60115 Aidlin Power Plant Geothermal 148,962,000 0 0 148,962,000 0% EAO 12/17/2004
60117 Calistoga Power Plant Geothermal 538,581,000 184,000 0 538,765,000 0% EIA 12/17/2004
60193*3 Wineagle Developers 1 Geothermal 4,052,000 0 0 N/A N/A No Data 12/17/2004
60604 Bottle Rock Power Plant
Geothermal 67,555,000 0 0 67,544,000 0% RPS 7/26/2007
60096 Waste Management Renewable Energy
Landfill Gas 36,581,000 0 0 50,177,000 37% EAO 12/17/2004
60100* Covanta Pacific Power (Stockton)
Landfill Gas 5,132,000 0 0 N/A N/A No Data 12/17/2004

A‐82
60102 Gas Recovery System‐ American Canyon
Landfill Gas 5,895,000 0 0 5,890,010 0% EAO 12/17/2004
60103 Gas Recovery System‐ Guadalupe
Landfill Gas 17,987,000 0 0 17,475,374 ‐3% EAO 12/17/2004
60104 Gas Recovery System‐ Menlo Park
Landfill Gas 7,839,000 0 0 15,688,000 100% EAO 12/17/2004
60105 Gas Recovery System‐ Newby Island II
Landfill Gas 22,418,000 0 0 22,448,000 0% EAO 12/17/2004
60107 Monterey Regional Waste Mgt Dist
Landfill Gas 35,138,000 0 0 37,321,000 6% EAO 12/17/2004
61052 Santa Maria II LFG Power Plant
Landfill Gas 759,391 0 0 759,390 0% RPS 4/5/2010
60110 Stanislaus Resource Recovery Facility
MSW, Combustion
123,090,000 0 0 122,589,000 0% EAO 12/17/2004
60255* Robin Williams Solar Power Gen
Photovoltaic 1,000 0 0 N/A N/A No Data 12/17/2004
60475 CalRENEW‐1 Photovoltaic 7,131,000 0 0 7,175,000 1% RPS 9/9/2005
60634* AT&T Park Solar Arrays
Photovoltaic 152,000 0 0 N/A N/A No Data 9/24/2007
60635* San Francisco Service Center Solar Array 1
Photovoltaic 92,000 0 0 N/A N/A No Data 9/24/2007
60636* San Francisco Service Center Solar Array 2
Photovoltaic 178,000 0 0 N/A N/A No Data 9/24/2007
60713 El Dorado Energy (Solar Expansion)
Photovoltaic 21,039,000 0 0 21,146,000 1% RPS 7/21/2008
60786 Copper Mountain Solar I
Photovoltaic 30,166,000 0 0 29,776,000 ‐1% EIA 3/25/2009
60966* Vaca Dixon Solar Station
Photovoltaic 4,220,000 0 0 N/A N/A No Data 12/21/2009

A‐83
60032 A.G. Wishon PH Small Hydro 90,670,000 0 0 89,996,760 ‐1% EAO 12/21/2004
60033 Alta PH Small Hydro 3,612,000 0 0 3,611,970 0% Inv 12/21/2004
60034* Centerville PH Small Hydro 8,959,000 0 0 N/A N/A No Data 12/21/2004
60035 Chili Bar PH Small Hydro 31,796,000 0 0 31,785,000 0% EAO 12/21/2004
60037 Coleman PH Small Hydro 33,014,000 0 0 33,013,960 0% EAO 12/21/2004
60038 Cow Creek PH Small Hydro 1,266,000 0 0 1,251,000 ‐1% EAO 12/21/2004
60039* Crane Valley PH Small Hydro 3,770,000 0 0 N/A N/A No Data 12/21/2004
60040 Deer Creek PH Small Hydro 16,702,000 0 0 16,997,000 2% EAO 12/21/2004
60041 De Sabla PH Small Hydro 79,554,000 0 0 79,554,070 0% EAO 12/21/2004
60042 Dutch No. 1 PH Small Hydro 92,494,000 0 0 89,881,430 ‐3% EAO 12/21/2004
60043 Halsey PH Small Hydro 56,481,000 0 0 56,481,530 0% EAO 12/21/2004
60044 Hamilton Branch PH Small Hydro 15,530,000 0 0 15,516,000 0% EAO 12/21/2004
60045 Hat Creek No. 1 PH Small Hydro 29,340,000 0 0 29,339,000 0% EAO 12/21/2004
60046 Hat Creek No. 2 PH Small Hydro 37,618,000 0 0 37,605,000 0% EAO 12/21/2004
60047 Inskip PH Small Hydro 44,608,000 0 0 44,608,000 0% EAO 12/21/2004
60048 Kern Canyon PH Small Hydro 22,726,000 0 0 22,725,480 0% EAO 12/21/2004
60049 Kilarc PH Small Hydro 16,820,000 0 0 16,820,000 0% EAO 12/21/2004
60050 Lime Saddle PH Small Hydro 4,901,000 0 0 4,913,000 0% EAO 12/21/2004
60051 Merced Falls PH Small Hydro 12,526,000 0 0 12,495,000 0% EAO 12/21/2004
60052 Narrows No. 1 PH Small Hydro 56,024,000 0 0 55,947,190 0% EAO 12/21/2004
60053 Newcastle PH Small Hydro 32,344,000 0 0 32,337,920 0% EAO 12/21/2004
60054 Phoenix PH Small Hydro 10,084,000 0 0 10,078,000 0% EAO 12/21/2004
60055 Potter Valley PH Small Hydro 27,316,000 0 0 27,310,000 0% EAO 12/21/2004
60056* San Joaquin No. 1‐A PH
Small Hydro 1,927,000 0 0 N/A N/A No Data 12/21/2004
60057 San Joaquin No. 2 PH Small Hydro 13,960,000 0 0 13,691,000 ‐2% EAO 12/21/2004

A‐84
60058 San Joaquin No. 3 PH Small Hydro 18,651,000 0 0 18,652,000 0% EAO 12/21/2004
60059 South PH Small Hydro 17,216,000 0 0 17,216,000 0% EAO 12/21/2004
60060 Spaulding No. 1 PH Small Hydro 31,332,000 0 0 31,331,843 0% Inv 12/21/2004
60061 Spaulding No. 2 PH Small Hydro 16,561,000 0 0 19,621,000 18% EAO 12/21/2004
60062 Spaulding No. 3 PH Small Hydro 32,390,000 0 0 32,381,000 0% EAO 12/21/2004
60063 Spring Gap PH Small Hydro 41,715,000 0 0 41,706,000 0% EAO 12/21/2004
60064 Toadtown PH Small Hydro 5,342,000 0 0 5,328,000 0% EAO 12/21/2004
60065 Tule PH Small Hydro 25,779,000 0 0 25,772,000 0% EAO 12/21/2004
60066 Volta No. 1 PH Small Hydro 41,742,000 0 0 41,742,000 0% EAO 12/21/2004
60067 Volta No. 2 PH Small Hydro 4,990,000 0 0 4,977,000 0% EAO 12/21/2004
60068 West Point PH Small Hydro 84,261,000 0 0 84,258,090 0% EAO 12/21/2004
60069 Wise No. 1 PH Small Hydro 80,896,000 0 0 87,553,690 8% EAO 12/21/2004
60070 Wise No. 2 PH Small Hydro 6,678,000 0 0 87,553,690 1211% EAO 12/21/2004
60151* American Energy, Inc (Wolfsen)
Small Hydro 956,000 0 0 N/A N/A No Data 12/17/2004
60152* Baker Station Associates L.P.
Small Hydro 5,089,000 0 0 N/A N/A No Data 12/17/2004
60153 Calaveras City Water District
Small Hydro 607,000 0 3,516,001 4,305,000 4% EAO 12/17/2004
60154 El Dorado (Montgomery Crk)
Small Hydro 12,077,000 0 0 12,380,000 3% EAO 12/17/2004
60155 Far West Power Corporation
Small Hydro 251,000 0 0 27,786,000 10970% EAO 12/17/2004
60156 Friant Power Authority Small Hydro 76,031,000 0 0 76,343,240 0% EAO 12/17/2004
60157 Haypress Hydroelectric (LWR)
Small Hydro 8,713,000 0 0 17,262,120 98% EAO 12/17/2004

A‐85
60158 Haypress Hydroelectric (MDDL)
Small Hydro 8,548,000 0 0 17,262,120 102% EAO 12/17/2004
60159 Humboldt Bay Muni Water Dist
Small Hydro 7,300,000 0 0 6,970,000 ‐5% EAO 12/17/2004
60160 Hypower, Inc. Small Hydro 63,549,000 0 0 63,548,020 0% EAO 12/17/2004
60161 Indian Vly Hydro Elec Ptrn.
Small Hydro 2,462,000 0 0 2,462,000 0% EAO 12/17/2004
60162 Kern Hydro Partners (Olcese)
Small Hydro 34,739,000 0 0 34,111,010 ‐2% EAO 12/17/2004
60163 Madera Chowchilla Small Hydro 6,352,000 0 0 11,704,000 84% EAO 12/17/2004
60164 Malacha Hydro Ltd. Partnership
Small Hydro 30,561,000 0 0 30,560,010 0% EAO 12/17/2004
60165 Mega Renewables (Bidwell Ditch)
Small Hydro 10,583,000 0 0 10,583,000 0% EAO 12/17/2004
60166 Mega Renewables (Hatchet Crk)
Small Hydro 25,785,000 0 0 25,785,000 0% EAO 12/17/2004
60167 Mega Renewables (Roaring Crk)
Small Hydro 8,461,000 0 0 8,461,000 0% EAO 12/17/2004
60168 Merced ID (Parker) Small Hydro 5,301,000 0 0 5,293,000 0% EAO 12/17/2004
60169 Monterey County Water Res Agency
Small Hydro 12,204,000 0 0 12,352,000 1% EAO 12/17/2004
60170* Nelson Creek Power Inc.
Small Hydro 4,080,000 0 0 N/A N/A No Data 12/17/2004
60171 Nevada Power Authority
Small Hydro 15,117,000 0 0 15,062,000 0% EAO 12/17/2004
60172 NID/Combie South Small Hydro 7,090,354 0 0 7,090,000 0% EAO 12/17/2004
60173 Scotts Flat Powerhouse Small Hydro 4,342,950 0 0 37,070,000 754% EAO 12/17/2004
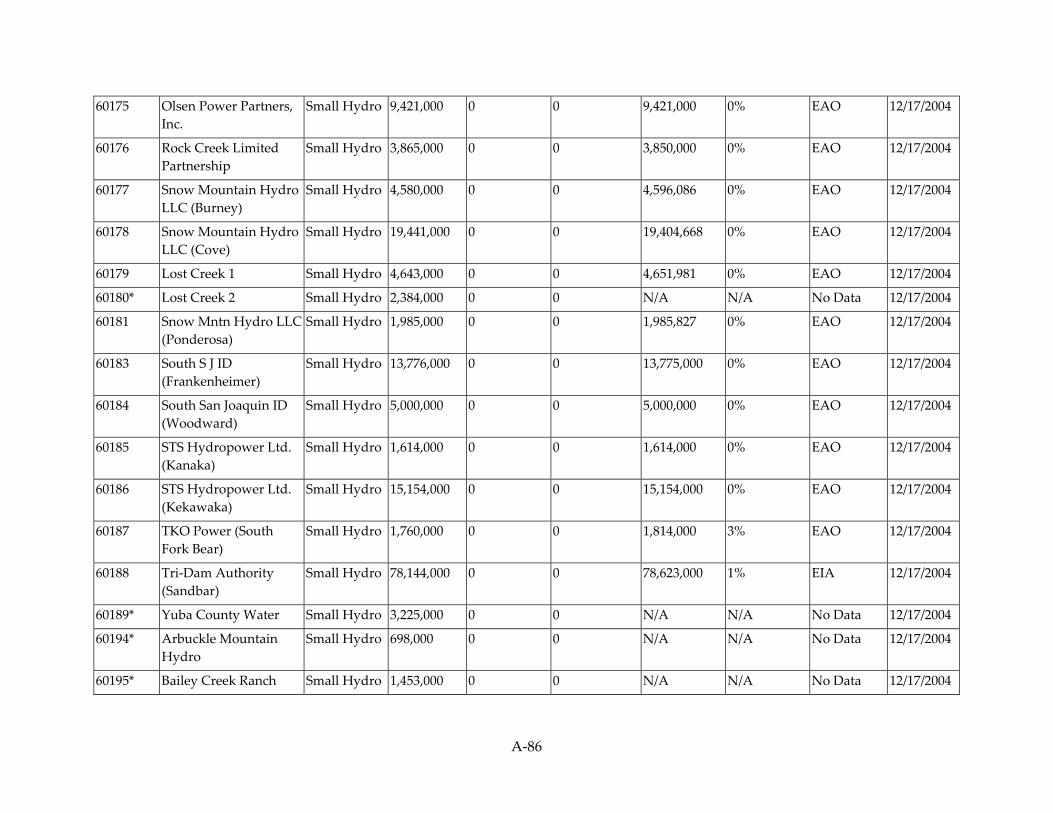
A‐86
60175 Olsen Power Partners, Inc.
Small Hydro 9,421,000 0 0 9,421,000 0% EAO 12/17/2004
60176 Rock Creek Limited Partnership
Small Hydro 3,865,000 0 0 3,850,000 0% EAO 12/17/2004
60177 Snow Mountain Hydro LLC (Burney)
Small Hydro 4,580,000 0 0 4,596,086 0% EAO 12/17/2004
60178 Snow Mountain Hydro LLC (Cove)
Small Hydro 19,441,000 0 0 19,404,668 0% EAO 12/17/2004
60179 Lost Creek 1 Small Hydro 4,643,000 0 0 4,651,981 0% EAO 12/17/2004
60180* Lost Creek 2 Small Hydro 2,384,000 0 0 N/A N/A No Data 12/17/2004
60181 Snow Mntn Hydro LLC (Ponderosa)
Small Hydro 1,985,000 0 0 1,985,827 0% EAO 12/17/2004
60183 South S J ID (Frankenheimer)
Small Hydro 13,776,000 0 0 13,775,000 0% EAO 12/17/2004
60184 South San Joaquin ID (Woodward)
Small Hydro 5,000,000 0 0 5,000,000 0% EAO 12/17/2004
60185 STS Hydropower Ltd. (Kanaka)
Small Hydro 1,614,000 0 0 1,614,000 0% EAO 12/17/2004
60186 STS Hydropower Ltd. (Kekawaka)
Small Hydro 15,154,000 0 0 15,154,000 0% EAO 12/17/2004
60187 TKO Power (South Fork Bear)
Small Hydro 1,760,000 0 0 1,814,000 3% EAO 12/17/2004
60188 Tri‐Dam Authority (Sandbar)
Small Hydro 78,144,000 0 0 78,623,000 1% EIA 12/17/2004
60189* Yuba County Water Small Hydro 3,225,000 0 0 N/A N/A No Data 12/17/2004
60194* Arbuckle Mountain Hydro
Small Hydro 698,000 0 0 N/A N/A No Data 12/17/2004
60195* Bailey Creek Ranch Small Hydro 1,453,000 0 0 N/A N/A No Data 12/17/2004

A‐87
60196* Bertha Wright Bertillion
Small Hydro 37,000 0 0 N/A N/A No Data 12/17/2004
60197* Browns Valley Irrigation Dist.
Small Hydro 2,537,000 0 0 N/A N/A No Data 12/17/2004
60201* Canal Creek Power Plant (Reta)
Small Hydro 1,703,000 0 0 N/A N/A No Data 12/17/2004
60202* Charcoal Ravine Small Hydro 38,000 0 0 N/A N/A No Data 12/17/2004
60205* David O. Harde Small Hydro 9,644 0 0 9,784 1% Inv 12/17/2004
60206* Digger Creek Ranch Small Hydro 3,165,000 0 0 N/A N/A No Data 12/17/2004
60207* E J M McFadden Small Hydro 445,000 0 0 N/A N/A No Data 12/17/2004
60208* Eagle Hydro Small Hydro 2,624,000 0 0 N/A N/A No Data 12/17/2004
60209* Eric and Debbie Watternburg
Small Hydro 163,000 0 0 N/A N/A No Data 12/17/2004
60210* Fairfield Power Plant Small Hydro 2,709,000 0 0 N/A N/A No Data 12/17/2004
60211* Five Bears Hydroelectric
Small Hydro 155,000 0 0 N/A N/A No Data 12/17/2004
60214* Vecino Vineyards LLC Small Hydro 235,000 0 0 N/A N/A No Data 12/17/2004
60215* Hat Creek Hereford Ranch
Small Hydro 296,000 0 0 N/A N/A No Data 12/17/2004
60216* Henwood Associates Small Hydro 2,342,000 0 0 N/A N/A No Data 12/17/2004
60217* Jackson Valley Irrigation Dist
Small Hydro 418,000 0 0 N/A N/A No Data 12/17/2004
60218* James B. Peter Small Hydro 131,000 0 0 N/A N/A No Data 12/17/2004
60219* James Crane Hydro Small Hydro 11,000 0 0 N/A N/A No Data 12/17/2004
60220* John Neerhout Jr. Small Hydro 118,000 0 0 N/A N/A No Data 12/17/2004
60221* Kings River Hydro Co. Small Hydro 1,072,000 0 0 N/A N/A No Data 12/17/2004
60222* Lassen Station Hydro Small Hydro 3,000,000 0 0 N/A N/A No Data 12/17/2004

A‐88
60223* Lofton Ranch Small Hydro 581,000 0 0 N/A N/A No Data 12/17/2004
60224* Madera Canal (1174 + 84)
Small Hydro 1,809,000 0 0 N/A N/A No Data 12/17/2004
60225* Madera Canal (1923) Small Hydro 2,788,000 0 0 N/A N/A No Data 12/17/2004
60226* Madera Canal Station 1302
Small Hydro 876,000 0 0 N/A N/A No Data 12/17/2004
60227* Mega Hydro #1 (Clover Creek)
Small Hydro 4,524,000 0 0 N/A N/A No Data 12/17/2004
60228* Mega Hydro (Goose Valley Ranch)
Small Hydro 325,000 0 0 N/A N/A No Data 12/17/2004
60229* Mega Renewables (Silver Springs)
Small Hydro 2,040,000 0 0 N/A N/A No Data 12/17/2004
60230* Mill & Sulphur Creek Small Hydro 2,934,000 0 0 N/A N/A No Data 12/17/2004
60232 Orange Cove Irrigation District ‐ Friant Fishwater Release Hydroelectric Facility
Small Hydro 3,330,000 0 0 3,329,983 0% RPS 12/17/2004
60234* Placer County Water Agency
Small Hydro 2,983,000 0 0 N/A N/A No Data 12/17/2004
60236* Rock Creek Water District
Small Hydro 596,000 0 0 N/A N/A No Data 12/17/2004
60237* Santa Clara Valley Water Dist.
Small Hydro 266,000 0 0 N/A N/A No Data 12/17/2004
60238 Schaads Hydro Small Hydro 839,000 0 0 839,832 0% RPS 12/17/2004
60239* Shamrock Utilities (Cedar Flat)
Small Hydro 1,686,000 0 0 N/A N/A No Data 12/17/2004
60240* Shamrock Utilities (Clover Leaf)
Small Hydro 833,000 0 0 N/A N/A No Data 12/17/2004
60242 Sierra Energy Small Hydro 182,000 0 0 3,813,000 1995% EAO 12/17/2004
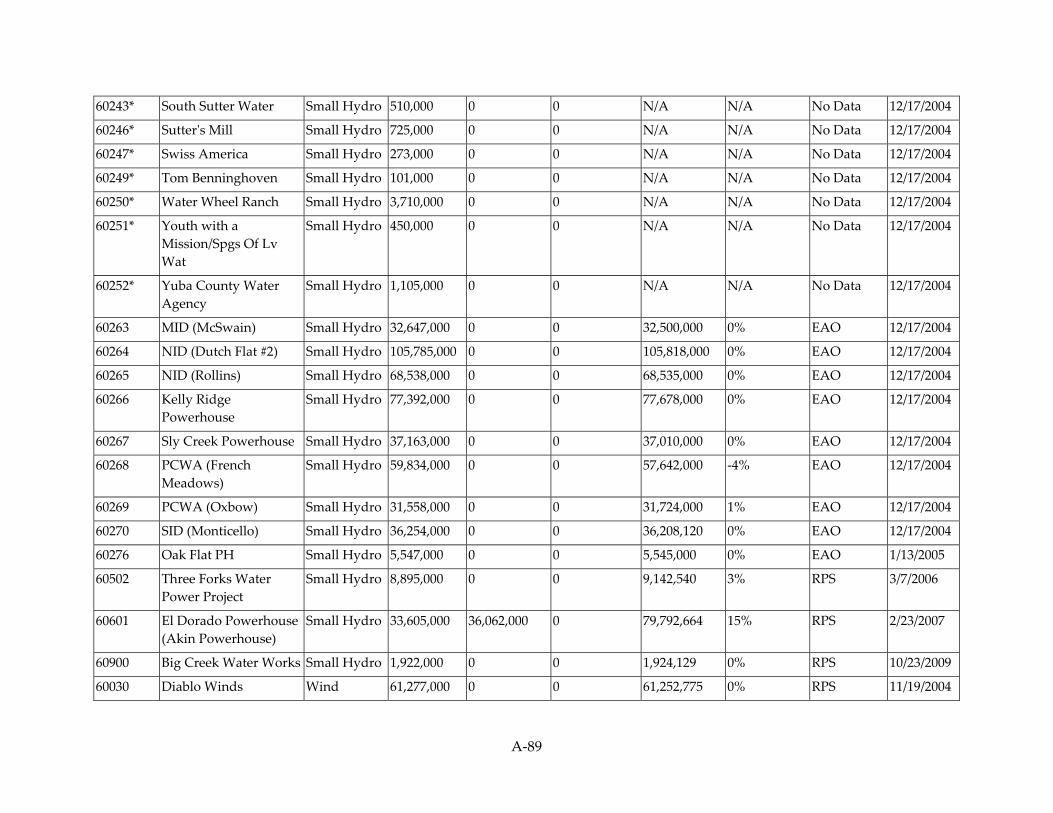
A‐89
60243* South Sutter Water Small Hydro 510,000 0 0 N/A N/A No Data 12/17/2004
60246* Sutterʹs Mill Small Hydro 725,000 0 0 N/A N/A No Data 12/17/2004
60247* Swiss America Small Hydro 273,000 0 0 N/A N/A No Data 12/17/2004
60249* Tom Benninghoven Small Hydro 101,000 0 0 N/A N/A No Data 12/17/2004
60250* Water Wheel Ranch Small Hydro 3,710,000 0 0 N/A N/A No Data 12/17/2004
60251* Youth with a Mission/Spgs Of Lv Wat
Small Hydro 450,000 0 0 N/A N/A No Data 12/17/2004
60252* Yuba County Water Agency
Small Hydro 1,105,000 0 0 N/A N/A No Data 12/17/2004
60263 MID (McSwain) Small Hydro 32,647,000 0 0 32,500,000 0% EAO 12/17/2004
60264 NID (Dutch Flat #2) Small Hydro 105,785,000 0 0 105,818,000 0% EAO 12/17/2004
60265 NID (Rollins) Small Hydro 68,538,000 0 0 68,535,000 0% EAO 12/17/2004
60266 Kelly Ridge Powerhouse
Small Hydro 77,392,000 0 0 77,678,000 0% EAO 12/17/2004
60267 Sly Creek Powerhouse Small Hydro 37,163,000 0 0 37,010,000 0% EAO 12/17/2004
60268 PCWA (French Meadows)
Small Hydro 59,834,000 0 0 57,642,000 ‐4% EAO 12/17/2004
60269 PCWA (Oxbow) Small Hydro 31,558,000 0 0 31,724,000 1% EAO 12/17/2004
60270 SID (Monticello) Small Hydro 36,254,000 0 0 36,208,120 0% EAO 12/17/2004
60276 Oak Flat PH Small Hydro 5,547,000 0 0 5,545,000 0% EAO 1/13/2005
60502 Three Forks Water Power Project
Small Hydro 8,895,000 0 0 9,142,540 3% RPS 3/7/2006
60601 El Dorado Powerhouse (Akin Powerhouse)
Small Hydro 33,605,000 36,062,000 0 79,792,664 15% RPS 2/23/2007
60900 Big Creek Water Works Small Hydro 1,922,000 0 0 1,924,129 0% RPS 10/23/2009
60030 Diablo Winds Wind 61,277,000 0 0 61,252,775 0% RPS 11/19/2004

A‐90
60118* Altamont Midway Ltd Wind 9,783,000 0 0 N/A N/A No Data 12/17/2004
60119* Altamont Power LLC (3‐4)
Wind 6,038,000 0 0 N/A N/A No Data 12/17/2004
60120* Altamont Power LLC (4‐4)
Wind 29,547,000 0 0 N/A N/A No Data 12/17/2004
60122* Altamont Power LLC (6‐4)
Wind 24,301,000 0 0 N/A N/A No Data 12/17/2004
60124 Buena Vista Wind Farm
Wind 90,066,000 0 0 89,246,000 ‐1% EIA 12/17/2004
60125* Green Ridge Power LLC (10MW)
Wind 21,685,000 0 0 N/A N/A No Data 12/17/2004
60126* Green Ridge Power LLC (100MW‐A)
Wind 70,061,000 0 0 N/A N/A No Data 12/17/2004
60128* Green Ridge Power LLC (100MW‐C)
Wind 9,041,000 0 0 N/A N/A No Data 12/17/2004
60129* Green Ridge Power LLC (100MW‐D)
Wind 15,141,000 0 0 N/A N/A No Data 12/17/2004
60130* Green Ridge Power LLC (110MW)
Wind 240,730,000 0 0 N/A N/A No Data 12/17/2004
60131* Green Ridge Power LLC (23.8MW)
Wind 15,655,000 0 0 N/A N/A No Data 12/17/2004
60133* Green Ridge Power LLC (5.9MW)
Wind 10,070,000 0 0 N/A N/A No Data 12/17/2004
60135* Green Ridge Power LLC (70MW‐B)
Wind 23,050,000 0 0 N/A N/A No Data 12/17/2004
60136* Green Ridge Power LLC (70MW‐C)
Wind 37,128,000 0 0 N/A N/A No Data 12/17/2004
60137* Green Ridge Power LLC (70MW‐D)
Wind 1,870,000 0 0 N/A N/A No Data 12/17/2004
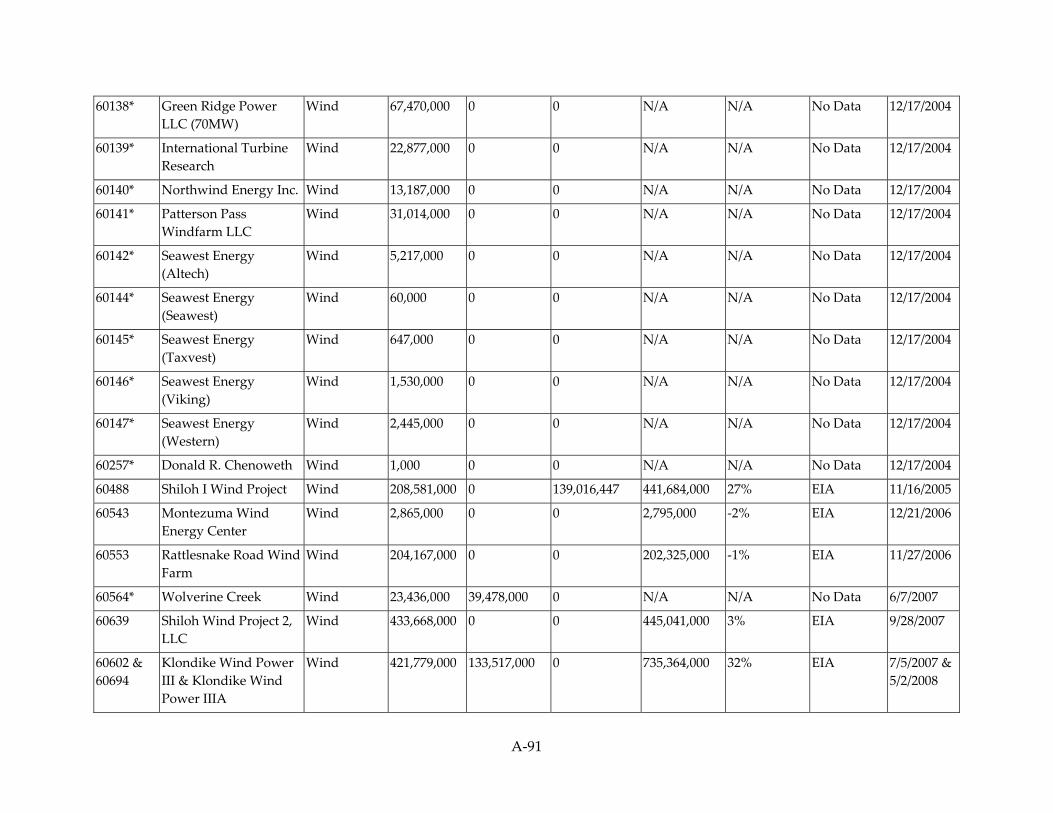
A‐91
60138* Green Ridge Power LLC (70MW)
Wind 67,470,000 0 0 N/A N/A No Data 12/17/2004
60139* International Turbine Research
Wind 22,877,000 0 0 N/A N/A No Data 12/17/2004
60140* Northwind Energy Inc. Wind 13,187,000 0 0 N/A N/A No Data 12/17/2004
60141* Patterson Pass Windfarm LLC
Wind 31,014,000 0 0 N/A N/A No Data 12/17/2004
60142* Seawest Energy (Altech)
Wind 5,217,000 0 0 N/A N/A No Data 12/17/2004
60144* Seawest Energy (Seawest)
Wind 60,000 0 0 N/A N/A No Data 12/17/2004
60145* Seawest Energy (Taxvest)
Wind 647,000 0 0 N/A N/A No Data 12/17/2004
60146* Seawest Energy (Viking)
Wind 1,530,000 0 0 N/A N/A No Data 12/17/2004
60147* Seawest Energy (Western)
Wind 2,445,000 0 0 N/A N/A No Data 12/17/2004
60257* Donald R. Chenoweth Wind 1,000 0 0 N/A N/A No Data 12/17/2004
60488 Shiloh I Wind Project Wind 208,581,000 0 139,016,447 441,684,000 27% EIA 11/16/2005
60543 Montezuma Wind Energy Center
Wind 2,865,000 0 0 2,795,000 ‐2% EIA 12/21/2006
60553 Rattlesnake Road Wind Farm
Wind 204,167,000 0 0 202,325,000 ‐1% EIA 11/27/2006
60564* Wolverine Creek Wind 23,436,000 39,478,000 0 N/A N/A No Data 6/7/2007
60639 Shiloh Wind Project 2, LLC
Wind 433,668,000 0 0 445,041,000 3% EIA 9/28/2007
60602 & 60694
Klondike Wind Power III & Klondike Wind Power IIIA
Wind 421,779,000 133,517,000 0 735,364,000 32% EIA 7/5/2007 & 5/2/2008

A‐92
60712 Vantage Wind Project Wind 46,256,267 0 0 63,759,835 38% RPS 7/21/2008
60721 White Creek Wind I Wind 51,801,000 205,465,000 0 532,124,000 107% EIA 2/28/2008
60730* Marengo II Wind 7,270,000 102,816,000 0 N/A N/A No Data 10/21/2008
60741 Hatchet Ridge Wind Farm
Wind 53,731,000 0 0 53,571,805 0% Inv 12/3/2008
60776 Big Horn Wind Project Wind 75,000,000 0 60,367,000 484,570,000 258% EIA 1/5/2009
60804 Glenrock III Wind 48,139,000 1,690,000 0 387,908,000 678% EIA 2/5/2009
60805 Glenrock I Wind 47,159,000 114,104,000 0 387,908,000 141% EIA 2/5/2009
60806 Rolling Hills Wind 181,327,000 33,813,000 0 252,669,000 17% EIA 1/26/2009
60807 Seven Mile Hill I Wind 150,033,000 5,480,000 0 391,845,000 152% EIA 2/12/2009
60808 Seven Mile Hill II Wind 47,820,000 1,145,000 0 391,845,000 700% EIA 2/12/2009
60819 Goodnoe Hills Wind 150,016,000 3,589,000 0 212,268,000 38% EIA 4/22/2009
* RPS identification numbers that end in the suffix E and show No Data in the column ʺGeneration Data Used for Comparison with Procurementʺ are utility‐certified facilities with no independently reported generation. As stated on page 47 in the RPS Eligibility Guidebook, Third Edition, the retail seller is responsible for reporting the generation data for the facilities it certifies. This reporting requirement will be satisfied through the CEC‐RPS‐Track forms. Therefore, the asterisk indicates that the facility is utility‐certified and that the procurement amount reported is accepted as reported on the RPS‐Track form.
1 PG&E has requested that 18,000 kWh from the procurement claim from City Of Watsonville (RPS ID 60190) be counted as withdrawn procurement due to non‐renewable fuel use
2 PG&E has requested that 336,280 kWh from the procurement claim from Amedee Geothermal Venture I (RPS ID 60111) be counted as withdrawn procurement due to corrections in WREGIS. This procurement amount may be applied to PG&E’s 2012 RPS procurement claims during a future verification process.
3 PG&E has requested that 1,273,610 kWh from the procurement claim from Wineagle Developers 1 (RPS ID 60193) be counted as withdrawn procurement due to corrections in WREGIS. This procurement amount may be applied to PG&E’s 2012 RPS procurement claims during a future verification process.

A‐93
Southern California Edison RPS Procurement Claims Analysis 2008 RPS Procurement Claims
CEC RPS ID
Number1 Facility Name2 Fuel Type3
Annual Generation Procured (kWh)4
RPS Procurement Claims by Other Retail Sellers (kWh)5
Procurement Reported to Power Source
Disclosure Program/ Voluntary Programs (kWh)6
Generation Data Used
for Comparison
With Procurement (kWh)7
Percent Difference Between Generation
and Procurement8
Generation Data Source9
Facilityʹs Beginning On Date10
60020 Imperial Valley Resource Recovery
Biomass 5,236,000 0 0 5,236,000 0% RPS 8/11/2004
60286 & 60692
Colmac Energy Mecca Plant
Biomass 359,505,000 0 0 359,506,000 0% EAO 6/2/2008
60327 Metropolitan Water District
Conduit Hydro
18,128,000 0 0 308,092,000 1600% EIA 4/5/2005
60330* Calleguas Municipal Water District ‐ Conejo
Conduit Hydro
421,797 0 0 N/A N/A No Data 4/5/2005
60333* Walnut Valley Water District ‐ Unit 1
Conduit Hydro
949,245 0 0 N/A N/A No Data 4/5/2005
60335 Calleguas MWD ‐ Unit 2 (East Portal)
Conduit Hydro
7,008,529 0 0 7,009,000 0% EIA 4/5/2005
60340* Daniel M. Bates, et al. Conduit Hydro
520,225 0 0 N/A N/A No Data 4/5/2005
60341* Richard Moss Conduit Hydro
355,237 0 0 N/A N/A No Data 4/5/2005
60343* Three Valleys MWD (Fulton Road)
Conduit Hydro
980,833 0 0 N/A N/A No Data 4/5/2005

A‐94
60344* Three Valleys MWD (Miramar)
Conduit Hydro
1,519,094 0 0 N/A N/A No Data 4/5/2005
60345* Three Valleys MWD (Williams)
Conduit Hydro
1,574,817 0 0 N/A N/A No Data 4/5/2005
60347* Picay Hydroelectric Project
Conduit Hydro
646,910 0 0 N/A N/A No Data 4/5/2005
60348* Calleguas MWD ‐ Unit 3 (Santa Rosa)
Conduit Hydro
1,345,752 0 0 N/A N/A No Data 4/5/2005
60349* City Of Santa Ana Conduit Hydro
4,241 0 0 N/A N/A No Data 4/5/2005
60350* Goleta Water District Conduit Hydro
507,426 0 0 N/A N/A No Data 4/5/2005
60354* San Bernardino MWD (Unit 3)
Conduit Hydro
272,862 0 0 N/A N/A No Data 4/5/2005
60355* American Energy, Inc. (Fullerton Hydro)
Conduit Hydro
694,280 0 0 N/A N/A No Data 4/5/2005
60356* Monte Vista Water District
Conduit Hydro
1,218,689 0 0 N/A N/A No Data 4/5/2005
60358 Calleguas MWD (Springville Hydro)
Conduit Hydro
2,341,622 0 0 2,342,000 0% EAO 4/5/2005
60618 Sepulveda Canyon Power Plant
Conduit Hydro
7,187,000 0 0 7,945,000 11% EIA 3/30/2005
60619 Lake Perris Power Plant
Conduit Hydro
10,650,947 0 0 13,103,000 23% EIA 3/30/2005
60621 Temescal Power Plant Conduit Hydro
13,092,836 0 0 16,451,019 26% RPS 3/30/2005
60622 Corona Power Plant Conduit Hydro
12,809,896 0 0 15,984,000 25% EAO 3/30/2005

A‐95
60623 Rio Hondo Power Plant
Conduit Hydro
5,227,846 0 0 6,153,325 18% RPS 3/30/2005
60624 Coyote Creek Power Plant
Conduit Hydro
10,783,302 0 0 16,361,209 52% RPS 3/30/2005
60625 Red Mountain Power Plant
Conduit Hydro
16,160,525 0 0 41,962,000 160% EAO 3/30/2005
61020 Mammoth Pool Fish Water Generator
Conduit Hydro
1,222,077 0 0 296,341,000 24149% EIA 3/9/2010
60279* Royal Farms Digester Gas 92,549 0 0 N/A N/A No Data 4/5/2005
60294 Orange County Sanitation District
Digester Gas 76,780 0 0 49,420,000 64266% EAO 4/5/2005
60295* Inland Empire Utilities Agency
Digester Gas 1,196,369 0 0 N/A N/A No Data 4/5/2005
60004 Calpine Geothermal Unit 12
Geothermal 345,920,300 35,255,630 7,986 389,217,000 2% EAO 6/14/2004
60005 Calpine Geothermal Unit 13
Geothermal 5,710,500 389,197,765 22,053 435,641,000 10% EAO 6/14/2004
60006 Calpine Geothermal Unit 16
Geothermal 411,401,600 13,055,010 0 424,557,000 0% EAO 6/14/2004
60007 Calpine Geothermal Unit 17
Geothermal 426,215,150 386,000 0 427,360,000 0% EAO 6/14/2004
60008 Calpine Geothermal Unit 18
Geothermal 49,565,000 336,961,511 19,803 406,347,000 5% EAO 6/14/2004
60009 Calpine Geothermal Unit 20
Geothermal 59,556,700 196,739,914 83,087 358,231,000 40% EAO 6/14/2004
60010 Sonoma/Calpine Geyser
Geothermal 28,927,000 50,336,000 260,016 341,543,000 329% EAO 6/14/2004
60025 Calpine Geothermal Unit 11
Geothermal 384,950,680 59,281,268 46,256 512,842,000 15% EAO 6/14/2004

A‐96
60026 Calpine Geothermal Unit 14
Geothermal 423,988,070 1,053,666 0 425,088,000 0% EAO 6/14/2004
60305 Heber Geothermal Company
Geothermal 357,853,000 0 0 377,001,000 5% EAO 4/5/2005
60306 Mammoth Pacific L. P. (MP1)
Geothermal 42,879,889 0 0 42,880,000 0% EIA 4/5/2005
60307 Del Ranch, Ltd., (Niland #2)
Geothermal 334,143,000 0 0 322,178,000 ‐4% EAO 4/5/2005
60308 Vulcan/BN Geothermal
Geothermal 283,181,000 0 0 272,865,000 ‐4% EAO 4/5/2005
60309 Coso Finance Partners (Navy I)
Geothermal 624,161,040 0 0 625,568,000 0% EAO 4/5/2005
60310 Elmore Ltd. Geothermal 333,366,000 0 0 322,000,000 ‐3% EIA 4/5/2005
603111 Ormesa Geothermal I Geothermal 170,709,789 0 0 215,907,000 26% EAO 4/5/2005
603121 Ormesa Geothermal II Geothermal 124,676,780 0 0 154,851,000 24% EIA 4/5/2005
60313 Caithness Dixie Valley, LLC.
Geothermal 382,296,912 0 0 387,669,560 1% EIA 4/5/2005
60315 Mammoth Pacific L. P. I (Ples)
Geothermal 101,648,072 0 0 102,309,000 1% EAO 4/5/2005
60316 Second Imperial Geothermal Co.
Geothermal 285,011,000 0 16,811,000 343,861,000 14% EAO 4/5/2005
60317 Salton Sea Power Generation L.P. #3
Geothermal 411,267,000 0 0 400,000,000 ‐3% EIA 4/5/2005
60318 Leathers L. P. Geothermal 358,166,000 0 0 350,000,000 ‐2% EIA 4/5/2005
60319 Mammoth Pacific L P II (MP2)
Geothermal 94,120,028 0 0 94,119,000 0% EIA 4/5/2005
60320 Salton Sea Power Generation L.P. #2
Geothermal 134,087,000 0 0 140,000,000 4% EIA 4/5/2005

A‐97
60321 Coso Power Developers
Geothermal 580,976,526 0 0 580,976,560 0% RPS 4/5/2005
60322 Coso Energy Developers
Geothermal 489,341,930 0 0 489,670,000 0% EAO 4/5/2005
60323 Salton Sea Power Generation L.P. #1
Geothermal 81,055,000 0 0 80,000,000 ‐1% EIA 4/5/2005
60324 Salton Sea IV Geothermal 357,815,000 0 0 344,000,000 ‐4% EIA 4/5/2005
60640 North Brawley Geothermal 870,000 0 0 870,000 0% Inv 10/16/2007
614312 Ormesa Geothermal I (Geo East Mesa)
Geothermal 66,606,000 0 0 N/A N/A No Data 4/4/2011
60278 Generating Resource Recovery Partners, LP
Landfill Gas 14,606,622 0 0 15,052,000 3% EIA 4/5/2005
60280 L.A. Co. Sanitation Dist CSD 2610
Landfill Gas 5,191,210 0 0 442,830,000 8430% EIA 4/5/2005
60283 Toyon Landfill Gas Conversion
Landfill Gas 13,340,729 0 0 13,029,000 ‐2% EIA 4/5/2005
60288 L.A. Co. Sanitation Dist Spadra
Landfill Gas 47,207,156 0 0 47,387,000 0% EIA 4/5/2005
60289 L.A. Co. Sanitation Dist #C‐2850
Landfill Gas 25,255,736 0 0 25,963,000 3% EIA 4/5/2005
60290 L.A. Co. Sanitation Dist
Landfill Gas 388,179,966 0 0 442,830,000 14% EIA 4/5/2005
60292 WM Energy Solutions, Inc. (El Sobrante)
Landfill Gas 10,406,602 0 0 10,407,000 0% EAO 4/5/2005
60293 WM Energy Solutions, Inc. (Simi Valley)
Landfill Gas 10,991,081 0 0 10,992,000 0% EAO 4/5/2005
60298 MM Tajiguas Energy LLC
Landfill Gas 22,400,847 0 0 22,580,000 1% EAO 4/5/2005

A‐98
60301* MM Woodville Energy LLC
Landfill Gas 2,266,468 0 0 N/A N/A No Data 4/5/2005
60304* Ventura Regional Sanitation District
Landfill Gas 96,034 0 0 N/A N/A No Data 4/5/2005
60707 SPVP001 Photovoltaic 438,000 0 0 N/A N/A No Data 5/28/2008
60216 Henwood Associates Small Hydro 558,000 1,250,085 0 No Data 12/17/2004
60326 Hi Head Hydro Incorporated
Small Hydro 2,157,018 0 0 N/A N/A No Data 4/5/2005
60328 Henwood Associates Small Hydro 253,851 0 0 No Data 4/5/2005
60329* Desert Power Company
Small Hydro 1,283,978 0 0 N/A N/A No Data 4/5/2005
60332* San Bernardino MWD Small Hydro 446,563 0 0 N/A N/A No Data 4/5/2005
60334* Irvine Ranch Water District
Small Hydro 210,040 0 0 N/A N/A No Data 4/5/2005
60336 Whitewater Small Hydro 546,000 0 0 546,000 0% EIA 4/5/2005
60337* Snow Creek Small Hydro 373,796 0 0 N/A N/A No Data 4/5/2005
60338 Success Dam Power Project
Small Hydro 873,798 0 0 874,334,000 99961% Inv 4/5/2005
60339 San Gabriel Hydroelectric Project
Small Hydro 13,198,268 0 0 13,199,000 0% EIA 4/5/2005
60342 Isabella Hydroelectric Project
Small Hydro 16,685,516 0 0 16,688,000 0% EAO 4/5/2005
60346 Kaweah River Power Authority
Small Hydro 30,814,680 0 0 30,816,000 0% EAO 4/5/2005
60351 United Water Conservation District
Small Hydro 728,000 0 0 741,000 2% EAO 4/5/2005
60352* Deep Springs College Small Hydro 5,215 0 0 N/A N/A No Data 4/5/2005

A‐99
60444 Bishop Creek No. 2 Small Hydro 22,276,503 0 0 22,279,000 0% EIA 5/11/2005
60446 Bishop Creek No. 3 Small Hydro 23,923,073 0 0 23,924,000 0% EIA 5/11/2005
60447 Bishop Creek No. 4 Small Hydro 32,964,426 0 0 32,827,000 0% EIA 5/11/2005
60448 Bishop Creek No. 5 Small Hydro 12,083,088 0 0 12,083,000 0% EIA 5/11/2005
60449 Bishop Creek No. 6 Small Hydro 6,993,358 0 0 6,983,000 0% EIA 5/11/2005
60450 Borel Small Hydro 45,368,145 0 0 45,358,000 0% EIA 5/11/2005
60451 Fontana Small Hydro 6,496,763 0 0 6,496,000 0% EIA 5/11/2005
60452 Kaweah No. 1 Small Hydro 8,986,381 0 0 8,956,000 0% EIA 5/11/2005
60453 Kaweah No. 2 Small Hydro 10,979,826 0 0 10,955,000 0% EIA 5/11/2005
60454 Kaweah No. 3 Small Hydro 18,293,560 0 0 18,265,000 0% EIA 5/11/2005
60455 Kern River No. 1 Small Hydro 44,255,000 0 0 44,255,000 0% EIA 5/11/2005
60456 Lundy Small Hydro 4,925,342 0 0 4,894,000 ‐1% EIA 5/11/2005
60457 Lytle Creek Small Hydro 3,080,043 0 0 3,080,000 0% EAO 5/11/2005
60458 Mill Creek No. 1 Small Hydro 1,930,742 0 0 1,900,000 ‐2% EAO 5/11/2005
60459 Mill Creek No. 3 Small Hydro 10,734,459 0 0 10,731,000 0% EIA 5/11/2005
60460 Ontario No. 1 Small Hydro 4,477,740 0 0 4,478,000 0% EAO 5/11/2005
60461 Ontario No. 2 Small Hydro 1,066,754 0 0 1,067,000 0% EAO 5/11/2005
60462 Poole Plant Small Hydro 22,115,226 0 0 22,113,000 0% EIA 5/11/2005
60463 Portal Power Plant Small Hydro 20,857,447 0 0 20,733,000 ‐1% EAO 5/11/2005
60464 Rush Creek Small Hydro 16,070,302 0 0 16,070,000 0% EIA 5/11/2005
60465 Santa Ana No. 1 Small Hydro 5,181,872 0 0 5,160,000 0% EIA 5/11/2005
60466 Santa Ana No. 3 Small Hydro 2,728,332 0 0 2,701,000 ‐1% EIA 5/11/2005
60467 Sierra Small Hydro 3,442,698 0 0 3,442,000 0% EAO 5/11/2005
60468 Tule River Small Hydro 14,393,092 0 0 34,756,000 141% EIA 5/11/2005
60359 Sunray Energy, Inc. Solar Thermal
43,029,846 0 0 59,045,000 37% EIA 4/5/2005

A‐100
60360 Luz Solar Partners Ltd. III
Solar Thermal
72,392,228 0 0 72,393,048 0% ERFP 4/5/2005
60361 Luz Solar Partners Ltd. IV
Solar Thermal
72,294,828 0 0 72,516,000 0% EIA 4/5/2005
60362 Luz Solar Partners Ltd. V
Solar Thermal
72,798,956 0 0 72,799,164 0% ERFP 4/5/2005
60363 Luz Solar Partners Ltd. VI
Solar Thermal
76,851,384 0 0 76,851,540 0% ERFP 4/5/2005
60364 Luz Solar Partners Ltd. VII
Solar Thermal
74,704,460 0 0 74,705,364 0% ERFP 4/5/2005
60365 Luz Solar Partners Ltd. VIII
Solar Thermal
152,017,472 0 0 152,018,712 0% ERFP 4/5/2005
60366 Luz Solar Partners Ltd. IX
Solar Thermal
166,168,504 0 0 166,168,800 0% ERFP 4/5/2005
60027 Boom‐Campbell Wind Farm
Wind 22,641,696 0 0 33,841,656 49% RPS 10/10/2004
60028 Sirocco Wind 7,487,158 0 0 11,243,293 50% RPS 10/10/2004
60029 Cellc 7.5 MW Tehachapi Wind Project
Wind 18,541,384 0 0 28,010,000 51% EIA 10/10/2004
60284 & 60285
Mountain View I & II Wind 191,191,244 0 0 186,529,000 ‐2% RPS 4/5/2005
60291* Calwind Resources Inc. II
Wind 53,486,696 0 0 N/A N/A No Data 4/5/2005
60368 FPL Energy Cabazon Wind, LLC
Wind 57,405,696 0 0 57,082,000 ‐1% EIA 4/5/2005
60369* Mogul Energy Partnership I
Wind 11,632,280 0 0 N/A N/A No Data 4/5/2005
60370* Mesa Wind Wind 52,016,442 0 0 N/A N/A No Data 4/5/2005

A‐101
Developers
60371* San Gorgonio Farms Wind Farm
Wind 7,274,490 0 0 N/A N/A No Data 4/5/2005
60372 Boxcar I Power Purchase Contract Trust
Wind 10,804,464 0 0 31,837,000 195% EIA 4/5/2005
60373* Windsong Wind Park Wind 4,820,480 0 0 N/A N/A No Data 4/5/2005
60374* Zephyr Park, Ltd Wind 9,402,176 0 0 N/A N/A No Data 4/5/2005
60375* Ridgetop Energy, LLC (I)
Wind 161,817,688 0 0 N/A N/A No Data 4/5/2005
60376* Coram Energy LLC (Ect)
Wind 13,224,000 0 0 N/A N/A No Data 4/5/2005
60377* Windpower Partners 1993 L.P.
Wind 16,217,679 0 0 N/A N/A No Data 4/5/2005
60378* EUI Management PH Inc.
Wind 43,036,064 0 0 N/A N/A No Data 4/5/2005
60379* Windpower Partners 1993 L.P.
Wind 4,171,161 0 0 N/A N/A No Data 4/5/2005
60380* Tehachapi Power Purchase Contract Trust
Wind 125,653,840 0 0 N/A N/A No Data 4/5/2005
60381* Enron Wind Systems, LLC (VG # I)
Wind 13,151,792 0 0 N/A N/A No Data 4/5/2005
60382* Enron Wind Systems, LLC (VG #2)
Wind 10,342,024 0 0 N/A N/A No Data 4/5/2005
60383* Enron Wind Systems, LLC (VG #3)
Wind 9,243,784 0 0 N/A N/A No Data 4/5/2005
60384* Enron Wind Systems, LLC (VG #4)
Wind 8,161,944 0 0 N/A N/A No Data 4/5/2005
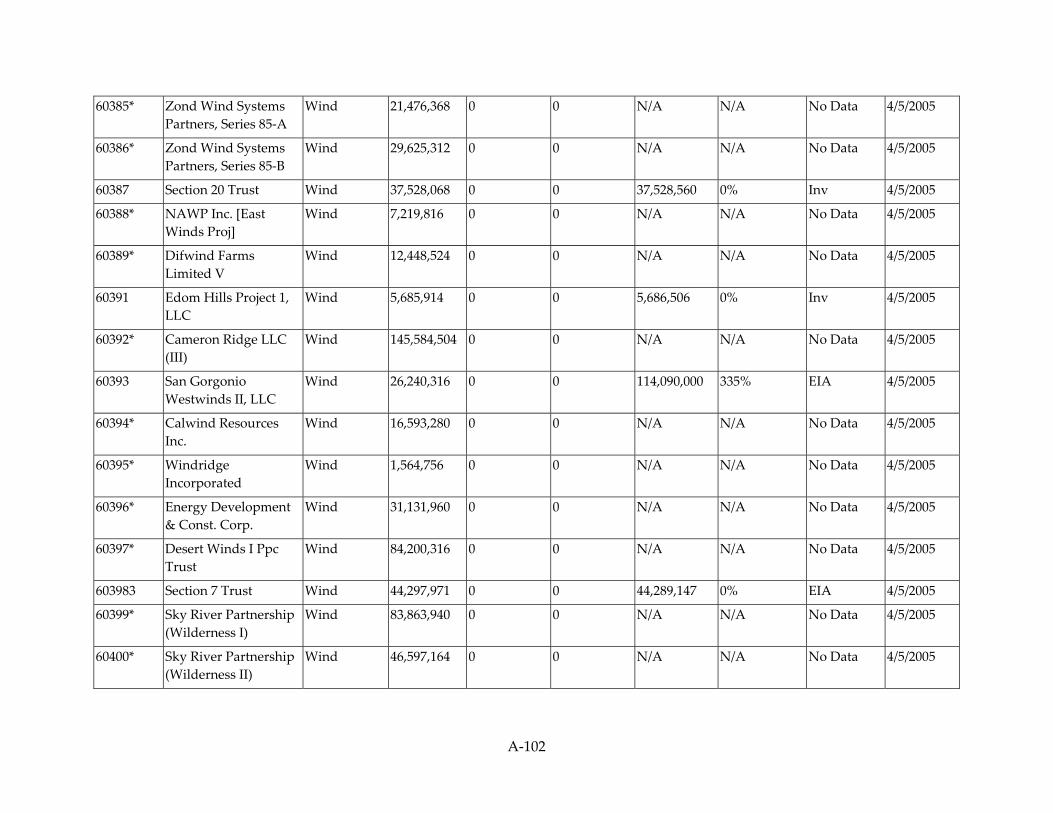
A‐102
60385* Zond Wind Systems Partners, Series 85‐A
Wind 21,476,368 0 0 N/A N/A No Data 4/5/2005
60386* Zond Wind Systems Partners, Series 85‐B
Wind 29,625,312 0 0 N/A N/A No Data 4/5/2005
60387 Section 20 Trust Wind 37,528,068 0 0 37,528,560 0% Inv 4/5/2005
60388* NAWP Inc. [East Winds Proj]
Wind 7,219,816 0 0 N/A N/A No Data 4/5/2005
60389* Difwind Farms Limited V
Wind 12,448,524 0 0 N/A N/A No Data 4/5/2005
60391 Edom Hills Project 1, LLC
Wind 5,685,914 0 0 5,686,506 0% Inv 4/5/2005
60392* Cameron Ridge LLC (III)
Wind 145,584,504 0 0 N/A N/A No Data 4/5/2005
60393 San Gorgonio Westwinds II, LLC
Wind 26,240,316 0 0 114,090,000 335% EIA 4/5/2005
60394* Calwind Resources Inc.
Wind 16,593,280 0 0 N/A N/A No Data 4/5/2005
60395* Windridge Incorporated
Wind 1,564,756 0 0 N/A N/A No Data 4/5/2005
60396* Energy Development & Const. Corp.
Wind 31,131,960 0 0 N/A N/A No Data 4/5/2005
60397* Desert Winds I Ppc Trust
Wind 84,200,316 0 0 N/A N/A No Data 4/5/2005
603983 Section 7 Trust Wind 44,297,971 0 0 44,289,147 0% EIA 4/5/2005
60399* Sky River Partnership (Wilderness I)
Wind 83,863,940 0 0 N/A N/A No Data 4/5/2005
60400* Sky River Partnership (Wilderness II)
Wind 46,597,164 0 0 N/A N/A No Data 4/5/2005

A‐103
60401* Sky River Partnership (Wilderness III)
Wind 50,123,080 0 0 N/A N/A No Data 4/5/2005
60402 Section 16‐29 Trust (Altech III)
Wind 69,776,528 0 0 69,777,888 0% Inv 4/5/2005
60403* Difwind Partners Wind 27,127,100 0 0 N/A N/A No Data 4/5/2005
60404* CTV Power Purchase Contract Trust
Wind 11,199,000 0 0 N/A N/A No Data 4/5/2005
60405 Alta Mesa Pwr. Purch. Contract Trust
Wind 60,835,880 0 0 80,364,000 32% EIA 4/5/2005
60406* Cameron Ridge LLC (IV)
Wind 39,917,648 0 0 N/A N/A No Data 4/5/2005
60407 Ridgetop Energy, LLC (II)
Wind 85,687,488 0 0 85,688,136 0% Inv 4/5/2005
60408* Section 22 Trust [San Jacinto]
Wind 38,092,588 0 0 N/A N/A No Data 4/5/2005
60409* Dutch Energy Wind 19,125,130 0 0 N/A N/A No Data 4/5/2005
60410* Westwind Trust Wind 25,390,328 0 0 N/A N/A No Data 4/5/2005
60411 Boxcar II Power Purchase Contract Trst
Wind 21,032,672 0 0 31,837,000 51% EIA 4/5/2005
60412* BNY Western Trust Company
Wind 1,339,440 0 0 N/A N/A No Data 4/5/2005
60413* Victory Garden Phase IV Partner ‐ 6102
Wind 16,835,912 0 0 N/A N/A No Data 4/5/2005
60414* Victory Garden Phase IV Partner ‐ 6103
Wind 13,931,096 0 0 N/A N/A No Data 4/5/2005
60415* Victory Garden Phase IV Partner ‐ 6104
Wind 16,484,320 0 0 N/A N/A No Data 4/5/2005
60416* Caithness 251 Wind, LLC (Monolith X)
Wind 9,642,320 0 0 N/A N/A No Data 4/5/2005
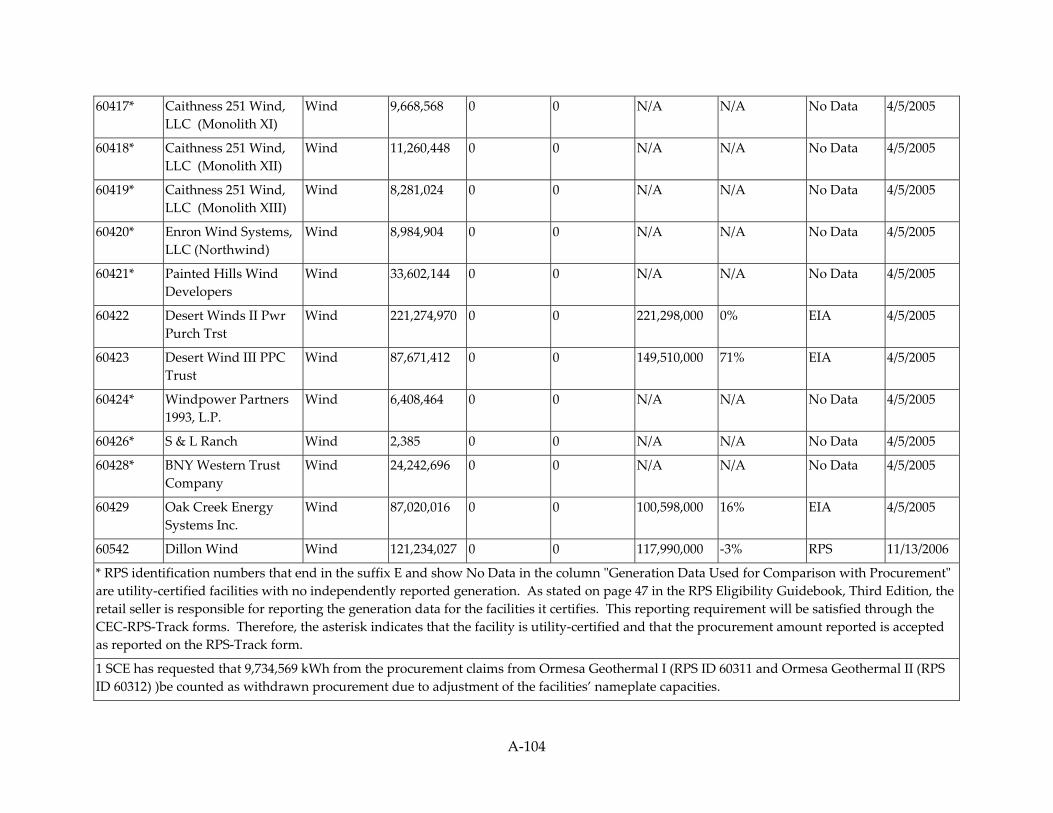
A‐104
60417* Caithness 251 Wind, LLC (Monolith XI)
Wind 9,668,568 0 0 N/A N/A No Data 4/5/2005
60418* Caithness 251 Wind, LLC (Monolith XII)
Wind 11,260,448 0 0 N/A N/A No Data 4/5/2005
60419* Caithness 251 Wind, LLC (Monolith XIII)
Wind 8,281,024 0 0 N/A N/A No Data 4/5/2005
60420* Enron Wind Systems, LLC (Northwind)
Wind 8,984,904 0 0 N/A N/A No Data 4/5/2005
60421* Painted Hills Wind Developers
Wind 33,602,144 0 0 N/A N/A No Data 4/5/2005
60422 Desert Winds II Pwr Purch Trst
Wind 221,274,970 0 0 221,298,000 0% EIA 4/5/2005
60423 Desert Wind III PPC Trust
Wind 87,671,412 0 0 149,510,000 71% EIA 4/5/2005
60424* Windpower Partners 1993, L.P.
Wind 6,408,464 0 0 N/A N/A No Data 4/5/2005
60426* S & L Ranch Wind 2,385 0 0 N/A N/A No Data 4/5/2005
60428* BNY Western Trust Company
Wind 24,242,696 0 0 N/A N/A No Data 4/5/2005
60429 Oak Creek Energy Systems Inc.
Wind 87,020,016 0 0 100,598,000 16% EIA 4/5/2005
60542 Dillon Wind Wind 121,234,027 0 0 117,990,000 ‐3% RPS 11/13/2006
* RPS identification numbers that end in the suffix E and show No Data in the column ʺGeneration Data Used for Comparison with Procurementʺ are utility‐certified facilities with no independently reported generation. As stated on page 47 in the RPS Eligibility Guidebook, Third Edition, the retail seller is responsible for reporting the generation data for the facilities it certifies. This reporting requirement will be satisfied through the CEC‐RPS‐Track forms. Therefore, the asterisk indicates that the facility is utility‐certified and that the procurement amount reported is accepted as reported on the RPS‐Track form.
1 SCE has requested that 9,734,569 kWh from the procurement claims from Ormesa Geothermal I (RPS ID 60311 and Ormesa Geothermal II (RPS ID 60312) )be counted as withdrawn procurement due to adjustment of the facilities’ nameplate capacities.

A‐105
2 SCE has requested that the procurement claim from Ormesa Geothermal I (Geo East Mesa, RPS ID 61431) be counted as withdrawn procurement due the facility not being RPS certified at the time of the procurement claim.
3 SCE has requested that 8,590 kWh from the procurement claim from Section 7 Trust (RPS ID 60398) be counted as withdrawn procurement due to the procurement being attributed to on‐site use.
2009 RPS Procurement Claims
CEC RPS ID
Number1 Facility Name2 Fuel Type3
Annual Generation Procured (kWh)4
RPS Procurement Claims by Other Retail Sellers (kWh)5
Procurement Reported to Power Source
Disclosure Program/ Voluntary Programs (kWh)6
Generation Data Used
for Comparison
With Procurement (kWh)7
Percent Difference Between Generation
and Procurement
8
Generation Data Source9
Facilityʹs Beginning On Date10
60020 Imperial Valley Resource Recovery
Biomass 51,567,000 0 0 51,567,000 0% EIA 6/21/2004
60692 Colmac Energy Mecca Plant
Biomass 357,017,000 0 0 357,017,000 0% EIA 12/4/2004
60330* Calleguas Municipal Water District ‐ Conejo
Conduit Hydro
48,000 0 0 N/A N/A No Data 8/5/2004
60333* Walnut Valley Water District ‐ Unit 1
Conduit Hydro
825,000 0 0 N/A N/A No Data 8/7/2004
60335 Calleguas MWD ‐ Unit 2 (East Portal)
Conduit Hydro
6,675,000 0 0 6,675,000 0% EIA 8/8/2004
60340* Daniel M. Bates, et al. Conduit Hydro
484,000 0 0 N/A N/A No Data 8/13/2004
60341* Richard Moss Conduit Hydro
379,000 0 0 N/A N/A No Data 8/14/2004

A‐106
60343* Three Valleys MWD (Fulton Road)
Conduit Hydro
1,228,000 0 0 N/A N/A No Data 8/16/2004
60344* Three Valleys MWD (Miramar)
Conduit Hydro
1,379,000 0 0 N/A N/A No Data 8/17/2004
60345* Three Valleys MWD (Williams)
Conduit Hydro
1,742,000 0 0 N/A N/A No Data 8/18/2004
60347* Picay Hydroelectric Project
Conduit Hydro
579,000 0 0 N/A N/A No Data 8/20/2004
60348* Calleguas MWD ‐ Unit 3 (Santa Rosa)
Conduit Hydro
381,000 0 0 N/A N/A No Data 8/21/2004
60349* City Of Santa Ana Conduit Hydro
3,000 0 0 N/A N/A No Data 8/22/2004
60350* Van Horne Turbine Generator
Conduit Hydro
113,000 0 0 N/A N/A No Data 8/23/2004
60354* San Bernardino MWD (Unit 3)
Conduit Hydro
181,000 0 0 N/A N/A No Data 8/25/2004
60355* American Energy, Inc. (Fullerton Hydro)
Conduit Hydro
793,000 0 0 N/A N/A No Data 8/26/2004
60356* Monte Vista Water District
Conduit Hydro
18,000 0 0 N/A N/A No Data 8/27/2004
60358 Calleguas MWD (Springville Hydro)
Conduit Hydro
774,000 0 0 774,000 0% EAO 8/28/2004
60620 Venice Power Plant Conduit Hydro
11,268,000 0 0 11,268,000 0% EIA 11/27/2004
60621 Temescal Power Plant Conduit Hydro
18,330,000 0 0 18,372,000 0% EIA 11/28/2004
60622 Corona Power Plant Conduit Hydro
18,271,000 0 0 18,311,000 0% EIA 11/29/2004

A‐107
60625 Red Mountain Power Plant
Conduit Hydro
15,558,000 0 0 30,998,000 99% EAO 11/30/2004
61020 Mammoth Pool Fish Water Generator
Conduit Hydro
1,076,028 0 0 541,892,010 50260% EAO 12/15/2004
60279*1 Royal Farms Digester Gas 125,000 0 0 N/A N/A No Data 6/29/2004
60294 Orange County Sanitation District
Digester Gas 20,000 0 0 42,312,000 211460% EAO 7/9/2004
60295* Inland Empire Utilities Agency
Digester Gas 1,269,356 0 0 N/A N/A No Data 7/10/2004
60003 Calpine Geothermal Unit 7‐8
Geothermal 2,590,000 586,948,000 0 589,537,000 0% EAO 6/14/2004
60004 Calpine Geothermal Unit 12
Geothermal 419,365,000 6,448,000 0 425,812,000 0% EAO 6/15/2004
60006 Calpine Geothermal Unit 16
Geothermal 403,232,000 4,263,000 0 407,496,000 0% EAO 6/16/2004
60007 Calpine Geothermal Unit 17
Geothermal 326,578,000 43,792,000 32,016 402,386,000 9% EAO 6/17/2004
60008 Calpine Geothermal Unit 18
Geothermal 255,287,000 97,437,000 38,600 394,321,000 12% EAO 6/18/2004
60009 Calpine Geothermal Unit 20
Geothermal 19,866,000 285,226,000 36,883 341,974,000 12% EAO 6/19/2004
60010 Sonoma/Calpine Geyser
Geothermal 789,000 242,153,000 56,488 299,430,000 23% EAO 6/20/2004
60025 Calpine Geothermal Unit 11
Geothermal 131,555,000 375,623,000 17,644 524,822,000 3% EAO 6/22/2004
60026 Calpine Geothermal Unit 14
Geothermal 411,738,000 9,241,000 0 420,978,000 0% EAO 6/23/2004
60305 Heber Geothermal Company
Geothermal 367,883,000 0 0 367,818,000 0% EAO 7/14/2004

A‐108
60306 Mammoth Pacific L. P. (MP1)
Geothermal 44,100,000 0 0 44,100,000 0% EIA 7/15/2004
60307 Del Ranch, Ltd., (Niland #2)
Geothermal 357,241,000 0 0 350,000,000 ‐2% EIA 7/16/2004
60308 Vulcan/BN Geothermal Geothermal 314,132,000 0 0 301,532,000 ‐4% EAO 7/17/2004
60309 Coso Finance Partners (Navy I)
Geothermal 598,744,000 0 0 599,516,000 0% EAO 7/18/2004
60310 Elmore Ltd. Geothermal 348,597,000 0 0 360,000,000 3% EIA 7/19/2004
603112 Ormesa Geothermal I Geothermal 181,138,000 0 0 204,622,020 13% EAO 7/20/2004
603122 Ormesa Geothermal II Geothermal 139,337,000 0 0 142,261,000 2% EIA 7/21/2004
60313 Caithness Dixie Valley, LLC.
Geothermal 424,031,000 0 0 427,552,000 1% EIA 7/22/2004
60315 Mammoth Pacific L. P. I (Ples)
Geothermal 103,731,000 0 0 103,731,000 0% EIA 7/23/2004
60316 Second Imperial Geothermal Co.
Geothermal 258,480,000 0 0 393,195,000 52% EAO 7/24/2004
60317 Salton Sea Power Generation Co #3
Geothermal 400,894,000 0 0 400,000,000 0% EIA 7/25/2004
60318 Leathers L. P. Geothermal 345,197,000 0 0 350,000,000 1% EIA 7/26/2004
60319 Mammoth Pacific L P II (MP2)
Geothermal 93,419,000 0 0 93,679,000 0% EAO 7/27/2004
60320 Salton Sea Power Generation L.P. #2
Geothermal 142,041,000 0 0 136,000,000 ‐4% EIA 7/28/2004
60321 Coso Power Developers
Geothermal 585,633,000 0 0 580,823,000 ‐1% EAO 7/29/2004
60322 Coso Energy Developers
Geothermal 505,958,000 0 0 510,566,000 1% EAO 7/30/2004

A‐109
60323 Salton Sea Power Generation Co #1
Geothermal 81,437,000 0 0 80,000,000 ‐2% EIA 7/31/2004
60324 Salton Sea Power Generation Co #4
Geothermal 370,344,000 0 0 370,344,000 0% Inv 8/1/2004
60640 North Brawley Geothermal 35,815,000 0 0 34,694,000 ‐3% EIA 12/1/2004
614313 Ormesa Geothermal I (Geo East Mesa)
Geothermal 71,071,000 0 0 N/A N/A No Data 4/4/2011
60278 Generating Resource Recovery Partners, LP
Landfill Gas 12,447,000 0 0 12,918,000 4% EIA 6/28/2004
60280 L.A. Co. Sanitation Dist CSD 2610
Landfill Gas 5,602,000 0 0 418,816,000 7376% EIA 6/30/2004
60283 Toyon Landfill Gas Conversion
Landfill Gas 12,496,000 0 0 12,140,000 ‐3% EIA 7/1/2004
60288 L.A. Co. Sanitation Dist Spadra
Landfill Gas 44,460,000 0 0 44,817,000 1% EIA 7/4/2004
60290 L.A. Co. Sanitation Dist Landfill Gas 361,765,000 0 0 418,816,000 16% EIA 7/5/2004
60292 WM Energy Solutions, Inc. (El Sobrante)
Landfill Gas 12,935,000 0 0 13,358,000 3% EAO 7/7/2004
60293 WM Energy Solutions, Inc. (Simi Valley)
Landfill Gas 11,254,000 0 0 11,833,000 5% EAO 7/8/2004
60298 MM Tajiguas Energy LLC
Landfill Gas 23,758,000 0 0 23,355,000 ‐2% EAO 7/11/2004
60301* MM Woodville Energy LLC
Landfill Gas 1,049,000 0 0 N/A N/A No Data 7/12/2004
60304* Ventura Regional Sanitation District
Landfill Gas 19,000 0 0 N/A N/A No Data 7/13/2004
60680 Badlands Landfill Landfill Gas 4,218,000 0 2,177,000 6,311,294 ‐1% RPS 12/3/2004
60770 Toland Landfill Gas to Energy Project
Landfill Gas 2,550,000 0 0 2,554,022 0% Inv 12/12/2004

A‐110
60655 NRG Solar Blythe LLC Photovoltaic 2,613,000 0 0 2,613,888 0% Inv 12/2/2004
60707* SPVP001 Photovoltaic 2,709,000 0 0 N/A N/A No Data 12/5/2004
60757* SPVP002 Photovoltaic 90,000 0 0 N/A N/A No Data 12/11/2004
60216* Henwood Associates Small Hydro 171,000 1,678,000 0 N/A N/A No Data 6/27/2004
60326* Hi Head Hydro Incorporated
Small Hydro 1,909,000 0 0 N/A N/A No Data 8/2/2004
60328* Henwood Associates Small Hydro 637,000 0 0 N/A N/A No Data 8/3/2004
60329* Desert Power Company
Small Hydro 1,249,000 0 0 N/A N/A No Data 8/4/2004
60332* San Bernardino MWD Small Hydro 309,000 0 0 N/A N/A No Data 8/6/2004
60336 Whitewater Small Hydro 1,302,000 0 0 1,373,000 5% EIA 8/9/2004
60337* Snow Creek Small Hydro 534,000 0 0 N/A N/A No Data 8/10/2004
60338 Success Dam Power Project
Small Hydro 1,220,000 0 0 1,221,000 0% EAO 8/11/2004
60339 San Gabriel Hydroelectric Project
Small Hydro 4,423,000 0 0 4,434,010 0% EAO 8/12/2004
60342 Isabella Hydroelectric Project
Small Hydro 12,760,000 0 0 12,764,000 0% EAO 8/15/2004
60346 Kaweah River Power Authority
Small Hydro 34,771,000 0 0 34,772,000 0% EAO 8/19/2004
60352* Deep Springs College Small Hydro 6,000 0 0 N/A N/A No Data 8/24/2004
60444 Bishop Creek No. 2 Small Hydro 27,921,000 0 0 27,915,000 0% EIA 11/1/2004
60446 Bishop Creek No. 3 Small Hydro 29,142,000 0 0 29,142,000 0% EIA 11/2/2004
60447 Bishop Creek No. 4 Small Hydro 40,972,000 0 0 40,972,000 0% EIA 11/3/2004
60448 Bishop Creek No. 5 Small Hydro 12,364,000 0 0 12,364,000 0% EIA 11/4/2004
60449 Bishop Creek No. 6 Small Hydro 9,225,000 0 0 9,217,000 0% EIA 11/5/2004
60450 Borel Small Hydro 55,091,000 0 0 54,713,000 ‐1% EIA 11/6/2004

A‐111
60451 Fontana Small Hydro 5,430,000 0 0 5,430,000 0% EIA 11/7/2004
60452 Kaweah No. 1 Small Hydro 7,137,000 0 0 7,070,000 ‐1% EIA 11/8/2004
60453 Kaweah No. 2 Small Hydro 11,415,000 0 0 11,394,000 0% EIA 11/9/2004
60454 Kaweah No. 3 Small Hydro 23,306,000 0 0 23,295,000 0% EIA 11/10/2004
60455 Kern River No. 1 Small Hydro 54,412,000 0 0 54,411,977 0% Inv 11/11/2004
60456 Lundy Small Hydro 3,660,000 0 0 3,642,000 0% EIA 11/12/2004
60457 Lytle Creek Small Hydro 2,469,000 0 0 2,387,000 ‐3% EAO 11/13/2004
60459 Mill Creek No. 3 Small Hydro 7,470,000 0 0 7,461,000 0% EIA 11/14/2004
60460 Ontario No. 1 Small Hydro 3,175,000 0 0 3,174,000 0% EAO 11/15/2004
60461 Ontario No. 2 Small Hydro 1,383,000 0 0 1,383,000 0% EAO 11/16/2004
60462 Poole Plant Small Hydro 29,084,000 0 0 29,078,000 0% EIA 11/17/2004
60463 Portal Power Plant Small Hydro 25,535,000 0 0 25,425,030 0% EAO 11/18/2004
60464 Rush Creek Small Hydro 56,088,000 0 0 56,088,000 0% EIA 11/19/2004
60465 Santa Ana No. 1 Small Hydro 3,774,000 0 0 3,747,000 ‐1% EIA 11/20/2004
60466 Santa Ana No. 3 Small Hydro 3,433,000 0 0 3,433,994 0% Inv 11/21/2004
60467 Sierra Small Hydro 2,604,000 0 0 2,603,000 0% EAO 11/22/2004
60468 Tule River Small Hydro 10,292,000 0 0 28,042,000 172% EIA 11/23/2004
60359 Sunray Energy, Inc. Solar Thermal
42,394,000 0 0 42,405,000 0% EAO 8/29/2004
60360 Luz Solar Partners Ltd. III
Solar Thermal
83,768,000 0 0 83,767,716 0% ERFP 8/30/2004
60361 Luz Solar Partners Ltd. IV
Solar Thermal
82,744,000 0 0 83,413,000 1% EIA 8/31/2004
60362 Luz Solar Partners Ltd. V
Solar Thermal
77,574,000 0 0 77,574,960 0% ERFP 9/1/2004
60363 Luz Solar Partners Ltd. VI
Solar Thermal
86,948,000 0 0 86,948,856 0% ERFP 9/2/2004

A‐112
60364 Luz Solar Partners Ltd. VII
Solar Thermal
82,707,000 0 0 82,706,868 0% ERFP 9/3/2004
60365 Luz Solar Partners Ltd. VIII
Solar Thermal
186,881,000 0 0 187,034,000 0% EIA 9/4/2004
60366 Luz Solar Partners Ltd. IX
Solar Thermal
196,759,000 0 0 197,056,000 0% EIA 9/5/2004
60754 Sierra Suntower LLC Solar Thermal
24,000 0 0 24,054 0% Inv 12/10/2004
60027 Boom‐Campbell Wind Farm
Wind 30,134,000 0 0 30,132,528 0% RPS 6/24/2004
60028 Sirocco Wind 11,326,000 0 0 11,327,000 0% EIA 6/25/2004
60029 Cellc 7.5 MW Tehachapi Wind Project
Wind 28,697,000 0 0 28,697,000 0% EIA 6/26/2004
60284 & 60285
Mountain View I & II Wind 195,942,000 0 0 195,944,386 0% Inv 4/5/2005
60291* Calwind Resources Inc. II
Wind 51,135,000 0 0 N/A N/A No Data 7/6/2004
60368 FPL Energy Cabazon Wind, LLC
Wind 85,040,000 0 0 85,019,000 0% EIA 9/6/2004
60369* Mogul Energy Partnership I
Wind 9,234,000 0 0 N/A N/A No Data 9/7/2004
60370* Mesa Wind Farm Wind 57,228,000 0 0 N/A N/A No Data 9/8/2004
60371* San Gorgonio Farms Wind Farm
Wind 7,483,000 0 0 N/A N/A No Data 9/9/2004
60372 Boxcar I Power Purchase Contract Trust
Wind 11,798,000 0 0 31,583,000 168% EIA 9/10/2004
60373* Windsong Wind Park Wind 3,160,000 0 0 N/A N/A No Data 9/11/2004

A‐113
60374* Zephyr Park, Ltd Wind 9,091,000 0 0 N/A N/A No Data 9/12/2004
60375* Ridgetop Energy, LLC (I)
Wind 147,244,000 0 0 N/A N/A No Data 9/13/2004
60377* San Gorgonio 1 ‐ Aldrich
Wind 23,091,000 0 0 N/A N/A No Data 9/14/2004
60378* EUI Management PH Inc.
Wind 48,947,000 0 0 N/A N/A No Data 9/15/2004
60379* San Gorgonio 2 ‐ Buckwind
Wind 9,680,000 0 0 N/A N/A No Data 9/16/2004
60380* Tehachapi Power Purchase Contract Trust
Wind 115,500,000 0 0 N/A N/A No Data 9/17/2004
60381* Enron Wind Systems, LLC (VG # I)
Wind 12,405,000 0 0 N/A N/A No Data 9/18/2004
60382* Enron Wind Systems, LLC (VG #2)
Wind 11,206,000 0 0 N/A N/A No Data 9/19/2004
60383* Enron Wind Systems, LLC (VG #3)
Wind 9,547,000 0 0 N/A N/A No Data 9/20/2004
60384* Enron Wind Systems, LLC (VG #4)
Wind 9,155,000 0 0 N/A N/A No Data 9/21/2004
60385* Zond Wind Systems Partners, Series 85‐A
Wind 20,087,000 0 0 N/A N/A No Data 9/22/2004
60386* Zond Wind Systems Partners, Series 85‐B
Wind 27,565,000 0 0 N/A N/A No Data 9/23/2004
60387 Section 20 Trust Wind 40,336,000 0 0 40,335,600 0% Inv 9/24/2004
60388* NAWP Inc. [East Winds Proj]
Wind 8,036,000 0 0 N/A N/A No Data 9/25/2004
60389* Difwind Farms Limited V
Wind 14,191,000 0 0 N/A N/A No Data 9/26/2004

A‐114
60391 Edom Hills Project 1, LLC
Wind 31,579,000 0 0 31,641,000 0% EIA 9/27/2004
60392* Cameron Ridge LLC (III)
Wind 137,624,000 0 0 N/A N/A No Data 9/28/2004
60393 San Gorgonio Westwinds II, LLC
Wind 29,118,000 0 0 128,525,440 341% EIA 9/29/2004
60394* Calwind Resources Inc. Wind 15,125,000 0 0 N/A N/A No Data 9/30/2004
60395* Windridge Incorporated
Wind 1,631,000 0 0 N/A N/A No Data 10/1/2004
60396* Energy Development & Const. Corp.
Wind 33,388,000 0 0 N/A N/A No Data 10/2/2004
60397* Desert Winds I Ppc Trust
Wind 77,926,000 0 0 N/A N/A No Data 10/3/2004
603984 Section 7 Trust Wind 55,890,000 0 0 55,874,619 0% EIA 10/4/2004
60399* Sky River Partnership (Wilderness I)
Wind 78,074,000 0 0 N/A N/A No Data 10/5/2004
60400* Sky River Partnership (Wilderness II)
Wind 42,451,000 0 0 N/A N/A No Data 10/6/2004
60401* Sky River Partnership (Wilderness III)
Wind 43,903,000 0 0 N/A N/A No Data 10/7/2004
60402 Section 16‐29 Trust (Altech III)
Wind 79,379,000 0 0 79,405,656 0% Inv 10/8/2004
60403* Difwind Partners Wind 28,639,000 0 0 N/A N/A No Data 10/9/2004
60405 Alta Mesa Pwr. Purch. Contract Trust
Wind 67,366,000 0 0 69,087,000 3% EIA 10/10/2004
60406* Cameron Ridge LLC (IV)
Wind 36,374,000 0 0 N/A N/A No Data 10/11/2004
60407 Ridgetop Energy, LLC (II)
Wind 77,895,000 0 0 83,555,522 7% Inv 10/12/2004

A‐115
60408* Section 22 Trust [San Jacinto]
Wind 42,999,000 0 0 N/A N/A No Data 10/13/2004
60409* Dutch Energy Wind 20,939,000 0 0 N/A N/A No Data 10/14/2004
60410* Westwind Trust Wind 25,353,000 0 0 N/A N/A No Data 10/15/2004
60411 Boxcar II Power Purchase Contract Trst
Wind 19,794,000 0 0 31,583,000 60% EIA 10/16/2004
60412* San Gorgonio 3 ‐ Carter Wind 3,349,000 0 0 N/A N/A No Data 10/17/2004
60413* Victory Garden Phase IV Partner ‐ 6102
Wind 16,246,000 0 0 N/A N/A No Data 10/18/2004
60414* Victory Garden Phase IV Partner ‐ 6103
Wind 12,877,000 0 0 N/A N/A No Data 10/19/2004
60415* Victory Garden Phase IV Partner ‐ 6104
Wind 15,549,000 0 0 N/A N/A No Data 10/20/2004
60416* Caithness 251 Wind, LLC (Monolith X)
Wind 9,968,000 0 0 N/A N/A No Data 10/21/2004
60417* Caithness 251 Wind, LLC (Monolith XI)
Wind 8,784,000 0 0 N/A N/A No Data 10/22/2004
60418* Caithness 251 Wind, LLC (Monolith XII)
Wind 10,401,000 0 0 N/A N/A No Data 10/23/2004
60419* Caithness 251 Wind, LLC (Monolith XIII)
Wind 7,657,000 0 0 N/A N/A No Data 10/24/2004
60420* Enron Wind Systems, LLC (Northwind)
Wind 8,995,000 0 0 N/A N/A No Data 10/25/2004
60421* Painted Hills Wind Developers
Wind 36,333,000 0 0 N/A N/A No Data 10/26/2004
60422 Desert Winds II Pwr Purch Trst
Wind 199,358,000 0 0 196,567,000 ‐1% EIA 10/27/2004
60423 Desert Wind III PPC Trust
Wind 77,885,000 0 0 157,218,000 102% EIA 10/28/2004
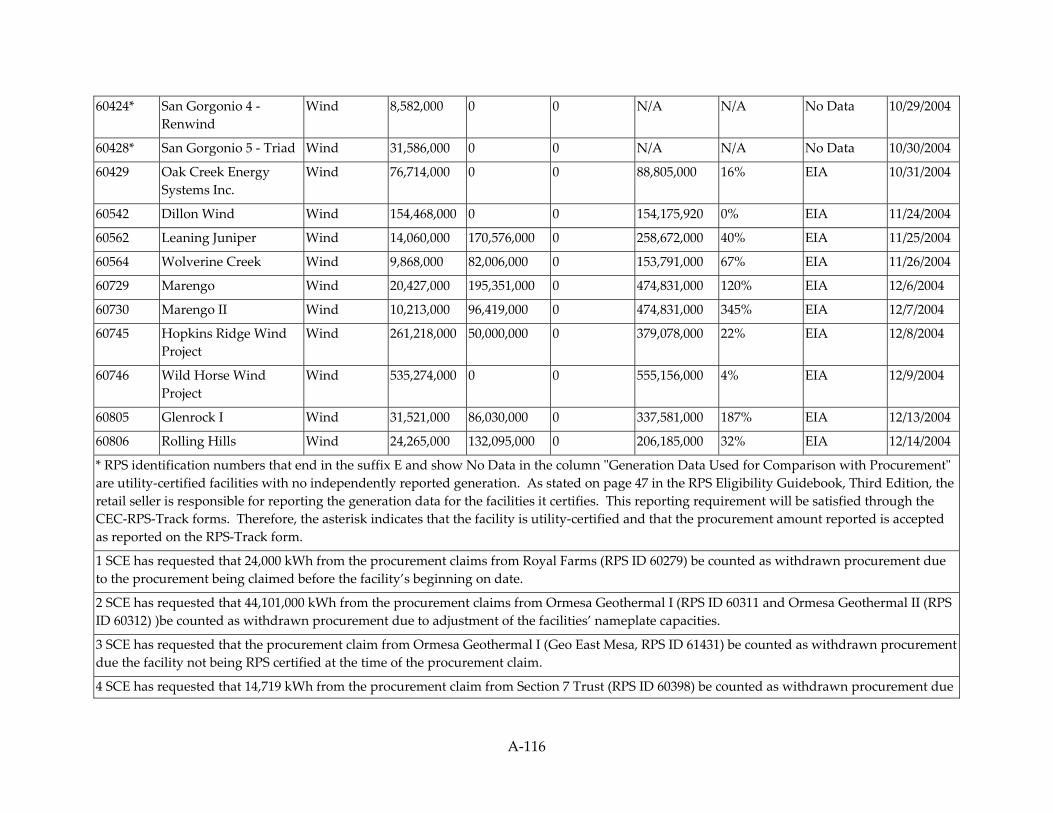
A‐116
60424* San Gorgonio 4 ‐ Renwind
Wind 8,582,000 0 0 N/A N/A No Data 10/29/2004
60428* San Gorgonio 5 ‐ Triad Wind 31,586,000 0 0 N/A N/A No Data 10/30/2004
60429 Oak Creek Energy Systems Inc.
Wind 76,714,000 0 0 88,805,000 16% EIA 10/31/2004
60542 Dillon Wind Wind 154,468,000 0 0 154,175,920 0% EIA 11/24/2004
60562 Leaning Juniper Wind 14,060,000 170,576,000 0 258,672,000 40% EIA 11/25/2004
60564 Wolverine Creek Wind 9,868,000 82,006,000 0 153,791,000 67% EIA 11/26/2004
60729 Marengo Wind 20,427,000 195,351,000 0 474,831,000 120% EIA 12/6/2004
60730 Marengo II Wind 10,213,000 96,419,000 0 474,831,000 345% EIA 12/7/2004
60745 Hopkins Ridge Wind Project
Wind 261,218,000 50,000,000 0 379,078,000 22% EIA 12/8/2004
60746 Wild Horse Wind Project
Wind 535,274,000 0 0 555,156,000 4% EIA 12/9/2004
60805 Glenrock I Wind 31,521,000 86,030,000 0 337,581,000 187% EIA 12/13/2004
60806 Rolling Hills Wind 24,265,000 132,095,000 0 206,185,000 32% EIA 12/14/2004
* RPS identification numbers that end in the suffix E and show No Data in the column ʺGeneration Data Used for Comparison with Procurementʺ are utility‐certified facilities with no independently reported generation. As stated on page 47 in the RPS Eligibility Guidebook, Third Edition, the retail seller is responsible for reporting the generation data for the facilities it certifies. This reporting requirement will be satisfied through the CEC‐RPS‐Track forms. Therefore, the asterisk indicates that the facility is utility‐certified and that the procurement amount reported is accepted as reported on the RPS‐Track form.
1 SCE has requested that 24,000 kWh from the procurement claims from Royal Farms (RPS ID 60279) be counted as withdrawn procurement due to the procurement being claimed before the facility’s beginning on date.
2 SCE has requested that 44,101,000 kWh from the procurement claims from Ormesa Geothermal I (RPS ID 60311 and Ormesa Geothermal II (RPS ID 60312) )be counted as withdrawn procurement due to adjustment of the facilities’ nameplate capacities.
3 SCE has requested that the procurement claim from Ormesa Geothermal I (Geo East Mesa, RPS ID 61431) be counted as withdrawn procurement due the facility not being RPS certified at the time of the procurement claim.
4 SCE has requested that 14,719 kWh from the procurement claim from Section 7 Trust (RPS ID 60398) be counted as withdrawn procurement due
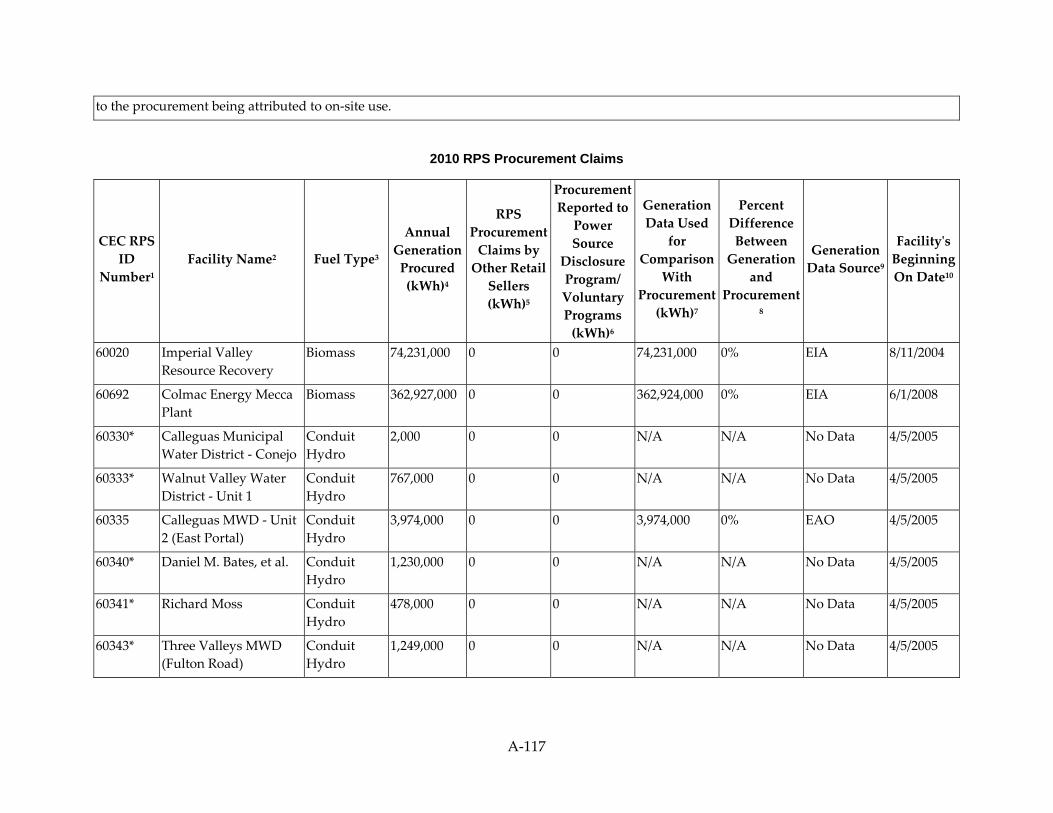
A‐117
to the procurement being attributed to on‐site use.
2010 RPS Procurement Claims
CEC RPS ID
Number1 Facility Name2 Fuel Type3
Annual Generation Procured (kWh)4
RPS Procurement Claims by Other Retail Sellers (kWh)5
Procurement Reported to Power Source
Disclosure Program/ Voluntary Programs (kWh)6
Generation Data Used
for Comparison
With Procurement (kWh)7
Percent Difference Between Generation
and Procurement
8
Generation Data Source9
Facilityʹs Beginning On Date10
60020 Imperial Valley Resource Recovery
Biomass 74,231,000 0 0 74,231,000 0% EIA 8/11/2004
60692 Colmac Energy Mecca Plant
Biomass 362,927,000 0 0 362,924,000 0% EIA 6/1/2008
60330* Calleguas Municipal Water District ‐ Conejo
Conduit Hydro
2,000 0 0 N/A N/A No Data 4/5/2005
60333* Walnut Valley Water District ‐ Unit 1
Conduit Hydro
767,000 0 0 N/A N/A No Data 4/5/2005
60335 Calleguas MWD ‐ Unit 2 (East Portal)
Conduit Hydro
3,974,000 0 0 3,974,000 0% EAO 4/5/2005
60340* Daniel M. Bates, et al. Conduit Hydro
1,230,000 0 0 N/A N/A No Data 4/5/2005
60341* Richard Moss Conduit Hydro
478,000 0 0 N/A N/A No Data 4/5/2005
60343* Three Valleys MWD (Fulton Road)
Conduit Hydro
1,249,000 0 0 N/A N/A No Data 4/5/2005

A‐118
60344* Three Valleys MWD (Miramar)
Conduit Hydro
791,000 0 0 N/A N/A No Data 4/5/2005
60345* Three Valleys MWD (Williams)
Conduit Hydro
1,844,000 0 0 N/A N/A No Data 4/5/2005
60347* Picay Hydroelectric Project
Conduit Hydro
635,000 0 0 N/A N/A No Data 4/5/2005
60348* Calleguas MWD ‐ Unit 3 (Santa Rosa)
Conduit Hydro
436,000 0 0 N/A N/A No Data 4/5/2005
60349* City Of Santa Ana Conduit Hydro
20,000 0 0 N/A N/A No Data 4/5/2005
60354* San Bernardino MWD (Unit 3)
Conduit Hydro
247,000 0 0 N/A N/A No Data 4/5/2005
60355* American Energy, Inc. (Fullerton Hydro)
Conduit Hydro
694,000 0 0 N/A N/A No Data 4/5/2005
60356* Monte Vista Water District
Conduit Hydro
487,000 0 0 N/A N/A No Data 4/5/2005
60357* Ontario Hydroelectric Station (Station No. 1)
Conduit Hydro
141,000 0 0 N/A N/A No Data 4/5/2005
60358 Calleguas MWD (Springville Hydro)
Conduit Hydro
1,522,000 0 0 1,552,000 2% EAO 4/5/2005
60620 Venice Power Plant Conduit Hydro
8,671,000 0 0 8,663,080 0% EAO 3/30/2005
60621 Temescal Power Plant Conduit Hydro
19,518,000 0 0 19,519,000 0% EAO 3/30/2005
60622 Corona Power Plant Conduit Hydro
18,848,000 0 0 18,849,000 0% EAO 3/30/2005
60625 Red Mountain Power Plant
Conduit Hydro
31,707,000 0 0 62,788,000 98% EAO 3/30/2005

A‐119
61020 Mammoth Pool Fish Water Generator
Conduit Hydro
1,719,000 0 0 708,586,000 41121% EAO 3/9/2010
60279*1 Royal Farms Digester Gas 95,000 0 0 N/A N/A No Data 4/5/2005
60294 Orange County Sanitation District
Digester Gas 10,000 0 0 40,765,100 407551% EAO 4/5/2005
60295* Inland Empire Utilities Agency
Digester Gas 1,268,000 0 0 N/A N/A No Data 4/5/2005
61021* Royal Farms #2 Digester Gas 119,000 0 0 N/A N/A No Data 3/9/2010
60004 Calpine Geothermal Unit 12
Geothermal 402,491,000 12,534,000 0 415,025,000 0% EAO 6/14/2004
60005 Calpine Geothermal Unit 13
Geothermal 8,098,000 479,013,000 0 487,108,000 0% EAO 6/14/2004
60006 Calpine Geothermal Unit 16
Geothermal 396,136,000 90,000 0 396,226,000 0% EAO 6/14/2004
60007 Calpine Geothermal Unit 17
Geothermal 418,833,000 0 89,249 418,833,000 0% EAO 6/14/2004
60008 Calpine Geothermal Unit 18
Geothermal 258,672,000 123,101,000 0 381,773,000 0% EAO 6/14/2004
60009 Calpine Geothermal Unit 20
Geothermal 4,672,000 324,994,000 0 329,676,000 0% EAO 6/14/2004
60010 Sonoma/Calpine Geyser
Geothermal 60,918,000 248,132,000 0 309,051,000 0% EAO 6/14/2004
60025 Calpine Geothermal Unit 11
Geothermal 1,033,000 475,689,000 0 476,738,000 0% EAO 6/14/2004
60026 Calpine Geothermal Unit 14
Geothermal 418,462,000 1,054,000 0 419,517,000 0% EAO 6/14/2004
60305 Heber Geothermal Company
Geothermal 336,313,000 0 0 335,962,120 0% EAO 4/5/2005

A‐120
60306 Mammoth Pacific L. P. (MP1)
Geothermal 49,143,000 0 0 48,609,250 ‐1% EAO 4/5/2005
60307 Del Ranch, Ltd., (Niland #2)
Geothermal 355,423,000 0 0 341,489,000 ‐4% EAO 4/5/2005
60308 Vulcan/BN Geothermal Geothermal 309,252,000 0 0 296,903,000 ‐4% EAO 4/5/2005
60309 Coso Finance Partners (Navy I)
Geothermal 545,535,000 0 0 545,065,000 0% EIA 4/5/2005
60310 Elmore Ltd. Geothermal 339,683,000 0 0 328,504,000 ‐3% EAO 4/5/2005
603112 Ormesa Geothermal I Geothermal 181,100,000 0 0 178,127,120 ‐2% EAO 4/5/2005
603122 Ormesa Geothermal II Geothermal 139,307,000 0 0 129,049,000 ‐7% EAO 4/5/2005
60313 Caithness Dixie Valley, LLC.
Geothermal 428,002,000 0 0 437,372,000 2% EIA 4/5/2005
60315 Mammoth Pacific L. P. I (Ples)
Geothermal 100,821,000 0 0 101,427,000 1% EAO 4/5/2005
60316 Second Imperial Geothermal Co.
Geothermal 250,526,000 0 0 393,592,000 57% EAO 4/5/2005
60317 Salton Sea Power Generation L.P. #3
Geothermal 393,320,000 0 0 380,141,000 ‐3% EAO 4/5/2005
60318 Leathers L. P. Geothermal 352,126,000 0 0 339,343,000 ‐4% EAO 4/5/2005
60319 Mammoth Pacific L P II (MP2)
Geothermal 81,622,000 0 0 82,503,000 1% EAO 4/5/2005
60320 Salton Sea Power Generation L.P. #2
Geothermal 127,746,000 0 0 121,824,000 ‐5% EAO 4/5/2005
60321 Coso Power Developers
Geothermal 586,485,000 0 0 586,471,000 0% EAO 4/5/2005
60322 Coso Energy Developers
Geothermal 468,879,000 0 0 469,283,000 0% EIA 4/5/2005

A‐121
60323 Salton Sea Power Generation L.P. #1
Geothermal 78,976,000 0 0 77,130,000 ‐2% EAO 4/5/2005
60324 Salton Sea IV Geothermal 355,050,000 0 0 355,050,000 0% Inv 4/5/2005
60640 North Brawley Geothermal 183,285,000 0 0 177,569,000 ‐3% EIA 10/16/2007
614313 Ormesa Geothermal I (Geo East Mesa)
Geothermal 116,090,000 0 0 N/A N/A No Data 4/4/2011
60280 L.A. Co. Sanitation Dist CSD 2610
Landfill Gas 6,286,000 0 0 446,098,000 6997% EIA 4/5/2005
60283 Toyon Landfill Gas Conversion
Landfill Gas 5,841,000 0 0 10,150,000 74% EAO 4/5/2005
60288 L.A. Co. Sanitation Dist Spadra
Landfill Gas 41,064,000 0 0 41,057,000 0% EAO 4/5/2005
60290 L.A. Co. Sanitation Dist Landfill Gas 388,576,000 0 0 446,098,000 15% EIA 4/5/2005
60292 WM Energy Solutions, Inc. (El Sobrante)
Landfill Gas 20,912,000 0 0 20,884,980 0% EAO 4/5/2005
60293 WM Energy Solutions, Inc. (Simi Valley)
Landfill Gas 13,292,000 0 0 13,297,000 0% EAO 4/5/2005
60298 MM Tajiguas Energy LLC
Landfill Gas 24,431,000 0 0 23,991,000 ‐2% EAO 4/5/2005
60680 Badlands Landfill Landfill Gas 6,229,000 0 0 6,274,666 1% RPS 2/19/2008
60770 Toland Landfill Gas to Energy Project
Landfill Gas 7,368,000 0 0 N/A N/A No Data 2/11/2009
60655 NRG Solar Blythe LLC Photovoltaic 49,629,000 0 0 51,487,883 4% RPS 3/10/2008
60707* SPVP001 Photovoltaic 2,838,000 0 0 N/A N/A No Data 5/28/2008
60757* SPVP002 Photovoltaic 1,454,000 0 0 N/A N/A No Data 2/12/2009
60879* SPVP003 Photovoltaic 127,000 0 0 N/A N/A No Data 9/9/2009
61036* SPVP008 Photovoltaic 8,998 0 0 N/A N/A No Data 3/1/2010
61038* SPVP012 Photovoltaic 23 0 0 N/A N/A No Data 3/1/2010

A‐122
61039* SPVP022 Photovoltaic 389,632 0 0 N/A N/A No Data 3/2/2010
61235* SPVP005 Photovoltaic 1,714 0 0 N/A N/A No Data 9/27/2010
61236* SPVP007 Photovoltaic 5,942 0 0 N/A N/A No Data 9/27/2010
61241* SPVP042 Photovoltaic 20,712 0 0 N/A N/A No Data 9/27/2010
60326* Hi Head Hydro Incorporated
Small Hydro 1,709,000 0 0 N/A N/A No Data 4/5/2005
60329* Desert Power Company
Small Hydro 1,616,000 0 0 N/A N/A No Data 4/5/2005
60332* San Bernardino MWD Small Hydro 365,000 0 0 N/A N/A No Data 4/5/2005
60336 Whitewater Small Hydro 4,154,000 0 0 4,153,536 0% EAO 4/5/2005
60337* Snow Creek Small Hydro 360,000 0 0 N/A N/A No Data 4/5/2005
60338 Success Dam Power Project
Small Hydro 2,501,000 0 0 2,473,000 ‐1% EAO 4/5/2005
60339 San Gabriel Hydroelectric Project
Small Hydro 22,782,000 0 0 22,782,000 0% EAO 4/5/2005
60342 Isabella Hydroelectric Project
Small Hydro 40,478,000 0 0 40,474,060 0% EAO 4/5/2005
60346 Kaweah River Power Authority
Small Hydro 52,794,000 0 0 52,795,030 0% EAO 4/5/2005
60444 Bishop Creek No. 2 Small Hydro 35,104,000 0 0 35,105,000 0% EAO 5/11/2005
60446 Bishop Creek No. 3 Small Hydro 33,060,000 0 0 33,057,000 0% EAO 5/11/2005
60447 Bishop Creek No. 4 Small Hydro 50,196,000 0 0 50,197,000 0% EAO 5/11/2005
60448 Bishop Creek No. 5 Small Hydro 15,498,000 0 0 15,496,000 0% EAO 5/11/2005
60449 Bishop Creek No. 6 Small Hydro 3,705,000 0 0 3,666,000 ‐1% EAO 5/11/2005
60450 Borel Small Hydro 44,074,000 0 0 44,043,020 0% EAO 5/11/2005
60451 Fontana Small Hydro 7,794,000 0 0 7,793,000 0% EAO 5/11/2005
60452 Kaweah No. 1 Small Hydro 7,955,000 0 0 7,903,000 ‐1% EAO 5/11/2005

A‐123
60453 Kaweah No. 2 Small Hydro 12,574,000 0 0 12,555,000 0% EAO 5/11/2005
60454 Kaweah No. 3 Small Hydro 27,863,000 0 0 27,855,000 0% EAO 5/11/2005
60455 Kern River No. 1 Small Hydro 96,842,000 0 0 76,953,898 ‐21% Inv 5/11/2005
60456 Lundy Small Hydro 9,192,000 0 0 9,190,000 0% EAO 5/11/2005
60457 Lytle Creek Small Hydro 3,208,000 0 0 3,206,000 0% EAO 5/11/2005
60458 Mill Creek No. 1 Small Hydro 974,000 0 0 973,000 0% EAO 5/11/2005
60459 Mill Creek No. 3 Small Hydro 10,971,000 0 0 10,960,000 0% EAO 5/11/2005
60460 Ontario No. 1 Small Hydro 3,407,000 0 0 3,402,000 0% EAO 5/11/2005
60461 Ontario No. 2 Small Hydro 1,855,000 0 0 1,854,000 0% EAO 5/11/2005
60462 Poole Plant Small Hydro 32,340,000 0 0 32,334,000 0% EAO 5/11/2005
60463 Portal Power Plant Small Hydro 23,833,000 0 0 23,730,010 0% EAO 5/11/2005
60464 Rush Creek Small Hydro 54,074,000 0 0 54,054,000 0% EAO 5/11/2005
60465 Santa Ana No. 1 Small Hydro 6,885,000 0 0 6,861,000 0% EAO 5/11/2005
60466 Santa Ana No. 3 Small Hydro 9,688,000 0 0 9,692,697 0% Inv 5/11/2005
60467 Sierra Small Hydro 3,814,000 0 0 3,813,000 0% EAO 5/11/2005
60359 Sunray Energy, Inc. Solar Thermal
48,160,000 0 0 48,159,756 0% ERFP 4/5/2005
60360 Luz Solar Partners Ltd. III
Solar Thermal
72,915,000 0 0 72,948,000 0% EIA 4/5/2005
60361 Luz Solar Partners Ltd. IV
Solar Thermal
75,837,000 0 0 75,894,000 0% EIA 4/5/2005
60362 Luz Solar Partners Ltd. V
Solar Thermal
67,045,000 0 0 67,029,010 0% EAO 4/5/2005
60363 Luz Solar Partners Ltd. VI
Solar Thermal
83,583,000 0 0 83,583,252 0% ERFP 4/5/2005
60364 Luz Solar Partners Ltd. VII
Solar Thermal
78,516,000 0 0 78,516,864 0% ERFP 4/5/2005

A‐124
60365 Luz Solar Partners Ltd. VIII
Solar Thermal
219,847,000 0 0 219,846,600 0% ERFP 4/5/2005
60366 Luz Solar Partners Ltd. IX
Solar Thermal
232,567,000 0 0 232,566,696 0% ERFP 4/5/2005
60754 Sierra Suntower LLC Solar Thermal
610,000 0 0 600,000 ‐2% EAO 1/21/2009
60027 Boom‐Campbell Wind Farm
Wind 32,346,000 0 0 32,346,432 0% RPS 10/10/2004
60028 Sirocco Wind 11,012,000 0 0 11,011,298 0% RPS 10/10/2004
60029 Cellc 7.5 MW Tehachapi Wind Project
Wind 29,495,000 0 0 29,495,690 0% RPS 10/10/2004
60284 & 60285
Mountain View I & II Wind 228,332,000 0 0 224,936,001 ‐1% EIA 4/5/2005
60291* Calwind Resources Inc. II
Wind 52,232,000 0 0 N/A N/A No Data 4/5/2005
60368 FPL Energy Cabazon Wind, LLC
Wind 87,926,000 0 0 87,921,000 0% EIA 4/5/2005
60369* Mogul Energy Partnership I
Wind 9,132,000 0 0 N/A N/A No Data 4/5/2005
60370* Mesa Wind Developers Wind 53,394,000 0 0 N/A N/A No Data 4/5/2005
60371* San Gorgonio Farms Wind Farm
Wind 7,172,000 0 0 N/A N/A No Data 4/5/2005
60372* Boxcar I Power Purchase Contract Trust
Wind 10,291,000 0 0 N/A N/A No Data 4/5/2005
60373* Windsong Wind Park Wind 490,000 0 0 N/A N/A No Data 4/5/2005
60374* Zephyr Park, Ltd Wind 8,987,000 0 0 N/A N/A No Data 4/5/2005
60375* Ridgetop Energy, LLC Wind 145,971,000 0 0 N/A N/A No Data 4/5/2005
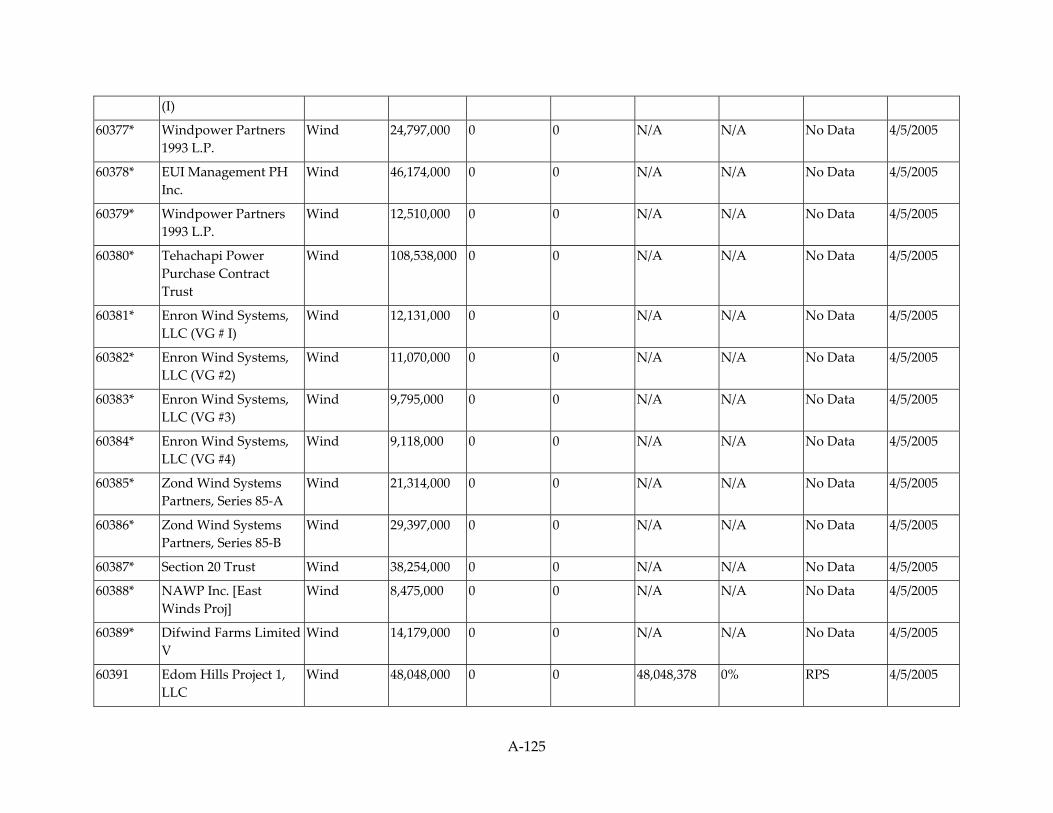
A‐125
(I)
60377* Windpower Partners 1993 L.P.
Wind 24,797,000 0 0 N/A N/A No Data 4/5/2005
60378* EUI Management PH Inc.
Wind 46,174,000 0 0 N/A N/A No Data 4/5/2005
60379* Windpower Partners 1993 L.P.
Wind 12,510,000 0 0 N/A N/A No Data 4/5/2005
60380* Tehachapi Power Purchase Contract Trust
Wind 108,538,000 0 0 N/A N/A No Data 4/5/2005
60381* Enron Wind Systems, LLC (VG # I)
Wind 12,131,000 0 0 N/A N/A No Data 4/5/2005
60382* Enron Wind Systems, LLC (VG #2)
Wind 11,070,000 0 0 N/A N/A No Data 4/5/2005
60383* Enron Wind Systems, LLC (VG #3)
Wind 9,795,000 0 0 N/A N/A No Data 4/5/2005
60384* Enron Wind Systems, LLC (VG #4)
Wind 9,118,000 0 0 N/A N/A No Data 4/5/2005
60385* Zond Wind Systems Partners, Series 85‐A
Wind 21,314,000 0 0 N/A N/A No Data 4/5/2005
60386* Zond Wind Systems Partners, Series 85‐B
Wind 29,397,000 0 0 N/A N/A No Data 4/5/2005
60387* Section 20 Trust Wind 38,254,000 0 0 N/A N/A No Data 4/5/2005
60388* NAWP Inc. [East Winds Proj]
Wind 8,475,000 0 0 N/A N/A No Data 4/5/2005
60389* Difwind Farms Limited V
Wind 14,179,000 0 0 N/A N/A No Data 4/5/2005
60391 Edom Hills Project 1, LLC
Wind 48,048,000 0 0 48,048,378 0% RPS 4/5/2005

A‐126
60392* Cameron Ridge LLC (III)
Wind 135,609,000 0 0 N/A N/A No Data 4/5/2005
60393 San Gorgonio Westwinds II, LLC
Wind 28,459,000 0 0 124,527,000 338% EIA 4/5/2005
60394* Calwind Resources Inc. Wind 15,915,000 0 0 N/A N/A No Data 4/5/2005
60395* Windridge Incorporated
Wind 1,582,000 0 0 N/A N/A No Data 4/5/2005
60396* Energy Development & Const. Corp.
Wind 33,755,000 0 0 N/A N/A No Data 4/5/2005
60397* Desert Winds I Ppc Trust
Wind 79,047,000 0 0 N/A N/A No Data 4/5/2005
60398*4 Section 7 Trust Wind 61,716,000 0 0 N/A N/A No Data 4/5/2005
60399* Sky River Partnership (Wilderness I)
Wind 83,417,000 0 0 N/A N/A No Data 4/5/2005
60400* Sky River Partnership (Wilderness II)
Wind 44,388,000 0 0 N/A N/A No Data 4/5/2005
60401* Sky River Partnership (Wilderness III)
Wind 45,107,000 0 0 N/A N/A No Data 4/5/2005
60402* Section 16‐29 Trust (Altech III)
Wind 76,004,000 0 0 N/A N/A No Data 4/5/2005
60403* Difwind Partners Wind 25,350,000 0 0 N/A N/A No Data 4/5/2005
60405* Alta Mesa Pwr. Purch. Contract Trust
Wind 60,981,000 0 0 N/A N/A No Data 4/5/2005
60406* Cameron Ridge LLC (IV)
Wind 36,040,000 0 0 N/A N/A No Data 4/5/2005
60407 Ridgetop Energy, LLC (II)
Wind 80,773,000 0 0 83,944,822 4% Inv 4/5/2005
60408* Section 22 Trust [San Jacinto]
Wind 41,939,000 0 0 N/A N/A No Data 4/5/2005

A‐127
60409* Dutch Energy Wind 21,001,000 0 0 N/A N/A No Data 4/5/2005
60410* Westwind Trust Wind 25,416,000 0 0 N/A N/A No Data 4/5/2005
60411* Boxcar II Power Purchase Contract Trst
Wind 19,844,000 0 0 N/A N/A No Data 4/5/2005
60412 BNY Western Trust Company
Wind 3,669,000 0 0 N/A N/A No Data 4/5/2005
60413 Victory Garden Phase IV Partner ‐ 6102
Wind 16,140,000 0 0 N/A N/A No Data 4/5/2005
60414 Victory Garden Phase IV Partner ‐ 6103
Wind 12,961,000 0 0 N/A N/A No Data 4/5/2005
60415 Victory Garden Phase IV Partner ‐ 6104
Wind 15,827,000 0 0 N/A N/A No Data 4/5/2005
60416 Caithness 251 Wind, LLC (Monolith X)
Wind 10,537,000 0 0 N/A N/A No Data 4/5/2005
60417 Caithness 251 Wind, LLC (Monolith XI)
Wind 7,814,000 0 0 N/A N/A No Data 4/5/2005
60418 Caithness 251 Wind, LLC (Monolith XII)
Wind 9,874,000 0 0 N/A N/A No Data 4/5/2005
60419 Caithness 251 Wind, LLC (Monolith XIII)
Wind 7,515,000 0 0 N/A N/A No Data 4/5/2005
60420 Enron Wind Systems, LLC (Northwind)
Wind 8,861,000 0 0 N/A N/A No Data 4/5/2005
60421 Painted Hills Wind Developers
Wind 34,731,000 0 0 N/A N/A No Data 4/5/2005
60422 Desert Winds II Pwr Purch Trst
Wind 201,692,000 0 0 N/A N/A No Data 4/5/2005
60423 Desert Wind III PPC Trust
Wind 78,820,000 0 0 115,498,000 47% EIA 4/5/2005
60424* Windpower Partners Wind 11,440,000 0 0 N/A N/A No Data 4/5/2005
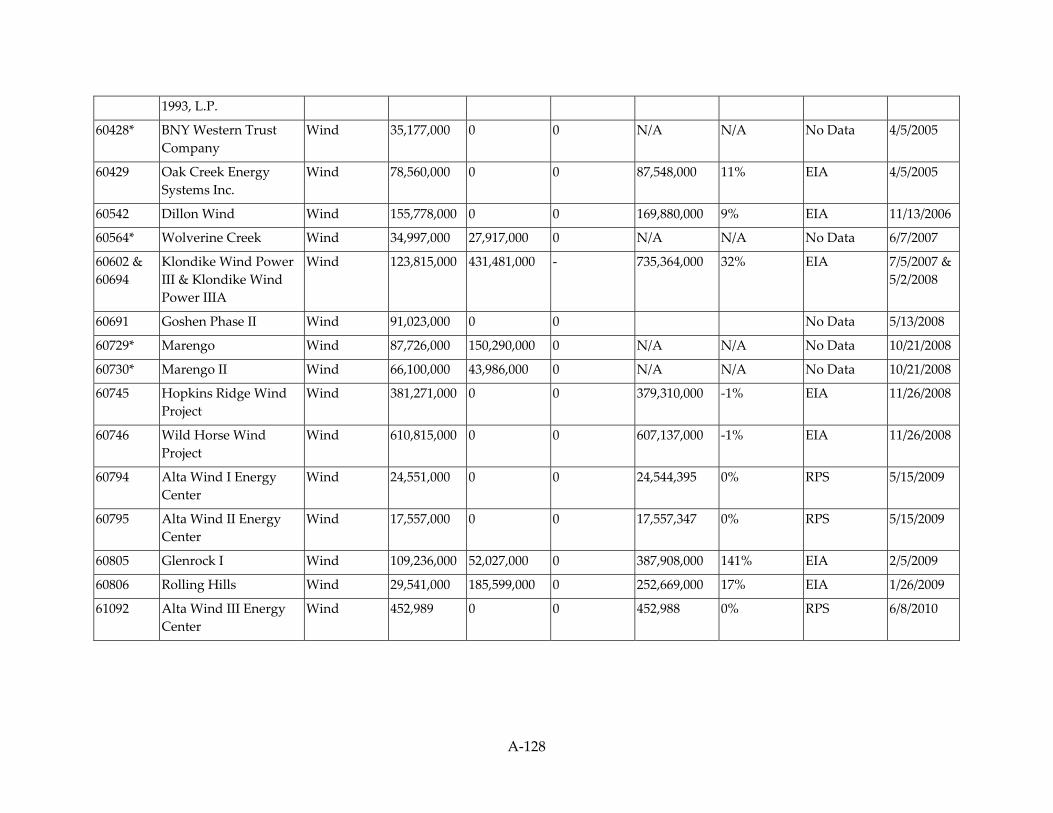
A‐128
1993, L.P.
60428* BNY Western Trust Company
Wind 35,177,000 0 0 N/A N/A No Data 4/5/2005
60429 Oak Creek Energy Systems Inc.
Wind 78,560,000 0 0 87,548,000 11% EIA 4/5/2005
60542 Dillon Wind Wind 155,778,000 0 0 169,880,000 9% EIA 11/13/2006
60564* Wolverine Creek Wind 34,997,000 27,917,000 0 N/A N/A No Data 6/7/2007
60602 & 60694
Klondike Wind Power III & Klondike Wind Power IIIA
Wind 123,815,000 431,481,000 ‐ 735,364,000 32% EIA 7/5/2007 & 5/2/2008
60691 Goshen Phase II Wind 91,023,000 0 0 No Data 5/13/2008
60729* Marengo Wind 87,726,000 150,290,000 0 N/A N/A No Data 10/21/2008
60730* Marengo II Wind 66,100,000 43,986,000 0 N/A N/A No Data 10/21/2008
60745 Hopkins Ridge Wind Project
Wind 381,271,000 0 0 379,310,000 ‐1% EIA 11/26/2008
60746 Wild Horse Wind Project
Wind 610,815,000 0 0 607,137,000 ‐1% EIA 11/26/2008
60794 Alta Wind I Energy Center
Wind 24,551,000 0 0 24,544,395 0% RPS 5/15/2009
60795 Alta Wind II Energy Center
Wind 17,557,000 0 0 17,557,347 0% RPS 5/15/2009
60805 Glenrock I Wind 109,236,000 52,027,000 0 387,908,000 141% EIA 2/5/2009
60806 Rolling Hills Wind 29,541,000 185,599,000 0 252,669,000 17% EIA 1/26/2009
61092 Alta Wind III Energy Center
Wind 452,989 0 0 452,988 0% RPS 6/8/2010

A‐129
* RPS identification numbers that end in the suffix E and show No Data in the column ʺGeneration Data Used for Comparison with Procurementʺ are utility‐certified facilities with no independently reported generation. As stated on page 47 in the RPS Eligibility Guidebook, Third Edition, the retail seller is responsible for reporting the generation data for the facilities it certifies. This reporting requirement will be satisfied through the CEC‐RPS‐Track forms. Therefore, the asterisk indicates that the facility is utility‐certified and that the procurement amount reported is accepted as reported on the RPS‐Track form.
1 SCE has requested that 22,000 kWh from the procurement claims from Royal Farms (RPS ID 60279) be counted as withdrawn procurement due to the procurement being claimed before the facility’s beginning on date.
2 SCE has requested that 44,092,000 kWh from the procurement claims from Ormesa Geothermal I (RPS ID 60311 and Ormesa Geothermal II (RPS ID 60312) )be counted as withdrawn procurement due to adjustment of the facilities’ nameplate capacities.
3 SCE has requested that the procurement claim from Ormesa Geothermal I (Geo East Mesa, RPS ID 61431) be counted as withdrawn procurement due the facility not being RPS certified at the time of the procurement claim.
4 SCE has requested that 18,128 kWh from the procurement claim from Section 7 Trust (RPS ID 60398) be counted as withdrawn procurement due to the procurement being attributed to on‐site use.

A‐130
SDG&E RPS Procurement Claims Analysis 2008 RPS Procurement Claims
CEC RPS ID
Number1 Facility Name2 Fuel Type3
Annual Generation Procured (kWh)4
RPS Procurement Claims by Other Retail Sellers (kWh)5
Procurement Reported to Power Source
Disclosure Program/ Voluntary Programs (kWh)6
Generation Data Used
for Comparison
With Procurement (kWh)7
Percent Difference Between Generation
and Procurement
8
Generation Data Source9
Facilityʹs Beginning On Date10
60431 AES Delano, Inc. Biomass 318,941,356 0 0 318,941,820 0% ERFP 3/18/2005
60438 Badger Filtration Plant Conduit Hydro
1,328,000 0 0 1,328,291 0% Inv 4/26/2005
60439 Bear Valley Hydro Conduit Hydro
5,544,216 0 0 5,545,000 0% EIA 4/26/2005
60441* Olivenhain Municipal Water District
Conduit Hydro
427,439 0 0 N/A N/A No Data 4/26/2005
60442* San Francisco Peak Hydro Plant
Conduit Hydro
691,490 0 0 N/A N/A No Data 4/26/2005
60470 Rancho Penasquitos Pressure Control Hydroelectric Facility
Conduit Hydro
22,892,132 0 0 22,893,084 0% RPS 5/24/2005
60551 Gas Utilization Facility Digester Gas 12,916,796 0 0 32,309,000 150% EAO 2/22/2007
60011 & 60486
Sycamore Energy 1 LLC & Sycamore Canyon 2
Landfill Gas 13,017,906 0 16,067,000 23% EAO 7/26/2004 & 11/2/2005
60433 & 60434
Otay Landfill 1 & 2 Landfill Gas 24,398,696 0 0 25,398,000 4% EAO 4/26/2005
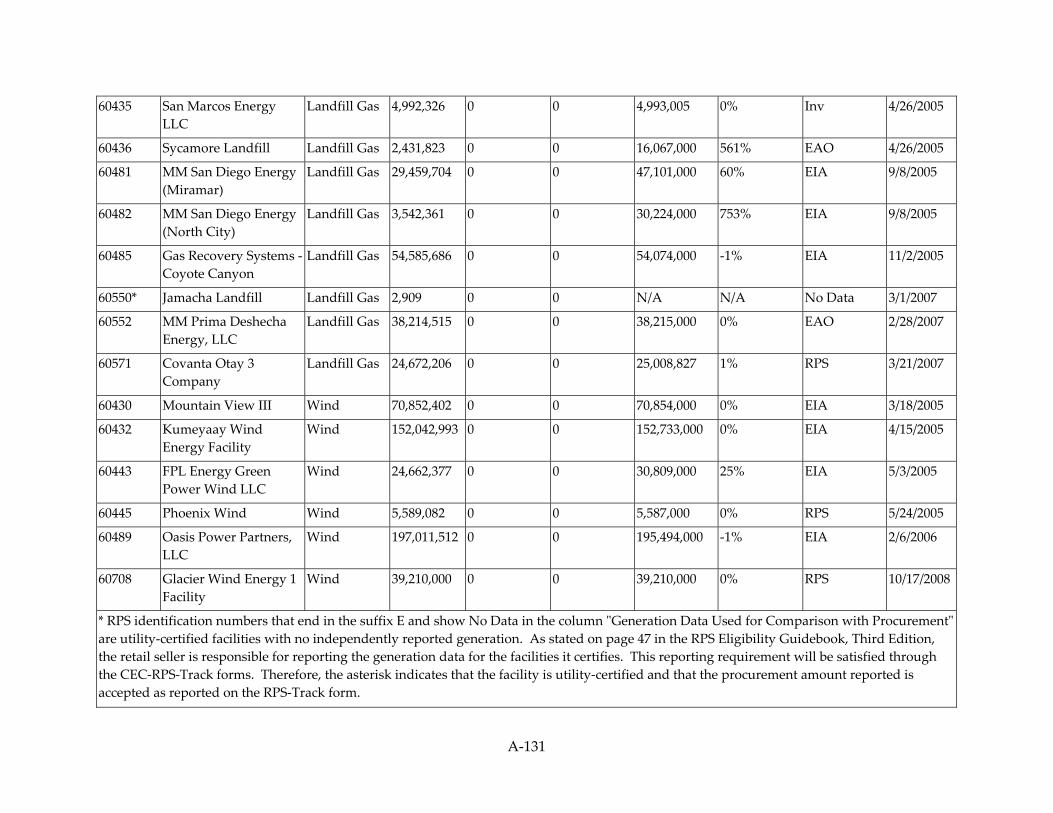
A‐131
60435 San Marcos Energy LLC
Landfill Gas 4,992,326 0 0 4,993,005 0% Inv 4/26/2005
60436 Sycamore Landfill Landfill Gas 2,431,823 0 0 16,067,000 561% EAO 4/26/2005
60481 MM San Diego Energy (Miramar)
Landfill Gas 29,459,704 0 0 47,101,000 60% EIA 9/8/2005
60482 MM San Diego Energy (North City)
Landfill Gas 3,542,361 0 0 30,224,000 753% EIA 9/8/2005
60485 Gas Recovery Systems ‐ Coyote Canyon
Landfill Gas 54,585,686 0 0 54,074,000 ‐1% EIA 11/2/2005
60550* Jamacha Landfill Landfill Gas 2,909 0 0 N/A N/A No Data 3/1/2007
60552 MM Prima Deshecha Energy, LLC
Landfill Gas 38,214,515 0 0 38,215,000 0% EAO 2/28/2007
60571 Covanta Otay 3 Company
Landfill Gas 24,672,206 0 0 25,008,827 1% RPS 3/21/2007
60430 Mountain View III Wind 70,852,402 0 0 70,854,000 0% EIA 3/18/2005
60432 Kumeyaay Wind Energy Facility
Wind 152,042,993 0 0 152,733,000 0% EIA 4/15/2005
60443 FPL Energy Green Power Wind LLC
Wind 24,662,377 0 0 30,809,000 25% EIA 5/3/2005
60445 Phoenix Wind Wind 5,589,082 0 0 5,587,000 0% RPS 5/24/2005
60489 Oasis Power Partners, LLC
Wind 197,011,512 0 0 195,494,000 ‐1% EIA 2/6/2006
60708 Glacier Wind Energy 1 Facility
Wind 39,210,000 0 0 39,210,000 0% RPS 10/17/2008
* RPS identification numbers that end in the suffix E and show No Data in the column ʺGeneration Data Used for Comparison with Procurementʺ are utility‐certified facilities with no independently reported generation. As stated on page 47 in the RPS Eligibility Guidebook, Third Edition, the retail seller is responsible for reporting the generation data for the facilities it certifies. This reporting requirement will be satisfied through the CEC‐RPS‐Track forms. Therefore, the asterisk indicates that the facility is utility‐certified and that the procurement amount reported is accepted as reported on the RPS‐Track form.

A‐132
2009 RPS Procurement Claims
CEC RPS ID
Number1 Facility Name2 Fuel Type3
Annual Generation Procured (kWh)4
RPS Procurement Claims by Other Retail Sellers (kWh)5
Procurement Reported to Power Source
Disclosure Program/ Voluntary Programs (kWh)6
Generation Data Used
for Comparison
With Procurement (kWh)7
Percent Difference Between Generation
and Procurement
8
Generation Data Source9
Facilityʹs Beginning On Date10
60431 AES Delano, Inc. Biomass 341,361,000 0 0 341,361,000 0% EAO 3/18/2005
60438 Badger Filtration Plant Conduit Hydro
582,000 0 0 582,248 0% Inv 4/26/2005
60439 Bear Valley Hydro Conduit Hydro
2,241,000 0 0 2,241,000 0% EIA 4/26/2005
60441* Olivenhain Municipal Water District
Conduit Hydro
605,000 0 0 N/A N/A No Data 4/26/2005
60442* San Francisco Peak Hydro Plant
Conduit Hydro
665,000 0 0 N/A N/A No Data 4/26/2005
60470 Rancho Penasquitos Pressure Control Hydroelectric Facility
Conduit Hydro
20,346,000 0 0 20,349,000 0% EIA 5/24/2005
60551 Gas Utilization Facility Digester Gas 13,516,000 0 0 33,439,000 147% EAO 2/22/2007
60011 & 60486
Sycamore Energy 1 LLC & Sycamore Canyon 2
Landfill Gas 15,513,000 0 0 15,494,000 0% EIA 7/27/2004
60433 & 60434
Otay Landfill 1 & 2 Landfill Gas 22,169,000 0 0 23,284,000 5% EAO 4/27/2005
60435 San Marcos Energy LLC
Landfill Gas 5,205,000 0 0 5,199,000 0% EIA 4/26/2005

A‐133
60481 MM San Diego Energy (Miramar)
Landfill Gas 28,391,000 0 0 50,219,000 77% EIA 9/8/2005
60482 MM San Diego Energy (North City)
Landfill Gas 4,413,000 0 0 30,147,000 583% EIA 9/8/2005
60485 Gas Recovery Systems ‐ Coyote Canyon
Landfill Gas 51,474,000 0 0 51,768,000 1% EIA 11/2/2005
60550 Jamacha Landfill Landfill Gas 5,000 0 0 No Data 3/1/2007
60552 MM Prima Deshecha Energy, LLC
Landfill Gas 40,002,000 0 0 40,151,000 0% EAO 2/28/2007
60571 Covanta Otay 3 Company
Landfill Gas 24,333,000 0 0 24,333,580 0% RPS 3/21/2007
60761* SDG&E‐owned PV system at Innovative Cold Storage Enterprises
Photovoltaic 617,000 0 0 N/A N/A No Data 3/17/2009
60762* SDG&E‐owned PV system at Del Sur Elementary School
Photovoltaic 45,000 0 0 N/A N/A No Data 3/17/2009
60881*1 SDG&E‐Owned PV System at X‐nth
Photovoltaic 33,000 0 0 N/A N/A No Data 9/14/2009
60882*2 SDG&E‐Owned PV System at Ladera Ranch I
Photovoltaic 49,000 0 0 N/A N/A No Data 9/14/2009
60883*3 SDG&E‐Owned PV System at Hunter Industries, Inc
Photovoltaic 91,000 0 0 N/A N/A No Data 9/14/2009
60884*4 SDG&E‐Owned PV System at the Towers at Bressi Ranch
Photovoltaic 75,000 0 0 N/A N/A No Data 9/14/2009
60430 Mountain View III Wind 82,995,000 0 0 82,794,000 0% EIA 3/18/2005

A‐134
60432 Kumeyaay Wind Energy Facility
Wind 143,583,000 0 0 143,354,000 0% EIA 4/15/2005
60443 FPL Energy Green Power Wind LLC
Wind 36,718,000 0 0 35,555,000 ‐3% EIA 5/3/2005
60445 Phoenix Wind Wind 6,626,000 0 0 6,594,000 0% EIA 5/24/2005
60489 Oasis Power Partners, LLC
Wind 162,109,000 0 0 162,132,000 0% EIA 2/6/2006
60562 Leaning Juniper Wind 153,917,000 30,719,000 0 258,672,000 40% EIA 11/1/2006
60564 Wolverine Creek Wind 43,844,000 48,030,000 0 153,791,000 67% EIA 6/7/2007
60708 Glacier Wind Energy 1 Facility
Wind 257,187,000 0 0 249,079,000 ‐3% EIA 10/17/2008
60709 Glacier Wind Energy 2 Facility
Wind 82,405,000 0 0 82,402,000 0% Inv 5/30/2008
60729 Marengo Wind 163,058,000 52,720,000 0 474,831,000 120% EIA 10/21/2008
60730 Marengo II Wind 80,261,000 26,371,000 0 474,831,000 345% EIA 10/21/2008
60736 Cabazon Wind Partners
Wind 125,256,000 0 0 125,240,000 0% EIA 11/19/2008
60737 Whitewater Hill Wind Partners
Wind 188,708,000 0 0 188,706,000 0% EIA 11/19/2008
* RPS identification numbers that end in the suffix E and show No Data in the column ʺGeneration Data Used for Comparison with Procurementʺ are utility‐certified facilities with no independently reported generation. As stated on page 47 in the RPS Eligibility Guidebook, Third Edition, the retail seller is responsible for reporting the generation data for the facilities it certifies. This reporting requirement will be satisfied through the CEC‐RPS‐Track forms. Therefore, the asterisk indicates that the facility is utility‐certified and that the procurement amount reported is accepted as reported on the RPS‐Track form.
1 SDG&E requested that 12,000 kWh of the procurement claim from the SDG&E‐Owned PV System at X‐nth (RPS ID 60881) be counted as withdrawn due to the procurement being claimed before the facility’s beginning on date.
2 SDG&E requested that 19,000 kWh of the procurement claim from the SDG&E‐Owned PV System at Ladera Ranch I (RPS ID 60882) be counted as withdrawn due to the procurement being claimed before the facility’s beginning on date.

A‐135
3 SDG&E requested that 37,000 kWh of the procurement claim from the SDG&E‐Owned PV System at Hunter Industries, Inc (RPS ID 60883) be counted as withdrawn due to the procurement being claimed before the facility’s beginning on date.
4 SDG&E requested that 33,000 kWh of the procurement claim from the SDG&E‐Owned PV System at the Towers at Bressi Ranch (RPS ID 60884) be counted as withdrawn due to the procurement being claimed before the facility’s beginning on date.
2010 RPS Procurement Claims
CEC RPS ID
Number1 Facility Name2 Fuel Type3
Annual Generation Procured (kWh)4
RPS Procurement Claims by Other Retail Sellers (kWh)5
Procurement Reported to Power Source
Disclosure Program/ Voluntary Programs (kWh)6
Generation Data Used
for Comparison
With Procurement (kWh)7
Percent Difference Between Generation
and Procurement8
Generation Data Source9
Facilityʹs Beginning On Date10
60431 AES Delano, Inc. Biomass 312,074,000 0 0 312,019,000 0% EIA 3/18/2005
60690 Blue Lake Power LLC Biomass 27,825,000 0 0 27,680,030 ‐1% EAO 4/23/2008
60438* Badger Filtration Plant Conduit Hydro
235,000 0 0 N/A N/A No Data 4/26/2005
60439 Bear Valley Hydro Conduit Hydro
452,000 0 0 450,000 0% EAO 4/26/2005
60441* Olivenhain Municipal Water District
Conduit Hydro
886,000 0 0 N/A N/A No Data 4/26/2005
60442* San Francisco Peak Hydro Plant
Conduit Hydro
588,000 0 0 N/A N/A No Data 4/26/2005
60470 Rancho Penasquitos Pressure Control Hydroelectric Facility
Conduit Hydro
20,206,000 0 0 20,206,000 0% EAO 5/24/2005

A‐136
60551 Gas Utilization Facility Digester Gas 21,986,000 0 0 36,177,000 65% EAO 2/22/2007
60009 Calpine Geothermal Unit 20
Geothermal 91,200,000 238,466,000 0 329,676,000 0% EAO 6/14/2004
60010 Sonoma/Calpine Geyser
Geothermal 18,000,000 291,050,000 0 309,051,000 0% EAO 6/14/2004
60025 Calpine Geothermal Unit 11
Geothermal 73,800,000 402,922,000 0 476,738,000 0% EAO 6/14/2004
60011 & 60486
Sycamore Energy 1 LLC & Sycamore Canyon 2
Landfill Gas 13,266,000 0 0 13,292,000 0% EAO 11/2/2005
60433 & 60434
Otay Landfill 1 & 2 Landfill Gas 21,766,000 0 0 21,489,000 ‐1% EAO 4/27/2005
60435 San Marcos Energy LLC
Landfill Gas 3,539,000 0 0 3,553,000 0% EAO 4/26/2005
60481 MM San Diego Energy (Miramar)
Landfill Gas 32,003,000 0 0 51,989,000 62% EAO 9/8/2005
60482 MM San Diego Energy (North City)
Landfill Gas 4,746,000 0 0 28,817,000 507% EAO 9/8/2005
60485 Gas Recovery Systems ‐ Coyote Canyon
Landfill Gas 49,380,000 0 0 48,679,000 ‐1% EAO 11/2/2005
60552 MM Prima Deshecha Energy, LLC
Landfill Gas 42,480,000 0 0 42,691,000 0% EAO 2/28/2007
60571 Covanta Otay 3 Company
Landfill Gas 20,901,000 0 0 20,901,307 0% RPS 3/21/2007
60761* SDG&E‐owned PV system at Innovative Cold Storage Enterprises
Photovoltaic 848,000 0 0 N/A N/A No Data 3/17/2009
60762* SDG&E‐owned PV system at Del Sur
Photovoltaic 85,000 0 0 N/A N/A No Data 3/17/2009
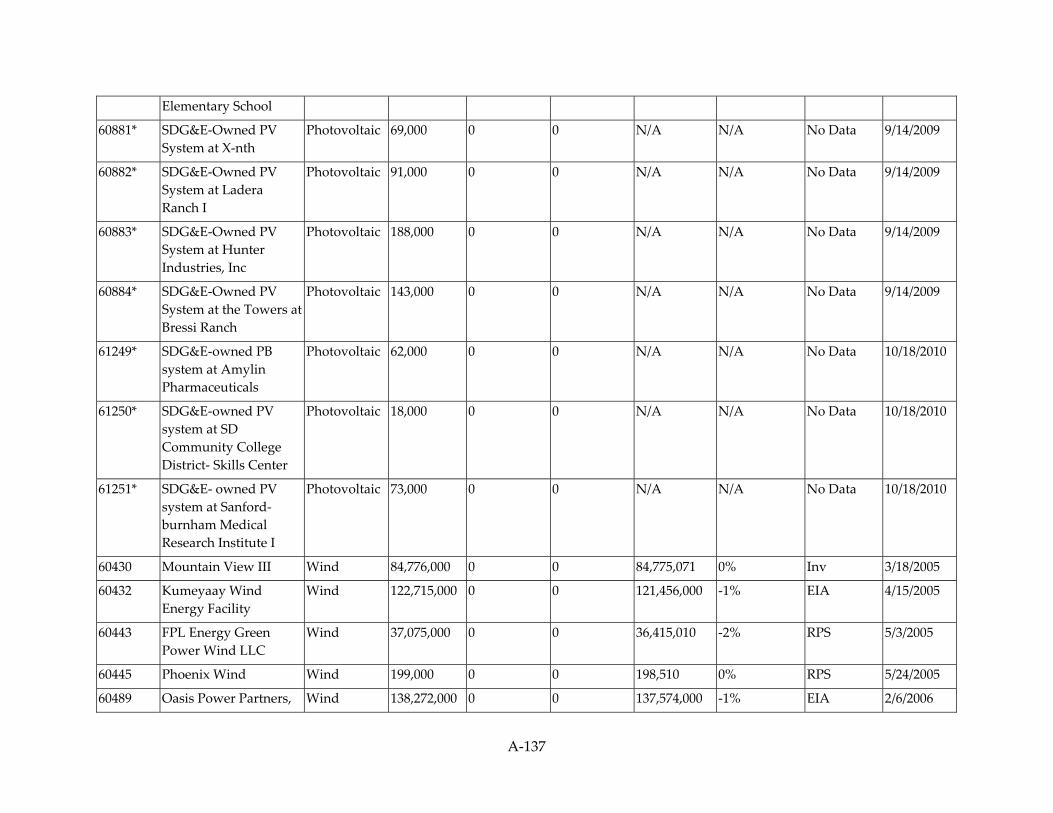
A‐137
Elementary School
60881* SDG&E‐Owned PV System at X‐nth
Photovoltaic 69,000 0 0 N/A N/A No Data 9/14/2009
60882* SDG&E‐Owned PV System at Ladera Ranch I
Photovoltaic 91,000 0 0 N/A N/A No Data 9/14/2009
60883* SDG&E‐Owned PV System at Hunter Industries, Inc
Photovoltaic 188,000 0 0 N/A N/A No Data 9/14/2009
60884* SDG&E‐Owned PV System at the Towers at Bressi Ranch
Photovoltaic 143,000 0 0 N/A N/A No Data 9/14/2009
61249* SDG&E‐owned PB system at Amylin Pharmaceuticals
Photovoltaic 62,000 0 0 N/A N/A No Data 10/18/2010
61250* SDG&E‐owned PV system at SD Community College District‐ Skills Center
Photovoltaic 18,000 0 0 N/A N/A No Data 10/18/2010
61251* SDG&E‐ owned PV system at Sanford‐burnham Medical Research Institute I
Photovoltaic 73,000 0 0 N/A N/A No Data 10/18/2010
60430 Mountain View III Wind 84,776,000 0 0 84,775,071 0% Inv 3/18/2005
60432 Kumeyaay Wind Energy Facility
Wind 122,715,000 0 0 121,456,000 ‐1% EIA 4/15/2005
60443 FPL Energy Green Power Wind LLC
Wind 37,075,000 0 0 36,415,010 ‐2% RPS 5/3/2005
60445 Phoenix Wind Wind 199,000 0 0 198,510 0% RPS 5/24/2005
60489 Oasis Power Partners, Wind 138,272,000 0 0 137,574,000 ‐1% EIA 2/6/2006

A‐138
LLC
60562 Leaning Juniper Wind 161,057,000 3,780,000 0 223,558,000 36% EIA 11/1/2006
60564* Wolverine Creek Wind 1,740,000 61,174,000 0 N/A N/A No Data 6/7/2007
60708 Glacier Wind Energy 1 Facility
Wind 231,248,000 0 0 231,245,000 0% Inv 10/17/2008
60709 Glacier Wind Energy 2 Facility
Wind 226,846,000 0 0 215,595,000 ‐5% EIA 5/30/2008
60729* Marengo Wind 144,695,000 93,321,000 0 N/A N/A No Data 10/21/2008
60730* Marengo II Wind 33,918,000 76,168,000 0 N/A N/A No Data 10/21/2008
60736 Cabazon Wind Partners
Wind 125,931,000 0 0 125,927,000 0% EIA 11/19/2008
60737 Whitewater Hill Wind Partners
Wind 163,808,000 0 0 163,805,000 0% EIA 11/19/2008
* RPS identification numbers that end in the suffix E and show No Data in the column ʺGeneration Data Used for Comparison with Procurementʺ are utility‐certified facilities with no independently reported generation. As stated on page 47 in the RPS Eligibility Guidebook, Third Edition, the retail seller is responsible for reporting the generation data for the facilities it certifies. This reporting requirement will be satisfied through the CEC‐RPS‐Track forms. Therefore, the asterisk indicates that the facility is utility‐certified and that the procurement amount reported is accepted as reported on the RPS‐Track form.