
U.S. PPI Program Enhancement: Adding Services ... fileU.S. PPI Program Enhancement: Adding Services...
33
U.S. PPI Program Enhancement: Adding Services & Construction to PPI’s Primary Aggregation Structures (FD-ID) David Friedman Assistant Commissioner for Industrial Prices & Price Indexes US Bureau of Labor Statistics 28 th Voorburg Group Meeting Cross-cutting Topics Tokyo, Japan 9 October 2013
Transcript of U.S. PPI Program Enhancement: Adding Services ... fileU.S. PPI Program Enhancement: Adding Services...

U.S. PPI Program Enhancement: Adding Services & Construction to
PPI’s Primary Aggregation Structures (FD-ID)
David Friedman Assistant Commissioner for Industrial Prices &
Price Indexes US Bureau of Labor Statistics 28th Voorburg Group Meeting
Cross-cutting Topics Tokyo, Japan
9 October 2013

Introduction
With the January 2011 data release, PPI introduced a new experimental index aggregation system, now called Final Demand-Intermediate Demand (FD-ID)
PPI plans to shift the focus of its press release to this new FD-ID system with the release of data for January 2014
2

Introduction – Services and Construction Background
Prior to the mid 1980s, PPI produced only goods based price indexes
Due to the rapid growth of the services sector, the PPI undertook an effort to expand its coverage to include services and construction price indexes
3

Introduction – Long-Term PPI Goal
The Stage of Processing (SOP) system indexes are currently the focus of the PPI press release
The SOP indexes are aggregate indexes composed only of goods prices
Since the expansion initiative began, PPI planned to add services and construction price indexes to the aggregate indexes featured in the press release
Transition to FD-ID system is the first change in PPI’s headline number since March 1978
4

Introduction – Coverage
5
Coverage of the service and construction
sectors is high enough to produce
meaningful new aggregate inflation numbers
that include goods, services, and
construction
-72 percent of services covered (measured by Census
revenue)
-34 percent of construction covered (measured by Census
revenue)

Current SOP system
Finished goods
Goods sold as personal consumption and capital investment
Intermediate goods
Processed goods purchased by businesses as inputs to production
Crude goods
Unprocessed goods purchased by businesses as inputs to production
6

7
Criteria for new PPI Aggregation System
Include all commodities for which PPI currently has indexes
Cover both intermediate and final demand
Additional indexes should be able to be added to the system
Eliminate or minimize multiple counting problems
Conceptually understandable
Analytically useful:
• Price transmission analysis
• Source of inflation pressures

Final Demand-Intermediate Demand System
Expands coverage beyond SOP system by adding services, construction, exports, and government purchases
more than doubles PPI coverage of the United States economy as compared to SOP system
coverage is over 75 percent of in-scope domestic production
8

9
Final Demand-Intermediate Demand
System
System contains two main portions
Final demand- personal consumption, capital investment, government, export
Intermediate demand- purchases by business of inputs to production

Final Demand
Indexes track prices for commodities sold to all categories of final demand.
Indexes organized by type of commodity:
Goods
Transportation and warehousing services
Trade Services
Services excluding trade, transportation, and warehousing
Construction
Overall
10

Final Demand Structure
11
Index Relative
importance
(December 2012)
Final demand 100.000
Final demand goods 34.518
Final demand foods 5.582
Final demand energy 6.790
Final demand goods less foods and energy 22.146
Final demand services 63.443
Final demand trade services 20.390
Final demand transportation and warehousing services 4.849
Final demand services less trade, transportation, and warehousing 38.203
Final demand construction 2.039

Final Demand Structure (Continued)
12
Index Relative
importance
(December 2012)
Final demand services 63.443
Final demand trade services 20.390
Trade of finished goods 18.105
Trade of personal consumption goods 15.699
Trade of private capital equipment 2.406
Trade of government purchased goods 0.727
Trade of government purchased goods, excluding capital equipment 0.516
Trade of government purchased capital equipment 0.212
Trade of exports 1.558
Final demand transportation and warehousing services 4.849
Final demand services less trade, transportation, and warehousing 38.203

Final Demand versus Finished Goods
13
Finished goods: goods sold to personal consumption and capital investment
Final demand:
Goods sold as personal consumption, capital investment, government, and export
Services and construction sold as personal consumption, capital investment, government, and export
Finished goods comprise only 24 percent of final demand

Final Demand and Components versus Finished Goods
14
98
100
102
104
106
108
110
112
Final demand Final demand goods Final demand services
Final demand construction Finished goods

Final Demand Services by Type
15
98
100
102
104
106
108
110
112
114
116
Final demand services
Final demand transportation and warehousing services
Final demand trade services
Final demand services less trade, transportation, and warehousing

Value Added of New Final Demand Indexes
Adds services and construction to current PPI coverage
Detailed indexes by type of buyer and type of commodity
Available monthly
Trade and transportation services separated from value of good
Producer perspective
16
17
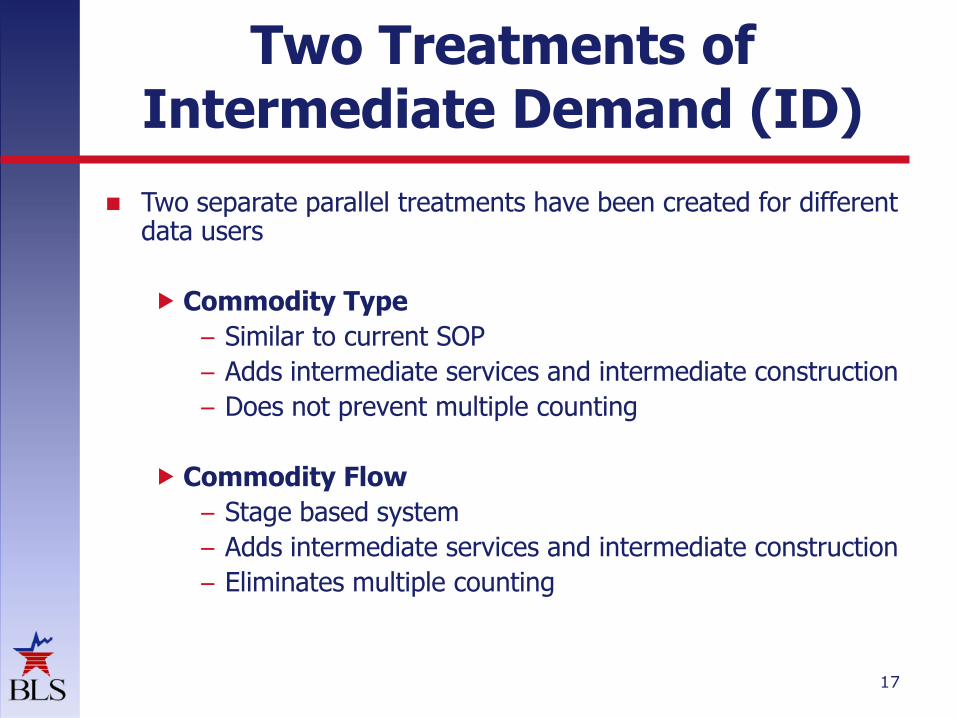
Two Treatments of Intermediate Demand (ID)
Two separate parallel treatments have been created for different data users
Commodity Type
– Similar to current SOP
– Adds intermediate services and intermediate construction
– Does not prevent multiple counting
Commodity Flow
– Stage based system
– Adds intermediate services and intermediate construction
– Eliminates multiple counting

18
Intermediate Demand by Commodity Type
No overall Intermediate Demand index
Indexes track price change for intermediate demand commodities grouped by type of commodity

Intermediate demand: Commodity Type
Indexes track prices for business inputs.
Indexes organized by type of commodity:
Unprocessed goods
Processed goods
Transportation and warehousing services
Trade Services
Services other than trade, transportation, and warehousing
Construction
19

ID by Commodity Type Relative Importances
20
Index Relative Importance
(Decemeber 2012)
Total intermediate demand (not calculated) 100.000
Processed goods for Intermediate Demand 43.240
Materials and components for manufacturing 19.351
Materials and components for construction 4.108
Processed fuels and lubricants 8.747
Containers 1.103
Supplies 9.930
Unprocessed goods for intermediate demand 9.402
Services for intermediate demand 46.928
Intermediate demand trade services 9.309
Intermediate demand transportation and warehousing services 6.500
Intermediate demand services less trade, transportation, and
warehousing 31.119
Construction for intermediate demand 0.430

21
Intermediate Demand Commodity Type
99
104
109
114
119
124
129
134
Processed goods for intermediate demand Unprocessed goods for intermediate demand
Intermediate demand services Construction for intermediate demand

22
Services for Intermediate Demand
99
101
103
105
107
109
111
113
115
117
Intermediate demand services
Intermediate demand transportation and warehousing services
Intermediate demand trade services
Intermediate demand services less trade, transportation, and warehousing

23
Intermediate Demand by Production Flow: Introduction
Commodities assigned to aggregates based on production flow
Four intermediate demand stages
More useful for price transmission analysis

24
Intermediate Demand: Production Flow PPI System
Stage 1→Stage 2→Stage 3→Stage 4→ Final Demand
Example:
Mining support services(S1)→iron ore(S2)→steel(S3)→car parts(S4) →cars(FD)
Net indexes – no multiple counting

25
Production Flow PPI System
Various numbers of stages were tried.
Four stage system performed the best in terms flow minimizing backflow and maximizing forward flow.

Intermediate Demand by Production Flow Relative Importances
26
Index
Relative Importance
(December 2012)
Total 100.000
Stage 1 intermediate demand 11.817
Goods 6.856
Services 4.956
Construction 0.006
Stage 2 intermediate demand 18.193
Goods 10.410
Services 7.667
Construction 0.116
Stage 3 intermediate demand 23.177
Goods 12.625
Services 10.436
Construction 0.116
Stage 4 intermediate demand 46.813
Goods 23.785
Services 22.867
Construction 0.161

Intermediate Demand by Production Flow Index Change FD and all ID Stages
27
-0.8
-0.6
-0.4
-0.2
0
0.2
0.4
0.6
0.8
1
Dec-
09
Mar-
10
Jun-1
0
Sep-1
0
Dec-
10
Mar-
11
Jun-1
1
Sep-1
1
Dec-
11
Mar-
12
Jun-1
2
Sep-1
2
Dec-
12
Mar-
13
Pe
rce
nt
ch
an
ge
Final demand Stage 4 intermediate demand
-1
-0.5
0
0.5
1
1.5
2
Dec-
09
Mar-
10
Jun-1
0
Sep-1
0
Dec-
10
Mar-
11
Jun-1
1
Sep-1
1
Dec-
11
Mar-
12
Jun-1
2
Sep-1
2
Dec-
12
Mar-
13
Pe
rce
nt
ch
an
ge
Stage 4 intermediate demand
Stage 3 intermediate demand
-3 -2 -1 0 1 2 3 4 5 6
Dec-
09
Mar-
10
Jun-1
0
Sep-1
0
Dec-
10
Mar-
11
Jun-1
1
Sep-1
1
Dec-
11
Mar-
12
Jun-1
2
Sep-1
2
Dec-
12
Mar-
13
Pe
rce
nt
ch
an
ge
Stage 3 intermediate demand
Stage 2 intermediate demand
-4
-2
0
2
4
6
Dec-
09
Mar-
10
Jun-1
0
Sep-1
0
Dec-
10
Mar-
11
Jun-1
1
Sep-1
1
Dec-
11
Mar-
12
Jun-1
2
Sep-1
2
Dec-
12
Mar-
13
Pe
rce
nt
ch
an
ge
Stage 2 intermediate demand
Stage 1 intermediate demand

Intermediate Demand by Production Flow Index Change by Stage – Food
28
-4.0
-3.0
-2.0
-1.0
0.0
1.0
2.0
3.0
4.0
5.0
Pe
rce
nt
ch
an
ge
FD foods Stage 4 foods
-6.0
-4.0
-2.0
0.0
2.0
4.0
6.0
8.0
May-1
0
Aug-1
0
Nov-1
0
Feb-1
1
May-1
1
Aug-1
1
Nov-1
1
Feb-1
2
May-1
2
Aug-1
2
Nov-1
2
Feb-1
3
Pe
rce
nt
ch
an
ge
Stage 4 foods Stage 3 foods
-10.0
-5.0
0.0
5.0
10.0
15.0
20.0
May-1
0
Aug-1
0
Nov-1
0
Feb-1
1
May-1
1
Aug-1
1
Nov-1
1
Feb-1
2
May-1
2
Aug-1
2
Nov-1
2
Feb-1
3
Pe
rce
nt
ch
an
ge
Stage 3 foods Stage 2 foods
-10.0
-5.0
0.0
5.0
10.0
15.0
20.0
May-1
0
Aug-1
0
Nov-1
0
Feb-1
1
May-1
1
Aug-1
1
Nov-1
1
Feb-1
2
May-1
2
Aug-1
2
Nov-1
2
Feb-1
3
Pe
rce
nt
ch
an
ge
Stage 2 foods Stage 1 foods

Intermediate Demand by Production Flow Index Change by Stage – Energy
29
-8
-6
-4
-2
0
2
4
6
May-1
0
Aug-1
0
Nov-1
0
Feb-1
1
May-1
1
Aug-1
1
Nov-1
1
Feb-1
2
May-1
2
Aug-1
2
Nov-1
2
Feb-1
3
Pe
rce
nt
ch
an
ge
FD energy Stage 4 energy
-8
-6
-4
-2
0
2
4
6
Pe
rce
nt
ch
an
ge
Stage 4 energy Stage 3 energy
-13
-8
-3
2
7
12
May-1
0
Aug-1
0
Nov-1
0
Feb-1
1
May-1
1
Aug-1
1
Nov-1
1
Feb-1
2
May-1
2
Aug-1
2
Nov-1
2
Feb-1
3
Pe
rce
nt
ch
an
ge
Stage 3 energy Stage 2 energy
-13
-8
-3
2
7
12
May-1
0
Aug-1
0
Nov-1
0
Feb-1
1
May-1
1
Aug-1
1
Nov-1
1
Feb-1
2
May-1
2
Aug-1
2
Nov-1
2
Feb-1
3
Pe
rce
nt
ch
an
ge
Stage 2 energy Stage 1 energy

Intermediate Demand by Production Flow Index Change by Stage – Goods less Foods and
Energy
30
-0.4
-0.2
0
0.2
0.4
0.6
0.8
1
Pe
rce
nt
ch
an
ge
Final demand, core Stage 4 core
-1
-0.5
0
0.5
1
1.5
May-1
0
Aug-1
0
Nov-1
0
Feb-1
1
May-1
1
Aug-1
1
Nov-1
1
Feb-1
2
May-1
2
Aug-1
2
Nov-1
2
Feb-1
3
Pe
rce
nt
ch
an
ge
Stage 4 core Stage 3 core
-3
-2
-1
0
1
2
3
Pe
rce
nt
ch
an
ge
Stage 3 core Stage 2 core
-8
-6
-4
-2
0
2
4
6
May-1
0
Aug-1
0
Nov-1
0
Feb-1
1
May-1
1
Aug-1
1
Nov-1
1
Feb-1
2
May-1
2
Aug-1
2
Nov-1
2
Feb-1
3
Pe
rce
nt
ch
an
ge
Stage 2 core Stage 1 core

Intermediate Demand by Production Flow Value Added
Flow based approach facilitates pass-through analysis
Includes services and construction
Eliminates multiple counting through stage creation and net weighting
31

Outreach to Data Users
While improvements significant, still represents major change for data users, especially the media & general public
PPI program has designed extensive outreach program including briefings, supporting materials, analysis, etc.
“Parallel” releases for July 2013 through December 2013
32

Contact Information
David Friedman 202-691-6307
[email protected] Jonathan Weinhagen
Economist Producer Price Index
202-691-7709 [email protected]


![Enhancement] Adding items (zip files and docx files only) to Knowledge Base introduced in the new user interface. [Enhancement] Enclosure and e-mail templates are now supported in](https://static.fdocuments.us/doc/165x107/5b06ec797f8b9ad5548d869c/enhancement-adding-items-zip-files-and-docx-files-only-to-knowledge-base-introduced.jpg)

