
U.S. Hispanic Purchase Behaviors Current Food/Beverage Trends
36
U.S. Hispanic Purchase Behaviors Current Food/Beverage Trends 2017 1
Transcript of U.S. Hispanic Purchase Behaviors Current Food/Beverage Trends

U.S. Hispanic Purchase BehaviorsCurrent Food/Beverage Trends
20171

Goals and Methodology
Deliver high-level briefing on U.S. Hispanic
(USH) purchase behaviors and trends
Focus on consumer insights and data
reports from last 12-18 months
− Sourced from credible groups such as Mintel,
CDC, Nielsen, Pew Research,
Selig Center for Economic Growth
2

4 Reasons Why USH Increasingly Matter to EVERYONE’s Marketing Plans
Unstoppable
Propelled by twin engine of population growth and expanding buying power. Over-indexing on a wide range of products and services
01
3
Younger than the rest of the population and setting new trends
Not assimilating like other ethnicities; merging cultural heritage and mainstream values and increasingly less responsive to a total-market strategy
Using digital at higher rates and in different ways than general market
In Their Prime Bicultural
02 03 04
Connected

Unstoppable
4
Population Growth
5
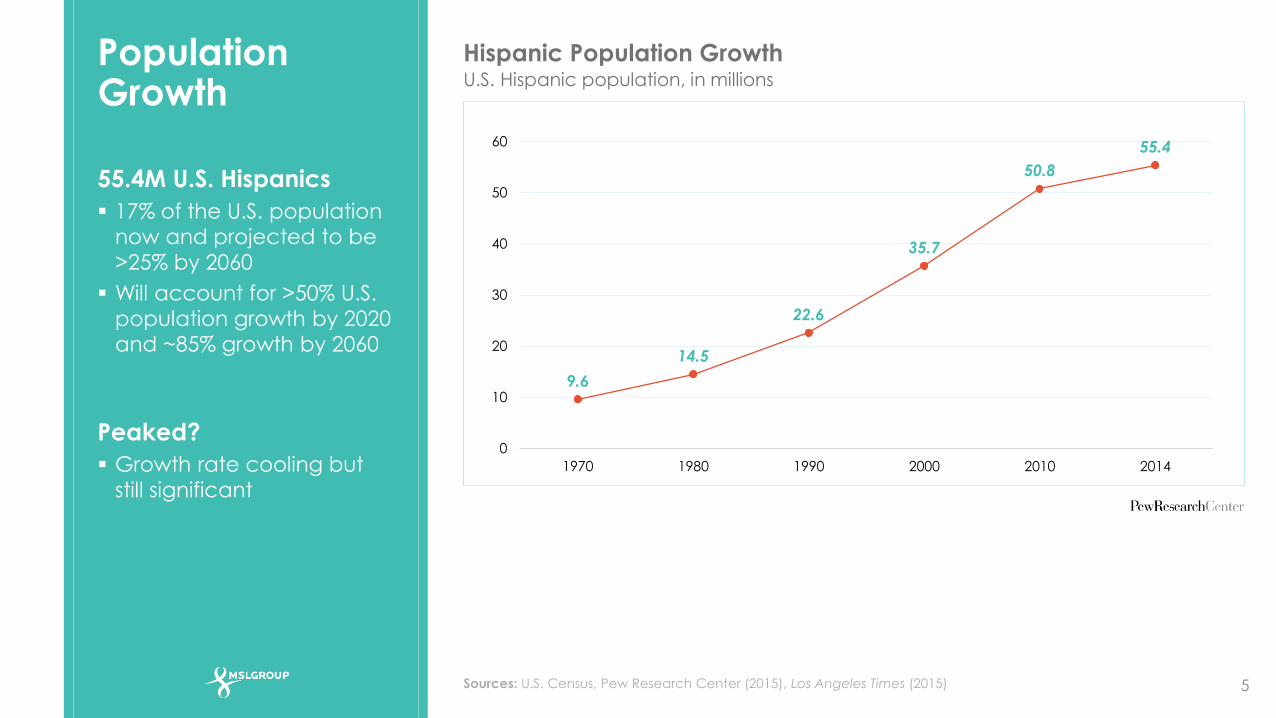
55.4M U.S. Hispanics
17% of the U.S. population
now and projected to be
>25% by 2060
Will account for >50% U.S.
population growth by 2020
and ~85% growth by 2060
Peaked?
Growth rate cooling but
still significant
Hispanic Population GrowthU.S. Hispanic population, in millions
9.6
14.5
22.6
35.7
50.8
55.4
0
10
20
30
40
50
60
1970 1980 1990 2000 2010 2014
Sources: U.S. Census, Pew Research Center (2015), Los Angeles Times (2015)

New Census Updates
6
Released 6/23/16
USH grew by 2.2%
between July 2014-
2015 while the white
population is showing
the slowest growth at
0.5%
State Population Hispanic Hispanic %
New Mexico 2,085,109 1,001,258 48.0%
California 39,144,818 15,184,548 38.8%
Texas 27,469,114 10,670,101 38.8%
Arizona 6,828,065 2,098,410 30.7%
Nevada 2,890,845 813,391 28.1%
Florida 20,271,272 4,964,077 24.5%
Colorado 5,456,574 1,164,274 21.3%
New Jersey 8,958,013 1,762,181 19.7%
New York 19,795,791 3,726,804 18.8%
Illinois 12,859,995 2,175,116 16.9%
July 2014 – July 2015 │ U.S. Census
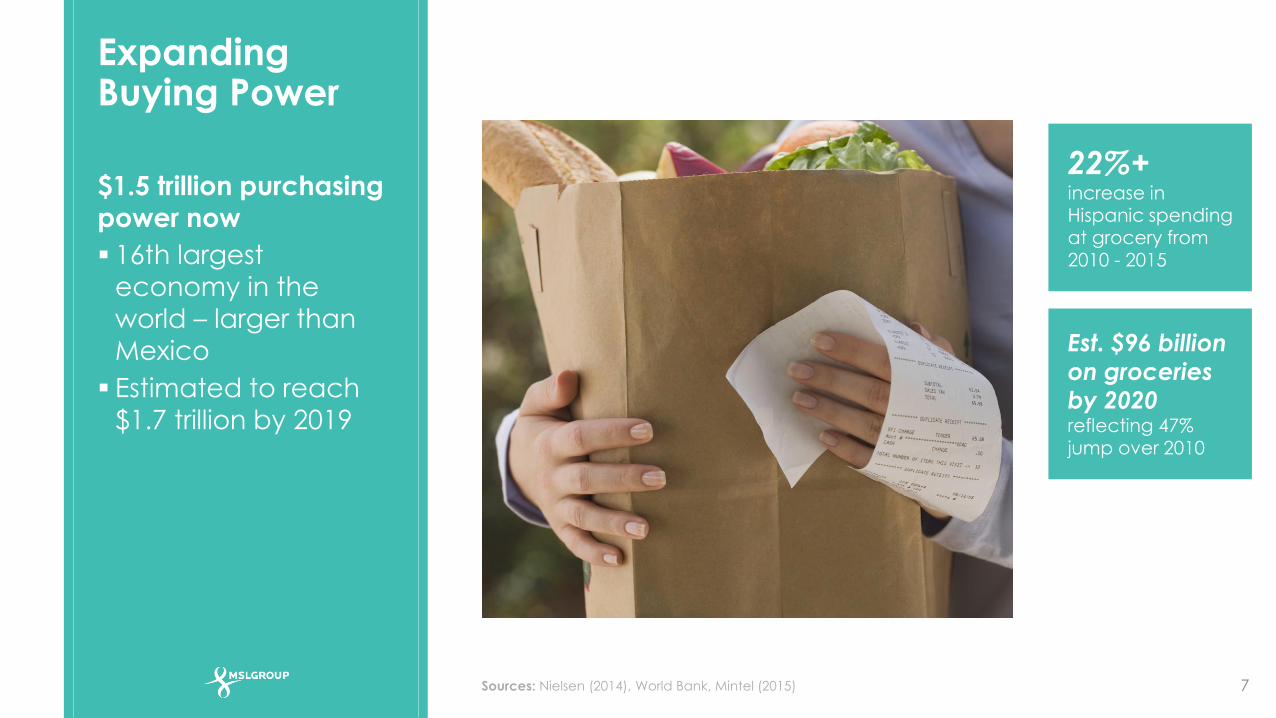
Expanding Buying Power
7
$1.5 trillion purchasing
power now
16th largest
economy in the
world – larger than
Mexico
Estimated to reach
$1.7 trillion by 2019
Sources: Nielsen (2014), World Bank, Mintel (2015)
22%+increase in Hispanic spending at grocery from 2010 - 2015
Est. $96 billion
on groceries by 2020reflecting 47% jump over 2010

Expanding Buying Power
8
As a group, Hispanic
shoppers typically spend
a greater percentage of
their income on
groceries than non-
Hispanics
Average CPG Spend per Visit
Sources: Nielsen (2014), World Bank, Mintel (2015)
$71
$39
$32 $30$26
$81
$51$47
$43
$37
0
10
20
30
40
50
60
70
80
90
Food Adult Beverages Household Proucts Health and Beauty
Aids
Over-The-Counter
Medications
Total Hispanic
Average $10 Difference

U.S. Born Subgroup Leads
9
Higher spend per basket
because of typically
higher income
Total Basket Ring $ per Shopper Across all Outlets($ Change 2013 VS. 2012)
Sources: Nielsen (2014, 2015)
$7.4
$7.8
$6.8
6.2
6.4
6.6
6.8
7
7.2
7.4
7.6
7.8
8
Foregn born Hispanic U.S. born Hispanic Non-Hispanic
(-2%)
(0%)
(-3%)

27.2
29.6
69.2
42.7
39.3
74.3
36.7
61
39.5
41.2
67.3
48.3
41.5
54.5
0 10 20 30 40 50 60 70 80
Los Angeles
New York
Houston
Miami-Ft. Lauderdale
Chicago
Dallas-Ft. Worth
San Francisco
Phoenix
San Antonio
Harlingen, TX
Sacramento
Fresno-Visalia
San Diego
Denver
% Growth 2000-2013
Table Stakes for Today
10Sources: Nielsen (2013), Pew Research (2015)
INSIGHT: Customize outreach vs. mass sweeps
More than 55% of USH
population is
concentrated in CA, FL
and TX
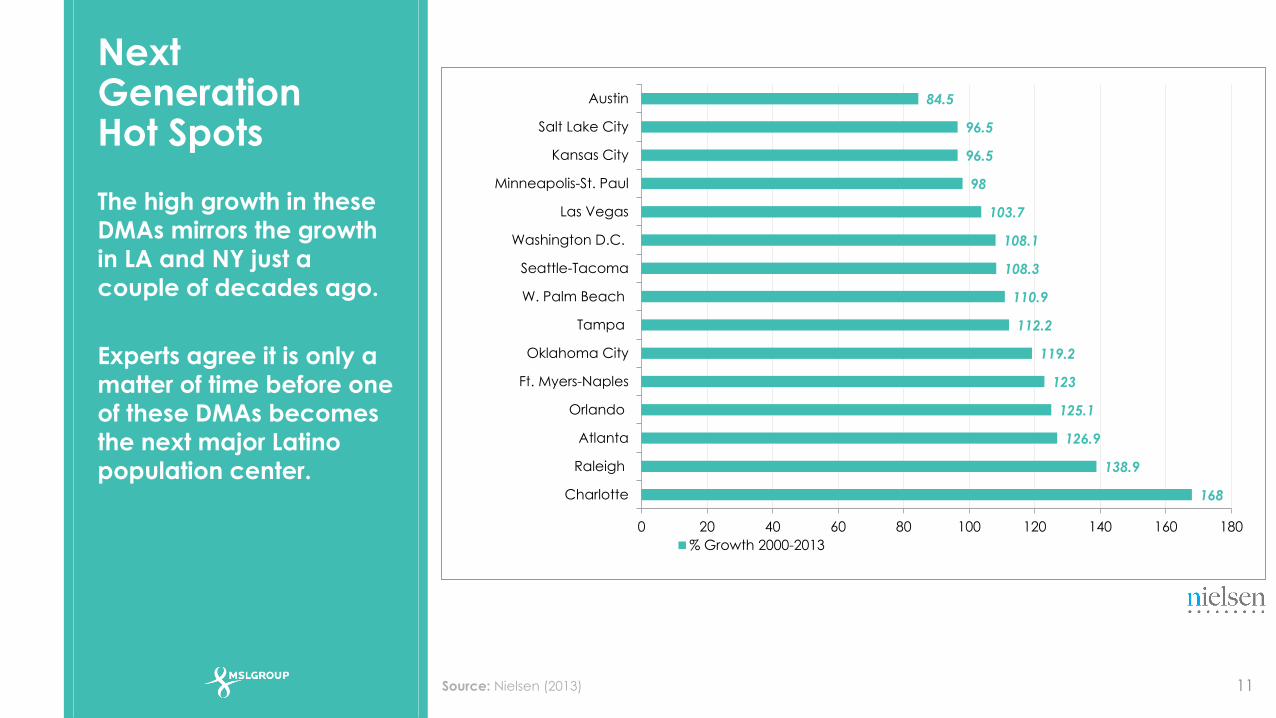
168
138.9
126.9
125.1
123
119.2
112.2
110.9
108.3
108.1
103.7
98
96.5
96.5
84.5
0 20 40 60 80 100 120 140 160 180
Charlotte
Raleigh
Atlanta
Orlando
Ft. Myers-Naples
Oklahoma City
Tampa
W. Palm Beach
Seattle-Tacoma
Washington D.C.
Las Vegas
Minneapolis-St. Paul
Kansas City
Salt Lake City
Austin
% Growth 2000-2013
Next Generation Hot Spots
11
The high growth in these
DMAs mirrors the growth
in LA and NY just a
couple of decades ago.
Experts agree it is only a
matter of time before one
of these DMAs becomes
the next major Latino
population center.
Source: Nielsen (2013)

In Their Prime
12

Disproportionally Young withMore Runway to Spend and Make a Difference
13
Nation’s youngest ethnic
group
~1/3 under age 18
Every 30 seconds, one
Hispanic turns 18 years
old as two non-Hispanics
hit retirement age
Source: Nielsen (2015), Selig Center for Economic Growth (2015), Pew Research (2016), U.S. Census
54% Higher than NH White

Living Well
14
“Upscale Latinos” control
nearly 40% of the total
U.S. Hispanics’ $1.5 trillion
spending power.
_
Follow distinctive purchase
behavior, close in age
and geographically
concentrated
Incomes of $50K-100K
Spend more on fresh
ingredients than general
USH
Focused on their children
Bilingual and bicultural
Trendsetters
Higher incidence and
intent for home
improvements
The most influential group since the Baby Boomers
Source: Nielsen (2013, 2014)

Motivations for living a healthy lifestyle among Hispanics
15
>50% feel they are
proactive about health
and nutrition
Over index on motivation
to look better
72
65
61
60
44
39
39
39
30
12
11
Feeling better
Looking better
Living longer
Being happy
Feeling confident
Manage health conditions (eg diabetes,weight, etc)
Feeling less stressed
Setting a good example for my kids
Having a responsibility to my family
Pressure from society (eg images in themedia)
Pressure from family or friends
103
119
108
103
103
92
119
95
na
na
na
Hispanics (%) Index to all (*)
Source: Mintel (2016)

Opportunities for Engagement
16
Looking at barriers for
meeting wellness goals,
top two cited are internal
challenges, including
time
Source: Mintel (2016)
49
41
34
26
26
19
19
19
9
Willpower
Time
Money/finances
Difficulty changing what my family likes to eat
Not knowing how or where to begin
Limited or no access to healthy restaurants
Feeling overwhelmed by the end goal
Limited or no access to fitness centers or gyms
Peer pressure from family and friends
%
Internal barriers
External barriers
INSIGHT: Time saving preparation tips are valued

Keeping Hispanics Engaged on Health and Nutrition
17
50% admit to being
confused by conflicting
information about
healthy eating
Source: Mintel (2016)
INSIGHT: Variety in messages and incentives are key
2625
24
27
25
22
1918
22
3231
30
27 27
24
0
5
10
15
20
25
30
35
I quickly get bored doing the
same exercises
I quickly get bored when eating
healthy
I think about health a lot, but
rarely do anything about it
All Male, 18-34 Male, 35+ Female, 18-34 Female, 35+

Bicultural
18

19
Living two
cultures at the
same time by
choice and with
purpose
First step…
Look for and accept
functional and emotional value
attached to just about
everything
You can’t maximize the full potential of a culturally-driven market segment when you still believe that they will assimilate and accept a more general market approach…

Hot Button #1: Language
20
72% of Hispanic
Millennials and 80% of
Hispanic GenXers speak
Spanish in their homes
today
65% to 200% increase in
Spanish searches
between 2011-2014
INSIGHT: Recipes and websites need to include Spanish versions
Source: Pew Research (2016), Google (2014)

Hot Button #2:Food
21
Cooking is an act of love,
a conduit for gathering
around the table and
enjoying family
Hispanics are 23% more
likely than the total US
population to be
categorized as a
“Cooking Enthusiast”
INSIGHT: Cooking isn’t perceived as a chore so be sensitive to scripting tips such they don’t come across as easy-outs. Celebrate the experience with them.
Source: Mintel (2015)

24%
25%
26%
26%
32%
33%
35%
35%
39%
45%
45%
47%
0 10 20 30 40 50
Cooking instruction or suggestions on food packaging
My children
Restaurants
Friends
Other family members
Experience with other cultures
Cooking magazines
My spouse/significant other
Cookbooks
My mom
Cooking shows on television
Online sources (recipe/cooking website, blogs, etc)
Sources Influencing Hispanic Cooking Behavior
22
INSIGHT: Blogs and websites rank high because they help Hispanics get the most out of their cooking experience
Source: Mintel (2015)
Hispanic Cooking Enthusiasts

Hot Button #3: Family
23
80% of Hispanic
shopping trips conducted
with family and friends
INSIGHT: Market to the family, not just mom.
91%of Hispanic grocery shoppers will ask their family members “what they want” as part of their planning (vs. 77% of the general population)
44%of Hispanic grocery shoppers say they’ll buy a brand because “the kids asked for it” (vs. 16% of the general population)
Source: Path to Purchase Shopper Marketing Tracking Study (2013), Univision (2012)

Hot Button #3: Family
24
Word of mouth is very
important.
46%of Hispanic consumers will ask family/friends for a restaurant recommendation (vs. 29% of the general population)
Source: Technomic Research, 2015
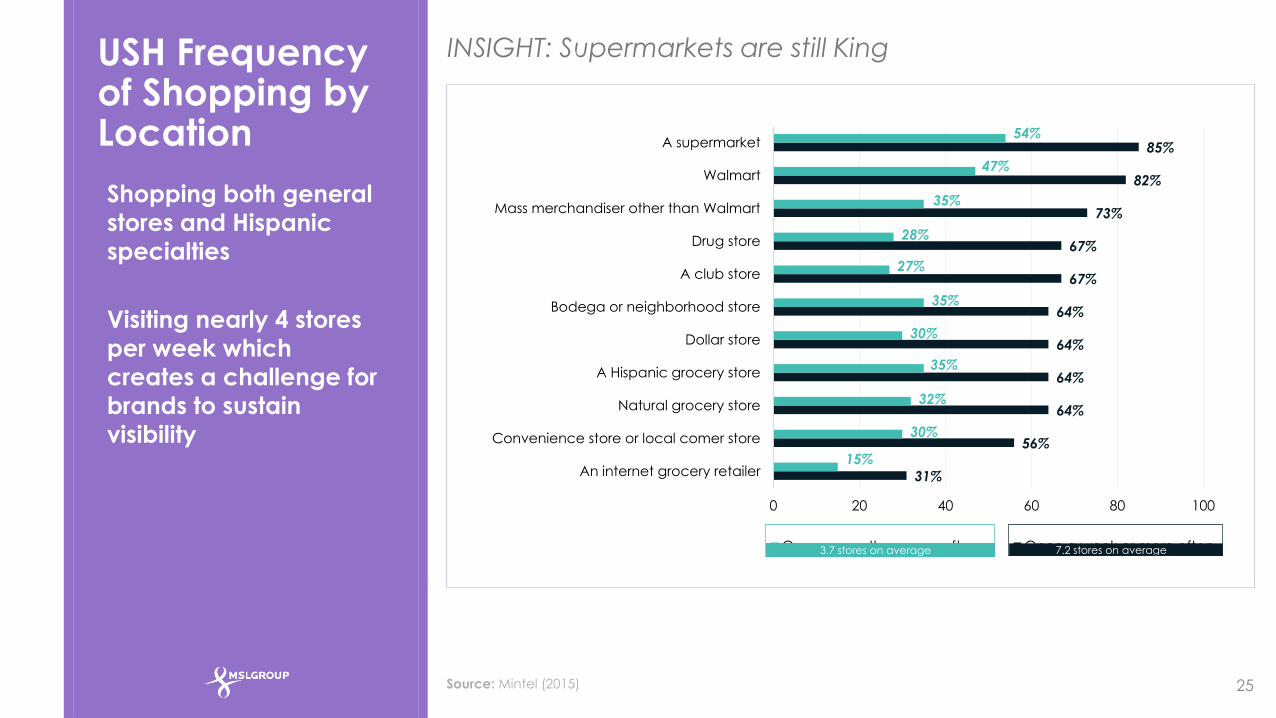
USH Frequency of Shopping by Location
25
INSIGHT: Supermarkets are still King
31%
56%
64%
64%
64%
64%
67%
67%
73%
82%
85%
15%
30%
32%
35%
30%
35%
27%
28%
35%
47%
54%
0 20 40 60 80 100
An internet grocery retailer
Convenience store or local comer store
Natural grocery store
A Hispanic grocery store
Dollar store
Bodega or neighborhood store
A club store
Drug store
Mass merchandiser other than Walmart
Walmart
A supermarket
Once a month or more often Once a week or more often3.7 stores on average 7.2 stores on average
Source: Mintel (2015)
Shopping both general
stores and Hispanic
specialties
Visiting nearly 4 stores
per week which
creates a challenge for
brands to sustain
visibility

16%
32%
36%
37%
34%
51%
50%
59%
52%
46%
64%
62%
57%
63%
64%
20%
26%
27%
30%
31%
35%
38%
39%
41%
42%
42%
42%
45%
46%
52%
0 10 20 30 40 50 60 70
Advertising on shopping cart
Video monitor displays
Promotion displays without products
Lighted merchandise graphics
Computerized information/coupon center
Advertising on the floor
Message/offers at the shelf
Promotion or display at end of aisle
The Internet
In-store demonstrations
Free standing displays with product
Signs on merchandise racks or shelves
In-store samples
Departmental signs/overhead aisle markers
Store brochures/flyers
Hispanic Non-Hispanic
In-store Triggers
26
INSIGHT: Need to make the shopping list before she arrives
Source: Mintel (2015)
Hispanics head out to
the store typically
already knowing what
they want to buy
Less likely than non-
Hispanics to act as a
result of in-store tactics

Hot Button #4:Health
27
Hispanics are the
ethnicity group least
likely to seek medical
attention – U.S. Census
INSIGHT: Anchor food and nutrition messages as part of a holistic approach. Don’t lead with a call-to-action based in preventative care.
Source: U.S. Census

DigitallySavvy
28

Unique Usage of Social Media
29
80% of USH Internet
users are connected
to some form of social media – clocking in
more time per year
than any other
demographic group tracked in the U.S.
Hispanics Are the Most Digitally Savvy Group
Source: Facebook (2014), eMarketer (2015), Pew Research (2013)
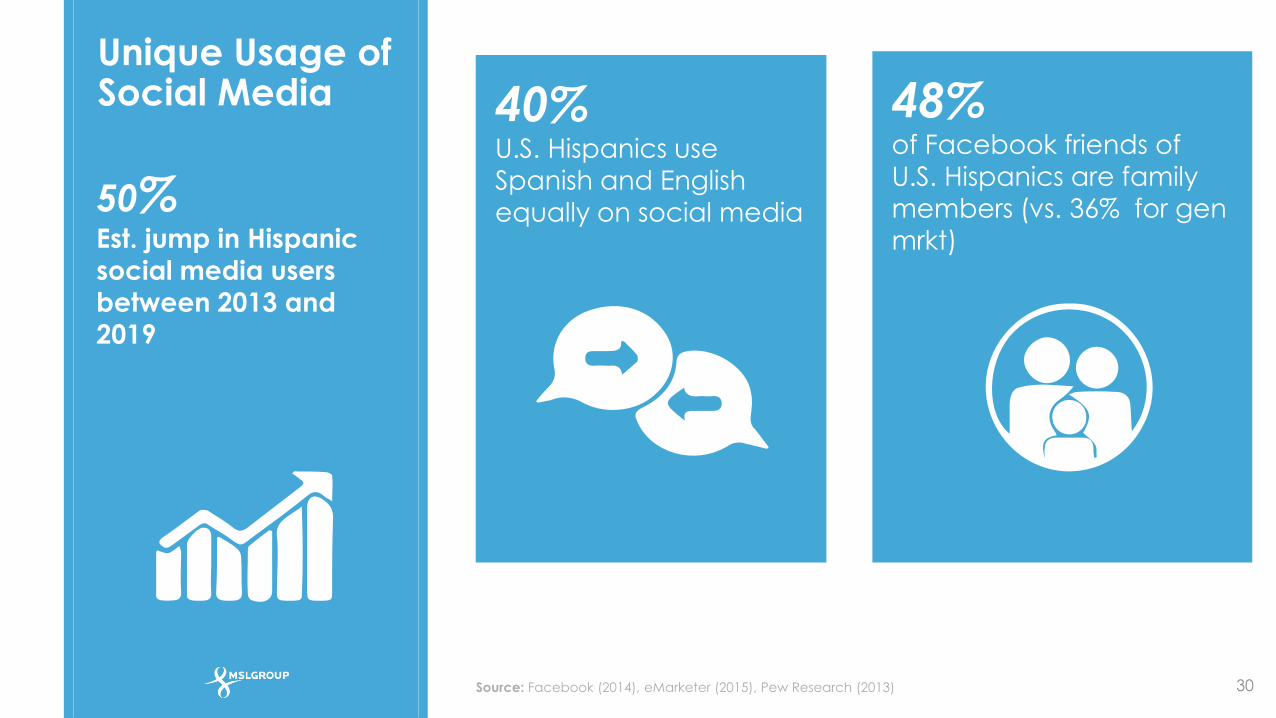
Unique Usage of Social Media
30
50%Est. jump in Hispanic social media users
between 2013 and
2019
40%U.S. Hispanics use
Spanish and English equally on social media
48%of Facebook friends of
U.S. Hispanics are family
members (vs. 36% for gen mrkt)
Source: Facebook (2014), eMarketer (2015), Pew Research (2013)
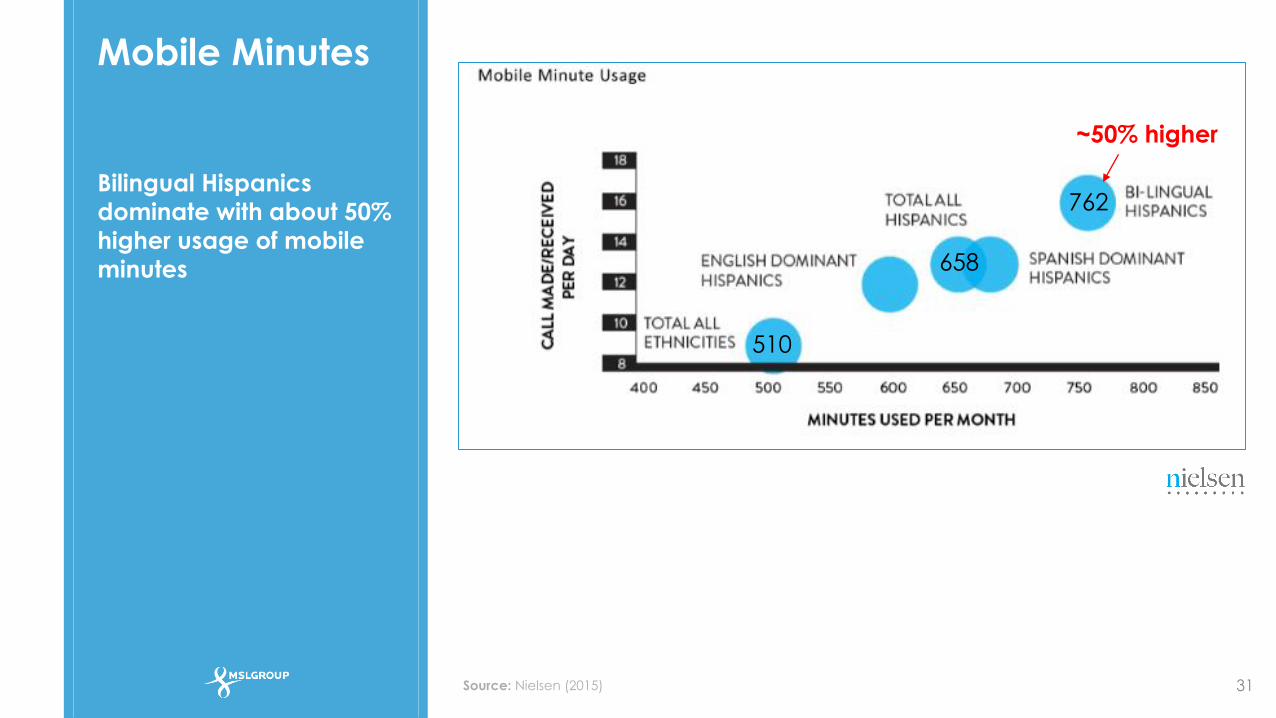
Mobile Minutes
31
Bilingual Hispanics
dominate with about 50%
higher usage of mobile
minutes
Source: Nielsen (2015)
658
510
~50% higher
762

Social Shopping
32
83%of USH who access the
Internet on a mobile
device use it while in-
store to inform a
purchase in real-time
- Google 2016
Source: Google (2016)

Unique Usage
33
34%of Hispanic internet users
use Instagram while 21%
favor Pinterest in contrast
to the general market
which is more likely to
use Pinterest (32%) vs
Instagram (21%)
66%
pay attention to online
ads, 20% points higher
than general population
Source: Google (2015), Pew Research (2014)
>

Closing Thoughts
34
Plan to act or
plan to miss the
opportunity
–
Regardless of age and country of
origin, the majority of Hispanics are
retaining their unique identity and
preserving their culture.

Avoid missed opportunities
35
We’ve been reaching
Hispanics for years. No need
to change strategy.
Likely unacculturated base
that is aging out and turning
over purchase decisions to
the next generation, which
behaves differently.
Past USH outreach did not net
a big impact.
Hispanics are just now
reaching critical mass in U.S.
Every 30 seconds, one
Hispanic turns 18 years old.
Most Hispanics speak
English anyways.
While true, communication
in-language and in-culture is
key to establishing a
relationship and trust.
Hard to maximize the full
potential of a culturally-
driven market segment with
a one-size-fits-all approach.
Embracing and respecting
USH distinctive purchase
behavior is key to unlocking
$1.5 trillion.
A total market strategy will
work. Product isn’t specific to
Hispanics.
Budgets can’t afford it.
Can’t afford to miss the
opportunity touted as the
most influential since the
baby boomers. Start regional
and think digital.