US Government Finance: Outlays and Receipts
25
US Government Finance: Outlays and Receipts Yardeni Research, Inc. March 10, 2022 Dr. Edward Yardeni 516-972-7683 [email protected] Mali Quintana 480-664-1333 [email protected] Please visit our sites at www.yardeni.com blog.yardeni.com thinking outside the box
Transcript of US Government Finance: Outlays and Receipts

US Government Finance:Outlays and Receipts
Yardeni Research, Inc.
March 10, 2022
Dr. Edward Yardeni516-972-7683
Mali Quintana480-664-1333
Please visit our sites atwww.yardeni.comblog.yardeni.com
thinking outside the box

Table Of Contents Table Of ContentsTable Of Contents
March 10, 2022 / US Government Finance: Outlays and Receipts www.yardeni.com
Yardeni Research, Inc.
US Federal Budget 1-4US Federal Outlays & Receipts 5-7US Federal Tax Receipts 8-10Federal Government Receipts 11US Federal Outlays 12-15US Treasury Social Benefits Deficit 16Custom Duties & Merchandise Imports 17Misc 18-22

86 87 88 89 90 91 92 93 94 95 96 97 98 99 00 01 02 03 04 05 06 07 08 09 10 11 12 13 14 15 16 17 18 19 20 21 22 23 24-5
-4
-3
-2
-1
0
1
2
-5
-4
-3
-2
-1
0
1
2
US FEDERAL GOVERNMENT BUDGET BALANCE(trillion dollars, 12-month sum)
Feb
Latest (-2.2)
Note: Shaded areas are recessions according to the National Bureau of Economic Research.Source: US Treasury Department.
yardeni.com
Figure 1.
86 87 88 89 90 91 92 93 94 95 96 97 98 99 00 01 02 03 04 05 06 07 08 09 10 11 12 13 14 15 16 17 18 19 20 21 22 23 24.7
1.5
2.3
3.1
3.9
4.7
5.5
6.3
7.17.98.7
.7
1.5
2.3
3.1
3.9
4.7
5.5
6.3
7.17.98.7
US FEDERAL GOVERNMENT OUTLAYS & RECEIPTS(trillion dollars, 12-month sum, ratio scale)
Feb
Feb
Outlays (6.6)Receipts (4.4)
Note: Shaded areas are recessions according to the National Bureau of Economic Research.Source: US Treasury Department.
yardeni.com
Figure 2.
US Federal Budget
Page 1 / March 10, 2022 / US Government Finance: Outlays and Receipts www.yardeni.com
Yardeni Research, Inc.

86 87 88 89 90 91 92 93 94 95 96 97 98 99 00 01 02 03 04 05 06 07 08 09 10 11 12 13 14 15 16 17 18 19 20 21 22 23 2440
50
60
70
80
90
100
110
120
130
140
40
50
60
70
80
90
100
110
120
130
140
US FEDERAL GOVERNMENT RECEIPTS(as a percent of total outlays*)
Feb
Note: Shaded areas are recessions according to the National Bureau of Economic Research.Source: US Treasury Department.
* 12-month sum.
yardeni.com
Figure 3.
86 87 88 89 90 91 92 93 94 95 96 97 98 99 00 01 02 03 04 05 06 07 08 09 10 11 12 13 14 15 16 17 18 19 20 21 22 23 24-20
-10
0
10
20
30
40
50
60
-20
-10
0
10
20
30
40
50
60
US FEDERAL GOVERNMENT DEFICIT(as a percent of federal outlays*)
Feb
Note: Shaded areas are recessions according to the National Bureau of Economic Research.* 12-month sum.
Source: US Treasury Department.
yardeni.com
Figure 4.
US Federal Budget
Page 2 / March 10, 2022 / US Government Finance: Outlays and Receipts www.yardeni.com
Yardeni Research, Inc.

86 87 88 89 90 91 92 93 94 95 96 97 98 99 00 01 02 03 04 05 06 07 08 09 10 11 12 13 14 15 16 17 18 19 20 21 22 23 24-5000
-4600
-4200
-3800
-3400
-3000
-2600
-2200
-1800
-1400
-1000
-600
-200
200
600
1000
1400
-5000
-4600
-4200
-3800
-3400
-3000
-2600
-2200
-1800
-1400
-1000
-600
-200
200
600
1000
1400 US FEDERAL GOVERNMENT BUDGET BALANCE(billion dollars, 12-month sum)
Feb
Feb
TotalTotal ExcludingNet Interest Paid
Note: Shaded areas are recessions according to the National Bureau of Economic Research.Source: US Treasury Department.
yardeni.com
Figure 5.
86 87 88 89 90 91 92 93 94 95 96 97 98 99 00 01 02 03 04 05 06 07 08 09 10 11 12 13 14 15 16 17 18 19 20 21 22 23 24100
200
300
400
100
200
300
400
US FEDERAL GOVERNMENT OUTLAYS: NET INTEREST PAID(billion dollars, 12-month sum)
Feb
Note: Shaded areas are recessions according to the National Bureau of Economic Research.Source: US Treasury Department.
yardeni.com
Figure 6.
US Federal Budget
Page 3 / March 10, 2022 / US Government Finance: Outlays and Receipts www.yardeni.com
Yardeni Research, Inc.
48 50 52 54 56 58 60 62 64 66 68 70 72 74 76 78 80 82 84 86 88 90 92 94 96 98 00 02 04 06 08 10 12 14 16 18 20 22 24 26-5
-3
-1
1
3
5
7
9
11
13
15
17
19
21
23
25
27
29
31
33
-5
-3
-1
1
3
5
7
9
11
13
15
17
19
21
23
25
27
29
31
33
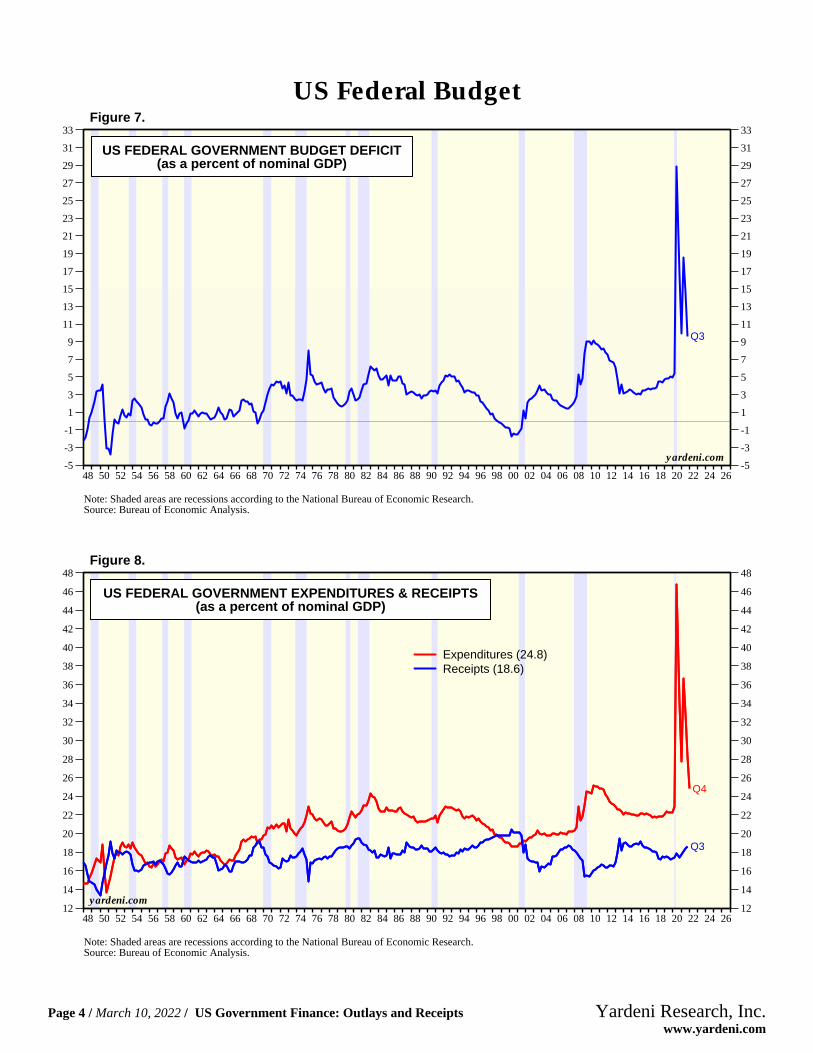
US FEDERAL GOVERNMENT BUDGET DEFICIT(as a percent of nominal GDP)
Q3
Note: Shaded areas are recessions according to the National Bureau of Economic Research.Source: Bureau of Economic Analysis.
yardeni.com
Figure 7.
48 50 52 54 56 58 60 62 64 66 68 70 72 74 76 78 80 82 84 86 88 90 92 94 96 98 00 02 04 06 08 10 12 14 16 18 20 22 24 2612
14
16
18
20
22
24
26
28
30
32
34
36
38
40
42
44
46
48
12
14
16
18
20
22
24
26
28
30
32
34
36
38
40
42
44
46
48
US FEDERAL GOVERNMENT EXPENDITURES & RECEIPTS(as a percent of nominal GDP)
Q4
Q3
Expenditures (24.8)Receipts (18.6)
Note: Shaded areas are recessions according to the National Bureau of Economic Research.Source: Bureau of Economic Analysis.
yardeni.com
Figure 8.
US Federal Budget
Page 4 / March 10, 2022 / US Government Finance: Outlays and Receipts www.yardeni.com
Yardeni Research, Inc.

48 50 52 54 56 58 60 62 64 66 68 70 72 74 76 78 80 82 84 86 88 90 92 94 96 98 00 02 04 06 08 10 12 14 16 18 20 22 24 2612
14
16
18
20
22
12
14
16
18
20
22
US FEDERAL GOVERNMENT RECEIPTS(as a percent of nominal GDP)
Q3
Average = 17.6
Latest (18.6)
Note: Shaded areas are recessions according to the National Bureau of Economic Research.Source: Bureau of Economic Analysis.
yardeni.com
Figure 9.
48 50 52 54 56 58 60 62 64 66 68 70 72 74 76 78 80 82 84 86 88 90 92 94 96 98 00 02 04 06 08 10 12 14 16 18 20 22 24 2612
14
16
18
20
22
24
26
28
30
32
34
36
38
40
42
44
46
48
12
14
16
18
20
22
24
26
28
30
32
34
36
38
40
42
44
46
48
US FEDERAL GOVERNMENT EXPENDITURES(as a percent of nominal GDP)
Q4
Expenditures (24.8)
Note: Shaded areas are recessions according to the National Bureau of Economic Research.Source: Bureau of Economic Analysis.
yardeni.com
Figure 10.
US Federal Outlays & Receipts
Page 5 / March 10, 2022 / US Government Finance: Outlays and Receipts www.yardeni.com
Yardeni Research, Inc.

54 56 58 60 62 64 66 68 70 72 74 76 78 80 82 84 86 88 90 92 94 96 98 00 02 04 06 08 10 12 14 16 18 20 22 24 26-6
-5
-4
-3
-2
-1
0
1
-6
-5
-4
-3
-2
-1
0
1
US FEDERAL GOVERNMENT BUDGET BALANCE(trillion dollars, inverted scale)
Feb
Q4
NIPA Basis Data(saar)
Treasury Data(12-month sum)
Note: Shaded areas are recessions according to the National Bureau of Economic Research.Source: US Treasury Department and Federal Reserve Board.
yardeni.com
Figure 11.
52 54 56 58 60 62 64 66 68 70 72 74 76 78 80 82 84 86 88 90 92 94 96 98 00 02 04 06 08 10 12 14 16 18 20 22 24 264
2
0
-2
-4
-6
-8
-10
-12
-14
-16
-18
-20
-22
-24
-26
-28
-30
-32
-34
4
2
0
-2
-4
-6
-8
-10
-12
-14
-16
-18
-20
-22
-24
-26
-28
-30
-32
-34
US FEDERAL GOVERNMENT BUDGET BALANCE NIPA BASIS (saar)(as a percent of nominal GDP, inverted scale)
Q4
Note: Shaded areas are recessions according to the National Bureau of Economic Research.Source: Bureau of Economic Analysis and Federal Reserve Board.
yardeni.com
Figure 12.
US Federal Outlays & Receipts
Page 6 / March 10, 2022 / US Government Finance: Outlays and Receipts www.yardeni.com
Yardeni Research, Inc.

95 96 97 98 99 00 01 02 03 04 05 06 07 08 09 10 11 12 13 14 15 16 17 18 19 20 21 22 23 24-10
-2
6
14
22
30
38
46
54
62
70
78
-10
-2
6
14
22
30
38
46
54
62
70
78
US FEDERAL GOVERNMENT OUTLAYS(yearly percent change in 12 month sum)
Feb
Note: Shaded areas are recessions according to the National Bureau of Economic Research.Source: US Treasury Department.
yardeni.com
Figure 13.
95 96 97 98 99 00 01 02 03 04 05 06 07 08 09 10 11 12 13 14 15 16 17 18 19 20 21 22 23 24-21-18-15-12-9-6-303691215182124273033363942454851
-21-18-15-12-9-6-30369
1215182124273033363942454851
US FEDERAL GOVERNMENT RECEIPTS(yearly percent change in 12 month sum)
Feb
Note: Shaded areas are recessions according to the National Bureau of Economic Research.Source: US Treasury Department.
yardeni.com
Figure 14.
US Federal Outlays & Receipts
Page 7 / March 10, 2022 / US Government Finance: Outlays and Receipts www.yardeni.com
Yardeni Research, Inc.

83 84 85 86 87 88 89 90 91 92 93 94 95 96 97 98 99 00 01 02 03 04 05 06 07 08 09 10 11 12 13 14 15 16 17 18 19 20 21 22 23 240
1
2
3
0
1
2
3
US FEDERAL GOVERNMENT RECEIPTS(trillion dollars, 12-month sum)
Feb
yardeni.com
US Federal Tax Receipts
Corporate (0.4)
Individual Income (2.3)Payroll* (1.4)
Note: Shaded areas are recessions according to the National Bureau of Economic Research.Source: US Treasury.
* Employment and general retirement, unemployment insurance, and other retirement.
Figure 15.
83 84 85 86 87 88 89 90 91 92 93 94 95 96 97 98 99 00 01 02 03 04 05 06 07 08 09 10 11 12 13 14 15 16 17 18 19 20 21 22 23 240
10
20
30
40
50
60
0
10
20
30
40
50
60
US FEDERAL GOVERNMENT RECEIPTS(as a percent of total receipts)
Feb
yardeni.com
US Federal Tax ReceiptsIndividual Income (52.4)Payroll* (30.7)Corporate (9.1)
Note: Shaded areas are recessions according to the National Bureau of Economic Research.Source: US Treasury Department.
* Employment and general retirement, unemployment insurance, and other retirement.
Figure 16.
US Federal Tax Receipts
Page 8 / March 10, 2022 / US Government Finance: Outlays and Receipts www.yardeni.com
Yardeni Research, Inc.

Figure 17.
84 85 86 87 88 89 90 91 92 93 94 95 96 97 98 99 00 01 02 03 04 05 06 07 08 09 10 11 12 13 14 15 16 17 18 19 20 21 22 23 24-40
-20
0
20
40
60
-40
-20
0
20
40
60
Feb
US FEDERAL GOVERNMENT RECEIPTS(yearly percent change in 12-month sum)
Individual IncomeTax Receipts
84 85 86 87 88 89 90 91 92 93 94 95 96 97 98 99 00 01 02 03 04 05 06 07 08 09 10 11 12 13 14 15 16 17 18 19 20 21 22 23 24-500
0
500
1000
1500
2000
-500
0
500
1000
1500
2000
Feb
Corporate IncomeTax Receipts
84 85 86 87 88 89 90 91 92 93 94 95 96 97 98 99 00 01 02 03 04 05 06 07 08 09 10 11 12 13 14 15 16 17 18 19 20 21 22 23 24-8
-4
0
4
8
12
16
20
24
-8
-4
0
4
8
12
16
20
24
Feb
yardeni.com
Social Insurance and Retirement Receipts
Note: Shaded areas are recessions according to the National Bureau of Economic Research.Source: US Treasury Department, Summary of Receipts by Source, and Outlays by Function of the US Government, Table 9.
US Federal Tax Receipts
Page 9 / March 10, 2022 / US Government Finance: Outlays and Receipts www.yardeni.com
Yardeni Research, Inc.

Figure 18.
90 91 92 93 94 95 96 97 98 99 00 01 02 03 04 05 06 07 08 09 10 11 12 13 14 15 16 17 18 19 20 21 22 23 24556065707580859095100105110115120125130135140
100012001400160018002000220024002600280030003200340036003800400042004400
US FEDERAL GOVERNMENT RECEIPTS vs LEADING INDICATORSFeb
JanFederal Receipts(billion dollars, 12-month sum)
Leading Indicators(2016=100)
90 91 92 93 94 95 96 97 98 99 00 01 02 03 04 05 06 07 08 09 10 11 12 13 14 15 16 17 18 19 20 21 22 23 24646770737679828588919497100103106109112115118
100012001400160018002000220024002600280030003200340036003800400042004400
US FEDERAL GOVERNMENT RECEIPTS vs COINCIDENT INDICATORSFeb
Jan
Federal Receipts(billion dollars, 12-month sum)
Coincident Indicators(2016=100)
yardeni.com
90 91 92 93 94 95 96 97 98 99 00 01 02 03 04 05 06 07 08 09 10 11 12 13 14 15 16 17 18 19 20 21 22 23 2455
60
65
70
75
80
85
90
95
100
105
110
115
120
125
130
100012001400160018002000220024002600280030003200340036003800400042004400
US FEDERAL GOVERNMENT RECEIPTS vs LAGGING INDICATORSFeb
JanFederal Receipts(billion dollars, 12-month sum)
Lagging Indicators(2016=100)
Note: Shaded areas are recessions according to the National Bureau of Economic Research.Source: US Treasury Department and The Conference Board.
yardeni.com
US Federal Tax Receipts
Page 10 / March 10, 2022 / US Government Finance: Outlays and Receipts www.yardeni.com
Yardeni Research, Inc.

92 93 94 95 96 97 98 99 00 01 02 03 04 05 06 07 08 09 10 11 12 13 14 15 16 17 18 19 20 21 22 23 2420
30
40
50
60
70
80
20
30
40
50
60
70
80
GROSS FEDERAL RECEIPTS: TOTAL UNEMPLOYMENT INSURANCE(billion dollars, 12-month sum)
Feb
Note: Shaded areas are recessions according to the National Bureau of Economic Research.Source: US Treasury.
yardeni.com
Figure 19.
92 93 94 95 96 97 98 99 00 01 02 03 04 05 06 07 08 09 10 11 12 13 14 15 16 17 18 19 20 21 22 23 240
20
40
60
80
100
0
20
40
60
80
100
GROSS FEDERAL RECEIPTS: CUSTOM DUTIES(billion dollars, 12-month sum)
Feb
Note: Shaded areas are recessions according to the National Bureau of Economic Research.Source: US Treasury.
yardeni.com
Figure 20.
Federal Government Receipts
Page 11 / March 10, 2022 / US Government Finance: Outlays and Receipts www.yardeni.com
Yardeni Research, Inc.

87 88 89 90 91 92 93 94 95 96 97 98 99 00 01 02 03 04 05 06 07 08 09 10 11 12 13 14 15 16 17 18 19 20 21 22 23 24.4
1.2
2.0
2.8
3.6
4.4
5.2
6.06.87.68.4
.4
1.2
2.0
2.8
3.6
4.4
5.2
6.06.87.68.4
US FEDERAL GOVERNMENT OUTLAYS(trillion dollars, 12-month sum, ratio scale) Feb
Total (6.6)Health, Medicare,Income Security, Social Security (4.2)
Note: Shaded areas are recessions according to the National Bureau of Economic Research.Source: US Treasury Department.
yardeni.com
Figure 21.
87 88 89 90 91 92 93 94 95 96 97 98 99 00 01 02 03 04 05 06 07 08 09 10 11 12 13 14 15 16 17 18 19 20 21 22 23 2440
50
60
70
80
40
50
60
70
80
US FEDERAL GOVERNMENT OUTLAYS: SOCIAL WELFARE PROGRAMS(as a percent of total outlays)
FebHealth, Medicare,Income Security, Social Security
Note: Shaded areas are recessions according to the National Bureau of Economic Research.Source: US Treasury Department.
yardeni.com
Figure 22.
US Federal Outlays
Page 12 / March 10, 2022 / US Government Finance: Outlays and Receipts www.yardeni.com
Yardeni Research, Inc.

87 88 89 90 91 92 93 94 95 96 97 98 99 00 01 02 03 04 05 06 07 08 09 10 11 12 13 14 15 16 17 18 19 20 21 22 23 2430
290
550
810
1070
1330159018502110
30
290
550
810
1070
1330159018502110
US FEDERAL GOVERNMENT OUTLAYS(billion dollars, 12 month sum, ratio scale)
Feb
HealthMedicareIncome SecuritySocial SecurityNational Defense
Note: Shaded areas are recessions according to the National Bureau of Economic Research.Source: US Treasury Department.
yardeni.com
Figure 23.
87 88 89 90 91 92 93 94 95 96 97 98 99 00 01 02 03 04 05 06 07 08 09 10 11 12 13 14 15 16 17 18 19 20 21 22 23 243
8
13
18
23
28
33
38
43
3
8
13
18
23
28
33
38
43
US FEDERAL GOVERNMENT OUTLAYS(as percent of total outlays)
Feb
HealthMedicareIncome SecuritySocial SecurityNational Defense
Note: Shaded areas are recessions according to the National Bureau of Economic Research.Source: US Treasury Department.
yardeni.com
Figure 24.
US Federal Outlays
Page 13 / March 10, 2022 / US Government Finance: Outlays and Receipts www.yardeni.com
Yardeni Research, Inc.

87 88 89 90 91 92 93 94 95 96 97 98 99 00 01 02 03 04 05 06 07 08 09 10 11 12 13 14 15 16 17 18 19 20 21 22 23 24110
370
630
890
1150
1410
167019302190245027102970
110
370
630
890
1150
1410
167019302190245027102970
US FEDERAL GOVERNMENT OUTLAYS(billion dollars, 12-month sum, ratio scale)
Feb
Medicare + Social Security (1860.0)Income Security + Health (2348.2)National Defense (755.3)
Note: Shaded areas are recessions according to the National Bureau of Economic Research.Source: US Treasury.
yardeni.com
Figure 25.
87 88 89 90 91 92 93 94 95 96 97 98 99 00 01 02 03 04 05 06 07 08 09 10 11 12 13 14 15 16 17 18 19 20 21 22 23 245
10
15
20
25
30
35
40
45
5
10
15
20
25
30
35
40
45
US FEDERAL GOVERNMENT OUTLAYS(as a percent of total outlays)
FebMedicare + Social SecurityIncome Security + HealthNational Defense
Note: Shaded areas are recessions according to the National Bureau of Economic Research.Source: US Treasury.
yardeni.com
Figure 26.
US Federal Outlays
Page 14 / March 10, 2022 / US Government Finance: Outlays and Receipts www.yardeni.com
Yardeni Research, Inc.

87 88 89 90 91 92 93 94 95 96 97 98 99 00 01 02 03 04 05 06 07 08 09 10 11 12 13 14 15 16 17 18 19 20 21 22 23 24.4
.8
1.2
1.6
2.0
2.4
2.8
3.2
3.6
4.0
.4
.8
1.2
1.6
2.0
2.4
2.8
3.2
3.6
4.0
Feb
US FEDERAL GOVERNMENT OUTLAYS(trillion dollars, ratio scale)
Q4
Federal OutlaysTotal in Nominal GDP(saar) (1.6)Total Ex-Entitlements*(12-month sum) (2.4)
Note: Shaded areas are recessions according to the National Bureau of Economic Research.* Total excluding Health, Medicare, Income Security, and Social Security.
Source: US Treasury Department and Bureau of Economic Analysis.
yardeni.com
Figure 27.
87 88 89 90 91 92 93 94 95 96 97 98 99 00 01 02 03 04 05 06 07 08 09 10 11 12 13 14 15 16 17 18 19 20 21 22 23 24.4
1.2
2.0
2.8
3.6
4.4
5.2
6.06.87.68.49.2
.4
1.2
2.0
2.8
3.6
4.4
5.2
6.06.87.68.49.2
US FEDERAL GOVERNMENT OUTLAYS(trillion dollars, ratio scale) Feb
Q4
Total(12-month sum) (6.6)Federal Government Spending in GDP(saar) (1.6)
Note: Shaded areas are recessions according to the National Bureau of Economic Research.Source: US Treasury Department and Bureau of Economic Analysis.
yardeni.com
Figure 28.
US Federal Outlays
Page 15 / March 10, 2022 / US Government Finance: Outlays and Receipts www.yardeni.com
Yardeni Research, Inc.

87 88 89 90 91 92 93 94 95 96 97 98 99 00 01 02 03 04 05 06 07 08 09 10 11 12 13 14 15 16 17 18 19 20 21 22 23 24250
450
650
850
1050
1250
1450
1650
1850
2050
250
450
650
850
1050
1250
1450
1650
1850
2050
US FEDERAL GOVERNMENT SOCIAL BENEFITS RECEIPTS & OUTLAYS(billion dollars, 12-month sum, ratio scale)
Feb
Feb
yardeni.com
Social Insurance andRetirement Receipts
Social Security andMedicare Payments
Note: Shaded areas are recessions according to the National Bureau of Economic Research.Source: US Treasury Department.
Figure 29.
87 88 89 90 91 92 93 94 95 96 97 98 99 00 01 02 03 04 05 06 07 08 09 10 11 12 13 14 15 16 17 18 19 20 21 22 23 24-100
0
100
200
300
400
500
600
700
800
-100
0
100
200
300
400
500
600
700
800
US FEDERAL GOVERNMENT SOCIAL BENEFITS DEFICIT*(billion dollars, 12-month sum)
Feb
Note: Shaded areas are recessions according to the National Bureau of Economic Research.Source: US Treasury Department, Summary of Receipts by Source, and Outlays by Function of the US Government, Table 9.
* Social Security and Medicare payments less social insurance and retirement receipts.
yardeni.com
Figure 30.
US Treasury Social Benefits Deficit
Page 16 / March 10, 2022 / US Government Finance: Outlays and Receipts www.yardeni.com
Yardeni Research, Inc.

92 93 94 95 96 97 98 99 00 01 02 03 04 05 06 07 08 09 10 11 12 13 14 15 16 17 18 19 20 21 22 23 240
1000
2000
3000
4000
0
20
40
60
80
100
US GROSS FEDERAL RECEIPTS: CUSTOM DUTIES & MERCHANDISE IMPORTS(billion dollars)
Feb
Jan
Merchandise Imports(saar)
Custom Duties(12-month sum)
Note: Shaded areas are recessions according to the National Bureau of Economic Research.Source: US Treasury and US Bureau of the Census.
yardeni.com
Figure 31.
Custom Duties & Merchandise Imports
Page 17 / March 10, 2022 / US Government Finance: Outlays and Receipts www.yardeni.com
Yardeni Research, Inc.

87 88 89 90 91 92 93 94 95 96 97 98 99 00 01 02 03 04 05 06 07 08 09 10 11 12 13 14 15 16 17 18 19 20 21 22 23 24100
560
1020
1480
1940
2400
28603320
100
560
1020
1480
1940
2400
28603320
US FEDERAL GOVERNMENT OUTLAYS(billion dollars, 12 month sum, ratio scale)
Mar
Social Security (1117.0)Health + Medicare (1624.5)Income Security (1977.9)National Defense (741.8)
Note: Shaded areas are recessions according to the National Bureau of Economic Research.Source: US Treasury Department.
yardeni.com
Figure 32.
87 88 89 90 91 92 93 94 95 96 97 98 99 00 01 02 03 04 05 06 07 08 09 10 11 12 13 14 15 16 17 18 19 20 21 22 23 24.4
1.2
2.0
2.8
3.6
4.4
5.2
6.06.87.68.49.2
.4
1.2
2.0
2.8
3.6
4.4
5.2
6.06.87.68.49.2
US FEDERAL GOVERNMENT OUTLAYS(trillion dollars, ratio scale) Feb
Q4
Total(12-month sum) (6.6)Federal Government Spending in GDP(saar) (1.6)
Note: Shaded areas are recessions according to the National Bureau of Economic Research.Source: US Treasury Department and Bureau of Economic Analysis.
yardeni.com
Figure 33.
Misc
Page 18 / March 10, 2022 / US Government Finance: Outlays and Receipts www.yardeni.com
Yardeni Research, Inc.

87 88 89 90 91 92 93 94 95 96 97 98 99 00 01 02 03 04 05 06 07 08 09 10 11 12 13 14 15 16 17 18 19 20 21 22 23 2450
55
60
65
70
75
80
85
50
55
60
65
70
75
80
85
US FEDERAL GOVERNMENT OUTLAYS ON REDISTRIBUTING INCOME*(as a percent of total federal government outlays)
Q4
* Total federal government outlays minus federal government outlays on goods and services in nominal GDP as a percent of the total.Note: Shaded areas are recessions according to the National Bureau of Economic Research.Source: US Treasury Department and Bureau of Economic Analysis.
yardeni.com
Figure 34.
86 87 88 89 90 91 92 93 94 95 96 97 98 99 00 01 02 03 04 05 06 07 08 09 10 11 12 13 14 15 16 17 18 19 20 21 22 23 240
2
4
6
8
10
12
0
2
4
6
8
10
12
US FEDERAL GOVERNMENT NET INTEREST PAIDDIVIDED BY MARKETABLE* TREASURY DEBT OUTSTANDING
(percent)
FebFeb
US Federal GovernmentNet Interest Paid /Divided by MarketableTreasury Debt Outstanding (1.8)Two-YearTreasury Yield (1.4)
* Marketable interest-bearing bills, notes and bonds.Note: Shaded areas are recessions according to the National Bureau of Economic Research.Source: US Treasury Department.
yardeni.com
Figure 35.
Misc
Page 19 / March 10, 2022 / US Government Finance: Outlays and Receipts www.yardeni.com
Yardeni Research, Inc.

68 70 72 74 76 78 80 82 84 86 88 90 92 94 96 98 00 02 04 06 08 10 12 14 16 18 20 22 24 26 28 30 32 34 36-4
-3
-2
-1
0
1
-4
-3
-2
-1
0
1
US FEDERAL GOVERNMENT BUDGET BALANCE: CBO OUTLOOK(trillion dollars, fiscal years)
2031
Actual (-3.1)
Projected by CBO2021-2031 (-1.9)
Source: Congressional Budget Office.
yardeni.com
Figure 36.
19401945
19501955
19601965
19701975
19801985
19901995
20002005
20102015
20202025
20302035
2040
20
40
60
80
100
120
20
40
60
80
100
120
DEBT HELD BY THE PUBLIC: CBO OUTLOOK(as a percent of nominal GDP, fiscal years)
2031
Actual (100.1)
Projected by CBO2021-2031 (106.4)
Source: Congressional Budget Office.
yardeni.com
Figure 37.
Misc
Page 20 / March 10, 2022 / US Government Finance: Outlays and Receipts www.yardeni.com
Yardeni Research, Inc.

Jan Feb Mar Apr May Jun Jul Aug Sep Oct Nov Dec2021
0
100
200
300
400
0
100
200
300
400US FEDERAL GOVERNMENT RECEIPTS:INDIVIDUAL INCOME TAXES(billion dollars, nsa)
Values shown are prior years’ monthscomparable to latest year’s month Feb. 2022
2021 (149.3)2020 (125.8)2019 (69.6)
Source: US Department of Energy and Haver Analytics.
yardeni.com
Figure 38.
Jan Feb Mar Apr May Jun Jul Aug Sep Oct Nov Dec2021
60
80
100
120
140
160
60
80
100
120
140
160US FEDERAL GOVERNMENT RECEIPTS:PAYROLL TAXES*(billion dollars, nsa)
Values shown are prior years’ monthscomparable to latest year’s month Feb. 2022
2021 (108.2)2020 (99.4)2019 (99.9)
* Employment and general retirement, unemployment insurance, and other retirement.Source: US Treasury Department.
yardeni.com
Figure 39.
Misc
Page 21 / March 10, 2022 / US Government Finance: Outlays and Receipts www.yardeni.com
Yardeni Research, Inc.

Jan Feb Mar Apr May Jun Jul Aug Sep Oct Nov Dec2021
-20
0
20
40
60
80
100
-20
0
20
40
60
80
100US FEDERAL GOVERNMENT RECEIPTS:CORPORATE INCOME TAXES(billion dollars)
Values shown are prior years’ monthscomparable to latest year’s month Feb. 2022
2021 (4.8)2020 (3.8)2019 (-2.0)
* Employment and general retirement, unemployment insurance, and other retirement.Source: US Treasury Department.
yardeni.com
Figure 40.
Misc
Page 22 / March 10, 2022 / US Government Finance: Outlays and Receipts www.yardeni.com
Yardeni Research, Inc.

http://blog.yardeni.com
http://blog.yardeni.com
Copyright (c) Yardeni Research, Inc. 2022. All rights reserved. The informationcontained herein has been obtained from sources believed to be reliable, but is notnecessarily complete and its accuracy cannot be guaranteed. No representation orwarranty, express or implied, is made as to the fairness, accuracy, completeness, orcorrectness of the information and opinions contained herein. The views and the otherinformation provided are subject to change without notice. All reports and podcasts posted onwww.yardeni.com, blog.yardeni.com, and YRI’s Apps are issuedwithout regard to the specific investment objectives, financial situation, or particular needsof any specific recipient and are not to be construed as a solicitation or an offer to buy or sellany securities or related financial instruments. Past performance is not necessarily a guideto future results. Company fundamentals and earnings may be mentioned occasionally, butshould not be construed as a recommendation to buy, sell, or hold the company’s stock.Predictions, forecasts, and estimates for any and all markets should not be construed asrecommendations to buy, sell, or hold any security--including mutual funds, futurescontracts, and exchange traded funds, or any similar instruments.
The text, images, and other materials contained or displayed on any Yardeni Research, Inc.product, service, report, email or website are proprietary to Yardeni Research, Inc. andconstitute valuable intellectual property. No material from any part of www.yardeni.com, blog.yardeni.com, and YRI’s Apps may be downloaded, transmitted,broadcast, transferred, assigned, reproduced or in any other way used or otherwisedisseminated in any form to any person or entity, without the explicit written consent ofYardeni Research, Inc. All unauthorized reproduction or other use of material from YardeniResearch, Inc. shall be deemed willful infringement(s) of this copyright and other proprietaryand intellectual property rights, including but not limited to, rights of privacy. YardeniResearch, Inc. expressly reserves all rights in connection with its intellectual property,including without limitation the right to block the transfer of its products and services and/orto track usage thereof, through electronic tracking technology, and all other lawful means,now known or hereafter devised. Yardeni Research, Inc. reserves the right, without furthernotice, to pursue to the fullest extent allowed by the law any and all criminal and civilremedies for the violation of its rights.
The recipient should check any email and any attachments for the presence of viruses.Yardeni Research, Inc. accepts no liability for any damage caused by any virus transmittedby this company’s emails, website, blog and Apps. Additional information available onrequest.