U.S. Global Investors May 2010 10-285 16 1-Year 3-Year CAGR** U.S. Global Investors (GROW) 15% 19%...
53
www.usfunds.com 1.800.US.FUNDS U.S. Global Investors Searching for Opportunities, Managing Risk May 7, 2010 10-285 Frank E. Holmes CEO and Chief Investment Officer Susan McGee President and General Counsel Catherine Rademacher CFO Terry Badger Director of Communications GROW Earnings 3Q10
Transcript of U.S. Global Investors May 2010 10-285 16 1-Year 3-Year CAGR** U.S. Global Investors (GROW) 15% 19%...

www.usfunds.com 1.800.US.FUNDS
U.S. Global Investors Searching for Opportunities, Managing Risk
May 7, 2010 10-285
Frank E. Holmes CEO and Chief Investment Officer
Susan McGee President and General Counsel
Catherine Rademacher CFO
Terry Badger Director of Communications
GROW Earnings 3Q10

www.usfunds.com May 2010 10-285 2
Today’s Presenters
Frank Holmes Susan McGee Catherine Rademacher Terry Badger

www.usfunds.com May 2010 10-285 3
Forward-Looking Statements During this webcast we may make forward-looking statements about our relative business outlook. Any forward-looking statements and all other statements made during this webcast that don’t pertain to historical facts are subject to risks and uncertainties that may materially affect actual results. Please refer to our press release and the corresponding Form 10-Q filing for more detail on factors that could cause actual results to differ materially from any described today in forward-looking statements. Any such statements are made as of today, and U.S. Global Investors accepts no obligation to update them in the future.

www.usfunds.com May 2010 10-285 4
GROW Strengths
GROW is debt-free and has a strong balance sheet
No toxic derivatives in funds Monthly dividend program

www.usfunds.com May 2010 10-285 5
2009 2010
Revenue $5.0M $9.4M
Net Income $0.3M $1.5M
EPS (diluted) $0.02 $0.10
Quarter ended March 31*
Financial Snapshots
* unaudited
YoY Quarters

www.usfunds.com May 2010 10-285 6
December 31, 2009 March 31, 2010
Revenue $9.0M $9.3M
Net Income $1.5M $1.5M
EPS (diluted) $0.10 $0.10
Quarter ended*
Financial Snapshots
Sequential Quarters
* unaudited

www.usfunds.com May 2010 10-285 7
2009 2010
Revenue $16.7M $26.4M
Net Income (loss) ($3.2M) $4.4M
EPS (diluted) ($0.21) $0.29
Nine months ended March 31
Financial Snapshots
Fiscal Year to Date
* unaudited

www.usfunds.com May 2010 10-285
Mutual Fund Money Flows – Money Market Funds to Equity and Bond Market Funds
8

www.usfunds.com May 2010 10-285
Mutual Fund Money Flows – Bonds Capture Most New Money
9

www.usfunds.com May 2010 10-285 10
Calendar 1Q09 vs. 1Q10
U.S. Global Investors (GROW) 38%
Industry Peers* 38%
* Latest quarterly results filed by Affiliated Managers, BlackRock, Calamos Asset Mgmt, Cohen & Steers, Federated Investors, Franklin Resources, Invesco, Janus Capital Group,T. Rowe Price, Waddell & Reed, Pzena Investment Mgmt and Alliance Bernstein.
AUM Growth

www.usfunds.com May 2010 10-285 11
Assets Under Management
(Quarterly Average in billions)

www.usfunds.com May 2010 10-285
Money Flows to 4 and 5 Star
12

www.usfunds.com May 2010 10-285
World Precious Minerals Fund
Gross expense ratio as stated in the most recent prospectus. Capped expense ratio is a voluntary limit on total fund operating expenses (exclusive of any acquired fund fees and expenses, performance fees, taxes, brokerage commissions and interest) that U.S. Global Investors, Inc. can modify or terminate at any time. Performance data quoted above is historical. Past performance is no guarantee of future results. Results reflect the reinvestment of dividends and other earnings. Current performance may be higher or lower than the performance data quoted. The principal value and investment return of an investment will fluctuate so that your shares, when redeemed, may be worth more or less than their original cost. Performance does not include the effect of any direct fees described in the fund’s prospectus (e.g., short-term trading fees of 0.50%) which, if applicable, would lower your total returns. Obtain performance data current to the most recent month-end at www.usfunds.com or 1-800-US-FUNDS. High double-digit returns are attributable, in part, to unusually favorable market conditions and may not be repeated or consistently achieved in the future.
13
One-Year Five-Year Ten-Year Gross
Expense Ratio
Capped Expense
Ratio
World Precious Minerals Fund (UNWPX) 65.24% 17.37% 20.25% 1.74% 1.90%
SPDR Gold Trust (GLD) 20.68% 20.52% n/a 0.40%
Annualized Returns as of 3/31/2010

www.usfunds.com May 2010 10-285
World Precious Minerals Fund
The World Precious Minerals Fund is an actively managed fund that focuses on junior and intermediate precious metals exploration companies around the world. The SPDR Gold Trust ETF is a passively managed fund that seeks to replicate as closely as possible, before fees and expenses, the performance of the price of gold. The World Precious Minerals Fund can be purchased or sold at a net asset value (NAV) determined at the end of each trading day. The SPDR Gold Trust ETF can be purchased or sold intraday. These purchases and redemptions may generate brokerage commissions and other charges not reflected in the ETF’s published expense ratio. Loss of money is a risk of investing in both the World Precious Minerals Fund and the SPDR Gold Trust ETF. Shares of both the World Precious Minerals Fund and the SPDR Gold Trust ETF are subject to sudden fluctuations in value. The SPDR Gold Trust ETF may also be subject to bid-ask premiums or discounts to net asset value (NAV) that could adversely affect a shareholder’s actual returns. The World Precious Minerals Fund intends to make distributions that may be taxed as ordinary income or capital gains. Under current federal law, long-term capital gains for individual investors in the fund are taxed at a maximum rate of 15%. Long-term capital gains recognized by individual investors in the SPDR Gold Trust ETF are treated as gains recognized on the sale of collectibles, which under current federal law are taxed at a maximum rate of 28%.
Gold, precious metals, and precious minerals funds may be susceptible to adverse economic, political or regulatory developments due to concentrating in a single theme. The prices of gold, precious metals, and precious minerals are subject to substantial price fluctuations over short periods of time and may be affected by unpredicted international monetary and political policies. We suggest investing no more than 5% to 10% of your portfolio in these sectors. .
14

www.usfunds.com May 2010 10-285 15
EPS U.S. Global Investors
(GROW) 400%
Industry Peers* 177%
* Latest quarterly results filed by Affiliated Managers, BlackRock, Calamos Asset Mgmt, Cohen & Steers, Federated Investors, Franklin Resources, Invesco, Janus Capital Group,T. Rowe Price, Waddell & Reed, Pzena Investment Mgmt and Alliance Bernstein.
Earnings
Calendar 1Q09 vs. 1Q10

www.usfunds.com May 2010 10-285 16
1-Year 3-Year CAGR**
U.S. Global Investors (GROW) 15% 19%
Industry Peers* 7% 13%
* Latest quarterly results filed by Affiliated Managers, BlackRock, Calamos Asset Mgmt, Cohen & Steers, Federated Investors, Franklin Resources, Invesco, Janus Capital Group,T. Rowe Price, Waddell & Reed, Pzena Investment Mgmt and Alliance Bernstein.
** Compounded Annual Growth Rate Trailing twelve months, quarter ending March 31, 2010
Source: Bloomberg
Return on Equity

www.usfunds.com May 2010 10-285 17
LT debt to total capital (average)
GROW 0%
Industry Peers* 27%
Major Banks** 67%
* Latest quarterly results filed by Affiliated Managers, Alliance Bernstein, BlackRock, Calamos Asset Mgmt, Cohen & Steers, Federated Investors, Franklin Resources, Invesco, Janus Capital Group, Legg Mason, Pzena Investment Mgmt, T. Rowe Price and Waddell & Reed.
** Latest quarterly results filed by: Bank of America, Citigroup, JP Morgan, Wells Fargo, U.S. Bancorp, Morgan Stanley, Goldman Sachs.
Source: Baseline, latest available figures
Leverage for Financials

www.usfunds.com May 2010 10-285
Independent Asset Managers Like “GROW” are Growing Faster
18

www.usfunds.com May 2010 10-285
Opportunities – Emerging Markets to Hedge Funds
19

www.usfunds.com May 2010 10-285
Opportunities – Pools of Assets and Profit Margins
20

www.usfunds.com May 2010 10-285 21
Significant Events:
Institutional Share Class
GROW Dividends

www.usfunds.com May 2010 10-285
#1 Gold Fund
The World Precious Minerals Fund was first in total return among all U.S. gold-oriented mutual funds and exchange-traded funds for the year ended December 31, 2009.
The fund was ranked #1 of 71, #34 of 51 and #18 of 29 among gold-oriented funds by Lipper for the 1-, 5- and 10-year periods ended December 31, 2009. The fund was ranked #3 of 74, #35 of 52 and #19 of 31 among gold-oriented funds by Lipper for the 1-, 5- and 10-year periods ended March 31, 2010.
22

www.usfunds.com May 2010 10-285
Marketing Strategy – Building Relationships
23

www.usfunds.com May 2010 10-285
Future Potential
24

www.usfunds.com May 2010 10-285
Income Statement
25

www.usfunds.com May 2010 10-285
Income Statement
26

www.usfunds.com May 2010 10-285
Income Statement
27

www.usfunds.com May 2010 10-285
Balance Sheets
28

www.usfunds.com May 2010 10-285
Balance Sheets
29

www.usfunds.com May 2010 10-285
Global Inventory Rebuild
30

www.usfunds.com May 2010 10-285
Less Debt in Emerging Economies
31

www.usfunds.com May 2010 10-285
Emerging Nations Better Credit Risk
32

www.usfunds.com May 2010 10-285
UBS – Growth Opportunities in Emerging Countries
33

www.usfunds.com May 2010 10-285
Building the Future
34
China
www.usfunds.com May 2010 10-285
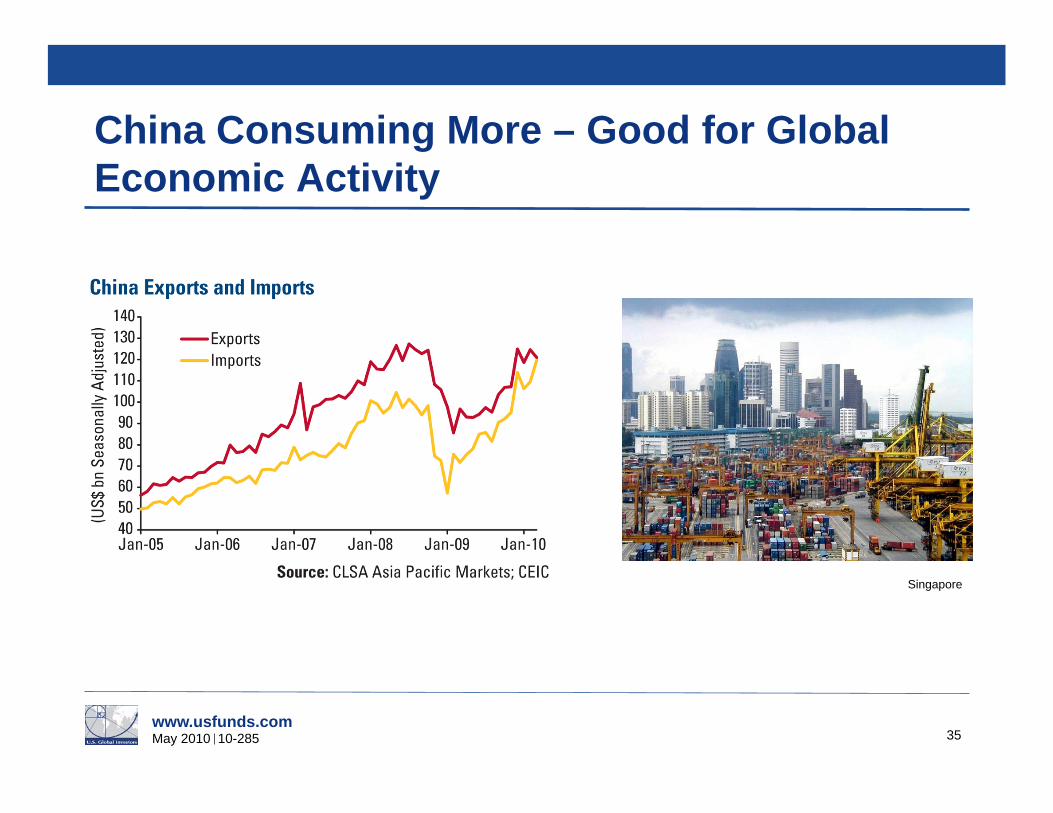
China Consuming More – Good for Global Economic Activity
35
Singapore

www.usfunds.com May 2010 10-285
Car Sales Speeding Ahead
36
Shenyang, China Source: AP Photo

www.usfunds.com May 2010 10-285
China’s Car Market
37
BYD (Build Your Dreams) president Wang Chuanfu sits inside the BYD E6 Electric Car during the North American International Auto Show in Detroit, Michigan January 12, 2009. Source: REUTERS/Mark Blinch
www.usfunds.com May 2010 10-285
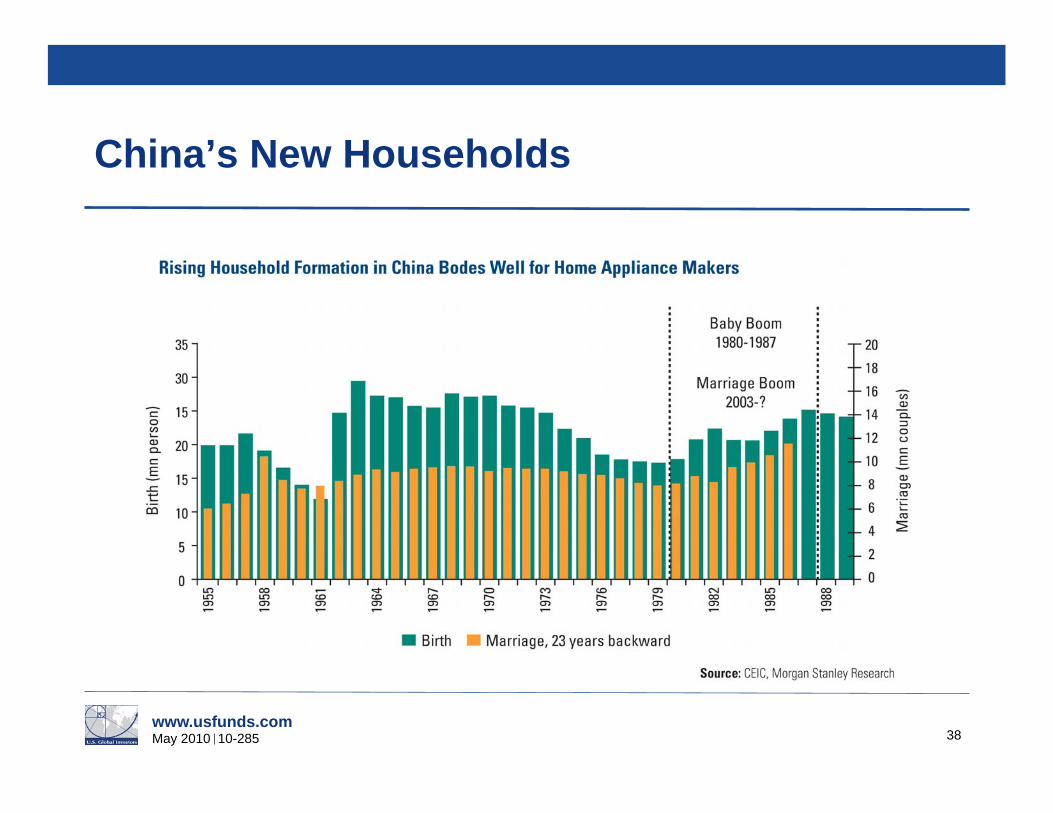
China’s New Households
38

www.usfunds.com May 2010 10-285
China and Commodities
39

www.usfunds.com May 2010 10-285
China Inventory Rebuild – No Bubble in Steel
40

www.usfunds.com May 2010 10-285
Luxury Demand Across China
41
Cartier Store in Shanghai Source: Getty

www.usfunds.com May 2010 10-285
China – Robust Gold Consumption
42

www.usfunds.com May 2010 10-285
Super Debt Cycle Bubble – Makes Gold an Attractive Monetary Asset
43
www.usfunds.com May 2010 10-285
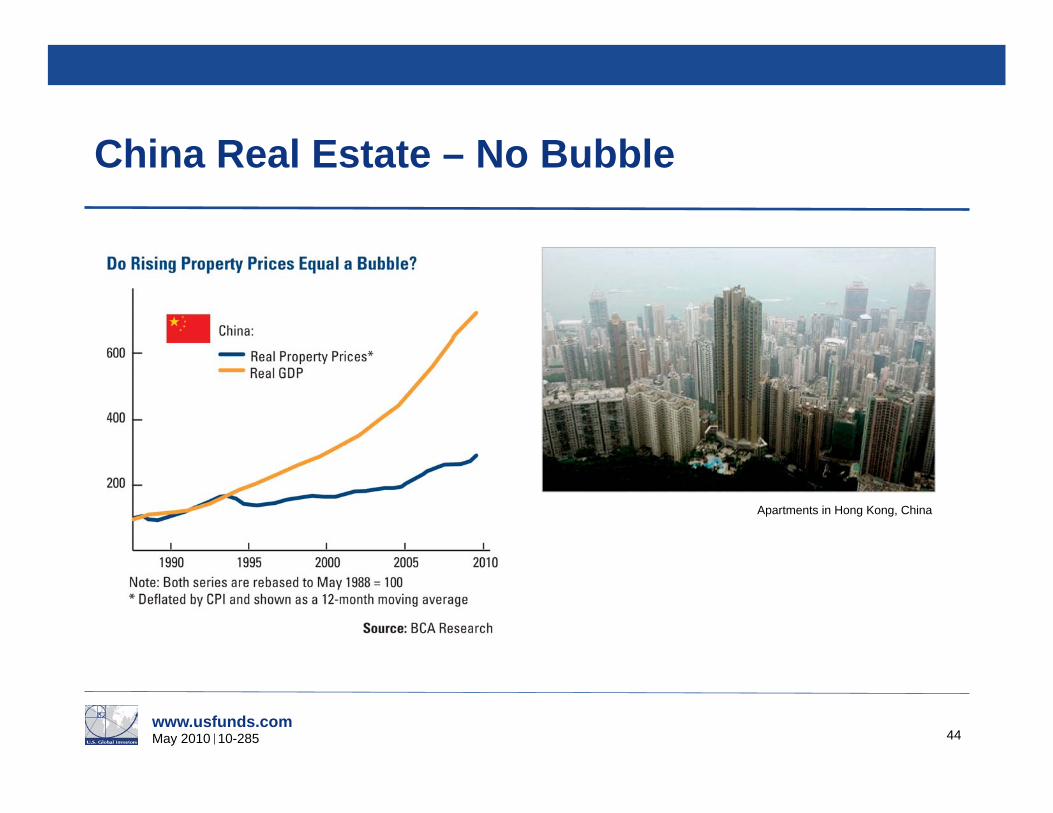
China Real Estate – No Bubble
44
Apartments in Hong Kong, China

www.usfunds.com May 2010 10-285
China Real Estate – No Bubble in Debt
45

www.usfunds.com May 2010 10-285
China Real Estate – No Bubble in Inventory of Homes for Sale
46
Apartments in Shanghai, China

www.usfunds.com May 2010 10-285
China Real Estate – No Bubble, Just a Classic Short Term Correction
47

www.usfunds.com May 2010 10-285
Intellectual Capital
48
Parliament Building and Chain Bridge across the Danube, Budapest, Hungary

www.usfunds.com May 2010 10-285
Follow the Greenback – Drives U.S. Exports
49

www.usfunds.com May 2010 10-285
GROW Stock Performance
50
$

www.usfunds.com May 2010 10-285 51
Disclosures
Please consider carefully a fund’s investment objectives, risks, charges and expenses. For this and other important information, obtain a fund prospectus by visiting www.usfunds.com or by calling 1-800-US-FUNDS (1-800-873-8637). Read it carefully before investing. Distributed by U.S. Global Brokerage, Inc.
Foreign and emerging market investing involves special risks such as currency fluctuation and less public disclosure, as well as economic and political risk. Because the Global Resources Fund concentrates its investments in a specific industry, the fund may be subject to greater risks and fluctuations than a portfolio representing a broader range of industries. All opinions expressed and data provided are subject to change without notice. Some of these opinions may not be appropriate to every investor.
The Consumer Price Index (CPI) is one of the most widely recognized price measures for tracking the price of a market basket of goods and services purchased by individuals. The weights of components are based on consumer spending patterns. The S&P 500 Stock Index is a widely recognized capitalization-weighted index of 500 common stock prices in U.S. companies. The U.S. Trade Weighted Dollar Index provides a general indication of the international value of the U.S. dollar. Advanced G-20 economies references members of the G-20 whose economies are considered by the IMF to be developed. This includes Canada, United States, Austria, Belgium, France, Greece, Ireland, Italy, Netherlands, Norway, Portugal, Spain, Sweden, Switzerland, United Kingdom, Australia, Japan and Korea. Emerging G-20 economies references members of the G-20 whose economies are considered by the IMF to be emerging. This includes Brazil, India, Indonesia, Hungary, Russia and Saudi Arabia. Alpha is a measure of performance on a risk-adjusted basis. Alpha takes the volatility (price risk) of a mutual fund and compares its risk-adjusted performance to a benchmark index. The excess return of the fund relative to the return of the benchmark index is a fund's alpha. Diversification does not protect an investor from market risks and does not assure a profit. Holdings in the World Precious Minerals Fund, Global Resources Fund and Global MegaTrends Fund as a percentage of net assets as of 3/31/10: SPDR Gold Trust (World Precious Minerals 1.29%), GM 0.00%, BYD Auto 0.00%.
www.usfunds.com May 2010 10-285 52
Come Visit Us at…
Facebook: www.facebook.com/usfunds
Twitter: www.twitter.com/usfunds
Frank Talk: www.usfunds.com
Investor Alert: www.usfunds.com

www.usfunds.com May 2010 10-285 53
1.800.US.FUNDS www.usfunds.com
Come see what’s new on Frank’s blog – visit Frank Talk at www.usfunds.com
Thank You for Attending Today’s Webcast