U.S. Global Investors Funds Semi-Annual Report · 30/06/2010 · U.S. Global Investors Funds...
212
June 30, 2010 U.S. Global Investors Funds Semi-Annual Report
Transcript of U.S. Global Investors Funds Semi-Annual Report · 30/06/2010 · U.S. Global Investors Funds...

June 30, 2010
U.S. Global Investors Funds Semi-Annual Report
U.S
. G
lob
al
Inve
sto
rs
P.O. B
ox 65
9405
San
Anto
nio,
Texa
s 78
265-
9604
U.S. Global Investors Funds Sem
i-Annual Report June 30, 2010
Wan
t to
redu
ce p
aper
was
te?
You
can
rece
ive th
is re
port
and
othe
r im
port
ant d
ocum
ents
el
ectr
onic
ally
. Ple
ase
visi
t w
ww
.usf
unds
.com
and
sig
n up
at A
cces
s M
y Ac
coun
t. If
you
need
furth
er a
ssis
tanc
e,
plea
se c
all u
s at 8
00-8
73-8
637.
10-421_InvestorsSemiAnnualCover.indd 110-421_InvestorsSemiAnnualCover.indd 1 8/3/10 4:48:50 PM8/3/10 4:48:50 PM


U.S. Global Investors Funds
Semi-Annual Report
June 30, 2010
(unaudited)
Table of Contents
Letter to Shareholders 1
Management Teams’ Perspectives 7
Expense Example 61
Portfolios of Investments 64
Notes to Portfolios of Investments 130
Statements of Assets and Liabilities 144
Statements of Operations 150
Statements of Changes in Net Assets 156
Notes to Financial Statements 165
Financial Highlights 185
Additional Information 198
Privacy Policy

Nasdaq Symbols
U.S. Global Investors Funds
Investor Class
U.S. Treasury Securities Cash Fund USTXX
U.S. Government Securities Savings Fund UGSXX
Near-Term Tax Free Fund NEARX
Tax Free Fund USUTX
All American Equity Fund GBTFX
Holmes Growth Fund ACBGX
Global MegaTrends Fund MEGAX
Global Resources Fund PSPFX
World Precious Minerals Fund UNWPX
Gold and Precious Metals Fund USERX
Eastern European Fund EUROX
Global Emerging Markets Fund GEMFX
China Region Fund USCOX
Institutional Class
Global MegaTrends Fund MEGIX
Global Resources Fund PIPFX
World Precious Minerals Fund UNWIX
P.O. Box 659405San Antonio, Texas 78265-9604Tel 1•800•US•FUNDSFax 1•210•308•1217www.usfunds.com

Dear Fellow Shareholder:
U.S. Global Investors Funds
A New York Times columnist is calling foranother depression, the ‘‘double-dip’’ recessiondebate is escalating, and one well-known tech-nical analyst is predicting a 90 percent plungefor the Dow Jones Industrial Average.
Markets are certainly volatile these days, and itdoesn’t help that ambitious doom-and-gloomers are working overtime to think up the worst worst-casescenarios. In this environment, it’s not surprising to see so manyinvestors are confused and afraid.
We don’t share the despair. I’ve lived through many market cyclesand have learned that there are always opportunities in globalmarkets, and we’re working harder to find them. As active manag-ers, we use sophisticated investment processes, and we play to win.
On the macro side, we believe in cycles and seasonal patterns, andthat government policies are precursors to change, both domesti-cally and internationally. We also believe that each asset class hasits own DNA when it comes to volatility. You can see this in thestandard deviation chart, which shows volatility over the past 10years for gold and gold equities compared to key large-cap andsmall-cap stock indexes.
For gold, the volatility over any 12 months for the past decade isplus or minus 14.8 percent and for gold stocks (as measured by theHUI), it is about three times greater. Investors should look at thesenumbers as ‘‘normal’’ behavior. It may come as a surprise that boththe S&P 500 and the Russell 2000 have been considerably morevolatile than bullion.
If you don’t pay attention to volatility, you risk being herded intobuying at the top and then getting upset and selling at a loss after acorrection. When you understand volatility, it’s easy to see howmuch risk you have if you’re leveraged. If you’re not leveraged,you have the flexibility to be able to buy on down days. �1
U.S. Global Investors Funds
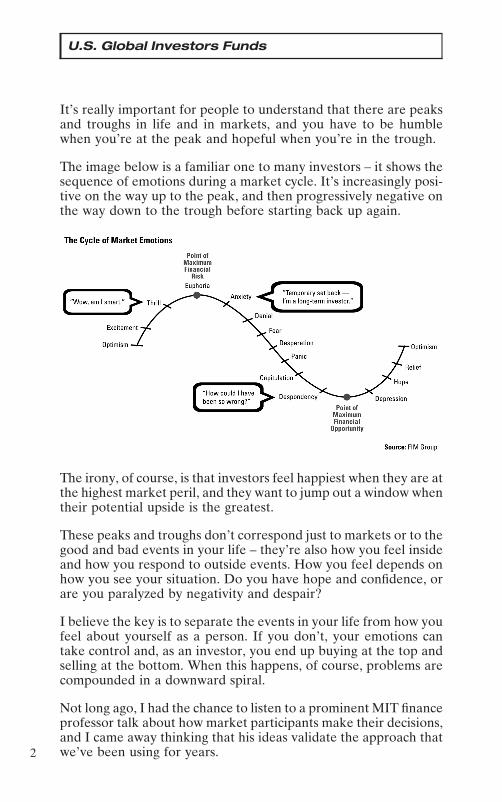
It’s really important for people to understand that there are peaksand troughs in life and in markets, and you have to be humblewhen you’re at the peak and hopeful when you’re in the trough.
The image below is a familiar one to many investors – it shows thesequence of emotions during a market cycle. It’s increasingly posi-tive on the way up to the peak, and then progressively negative onthe way down to the trough before starting back up again.
The irony, of course, is that investors feel happiest when they are atthe highest market peril, and they want to jump out a window whentheir potential upside is the greatest.
These peaks and troughs don’t correspond just to markets or to thegood and bad events in your life – they’re also how you feel insideand how you respond to outside events. How you feel depends onhow you see your situation. Do you have hope and confidence, orare you paralyzed by negativity and despair?
I believe the key is to separate the events in your life from how youfeel about yourself as a person. If you don’t, your emotions cantake control and, as an investor, you end up buying at the top andselling at the bottom. When this happens, of course, problems arecompounded in a downward spiral.
Not long ago, I had the chance to listen to a prominent MIT financeprofessor talk about how market participants make their decisions,and I came away thinking that his ideas validate the approach thatwe’ve been using for years.�2

U.S. Global Investors Funds
Professor Andrew Lo has developed what he calls the ‘‘adaptivemarkets hypothesis’’ (AMH) as a more sophisticated frameworkthan the long-standing ‘‘efficient markets hypothesis’’ (EMH).
I won’t go into a lot of detail, but the EMH assumes that all marketparticipants act rationally at all times, and that all available infor-mation is immediately reflected in market prices.
In Lo’s AMH, market participants are not always perfectlyrational – they often make bad decisions. They learn from thosebad decisions and, driven by competition, the survivors constantlyinnovate. Those who don’t adapt don’t last.
At U.S. Global, we have long viewed markets as ‘‘complex adap-tive systems’’ made up of many moving parts interconnected acrossa global network, and with the ability to learn from experiencesand change accordingly.
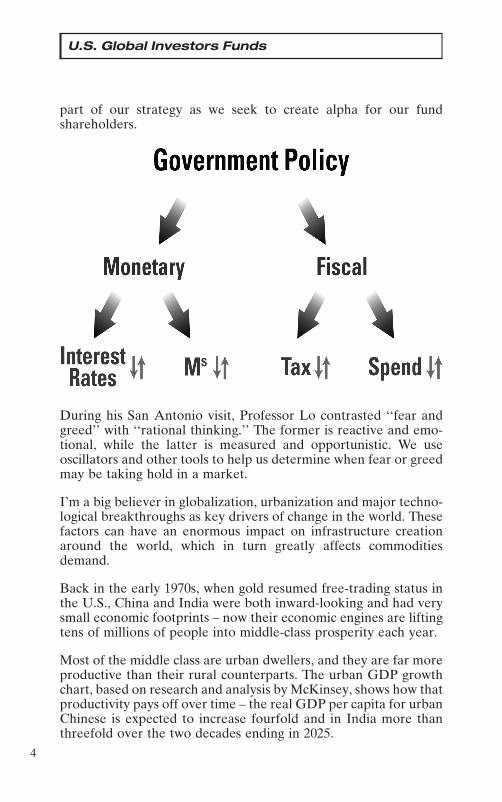
In our case, we use a matrix of top-down macro models that takeinto account political, economic and currency trends, and pair thatup with bottom-up micro stock selection models to determineweighting in countries, sectors and individual securities. We believegovernment policies are a precursor to change, and as a result, wekeep track of the fiscal and monetary policies of the G-7 and whatwe call the ‘‘E-7’’ – the world’s largest developing nations bypopulation.
We also focus on historical and socioeconomic cycles, and we applyboth statistical and fundamental models to identify companies withsuperior growth and value metrics. We overlay these explicitknowledge models with the tacit knowledge obtained by domesticand global travel for first-hand observation of local and geopoliti-cal conditions, as well as specific companies and projects. This is �3
U.S. Global Investors Funds
part of our strategy as we seek to create alpha for our fundshareholders.
During his San Antonio visit, Professor Lo contrasted ‘‘fear andgreed’’ with ‘‘rational thinking.’’ The former is reactive and emo-tional, while the latter is measured and opportunistic. We useoscillators and other tools to help us determine when fear or greedmay be taking hold in a market.
I’m a big believer in globalization, urbanization and major techno-logical breakthroughs as key drivers of change in the world. Thesefactors can have an enormous impact on infrastructure creationaround the world, which in turn greatly affects commoditiesdemand.
Back in the early 1970s, when gold resumed free-trading status inthe U.S., China and India were both inward-looking and had verysmall economic footprints – now their economic engines are liftingtens of millions of people into middle-class prosperity each year.
Most of the middle class are urban dwellers, and they are far moreproductive than their rural counterparts. The urban GDP growthchart, based on research and analysis by McKinsey, shows how thatproductivity pays off over time – the real GDP per capita for urbanChinese is expected to increase fourfold and in India more thanthreefold over the two decades ending in 2025.
�4

U.S. Global Investors Funds
Global markets present tremendous opportunities to those whoare able to sort out what’s meaningful from the background noise.That means going where others don’t to see promising projects.That means asking the right questions to get the best informationout of company management. And it means constantly fine-tuningour investment processes to ferret out market mispricing and otherinefficiencies and moving quickly to capitalize on them.
‘‘I’d be a bum on the street with a tin cup if the markets werealways efficient,’’ Warren Buffett once said.
We believe actions should be shaped by knowledge, beliefs andvalues, not emotions. When investors understand volatility, theycan manage market movements better and make better decisions.They can steer their financial ship with confidence, rather thansitting powerless and being pushed around by the market’s power-ful tides.
�5

U.S. Global Investors Funds
Thank you for trusting us with your investment – we appreciate theloyalty. Our mission is ‘‘to maximize the growth, protection andservice of our shareholders’ wealth with the highest ethical stan-dards.’’ We take this mission seriously, and we are committed tobuilding on your trust during these challenging times.
Sincerely,
Frank HolmesCEO and Chief Investment OfficerU.S. Global Investors, Inc.
The Dow Jones Industrial Average is a price-weighted average of 30 blue chipstocks that are generally leaders in their industry. Standard deviation is a measureof the dispersion of a set of data from its mean. The more spread apart the data, thehigher the deviation. Standard deviation is also known as historical volatility. TheNYSE Arca Gold BUGS (Basket of Unhedged Gold Stocks) Index (HUI) is amodified equal dollar weighted index of companies involved in gold mining. TheHUI Index was designed to provide significant exposure to near term movements ingold prices by including companies that do not hedge their gold production beyond1.5 years. The Russell 2000 Index is a U.S. equity index measuring the performanceof the 2,000 smallest companies in the Russell 3000. The Russell 3000 Index consistsof the 3,000 largest U.S. companies as determined by total market capitalization.The S&P 500 Stock Index is a widely recognized capitalization-weighted index of500 common stock prices in U.S. companies. Alpha is a measure of performance ona risk-adjusted basis. Alpha takes the volatility (price risk) of a mutual fund andcompares its risk-adjusted performance to a benchmark index. The excess return ofthe fund relative to the return of the benchmark index is a fund’s alpha.
�6

Management Team’s Perspective
Money Market Funds
INTRODUCTION
The U.S. Treasury Securities Cash Fund (USTXX) seeks to obtain a highlevel of current income while maintaining the highest degree of safety ofprincipal and liquidity. The U.S. Government Securities Savings Fund(UGSXX) seeks to achieve a consistently high yield with safety ofprincipal.
PERFORMANCE
U.S. Treasury Securities Cash Fund As of June 30, 2010
7-Day Yield 0.01%
7-Day Effective Yield 0.01%
Weighted Average Days to Maturity 3
U.S. Government Securities Savings Fund As of June 30, 2010
7-Day Yield 0.01%
7-Day Effective Yield 0.01%
Weighted Average Days to Maturity 21
An investment in either the U.S. Treasury Securities Cash Fund or the U.S. Govern-ment Securities Savings Fund is neither insured nor guaranteed by the FederalDeposit Insurance Corporation (FDIC) or by any other government agency.Although the funds seek to preserve the value of your investments at $1.00 per share, itis possible to lose money by investing in these funds.
Pursuant to a voluntary arrangement, the Adviser has agreed to limit total fundoperating expenses to not exceed 1.00% for the U.S. Treasury Securities Cash Fundand 0.45% for the U.S. Government Securities Savings Fund on an annualized basis.In addition, the yields reported above include the effects of the Adviser’s voluntarywaiver of fees and/or reimbursement of expenses to maintain a minimum net yield forthe funds. The Adviser can modify or terminate these arrangements at any time.
THE SIX-MONTH PERIOD IN REVIEW -ECONOMIC AND POLITICAL ISSUES THATAFFECTED THE FUNDS
The economic recovery that began in mid-2009 continued into the firstquarter of 2010. Many cyclical indicators reached multi-year highs, suchas the ISM manufacturing composite index,(1) which hit the highest levelsince 2004. The first taste of sustained employment growth since 2007 also
�7
Money Market Funds
occurred, and retail sales were surprisingly strong as tax refunds andgovernment stimulus paved the way.
During the second quarter, the economic recovery’s momentum began toslow. Along with a dip in cyclical indicators, China began policies to slowits economy and the European financial crisis fundamentally changed howthe global economic recovery is perceived.
It is now clear that fiscal austerity is in vogue and could be a significantdrag on growth in the U.S. and Europe. Spending cuts and higher taxescould transform a stimulative fiscal tailwind into a stiff headwind.
Inflation remains contained and deflation is now more feared. CPI(2) rosea very modest 1.1 percent year over year through June and has beendeclining all year. The Federal Reserve left monetary policy unchangedand continues to keep all policy options open.
Yields on the three-month Treasury bill rose 13 basis points to 0.18percent, while yields on the six-month bills rose 3 basis points to 0.22percent. One-year agency discount note yields were little changed, falling1 basis point to 0.44 percent. The market was still influenced by periodicbouts of risk aversion, with investors at times seeking to own short-termTreasury securities at almost any cost.
INVESTMENT HIGHLIGHTS
The U.S. Treasury Securities Cash Fund performed in line with the Lippertreasury money market funds for the six months ending June 30, 2010,returning 0.00 percent, the same as the peer group. The U.S. GovernmentSecurities Savings Fund also performed in line with the Lipper govern-ment-only money market funds for the year, returning 0.00 percent versus0.01 percent for the peer group.
The U.S. Government Securities Savings Fund took a laddered approachby buying fixed-rate securities across the money market spectrum. Thefund averaged a weighted average maturity of 24 days. The fund tookadvantage of higher yields by selectively extending its ladder, but overall itwas a very difficult environment for money market fund investors over thepast six months.
The U.S. Treasury Securities Cash Fund followed a similar approach,averaging a weighted average maturity of 18 days over the period. TheU.S. Treasury Securities Cash Fund took advantage of relatively highrepurchase rates relative to Treasuries, which kept the weighted averagematurity lower than the U.S. Government Securities Savings Fund overthe period. �8

Money Market Funds
CURRENT OUTLOOK
The Fed continues to emphasize that it will keep interest rates low for anextended period, and recent developments have reinforced this position. Ifthe economy were to slow too much, additional stimulus would be consid-ered, which represents a substantial shift in market expectations in just thepast few months.
(1)The ISM manufacturing composite index is a diffusion index calculated from fiveof the eight sub-components of a monthly survey of purchasing managers atroughly 300 manufacturing firms from 21 industries in all 50 states.
(2)The Consumer Price Index (CPI) is one of the most widely recognized pricemeasures for tracking the price of a market basket of goods and services pur-chased by individuals. The weights of components are based on consumer spend-ing patterns.
�9

Management Team’s Perspective
Tax Free Funds
INTRODUCTION
The Near-Term Tax Free Fund (NEARX) and the Tax Free Fund(USUTX) seek to provide a high level of current income exempt fromfederal income taxation and to preserve capital. However, a portion of anydistribution may be subject to federal and/or state income taxes. The Near-Term Tax Free Fund will maintain a weighted average maturity of less thanfive years, while the Tax Free Fund will generally maintain a longerweighted average maturity.
PERFORMANCE GRAPHS
Near-Term Tax Free Fund
Average Annual Performance For the Periods EndedJune 30, 2010
Six Month One Year Five Year Ten YearNear-Term Tax Free Fund 2.18% 4.91% 3.68% 4.00%
Barclays Capital 3-YearMunicipal Bond Index 1.51% 4.30% 4.25% 4.31%
Performance data quoted above is historical. Past performance is no guarantee of futureresults. Current performance may be higher or lower than the performance data quoted.Investment return and principal value of an investment will fluctuate so that an investor’sshares, when redeemed, may be worth more or less than their original cost. The graph andtable do not reflect the deduction of taxes that a shareholder would pay on fund distributionsor the redemption of fund shares. Returns for periods less than one year are not annualized.The Barclays Capital 3-Year Municipal Bond Index is a total return benchmark designed formunicipal assets. The index includes bonds with a minimum credit rating of BAA3, are issuedas part of a deal of at least $50 million, have an amount outstanding of at least $5 million andhave a maturity of two to four years. The returns for the index reflect no deduction for fees,expenses or taxes.Pursuant to a voluntary arrangement, the Adviser has agreed to limit total fund operatingexpenses (exclusive of acquired fund fees and expenses, extraordinary expenses, taxes, broker-age commissions and interest, and advisory fee performance adjustments, if any) to notexceed 0.45%. The Adviser can modify or terminate this arrangement at any time.�10
Tax Free Funds
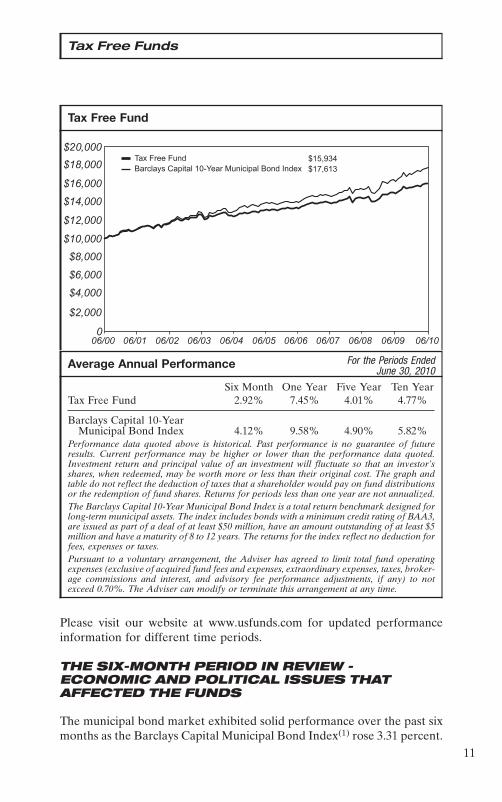
Tax Free Fund
Average Annual Performance For the Periods EndedJune 30, 2010
Six Month One Year Five Year Ten YearTax Free Fund 2.92% 7.45% 4.01% 4.77%
Barclays Capital 10-YearMunicipal Bond Index 4.12% 9.58% 4.90% 5.82%
Performance data quoted above is historical. Past performance is no guarantee of futureresults. Current performance may be higher or lower than the performance data quoted.Investment return and principal value of an investment will fluctuate so that an investor’sshares, when redeemed, may be worth more or less than their original cost. The graph andtable do not reflect the deduction of taxes that a shareholder would pay on fund distributionsor the redemption of fund shares. Returns for periods less than one year are not annualized.The Barclays Capital 10-Year Municipal Bond Index is a total return benchmark designed forlong-term municipal assets. The index includes bonds with a minimum credit rating of BAA3,are issued as part of a deal of at least $50 million, have an amount outstanding of at least $5million and have a maturity of 8 to 12 years. The returns for the index reflect no deduction forfees, expenses or taxes.Pursuant to a voluntary arrangement, the Adviser has agreed to limit total fund operatingexpenses (exclusive of acquired fund fees and expenses, extraordinary expenses, taxes, broker-age commissions and interest, and advisory fee performance adjustments, if any) to notexceed 0.70%. The Adviser can modify or terminate this arrangement at any time.
Please visit our website at www.usfunds.com for updated performanceinformation for different time periods.
THE SIX-MONTH PERIOD IN REVIEW -ECONOMIC AND POLITICAL ISSUES THATAFFECTED THE FUNDS
The municipal bond market exhibited solid performance over the past sixmonths as the Barclays Capital Municipal Bond Index(1) rose 3.31 percent.
�11

Tax Free Funds
The theme of low quality and long duration that outperformed in 2009carried over into the first six months of 2010. For example, the Barclay’sBBB Index appreciated 5.28 percent while its AAA-rated Index roseabout 2.32 percent. The funds’ conservative credit profile has hamperedrelative performance so far in 2010.
From a yield-curve prospective, the long end of the curve significantlyoutperformed. Long-term municipals (greater than 22 years to maturity)rose 4.49 percent, while the 3- and 10-year segments of the curve rose 1.51and 4.12 percent, respectively.
Revenue-backed municipals outperformed general-obligation bonds in anenvironment in which lower-quality bonds generally outperformed. Low-quality bonds within the revenue-backed universe that outperformedincluded hospitals and housing-backed issues, which rose 4.91 and 4.35percent, respectively. High-yield bonds rose 7.29 percent, with ‘‘junk’’bonds more than doubling the performance of the overall market.
In specialty state trading, Puerto Rico and California outperformed, whileOhio, Connecticut and Illinois underperformed.
The Federal Reserve has stayed the course and continues to pledge tokeep interest rates low for an extended period of time.
INVESTMENT HIGHLIGHTS
Over the six months ended June 30, 2010, the Near-Term Tax Free Fundposted a 2.18 percent return, while the Tax Free Fund returned 2.92percent.
The Near-Term Tax Free Fund outperformed its benchmark, the BarclaysCapital 3-Year Municipal Bond Index, which returned 1.51 percent. TheTax Free Fund trailed the performance of its benchmark, the BarclaysCapital 10-Year Municipal Bond Index, which returned 4.12 percent.
The Near-Term Tax Free Fund outperformed its respective Lipper peergroup over the six-month period, while the Tax Free Fund trailed itsrespective Lipper peer group by a modest 10 basis points. The perform-ance difference for the funds was primarily driven by fund credit andmaturity preferences relative to their benchmarks and peer groups. Theconservative credit profile of both funds hampered performance as lower-quality securities outperformed. From a maturity perspective, the Near-Term Tax Free Fund benefitted from a slightly longer maturity profile thanits benchmark, while the Tax Free Fund maintained a lower interest raterisk profile.
�12

Tax Free Funds
Strengths
• The Tax Free Fund maintained significant exposure to hospital-backedmunicipals, which outperformed.
• The Near-Term Tax Free Fund’s laddered maturity approach was bene-ficial as longer maturities outperformed.
Weaknesses
• Both funds maintained a conservative credit profile, which negativelyimpacted performance relative to their benchmarks and peer groups.
• Both funds had little to no exposure in the best-performing sectors ofthe market, including tobacco, housing and high-yield.
• The funds had limited exposure to the longest maturities, which faredbest during the past six months.
CURRENT OUTLOOK
Opportunities
• California state general obligation bonds were trading at historicallyvery cheap levels. If the state can reach a sensible solution to its budgetproblems, spreads should tighten significantly, which would result in adecrease in yields and an increase in market values.
• Illinois, Florida and Arizona are other areas that appear attractive assentiment appears to have become too negative, raising the chances of areversal.
Threats
• Continued outperformance of low-quality bonds is the most significantthreat on a relative basis.
• When the Fed reverses its monetary policy stance and begins to raiseinterest rates, the macro environment could become more difficult.
(1)The Barclays Capital Municipal Bond Index is an unmanaged index representa-tive of the tax-exempt bond market.
�13

Tax Free Funds
Near-Term Tax Free FundMunicipal Bond Ratings(Based on Total Municipal Bonds)
June 30, 2010
Tax Free FundMunicipal Bond Ratings(Based on Total Municipal Bonds)
June 30, 2010
�14

Management Team’s Perspective
All American Equity Fund
INTRODUCTION
The principal objective of the All American Equity Fund (GBTFX) is toseek long-term capital appreciation by investing primarily in a broadlydiversified portfolio of domestic common stocks. The fund invests in large-capitalization stocks, while retaining the flexibility to seek out promisingindividual stock opportunities, including stocks with meaningful dividendyields.
PERFORMANCE GRAPH
All American Equity Fund
Average Annual Performance For the Periods EndedJune 30, 2010
Six Month One Year Five Year Ten YearAll American Equity Fund (4.18)% 12.03% 0.24% (3.48)%
S&P 500 Index (6.65)% 14.43% (0.79)% (1.59)%Performance data quoted above is historical. Past performance is no guarantee of futureresults. Current performance may be higher or lower than the performance data quoted.Investment return and principal value of an investment will fluctuate so that an investor’sshares, when redeemed, may be worth more or less than their original cost. The graph andtable do not reflect the deduction of taxes that a shareholder would pay on fund distributionsor the redemption of fund shares. Returns for periods less than one year are not annualized.The S&P 500 Index is a widely recognized capitalization-weighted index of 500 commonstock prices in U.S. companies. The returns for the index reflect no deduction for fees,expenses or taxes.Pursuant to a voluntary arrangement, the Adviser has agreed to limit total fund operatingexpenses (exclusive of acquired fund fees and expenses, extraordinary expenses, taxes, broker-age commissions and interest, and advisory fee performance adjustments, if any) to notexceed 2.20%. The Adviser can modify or terminate this arrangement at any time.
Please visit our website at www.usfunds.com for updated performanceinformation for different time periods. �15

All American Equity Fund
THE SIX-MONTH PERIOD IN REVIEW -ECONOMIC AND POLITICAL ISSUES THATAFFECTED THE FUND
The start of 2010 saw the U.S. economy back in expansion mode after therecession ended in mid-2009. The third and fourth quarters of 2009 sawGDP growth of 2.2 percent and 5.6 percent, respectively; for the first twoquarters of 2010, growth slowed to 3.7 percent and 2.4 percent,respectively.
With a somewhat tenuous recovery in place, the Federal Reserve keptrates at a low level, targeting the federal funds rate between zero and 0.25percent. With growth slowing and inflation yet to make an appearance, thethreat of deflation should keep rates low for an extended period.
Inflation declined during the time period, with the Consumer Price Index(CPI)(1) for all items rising 1.1 percent as of June 2010, compared to 2.7percent at the end of December 2009. Excluding food and energy, CPIrose 0.9 percent as of June 2010, down from 1.8 percent as of December2009.
The employment picture remains troubling. In June 2010, the jobless levelwas 9.5 percent.
The yield on the 10-year Treasury ended the period at 2.93 percent, downfrom 3.84 percent at the end of December. The decline in yield reflectsgrowing concerns that the economy is slowing down and the possibilitythat the economy could slip back into recession.
Stock market performance over the six-month period was marked byextreme swings. The S&P 500 Index began the year at 1115, but fell 5percent in the next 5 weeks, closing at 1056 on February 8. The marketthen rallied 15 percent to carry the S&P 500 to the 1217 level in April, butthen gave it all up by the end of the time period to close at 1031.
INVESTMENT HIGHLIGHTS
Overview
The fund declined 4.18 percent for the six months ended June 30, 2010,compared to a negative 6.65 percent return for the S&P 500 Index, thefund’s benchmark.
Because the fund is actively managed, and a holding period is generallynot a consideration in investment decisions, the portfolio turnover rate
�16

All American Equity Fund
may fluctuate from year to year as the fund adjusts its portfolio composi-tion. Its annual portfolio turnover was, and is expected to continue to be,more than 100 percent.
Strengths
• Stock selection within the information technology sector provided posi-tive returns. Despite the sector being down 11 percent during theperiod, several of the fund’s holdings did very well. Akamai Technolo-gies, Inc.(2) was up 33 percent for the period held, Apple, Inc.(3)
returned 19 percent and Cree, Inc.(4) returned 6 percent. Akamai bene-fited from the move towards cloud computing and the need fordownloading and/or streaming content over the Internet. Apple bene-fited from a strong portfolio of products, and Cree was the beneficiary ofthe move towards LEDs.
• Stock selection was also strong in the consumer discretion sector – anoverweight position in the sector was beneficial because the sector wasthe second-best performer in the S&P 500. Given the level of unemploy-ment, it was surprising that the retail sector reported positive same-storesales for most of the time period. The fund benefited from owningSkechers U.S.A., Inc.,(5) Lululemon Athletica, Inc.(6) and AutoZone,Inc.(7)
Weaknesses
• The fund’s underweighting in the industrial sector, the S&P’s bestperformer over the six months, diminished returns. Railroads were onegroup that the fund missed. Much of the action was related to BerkshireHathaway Inc.’s(8) acquisition of Burlington Northern Santa Fe Corp.(8)
in mid-February. The rail group failed to meet the revenue and earningsgrowth models employed by the fund.
• An underweight position in financials, the third-best performer, alsohurt the fund. The decision to underweight the sector was based ondeclining sales and earnings growth, as well as dividend cuts that madeyields much less attractive. In addition, there were concerns aboutcommercial real estate becoming the next wave of write-offs for banks.
CURRENT OUTLOOK
Opportunities
• With midterm elections coming later this year, Congress and the Obamaadministration may attempt to counteract what some observers inter-pret as an anti-business tilt in an effort to keep Democratic control ofthe House and Senate. �17

All American Equity Fund
• There appears to be growing concern that the economic recovery maybe weakening, with some pundits going so far as to forecast a slide backinto recession. This raises the possibility of another fiscal stimulus tohelp the economy.
• Given the lack of upward wage pressure and the stubbornly high level ofunemployment, the Federal Reserve is unlikely to raise interest ratesany time before the end of 2010.
Threats
• The Obama administration may continue to take a more active role inregulatory oversight. Periods of increased regulation are in generalconsidered bad for business.
• China has taken steps to diversify away from the dollar, which may leadit to reduce purchases of U.S. Treasury securities. This would result inhigher interest rates, which could be a headwind for stocks.
• As governments around the world begin to wind down the monetaryand fiscal stimulus programs put in place during the economic crisis, itwill likely present a headwind for stocks.
The fund ended the period with overweights in materials, utilities andtelecom and an emphasis on dividend paying stocks.
(1)The Consumer Price Index (CPI) is one of the most widely recognized pricemeasures for tracking the price of a market basket of goods and services pur-chased by individuals. The weights of components are based on consumer spend-ing patterns.
(2)This security comprised 2.40% of the fund’s total net assets as of 06/30/10. (3)This security comprised 4.13% of the fund’s total net assets as of 06/30/10. (4)This security comprised 1.18% of the fund’s total net assets as of 06/30/10. (5)This security comprised 1.20% of the fund’s total net assets as of 06/30/10. (6)This security comprised 0.98% of the fund’s total net assets as of 06/30/10. (7)This security comprised 1.27% of the fund’s total net assets as of 06/30/10. (8)The fund did not hold this security as of 06/30/10.
�18

All American Equity Fund
Top 10 Holdings Based on Net AssetsJune 30, 2010
(excluding repurchase agreements)
Apple, Inc. 4.13%Computers
Salesforce.com, Inc. 3.10%Applications Software
Akamai Technologies, Inc. 2.40%Internet
Panera Bread Co. 1.98%Restaurants
ConocoPhillips 1.94%Oil & Gas - Integrated
Bank of America Corp. 1.89%Diversified Banking Institutions
Chipotle Mexican Grill, Inc. 1.80%Restaurants
Devon Energy Corp. 1.60%Oil & Gas Exploration & Production
DIRECTV 1.56%Cable/Satellite TV
Cerner Corp. 1.50%Medical Information System
TOTAL TOP TEN HOLDINGS 21.90%
Portfolio Allocation by Industry SectorBased on Total Investments
June 30, 2010
�19

Management Team’s Perspective
Holmes Growth Fund
INTRODUCTION
The Holmes Growth Fund (ACBGX) invests in companies with goodgrowth prospects and strong positive earnings momentum. The fund’sprimary objective is to seek long-term capital appreciation.
PERFORMANCE GRAPH
Holmes Growth Fund
Average Annual Performance For the Periods EndedJune 30, 2010
Six Month One Year Five Year Ten YearHolmes Growth Fund (1.99)% 9.65% (0.93)% (4.61)%
S&P 500 Index (6.65)% 14.43% (0.79)% (1.59)%
S&P Composite 1500 Index (6.03)% 15.58% (0.46)% (0.83)%Performance data quoted above is historical. Past performance is no guarantee of futureresults. Current performance may be higher or lower than the performance data quoted.Investment return and principal value of an investment will fluctuate so that an investor’sshares, when redeemed, may be worth more or less than their original cost. The graph andtable do not reflect the deduction of taxes that a shareholder would pay on fund distributionsor the redemption of fund shares. Returns for periods less than one year are not annualized.The S&P 500 Index is a widely recognized capitalization-weighted index of 500 commonstock prices in U.S. companies. The S&P Composite 1500 Index is a broad-based capitaliza-tion-weighted index of 1500 U.S. companies and is comprised of the S&P 400, S&P 500 andthe S&P 600. The returns for the indexes reflect no deduction for fees, expenses or taxes.Pursuant to a voluntary arrangement, the Adviser has agreed to limit total fund operatingexpenses (exclusive of acquired fund fees and expenses, extraordinary expenses, taxes, broker-age commissions and interest, and advisory fee performance adjustments, if any) to notexceed 2.20%. The Adviser can modify or terminate this arrangement at any time.
Please visit our website at www.usfunds.com for updated performanceinformation for different time periods.�20
Holmes Growth Fund
THE SIX-MONTH PERIOD IN REVIEW -ECONOMIC AND POLITICAL ISSUES THATAFFECTED THE FUND
The fourth quarter of 2009 showed a U.S. growth rate of 5.6 percent, andthe first and second quarters of 2010 came in with 3.7 percent and 2.4percent increases, respectively.
To aid a recovering economy, the Federal Reserve kept short-term interestrates low – the federal funds target rate was in a range of zero to 0.25percent during the first six months of the year. The year began with the 10-year U.S. Treasury note yield at 3.84 percent, reached a high for the periodin early April around 3.99 percent, and ended the six-month period at 2.93percent.
Inflation remained relatively contained, with year-over-year change in theConsumer Price Index (CPI)(1) registering a high of 2.6 percent in Januaryand a low of 1.1 percent in June. With the economy showing some signs ofslowing growth, inflation is not expected to increase significantly in thenear future.
The employment picture remained weak. Unemployment rose to a 26-yearhigh of 10.1 percent in October 2009. In December 2009, the jobless levelwas 10.0 percent, and it finished the six-month period at 9.5 percent.
Stock market performance was marked by wide swings over the period.The benchmark S&P Composite 1500 Index began the year at 254.79,declined 4.2 percent in early February, rose 14.9 percent in late April, andthen declined 15.5 percent to end the second quarter at 237.18.
The political environment was one of strongly divided partisan debatesover national healthcare legislation and financial regulatory reform. It wasalso marked by what some observers interpreted as an anti-business tilt onthe part of the current administration and parts of the legislative bodies.Concern over government spending and increasing government controlover major parts of the economy helped raise the profile of the Tea Partymovement.
INVESTMENT HIGHLIGHTS
Overview
The fund declined 1.99 percent for the six-month period ended June 30,2010, compared to a negative 6.03 percent return for the benchmark S&PComposite 1500 Index.
�21

Holmes Growth Fund
Our investment approach combines top-down and bottom-up analyses.The top-down aspect reviews global trends that include economic out-looks, political and legislative environment, government policy changes,socioeconomic trends, currency effects and other macro items. The bot-tom-up analysis emphasizes companies that we believe have prospects togenerate long-term, sustainable growth in cash flow and relatively highreturns on capital.
Because the fund is actively managed, and a holding period is generallynot a consideration in investment decisions, the portfolio turnover ratemay fluctuate from year to year as the fund adjusts its portfolio composi-tion. Its annual portfolio turnover was, and is expected to continue to be,more than 100 percent.
Strengths
• The fund benefited from being overweight the consumer discretionsector, which outperformed. Stock selection was a key driver of fundperformance in this sector, with positive contributions from Netflix,Inc.,(2) Deckers Outdoor Corp,(3) and Capella Education Co.(2) Netflixbenefited by more customers using its movie DVD-by-mail service and,increasingly, its service of streaming movies over the internet. Deckersgained through customer acceptance of its Ugg line of boots. Capellaflourished as more individuals participated in the firm’s online educa-tion programs.
• Although the fund was overweight materials, the second worst-perform-ing sector, it provided a positive contribution to fund performance dueto stock selection. Randgold Resources Ltd.(4) and Red Back Mining,Inc.(5) benefited from an increasing gold price, and Teck ResourcesLtd.(2) prospered from an increase in the price of coking coal. The fundalso benefited by rotation from copper and coking coal holdings in thefirst quarter to a greater emphasis on gold stock holdings in the secondquarter.
• Cash management and defensive option positions contributed to fundperformance by helping to limit downside volatility. Broadly speaking,the fund’s option strategy included writing options on existing positions(covered calls) and purchasing put options to fine tune general marketor sector exposure.
Weaknesses
• Relative fund performance was diminished by being underweight theindustrials and financials sectors, the second- and third best-performingsectors.
�22

Holmes Growth Fund
• The fund performance was hindered by being overweight the technol-ogy sector which finished in the bottom half of the benchmark sectors.Security selection was mixed. Fund performance was aided by holdingsin Apple, Inc.,(6) Riverbed Technology, Inc.(7) and Cree, Inc.,(8) butholdings in CYBERplex Inc.,(2) Visa, Inc.(9) and AboveNet, Inc.(2)
diminished performance.
CURRENT OUTLOOK
Opportunities
• If expectations of many investors for a continuing economic recoverycome to pass, it should be positive for corporate profits and stock prices.
• If the current administration and legislators become less adversarialtoward businesses and business concerns, it would be positive for stocks.
• Low interest rates, if continued throughout 2010, should provide afavorable backdrop for the economy and stock prices.
Threats
• If the economy does not improve in line with or above investors’expectations, it would be a threat to stock prices.
• An escalation in concerns over sovereign debt obligations in Europewould be negative for stocks.
• As governments around the world begin to wind down the monetaryand fiscal stimulus programs put in place during the economic crisis, itwill likely present a headwind for stocks.
From a fund construction viewpoint, at June 30, 2010, the fund was in abalanced posture, being overweight consumer discretion, materials,energy, and technology, with the offensive positioning tempered by ahigher-than-normal cash position and defensive option positions.
(1)The Consumer Price Index (CPI) is one of the most widely recognized pricemeasures for tracking the price of a market basket of goods and services pur-chased by individuals. The weights of components are based on consumer spend-ing patterns.
(2)The fund did not hold this security as of 06/30/10. (3)This security comprised 1.25% of the fund’s total net assets as of 06/30/10. (4)This security comprised 3.32% of the fund’s total net assets as of 06/30/10. (5)This security comprised 0.89% of the fund’s total net assets as of 06/30/10. (6)This security comprised 3.31% of the fund’s total net assets as of 06/30/10. (7)This security comprised 1.62% of the fund’s total net assets as of 06/30/10. (8)This security comprised 1.76% of the fund’s total net assets as of 06/30/10. (9)This security comprised 1.55% of the fund’s total net assets as of 06/30/10. �23

Holmes Growth Fund
Top 10 Holdings Based on Net AssetsJune 30, 2010
(excluding repurchase agreements)
Newfoundland Capital Corp. Ltd. 7.87%Radio
Randgold Resources Ltd. 3.32%Gold Mining
Apple, Inc. 3.31%Computers
Express Scripts, Inc. 2.75%Pharmacy Services
Concho Resources, Inc. 2.59%Oil & Gas Exploration & Production
Core Laboratories N.V. 2.33%Oil Field Services
Ctrip.com International Ltd. 2.20%E-Commerce
Baidu, Inc. 1.99%Internet
Pacific Rubiales Energy Corp. 1.92%Oil & Gas Exploration & Production
Bank of America Corp. 1.89%Diversified Banking Institutions
TOTAL TOP TEN HOLDINGS 30.17%
Portfolio Allocation by Industry SectorBased on Total Investments
June 30, 2010
�24

Management Team’s PerspectiveGlobal MegaTrends Fund
INTRODUCTIONThe Global MegaTrends Fund (MEGAX and MEGIX) invests in compa-nies that are well positioned to benefit from future investments in globalinfrastructure, both in the private and public sectors. The fund considers abroad range of investable opportunities, including publicly traded infra-structure assets (such as airports and toll roads), select utilities, construc-tion and engineering firms, telecom operators, select companies in thealternative energy space, and companies in the steel, cement and rawmaterials sectors.PERFORMANCE GRAPH
Global MegaTrends Fund
Average Annual Performance For the Periods Ended June 30, 2010
Since Inception(Institutional
Six Month One Year Five Year Ten Year Class)Global MegaTrends Fund -
Investor Class (11.66)% 3.00% (2.62)% (0.70)% n/aGlobal MegaTrends Fund - Institutional Class
(Inception 3/1/10) n/a n/a n/a n/a (8.09)%S&P 500 Index (6.65)% 14.43% (0.79)% (1.59)% (0.07)%S&P Global Infrastructure
Index (13.05)% 6.57% 3.92% n/a (9.09)%Performance data quoted above is historical. Past performance is no guarantee of futureresults. Current performance may be higher or lower than the performance data quoted.Investment return and principal value of an investment will fluctuate so that an investor’sshares, when redeemed, may be worth more or less than their original cost. The graph andtable do not reflect the deduction of taxes that a shareholder would pay on fund distributionsor the redemption of fund shares. Returns for periods less than one year are not annualized.The Institutional Class commenced on March 1, 2010.The S&P 500 Index is a widely recognized capitalization-weighted index of 500 commonstock prices in U.S. companies. The S&P Global Infrastructure Index provides liquid andtradable exposure to 75 companies from around the world that represent the listed infrastruc-ture universe. The index has balanced weights across three distinct infrastructure clusters:utilities, transportation and energy. The index commenced November 2001; it is not includedin the graph as it had less than the full period of data. The returns for the indexes reflect nodeduction for fees, expenses or taxes.Pursuant to a voluntary arrangement, the Adviser has agreed to limit total fund operatingexpenses (exclusive of acquired fund fees and expenses, extraordinary expenses, taxes, broker-age commissions and interest, and advisory fee performance adjustments, if any) to notexceed 2.35% for the investor class. Also pursuant to a voluntary agreement, the Adviser hasagreed to waive all class specific expenses of the institutional class. The Adviser can modify orterminate these arrangements at any time.
Please visit our website at www.usfunds.com for updated performanceinformation for different time periods. �25

Global MegaTrends Fund
THE SIX-MONTH PERIOD IN REVIEW -ECONOMIC AND POLITICAL ISSUES THATAFFECTED THE FUND
The first half of the year was dominated by the sovereign crisis in Europeand the risk that it would spread to other parts of the world. This createdfinancial uncertainty in many countries and raised concerns about theimpact on global infrastructure spending.
In addition, numerous market participants were concerned that a sharpreversal in the Chinese property boom would dampen demand forcommodities.
The infrastructure theme remains intact with many governments respond-ing to the economic slowdown by investing in their country’s infrastruc-ture. These policies are viewed by many as not only a short-term jobcreator, but also as a means to build the long-term foundation of anindustrialized society.
INVESTMENT HIGHLIGHTS
The Global MegaTrends Fund began offering an institutional class ofshares on March 1, 2010. Performance of the Institutional Class is includedin the performance graph on the previous page. As the Institutional Classhad less than six months of operations, the following discussion of per-formance is for the six month period ended June 30, 2010, of the InvestorClass.
Overview
The fund (Investor Class) had a negative 11.66 percent return in the six-month period ended June 30, 2010, compared to a negative 6.65 percentreturn for the S&P 500 Index, the fund’s benchmark, and a negative 13.05percent return for the S&P Global Infrastructure Index.
Strengths
• Some of the fund’s best contributors to performance were foreignstocks. Westshore Terminals Income Fund(1) and Teck ResourcesLtd.,(2) based in Canada, appreciated by 24 percent and 18 percent,respectively, due to corporate activity and steady demand for coal.
• The outperformance was primarily driven by superior stock selection asmany of the fund’s major regional themes underperformed, particularlyRussian, U.S. and Chinese infrastructure names.
�26
Global MegaTrends Fund
Weaknesses
• Many typical infrastructure names were a drag on performance due toanticipation that the Chinese economy will be recalibrated away fromfixed-asset formation toward consumer demand. Duoyuan GlobalWater, Inc.(2) detracted from fund performance during the period, dueto a generally negative sentiment towards the Chinese stocks.
• The emergence of the sovereign crisis in Europe also created a percep-tion that various projects will be scaled down or postponed as thecountries need to preserve cash.
CURRENT OUTLOOK
The infrastructure theme will be prominent for many years to come due toa growth in population and urbanization that necessitate improvements tothe existing global infrastructure.
Underinvestment in infrastructure assets in the past 20 to 30 years hasresulted in a significant deterioration of existing infrastructure. Politicalleaders around the world are aware that investments in infrastructure areneeded to sustain economic growth and competitiveness.
In addition, growing recognition of the need for alternative energy sourceswill continue despite a recent decline in crude oil prices. The U.S. Senateoverwhelmingly approved tax credits for solar and wind power in late2008, and this will likely support continued investment in this sector.
Opportunities
• Despite a potential slowdown, China remains at the forefront of theinfrastructure boom and will likely be a rich source of potential invest-ments for years to come.
• Although a lower oil price may change the relative attractiveness ofwind and solar, investments in alternative energy sources will likely gaintraction due to growing global need for additional power.
• Improved water infrastructure offers significant potential. This will becrucial as emerging economies develop and while opportunities in thisspace are currently limited.
Threats
• While many countries remain committed to improving their infrastruc-ture, credit conditions remain tight and generally more difficult andexpensive to obtain. �27

Global MegaTrends Fund
• Emerging markets have been extremely volatile over the past year,which makes for challenging conditions.
• Government support/subsidies are still required for a sustainable devel-opment of alternative energy. These can vary with changes in a politicalclimate.
(1)This security comprised 3.73% of the fund’s total net assets as of 06/30/10. (2)The fund did not hold this security as of 06/30/10.
�28

Global MegaTrends Fund
Top 10 Holdings Based on Net AssetsJune 30, 2010
(excluding repurchase agreements)
Grupo Aeroportuario del Sureste S.A.B. de C.V. 4.65%Airports
Hyflux Ltd. 4.42%Water Treatment Systems
CPFL Energia S.A. 4.27%Electric - Integrated
Compania de Concessoes Rodoviarias 3.80%Public Thoroughfares
Westshore Terminals Income Fund 3.73%Transport & Storage
Berkshire Hathaway, Inc. 3.46%Holding Company
NuStar Energy L.P. 2.93%Pipelines
Grupo Empresarial Ibiza S.A. 2.65%Metal & Mineral Mining
CSX Corp. 2.53%Transportation
FirstEnergy Corp. 2.34%Electric - Integrated
TOTAL TOP TEN HOLDINGS 34.78%
Portfolio Allocation by Industry SectorBased on Total Investments
June 30, 2010
�29

Management Team’s PerspectiveGlobal Resources Fund
INTRODUCTION
The Global Resources Fund (PSPFX and PIPFX) is a non-diversifiednatural resources fund that seeks long-term growth of capital plus protec-tion against inflation and monetary instability. The fund invests globally incompanies involved in the exploration, production, transportation andprocessing of petroleum, natural gas, industrial commodities, metals, min-erals and forestry.
PERFORMANCE GRAPHGlobal Resources Fund
Average Annual Performance For the Periods Ended June 30, 2010
Since Inception(Institutional
Six Month One Year Five Year Ten Year Class)Global Resources Fund -
Investor Class (6.33)% 25.61% 4.75% 16.30% n/a
Global Resources Fund - Institutional Class(Inception 3/1/10) n/a n/a n/a n/a (6.27)%
S&P 500 Index (6.65)% 14.43% (0.79)% (1.59)% (0.07)%
Morgan Stanley Commodity RelatedEquity Index (9.92)% 17.02% 12.18% 14.72% (11.07)%
Performance data quoted above is historical. Past performance is no guarantee of futureresults. Current performance may be higher or lower than the performance data quoted.Investment return and principal value of an investment will fluctuate so that an investor’sshares, when redeemed, may be worth more or less than their original cost. The graph andtable do not reflect the deduction of taxes that a shareholder would pay on fund distributionsor the redemption of fund shares. Returns for periods less than one year are not annualized.The Institutional Class commenced on March 1, 2010.The S&P 500 Index is a widely recognized capitalization-weighted index of 500 common stockprices in U.S. companies. The Morgan Stanley Commodity Related Equity Index is an equal-dollar weighted index based on shares of widely held companies involved in commodity-related industries such as energy, non-ferrous metals, agriculture and forest products. Thereturns for the indexes reflect no deduction for fees, expenses or taxes.Pursuant to a voluntary arrangement, the Adviser has agreed to limit total fund operatingexpenses (exclusive of acquired fund fees and expenses, extraordinary expenses, taxes,brokerage commissions and interest, and advisory fee performance adjustments, if any) tonot exceed 1.90% for the investor class. Also pursuant to a voluntary agreement, theAdviser has agreed to waive all class specific expenses of the institutional class. The Advisercan modify or terminate these arrangements at any time.
Please visit our website at www.usfunds.com for updated performanceinformation for different time periods.�30

Global Resources Fund
THE SIX-MONTH PERIOD IN REVIEW -ECONOMIC AND POLITICAL ISSUES THATAFFECTED THE FUND
The global economic expansion that began in 2009 and continued into thefirst quarter of 2010 came into question during the second quarter. TheMSCI World Index(1) reached a post-2008 Great Recession high of 1242 inmid-April and then fell 16 percent to a 10-month low of 1041 on June 30.
The heightened volatility during the quarter was driven principally byconcerns of a sovereign debt crisis in Greece and other Southern Euro-pean countries with weak economies and severely leveraged balancesheets.
Another macro factor was a move by China, the growth engine for theglobal economy over the past 18 months, to introduce specific measures tocool an overheated housing market and control the growth of loans thatwere being funneled into infrastructure projects.
These two factors gave investors a reason to question global growthprospects, the result being incremental de-risking of portfolios and asearch for safe-haven investments in U.S. Treasuries and gold.
During the second quarter, the managers made tactical rotations out ofChina-centric commodities such as iron ore, coal, steel and copper andused the proceeds to increase the fund’s relative weighting in the energysector and large-capitalization gold stocks.
Crude oil traded in a range between $70 and $85 per barrel in the first halfof 2010, generally twice the price of the prior year period. Demand growthremains strongest in non-OECD countries, especially in Asia and theMiddle East.
INVESTMENT HIGHLIGHTS
The Global Resources Fund began offering an institutional class of shareson March 1, 2010. Performance of the Institutional Class is included in theperformance graph. As the Institutional Class had less than six months ofoperations, the following discussion of performance is for the six monthperiod ended June 30, 2010, of the Investor Class.
Overview
In the first half of 2010, the Global Resources Fund (Investor Class)returned a negative 6.33 percent. It outperformed, by more than 350 basispoints, its benchmark, the Morgan Stanley Commodity Related Equity �31

Global Resources Fund
Index (CRX), which declined 9.92 percent. The fund also delivered topdecile returns relative to its Lipper peer group.
After posting a solid positive first quarter result of 5.88 percent, the funddeclined 11.53 percent during the second quarter. It was a quarter markedby volatility – the S&P 500 Index fell 11.43 percent, its worst performancesince the fourth quarter of 2008. The fund was able to deliver strongrelative performance as measured against the CRX, which had a totalreturn of negative 14.09 percent. On a year-over-year basis, the fundcontinues to outperform with a total return of 25.61 percent, comparedwith 17.02 percent for its benchmark and 14.43 percent for the S&P 500Index.
Because the fund is actively managed, and a holding period is generallynot a consideration in investment decisions, the portfolio turnover ratemay fluctuate from year to year as the fund adjusts its portfolio composi-tion. Its annual portfolio turnover was, and is expected to continue to be,more than 100 percent.
Strengths
• Gold moved solidly upward in the first half of 2010 from $1,100 perounce to nearly $1,250 per ounce. Rising fear of sovereign debt defaultin several southern European countries increased demand for safehaven assets such as gold.
• Precious metals equities posted strong gains, with the NYSE Arca GoldBUGS Index(2) (HUI) rising 10.89 percent. The HUI outperformed theCRX benchmark by nearly 21 percentage points. The fund’s exposure togold equities contributed to its relative return to the CRX benchmark.
• The fund benefited from exposure to high-impact crude oil explorationand production companies such as Pacific Rubiales Energy Corp.,(3)
which gained more than 52 percent.
Weaknesses
• Most base metals finished the period lower. The London MetalsExchange Index(4) posted a negative 11.79 percent return and theBloomberg World Mining Index(5) fell 13.28 percent.
• Commodities were also lower, as represented by the Reuters/JefferiesCRB Index,(6) which slid 8.77 percent in the first half of 2010, and theCRX Index, which declined 9.92 percent.
• The price of crude oil fell 4.7 percent and natural gas declined 17.2percent in the period. Despite a recovery in U.S. industrial gas demand,
�32

Global Resources Fund
a rapidly growing supply profile from emerging shale discoveries contin-ues to weigh on the price. Related gas equities represented by theAMEX Natural Gas Index(7) fell 10 percent.
CURRENT OUTLOOK
Opportunities
• China may face an annual shortfall of 200 million metric tons of coal by2015, according to the Xinhua news agency. Coal demand may rise to arecord 3.8 billion metric tons during the period, while domestic coalproducers may be able to deliver 3.6 billion tons.
• Coal demand in India may increase more than 500 million metric tonsbetween 2008 and 2015, according to Wood Mackenzie, an energyresearch/consulting firm. Demand may reach 1.5 billion metric tons ayear by 2025.
• The five-week period ending in May saw the most aggressive net sellingof metals and mining stocks in four years, according to net flowsreported by UBS Typically, a selloff of this intensity is a strong con-trarian signal that the worst has been priced into mining equities overthe short- to intermediate-term.
Threats
• Mohammad Ali Khatibi, Iran’s OPEC governor, said that OPEC cur-rently has a surplus capacity of 4 million to 6 million barrels per day,which is keeping the crude prices low. Khatibi added that the Gulf ofMexico oil spill in April will likely limit access to sensitive areas andincrease the production cost of crude oil in deep waters.
(1)The MSCI World Index is a capitalization-weighted index that monitors theperformance of stocks from around the world.
(2)The NYSE Arca Gold BUGS (Basket of Unhedged Gold Stocks) Index (HUI) isa modified equal dollar weighted index of companies involved in gold mining. TheHUI Index was designed to provide significant exposure to near term movementsin gold prices by including companies that do not hedge their gold productionbeyond 1.5 years.
(3)This security comprised 3.66% of the fund’s total net assets as of 06/30/10. (4)The London Metals Exchange Index (LMEX) is an index on the six designated
LME primary metals contracts denominated in US dollars. Weightings of the sixmetals are derived from global production volume and trade liquidity averagedover the preceding five-year period. The index value is calculated as the sum ofthe prices for the three qualifying months multiplied by the correspondingweights, multiplied by a constant.
(5)The Bloomberg World Mining Index is a capitalization-weighted index of theleading mining stocks in the world.
(6)The Reuters/Jefferies CRB Index is an unweighted geometric average of com-modity price levels relative to the base year average price.
(7)The AMEX Natural Gas Index (XNG) is an equal-dollar weighted indexdesigned to measure the performance of highly capitalized companies in thenatural gas industry involved primarily in natural gas exploration and productionand natural gas pipeline transportation and transmission. �33

Global Resources Fund
Top 10 Holdings Based on Net AssetsJune 30, 2010
(excluding repurchase agreements)
Chevron Corp. 3.99%Oil & Gas - Integrated
Occidental Petroleum Corp. 3.68%Oil & Gas - Integrated
Pacific Rubiales Energy Corp. 3.66%Oil & Gas Exploration & Production
Canadian Natural Resources Ltd. 3.64%Oil & Gas Exploration & Production
Randgold Resources Ltd. 3.28%Gold & Silver Mining
Newmont Mining Corp. 2.95%Gold Mining
Barrick Gold Corp. 2.89%Gold Mining
Southwestern Energy Co. 2.25%Oil & Gas Exploration & Production
ConocoPhillips 2.19%Oil & Gas - Integrated
Anadarko Petroleum Corp. 2.14%Oil & Gas Exploration & Production
TOTAL TOP TEN HOLDINGS 30.67%
�34

Global Resources Fund
Portfolio Allocation by Industry Sector June 30, 2010
Energy:Oil & Gas Exploration & Production 37.7%Oil & Gas - Integrated (includes Refining and 10.6%
Marketing)Oil & Gas Equipment & Services 6.1%Oil & Gas - Other 3.5%
Total Energy 57.9%Basic Materials:
Precious Metals (includes Gold/Silver Mining 18.4%and Platinum)
Metals & Mining (includes Copper, Uranium and 5.9%Coal)
General Basic Materials 2.0%Total Basic Materials 26.3%Other Sectors 4.5%Repurchase Agreement 11.3%
100.0%
�35

Management Team’s PerspectivePrecious Metals and Minerals Funds
INTRODUCTION
The World Precious Minerals Fund (UNWPX and UNWIX) and the Goldand Precious Metals Fund (USERX) seek an objective of long-termcapital growth plus protection against inflation and monetary instability.The Gold and Precious Metals Fund focuses on equity securities of estab-lished gold and precious metals companies, and it pursues current incomeas a secondary objective. The World Precious Minerals Fund focuses onequity securities of companies principally engaged in the exploration,mining and processing of precious minerals such as gold, silver, platinumand diamonds. Although this fund has the latitude to invest in a broadrange of precious minerals, it currently remains focused on the gold sector.PERFORMANCE GRAPHS
World Precious Minerals Fund
Average Annual Performance For the Periods Ended June 30, 2010
Since Inception(Institutional
Six Month One Year Five Year Ten Year Class)World Precious Minerals Fund -
Investor Class 2.87% 44.13% 18.86% 21.13% n/a
World Precious Minerals Fund - Institutional Class(Inception 3/1/10) n/a n/a n/a n/a 3.46%
S&P 500 Index (6.65)% 14.43% (0.79)% (1.59)% (0.07)%
NYSE Arca Gold MinersIndex* 12.64% 37.78% 17.07% 18.87% 16.35%
* These are not total returns. These returns reflect simple appreciation only and do not reflectdividend reinvestment.Performance data quoted above is historical. Past performance is no guarantee of futureresults. Current performance may be higher or lower than the performance data quoted.Investment return and principal value of an investment will fluctuate so that an investor’sshares, when redeemed, may be worth more or less than their original cost. The graph andtable do not reflect the deduction of taxes that a shareholder would pay on fund distributionsor the redemption of fund shares. Returns for periods less than one year are not annualized.The Institutional Class commenced on March 1, 2010.The S&P 500 Index is a widely recognized capitalization-weighted index of 500 commonstock prices in U.S. companies. The NYSE Arca Gold Miners Index is a modified marketcapitalization-weighted index comprised of publicly-traded companies involved primarily inthe mining for gold and silver. The returns for the indexes reflect no deduction for fees,expenses or taxes.Pursuant to a voluntary arrangement, the Adviser has agreed to limit total fund operatingexpenses (exclusive of acquired fund fees and expenses, extraordinary expenses, taxes, broker-age commissions and interest, and advisory fee performance adjustments, if any) to notexceed 1.90% for the investor class. Also pursuant to a voluntary agreement, the Adviser hasagreed to waive all class specific expenses of the institutional class. The Adviser can modify orterminate these arrangements at any time.�36

Precious Metals and Minerals Funds
Gold and Precious Metals Fund
Average Annual Performance For the Periods EndedJune 30, 2010
Six Month One Year Five Year Ten Year
Gold and Precious MetalsFund 7.24% 33.72% 22.62% 22.06%
S&P 500 Index (6.65)% 14.43% (0.79)% (1.59)%
FTSE Gold Mines Index* 10.92% 31.04% 16.38% 15.48%* These are not total returns. These returns reflect simple appreciation only and do not reflectdividend reinvestmentPerformance data quoted above is historical. Past performance is no guarantee of futureresults. Current performance may be higher or lower than the performance data quoted.Investment return and principal value of an investment will fluctuate so that an investor’sshares, when redeemed, may be worth more or less than their original cost. The graph andtable do not reflect the deduction of taxes that a shareholder would pay on fund distributionsor the redemption of fund shares. Returns for periods less than one year are not annualized.The S&P 500 Index is a widely recognized capitalization-weighted index of 500 commonstock prices in U.S. companies. The FTSE Gold Mines Index encompasses all gold miningcompanies that have a sustainable and attributable gold production of at least 300,000 ouncesa year and that derive 75% or more of their revenue from mined gold. The returns for theindexes reflect no deduction for fees, expenses or taxes.Pursuant to a voluntary arrangement, the Adviser has agreed to limit total fund operatingexpenses (exclusive of acquired fund fees and expenses, extraordinary expenses, taxes, broker-age commissions and interest, and advisory fee performance adjustments, if any) to notexceed 1.90%. The Adviser can modify or terminate this arrangement at any time.
Please visit our website at www.usfunds.com for updated performanceinformation for different time periods.
�37

Precious Metals and Minerals Funds
THE SIX-MONTH PERIOD IN REVIEW -ECONOMIC AND POLITICAL ISSUES THATAFFECTED THE FUND
Gold demand from China and India remained strong through the first halfof 2010 despite high bullion prices. This suggests that consumers in the twotop gold-consuming nations are growing accustomed to higher gold prices.Indian demand rose 698 percent in the first quarter of 2010, while Chinagained 59 percent in the first half of 2010.
Central bank gold sales have remained very low – this trend has supportedthe gold price by limiting the supply of gold available on the market.Central banks sold just 7.2 tons of gold in the six-month period under anagreement that allows up to 400 tons to be sold annually.
China, which buys virtually all of the gold produced within the country,recently added a new dimension to its off-market purchases. ChinaNational Gold Group Corp.,(1) a private company and China’s largest goldproducer, will purchase and process gold concentrates under a long-termcontract from the Kensington Mine in Alaska. China offered payment forthe gold within seven days of delivery versus the traditional three-monthwait for payment from many smelters. This provides an innovative sourcefor China to increase its gold holdings without going into the open market.
The World Economic Forum (WEF) has stated that unsustainable sover-eign debt levels ranked among the top three global economic risks for theyear ahead. Moody’s echoed this theme: it says the five biggest AAA-ratedcountries – the U.S., Britain, Germany, France and Spain are all at risk ofsoaring debt cost and will have to implement austerity plans that threaten‘‘social cohesion.’’
Higher taxes and more layers of regulation are consistent governmentalthemes. The U.S. government has enacted a sweeping financial reformlaw, while Australia’s prime minister proposed a ‘‘super profits’’ tax of 30percent on certain mining projects starting in July 2012. Germany’s AngelaMerkel encouraged global economic powers to send a ‘‘signal of strength’’by agreeing to a more forceful financial regulation.
INVESTMENT HIGHLIGHTS
The World Precious Minerals Fund began offering an institutional class ofshares on March 1, 2010. Performance of the Institutional Class is includedin the performance graph on the previous page. As the Institutional Classhad less than six months of operations, the following discussion of per-formance is for the six month period ended June 30, 2010, of the InvestorClass.�38
Precious Metals and Minerals Funds
For the six-month period ending June 30, 2010, the World Precious Miner-als Fund (Investor Class) returned 2.87 percent, while its benchmarkNYSE Arca Gold Miners Index rose 13.00 percent on a total return basis.The Gold and Precious Metals Fund gained 7.24 percent, compared to the10.92 percent return of its benchmark, the FTSE Gold Mines Index.
Both funds underperformed their benchmarks primarily due to theirhigher relative exposure to smaller capitalization stocks. The MarketVectors Junior Gold Miners Total Return Index(2) returned 7.81 percent,while the S&P/TSX Venture Composite Index(3) posted a negative returnof 8.31 percent.
Spot gold finished the period at $1,242.25, up $145.30, or 13.25 percent.The S&P 500 Index posted a negative return of 6.65 percent, the U.S.Trade Weighted Dollar Index(4) increased 10.48 percent, and the yield onthe 90-day Treasury bill rose from 0.05 percent to 0.18 percent.
Because the fund is actively managed, and a holding period is generallynot a consideration in investment decisions, the portfolio turnover ratemay fluctuate from year to year as the fund adjusts its portfolio composi-tion. Its annual portfolio turnover was, and is expected to continue to be,more than 100 percent.
Strengths
• Red Back Mining, Inc.(5) was the top performance contributor for bothfunds in the first half of the year, with a price rise of 76.66 percent as thecompany demonstrated significant growth in its resource base.
• Centamin Egypt Ltd.,(6) an up-and-coming gold producer, successfullycommissioned its Sukari mine. This lifted the share price 22.62 percentfor the half, and significantly helped the performance of the Gold andPrecious Metals Fund.
• Randgold Resources Ltd.(7) remains a consistent performer, with areturn of 20.02 percent over the six months. Randgold was the largestholding in both funds during the period. This helped the performance ofboth the Gold and Precious Metals Fund and the World PreciousMinerals Fund. The funds hold a larger weighting than the benchmarks.
Weaknesses
• South Africa reported that the country’s gold production extended itsdownward slide. Once by far the world’s largest producer, South Africahas fallen quickly and now trails China, the United States and Australia.
�39
Precious Metals and Minerals Funds
• China’s State Administration of Foreign Exchange proclaimed, ‘‘thegold market is too small, illiquid and volatile to be considered suitablefor asset allocation.’’
CURRENT OUTLOOK
Opportunities
• A recent UBS poll of more than 80 reserve managers concluded thatgold was expected to be the strongest asset class for the rest of the year,and 22 percent of the managers predicted that gold would be the mostimportant reserve asset of the next 25 years.
• The World Gold Council (WGC) noted that gold consumption in Chinais expected to double over the next decade. Were this to come to pass,China’s known unmined gold reserves would be depleted in just sixyears. The WGC also forecasts gold imports into India may match orexceed last year’s estimate of 480 to 500 tons and that gold prices couldadvance to as high as $1,300 per ounce in the coming year.
• Martin Murenbeeld, a prominent gold analyst at Dundee Wealth Eco-nomics, noted that we are entering a multi-year period of sovereign debtproblems stemming from several decades of expansionary governmentspending. This supports a positive long-term macro picture for gold.
Threats
• The African National Congress, which is in power in South Africa, ispushing for nationalization of at least 60 percent of the country’s miningsector. This would likely involve expropriation with or without compen-sation. Some analysts believe the proposal is unlikely to become govern-ment policy, and President Jacob Zuma has made statementsreaffirming a free-market approach to government. Still, the prospect ofnationalization has rattled investors.
• A recent Gluskin Sheff report highlights the impact of bear marketsover the past 125 years. Looking at the Dow Jones Industrial Average(8)
(and adjusting for inflation), the average bear market of 16 years prettymuch wipes out all the gains from the previous bull market.
• An online commodity poll documented that 93 percent of investorsbelieve the gold price will fall in the near term due to a recovery inglobal equity markets and a rise in interest rates.
(1)Neither fund held this security at 06/30/10. (2)The Market Vectors Junior Gold Miners Total Return Index consists of small-cap
gold and silver mining companies listed in freely investable markets around theworld. The index is float-adjusted and modified market cap-weighted with nosingle stock accounting for more than 8% of the index. �40

Precious Metals and Minerals Funds
(3)The S&P/TSX Venture Composite Index is a broad market indicator for theCanadian venture capital market. The index is market capitalization weightedand, at its inception, included 531 companies. A quarterly revision process is usedto remove companies that comprise less than 0.05% of the weight of the index,and add companies whose weight, when included, will be greater than 0.05% ofthe index.
(4)The U.S. Trade Weighted Dollar Index provides a general indication of theinternational value of the U.S. dollar.
(5)This security comprised 4.85% of the total net assets of the World PreciousMinerals Fund and 5.65% of the total net assets of the Gold and Precious MetalsFund as of 06/30/10.
(6)This security comprised 4.07% of the total net assets of the World PreciousMinerals Fund and 5.69% of the total net assets of the Gold and Precious MetalsFund as of 06/30/10.
(7)This security comprised 3.55% of the total net assets of the World PreciousMinerals Fund and 0.00% of the total net assets of the Gold and Precious MetalsFund as of 06/30/10.
(8)The Dow Jones Industrial Average is a price-weighted average of 30 blue chipstocks that are generally leaders in their industry.
�41
Precious Metals and Minerals Funds
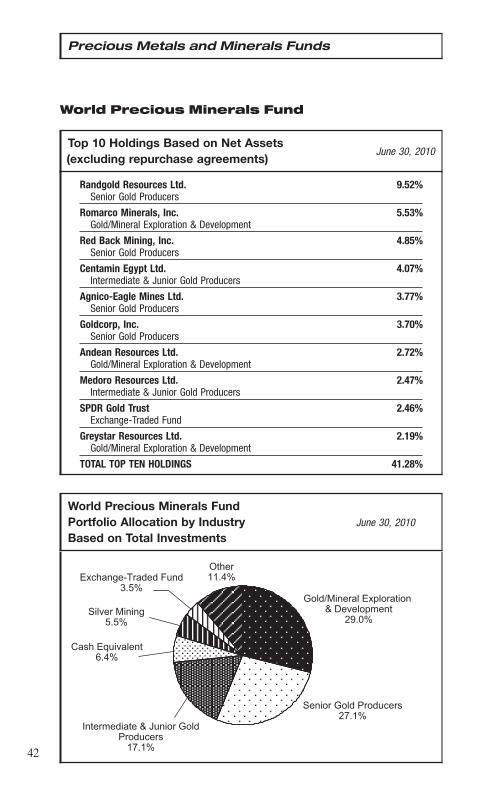
World Precious Minerals Fund
Top 10 Holdings Based on Net AssetsJune 30, 2010
(excluding repurchase agreements)
Randgold Resources Ltd. 9.52%Senior Gold Producers
Romarco Minerals, Inc. 5.53%Gold/Mineral Exploration & Development
Red Back Mining, Inc. 4.85%Senior Gold Producers
Centamin Egypt Ltd. 4.07%Intermediate & Junior Gold Producers
Agnico-Eagle Mines Ltd. 3.77%Senior Gold Producers
Goldcorp, Inc. 3.70%Senior Gold Producers
Andean Resources Ltd. 2.72%Gold/Mineral Exploration & Development
Medoro Resources Ltd. 2.47%Intermediate & Junior Gold Producers
SPDR Gold Trust 2.46%Exchange-Traded Fund
Greystar Resources Ltd. 2.19%Gold/Mineral Exploration & Development
TOTAL TOP TEN HOLDINGS 41.28%
World Precious Minerals FundPortfolio Allocation by IndustryBased on Total Investments
June 30, 2010
�42

Precious Metals and Minerals Funds
Gold and Precious Metals Fund
Top 10 Holdings Based on Net AssetsJune 30, 2010
(excluding repurchase agreements)
Randgold Resources Ltd. 9.92%Gold Mining
Barrick Gold Corp. 7.25%Gold Mining
Agnico-Eagle Mines Ltd. 6.91%Gold Mining
Centamin Egypt Ltd. 5.69%Gold Mining
Red Back Mining, Inc. 5.65%Gold Mining
Newmont Mining Corp. 5.46%Gold Mining
Dundee Precious Metals, Inc. 4.24%Gold Mining
SPDR Gold Trust 3.83%Exchange-Traded Fund
Kinross Gold Corp. 2.93%Gold Mining
Silver Wheaton Corp. 2.89%Silver Mining
TOTAL TOP TEN HOLDINGS 54.77%
Gold and Precious Metals FundPortfolio Allocation by IndustryBased on Total Investments
June 30, 2010
�43

Management Team’s Perspective
Eastern European Fund
INTRODUCTION
The investment objective of the Eastern European Fund (EUROX) is toachieve long-term capital growth by investing in a non-diversified port-folio of equity securities of companies located in the emerging markets ofEastern Europe.(1)
PERFORMANCE GRAPH
Eastern European Fund
Average Annual Performance For the Periods EndedJune 30, 2010
Six Month One Year Five Year Ten YearEastern European Fund (10.32)% 22.49% 3.49% 15.30%
S&P 500 Index (6.65)% 14.43% (0.79)% (1.59)%
MSCI Emerging MarketsEurope 10/40 Index(Net Total Return) (9.31)% 31.29% 8.41% 10.50%
Performance data quoted above is historical. Past performance is no guarantee of futureresults. Current performance may be higher or lower than the performance data quoted.Investment return and principal value of an investment will fluctuate so that an investor’sshares, when redeemed, may be worth more or less than their original cost. Foreign andemerging market investing involves special risks such as currency fluctuation and less publicdisclosure, as well as economic and political risk. The graph and table do not reflect thededuction of taxes that a shareholder would pay on fund distributions or the redemption offund shares. Returns for periods less than one year are not annualized.The S&P 500 Index is a widely recognized capitalization-weighted index of 500 commonstock prices in U.S. companies. The MSCI Emerging Markets Europe 10/40 Index (Net TotalReturn) is a free float-adjusted market capitalization index that is designed to measure equityperformance in the emerging market countries of Europe (Czech Republic, Hungary, Poland,Russia, and Turkey). The index is calculated on a net return basis (i.e., reflects the minimumpossible dividend reinvestment after deduction of the maximum rate withholding tax). Theindex is periodically rebalanced relative to the constituents’ weights in the parent index. Thereturns for the indexes reflect no deduction for fees, expenses or taxes, except as noted above.Pursuant to a voluntary arrangement, the Adviser has agreed to limit total fund operatingexpenses (exclusive of acquired fund fees and expenses, extraordinary expenses, taxes, broker-age commissions and interest, and advisory fee performance adjustments, if any) to notexceed 2.85%. The Adviser can modify or terminate this arrangement at any time.
Please visit our website at www.usfunds.com for updated performanceinformation for different time periods.�44

Eastern European Fund
THE SIX-MONTH PERIOD IN REVIEW -ECONOMIC AND POLITICAL ISSUES THATAFFECTED THE FUND
The first half of 2010 was characterized by increasingly positivemacroeconomic data flow. Because the Russian economy had been slow torecover, the government continued to provide stimulus by lowering inter-est rates below 8 percent and expanding the monetary base by 33 percentyear over year in April. These measures ran counter to the other BRIC(2)
countries, where signs of overheating led policymakers to apply thebrakes. The green shoots of this recovery are now clearly seen across theRussian economic landscape. Industrial production in June ticked upnearly 10 percent after expanding 12.6 percent in May, while June unem-ployment dropped to 6.8 percent. Retail sales rose during each of the sixmonths, jumping 5.8 percent in June.
The recovery was more robust in Turkey, where GDP expanded 11.7percent in the first quarter alone. The region’s most vibrant economyrebounded on strength in exports and domestic demand. Borrowing ratestouched a four-decade low, spurring double-digit loan growth in the firsthalf of the year among the nation’s banks.
With subdued inflation risk, both Russia and Turkey are likely to maintaina lower interest rate environment for an extended period. Global defla-tionary forces create an opportunity for structural changes in the econo-mies that have historically struggled under the burden of high domesticinflation. Against this stable macroeconomic backdrop, the Russian rubleand Turkish lira remained relatively unchanged relative to the U.S. dollar.
The same cannot be said about other currencies in the region. The eurolost 15 percent of its value amid concerns about the possibility of a Greeksovereign debt default. The Polish zloty underwent depreciation of thesame magnitude against the U.S. dollar, while the Czech koruna depreci-ated 12 percent.
Hungary’s forint was the most battered currency, declining 18.5 percent inthe first six months of the year. Hungary’s domestic demand has beencontracting for three years amid an austerity program separate from theInternational Monetary Fund (IMF) support deal. After elections in May,the new government has plans to grow the economy via fiscal spending andhas tried without success to renegotiate the IMF deal.
While a weaker euro is a sign of structural problems in the EuropeanUnion, it made German exports more competitive. German firms in turnrely on suppliers from Eastern Europe, and industrial production in Czech
�45

Eastern European Fund
Republic, Slovakia, and Hungary saw double digit percentage growth inMay.
INVESTMENT HIGHLIGHTS
Overview
The fund returned negative 10.32 percent in the first half of calendar 2010,compared to a negative 9.31 percent return for the benchmark MSCIEmerging Europe 10/40 Index.
Strengths
• Russia’s domestic sectors have proven resilient through the recentmarket downturn. Stocks with the most domestic exposure – retailers,utilities and cellular operators – have outperformed key naturalresources like steel, oil and gas.
• The fund’s relative overweight in Turkey contributed to performance, asthis was the best-performing market in the region. Banks led theadvance, with Turkiye Is Bankasi(3) gaining 13 percent during theperiod.
• Select materials names, particularly those with exposure to preciousmetals, contributed to performance. One example is the Russian com-pany Polymetal,(4) which gained 37 percent.
• In the energy space, NovaTek OAO(5) continued to grow productionand reserves. The stock bucked the negative trend for the industry bygaining 10 percent.
• The fund was significantly underweight Central European equities outof concern that they would be negatively impacted by currency devalua-tion stemming from the Greek crisis contagion. This concern has largelymaterialized in the first half of the year.
Weaknesses
• Even though European prices for spot gas edged up 5 percent on higherdemand in April, the gap with oil-linked Russian exports widened.Gazprom OAO(6) shares declined 24 percent in the first six months ofthe year.
• Faced with a budget deficit, the Russian government decided on an earlyend to the export duty waiver for Greenfield development in EastSiberia. As a result, Rosneft Oil Co. OJSC(7) declined 28 percent.
�46

Eastern European Fund
• Sberbank RF(8) continued to attract customer deposits and grow retailloans, but shares ended the first half down 13 percent due to anemicgrowth in corporate lending.
CURRENT OUTLOOK
Opportunities
• Better relations between Russia and the U.S. may improve the percep-tion of U.S. investors of the balance of risks and opportunities ofinvesting in Russia’s stock market.
• The massive Gulf of Mexico oil spill and the U.S. government’s subse-quent ban on deepwater drilling may highlight the relative cost advan-tages of Russian onshore producers and the valuation gap to the globalmajors could begin to close.
• Adoption of a fiscal rule in Turkey may trigger sovereign-bond creditrating upgrades to investment grade. The law, set to take effect in 2011,aims at cutting the budget deficit to 1 percent of GDP and the debt-to-GDP ratio to some 30 percent in five to ten years.
Threats
• Reliance on state support is potentially risky for minority shareholdersof Russian electricity distribution companies. Minority shareholdersmay face a considerable dilution if the state provides money for capitalexpenditure programs via additional share issuance, as occurred forfederal transmission and hydro generation companies in 2009 -2010.
• The prospect of shale gas in Europe substituting export from the formerSoviet Union states has been given much favorable coverage in thepress. Unconventional gas resources in Europe, however, are far smallerthan those of North America and are unlikely to achieve similar econo-mies of scale.
• Severe heat and drought conditions prevailing in the European part ofRussia may affect wheat harvest and increase feedstock costs for agri-cultural producers.
• The Polish government has taken advantage of improved market condi-tions to shore up its budget deficit by continuing to tap equity markets.A steady pipeline of state and private IPOs may exceed demand for newequity offerings.
(1)The following countries are considered to be in the Eastern European region:Albania, Armenia, Azerbaijan, Belarus, Bulgaria, Croatia, Czech Republic, Esto-nia, FYR Macedonia, Georgia, Hungary, Latvia, Lithuania, Moldova, Poland,Romania, Russia, Slovakia, Slovenia, Turkey and Ukraine. �47

Eastern European Fund
(2)BRIC refers to the emerging market countries Brazil, Russia, India and China.(3)This security comprised 2.26% of the fund’s total net assets as of 06/30/10. (4)This security comprised 1.25% of the fund’s total net assets as of 06/30/10. (5)This security comprised 4.84% of the fund’s total net assets as of 06/30/10. (6)This security comprised 3.00% of the fund’s total net assets as of 06/30/10. (7)This security comprised 4.28% of the fund’s total net assets as of 06/30/10. (8)This security comprised 10.74% of the fund’s total net assets as of 06/30/10.
�48

Eastern European Fund
Top 10 Holdings Based on Net AssetsJune 30, 2010
(excluding repurchase agreements)
Sberbank RF 10.74%Commercial Banks - Non US
NovaTek OAO 4.84%Oil & Gas Exploration & Production
Turkiye Garanti Bankasi A.S. 4.79%Commercial Banks - Non US
Rosneft Oil Co. OJSC 4.28%Oil & Gas - Integrated
Lukoil OAO 3.28%Oil & Gas - Integrated
Mechel 3.21%Steel - Producers
Gazprom OAO 3.00%Oil & Gas - Integrated
VTB Bank OJSC 2.54%Commercial Banks - Non US
X5 Retail Group N.V. 2.41%Retail
Novolipetsk Steel 2.41%Steel - Producers
TOTAL TOP TEN HOLDINGS 41.50%
Country Distribution*Based on Total Investments(excluding repurchase agreement)
June 30, 2010
* Country distribution shown is based on domicile and the locale of companyoperations may be different. �49

Management Team’s Perspective
Global Emerging Markets Fund
INTRODUCTION
The investment objective of the Global Emerging Markets Fund(GEMFX) is to achieve long-term capital growth by investing in a non-diversified portfolio of the equity securities of companies located in orwith a significant business presence in emerging market countries.(1)
PERFORMANCE GRAPH
Global Emerging Markets Fund
Average Annual Performance For the Periods EndedJune 30, 2010
Six Month One Year Five Year InceptionGlobal Emerging Markets Fund
(Inception 2/24/05) (5.91)% 16.15% 1.71% 0.51%
S&P 500 Index (6.65)% 14.43% (0.79)% (0.43)%
MSCI Emerging Markets NetTotal Return Index (6.17)% 23.15% 12.72% 11.68%
Performance data quoted above is historical. Past performance is no guarantee of futureresults. Current performance may be higher or lower than the performance data quoted.Investment return and principal value of an investment will fluctuate so that an investor’sshares, when redeemed, may be worth more or less than their original cost. Foreign andemerging market investing involves special risks such as currency fluctuation and less publicdisclosure, as well as economic and political risk. The graph and table do not reflect thededuction of taxes that a shareholder would pay on fund distributions or the redemption offund shares. Returns for periods less than one year are not annualized.The S&P 500 Index is a widely recognized capitalization-weighted index of 500 common stockprices in U.S. companies. The MSCI Emerging Markets Net Total Return Index is a free float-adjusted market capitalization index that is designed to measure equity market performance inemerging market countries on a net return basis (i.e., reflects the minimum possible dividendreinvestment after deduction of the maximum rate withholding tax). The returns for theindexes reflect no deduction for fees, expenses or taxes, except as noted above.Pursuant to a voluntary arrangement, the Adviser has agreed to limit total fund operatingexpenses (exclusive of acquired fund fees and expenses, extraordinary expenses, taxes, broker-age commissions and interest, and advisory fee performance adjustments, if any) to not exceed3.15%. The Adviser can modify or terminate this arrangement at any time.
Please visit our website at www.usfunds.com for updated performanceinformation for different time periods.�50

Global Emerging Markets Fund
THE SIX-MONTH PERIOD IN REVIEW -ECONOMIC AND POLITICAL ISSUES THATAFFECTED THE FUND
From the beginning of the year many investors began to feel uncomforta-ble with the near-term prospects for China in light of rapid real-estateappreciation that many labeled a dangerous ‘‘bubble.’’ Despite naysayingrhetoric, the Chinese economy continues to grow, with exportsrebounding early in the year after 16 consecutive months of declines.
In addition, the Beijing government remains committed to recalibrating itseconomy toward domestic consumption that would, in the long term,provide more stability than reliance on exports and fixed-asset invest-ments. This is why the government has increased spending on social safety-net programs to encourage people to increase spending.
Turkey seems to be the most vibrant among the European emergingeconomies. GDP grew 11.7 percent in the first quarter alone, mainly due tothe strength of exports and robust domestic demand. In addition, lowerinterest rates contributed to double-digit loan growth in the first half of theyear among the nation’s banks.
The Russian government stimulated the country’s struggling economy bylowering interest rates and expanding the monetary base by 33 percentyear over year in April. Industrial production in June ticked up nearly 10percent after expanding 12.6 percent in May, while June unemploymentdropped to 6.8 percent. Retail sales rose during each of the six months,jumping 5.8 percent in June.
In Latin America, the performance was mixed in the first half of 2010. Themost liquid market, Brazil, underperformed due to a subdued outlook forcommodities early in the year and new equity issues coming to the marketin abundance. By contrast, Chile strongly outperformed and was the bestperformer in Latin America during the period. Many local pension funds,which are the driving force of the market, reduced international holdingsand increased local equity allocation.
Colombia also outperformed and is seen as one of the favorite markets formany investors in light of the election result that brought Mr. Juan ManuelSantos to power. Mr. Santos promises continuation of market friendlypolicies of the outgoing President Uribe.
�51

Global Emerging Markets Fund
INVESTMENT HIGHLIGHTS
Overview
The fund lost 5.91 percent for the six-month period ending June 30, 2010,compared to a negative 6.17 percent return for the MSCI EmergingMarkets Net Total Return Index, the fund’s benchmark.
Because the fund is actively managed, and a holding period is generallynot a consideration in investment decisions, the portfolio turnover ratemay fluctuate from year to year as the fund adjusts its portfolio composi-tion. Its annual portfolio turnover was, and is expected to continue to be,more than 100 percent.
Strengths
• The fund was overweight Russian equities, which outperformed duringthe first quarter. In addition, the fund was overweight Mexico andHungary, which, with returns of 9.99 percent and 9.61 percent, respec-tively, outperformed and were among the best performers in the index.
• Although Brazil has been a laggard among Latin American countriesdue to new equity issues and volatility in commodities, retail stocks inthat market outperformed. Lojas Renner S.A.(2) registered a 24 percentappreciation in the first half of the year.
• Baidu, Inc.,(3) a Chinese internet search engine, was another significantcontributor to performance as the company benefited from troubles forGoogle, Inc.(4) early in the year. The stock returned 69 percent in sixmonths.
• Overweighting Turkey also helped the performance of the fund. Thatmarket is seen as most robust among the European emerging markets.One of the best performers was Turkiye Is Bankasi,(5) which returned 45percent to the fund.
Weaknesses
• In the second quarter, the fund was overweight Russia, Poland andHungary, all of which underperformed.
• The performance of the Chinese stocks was uneven. One of the detrac-tions from performance was Duoyuan Global Water, Inc.,(4) an infra-structure play on water.
• The fund invested cautiously in the Greek equities, before they foundthe bottom. As a result, National Bank of Greece S.A.(6) returned anegative 41 percent.
�52

Global Emerging Markets Fund
CURRENT OUTLOOK
Opportunities
• As the Chinese leadership embarked on the challenge of recalibratingthe economy away from fixed-asset investments toward domestic con-sumption, the fund adjusted its portfolio holdings to capture this trend.An overhaul of the social security system in China will likely encouragegreater consumption by households over time.
• Growth of per-capita income around the world has created opportuni-ties for protein producers, particularly in agriculture-rich countries likeBrazil and Australia. Demand for poultry, and to a lesser extent, forpork and beef are likely to remain strong for years to come.
• Urbanization in China remains an important trend – the country ispreparing for 90 million people to move to cities by 2015. This will besupportive of resources such as iron ore and copper.
Threats
• The talk about dangers in the Chinese real estate has put some investorson edge about the prospects of a correction. In the event of a significantcorrection, demand for many global commodities would likely fallprecipitously.
• The progress of recovery in the U.S. will have impact on China. Aslowdown, or worse a return to recession, in the U.S. in the second halfof 2010 would have an adverse effect on China’s GDP growth.
• Although the sovereign crisis in Europe has been centered on the PIGS(Portugal, Ireland, Greece and Spain), the situation in Hungary alsoremains precarious in light of mixed messages coming out of the newgovernment. A deterioration of the climate in Hungary would impactsentiment for other countries in the region.
• Escalation of violence in Mexico does not provide a level of comfort forinvestors in that country.
(1)Emerging market countries are those countries defined as such by the WorldBank, the International Finance Corporation, the United Nations or the Euro-pean Bank for Reconstruction and Development or included in the MSCI Emerg-ing Markets Index.
(2)This security comprised 3.18% of the fund’s total net assets as of 06/30/10. (3)This security comprised 1.74% of the fund’s total net assets as of 06/30/10. (4)The fund did not hold this security as of 06/30/10. (5)This security comprised 1.15% of the fund’s total net assets as of 06/30/10. (6)This security comprised 0.92% of the fund’s total net assets as of 06/30/10.
�53

Global Emerging Markets Fund
Top 10 Holdings Based on Net AssetsJune 30, 2010
(excluding repurchase agreements)
Randgold Resources Ltd. 4.03%Gold Mining
Lojas Renner S.A. 3.18%Department Stores
Naspers Ltd. 2.57%Multimedia
TNK-BP Holding 2.45%Oil & Gas - Integrated
Samsung Electronics Co., Ltd. 2.44%Electronics & Components
Wal-Mart de Mexico SAB de CV 2.33%Retail
Eldorado Gold Corp. 2.29%Gold Mining
SPDR Gold Trust 2.27%Exchange-Traded Fund
Opto Circuits India Ltd. 2.00%Healthcare Equipment & Services
Ctrip.com International Ltd. 1.92%E-Commerce
TOTAL TOP TEN HOLDINGS 25.48%
Country Distribution*Based on Total Investments(excluding repurchase agreement)
June 30, 2010
* Country distribution shown is based on domicile and the locale of companyoperations may be different.�54
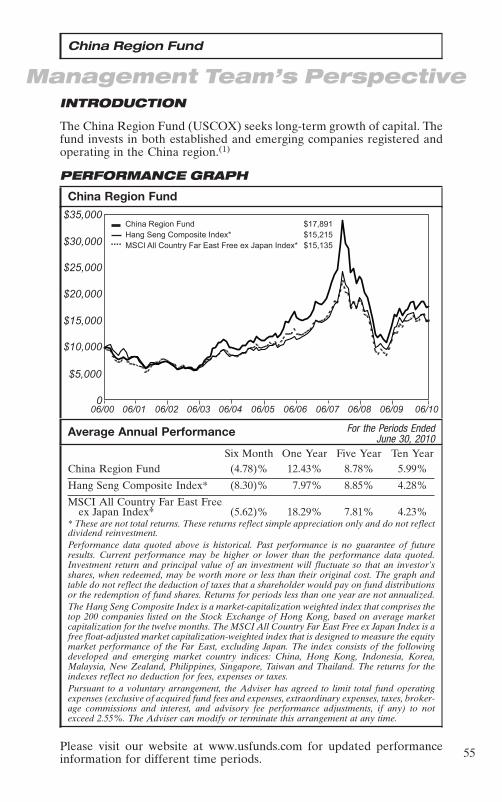
Management Team’s Perspective
China Region Fund
INTRODUCTION
The China Region Fund (USCOX) seeks long-term growth of capital. Thefund invests in both established and emerging companies registered andoperating in the China region.(1)
PERFORMANCE GRAPH
China Region Fund
Average Annual Performance For the Periods EndedJune 30, 2010
Six Month One Year Five Year Ten YearChina Region Fund (4.78)% 12.43% 8.78% 5.99%
Hang Seng Composite Index* (8.30)% 7.97% 8.85% 4.28%
MSCI All Country Far East Freeex Japan Index* (5.62)% 18.29% 7.81% 4.23%
* These are not total returns. These returns reflect simple appreciation only and do not reflectdividend reinvestment.Performance data quoted above is historical. Past performance is no guarantee of futureresults. Current performance may be higher or lower than the performance data quoted.Investment return and principal value of an investment will fluctuate so that an investor’sshares, when redeemed, may be worth more or less than their original cost. The graph andtable do not reflect the deduction of taxes that a shareholder would pay on fund distributionsor the redemption of fund shares. Returns for periods less than one year are not annualized.The Hang Seng Composite Index is a market-capitalization weighted index that comprises thetop 200 companies listed on the Stock Exchange of Hong Kong, based on average marketcapitalization for the twelve months. The MSCI All Country Far East Free ex Japan Index is afree float-adjusted market capitalization-weighted index that is designed to measure the equitymarket performance of the Far East, excluding Japan. The index consists of the followingdeveloped and emerging market country indices: China, Hong Kong, Indonesia, Korea,Malaysia, New Zealand, Philippines, Singapore, Taiwan and Thailand. The returns for theindexes reflect no deduction for fees, expenses or taxes.Pursuant to a voluntary arrangement, the Adviser has agreed to limit total fund operatingexpenses (exclusive of acquired fund fees and expenses, extraordinary expenses, taxes, broker-age commissions and interest, and advisory fee performance adjustments, if any) to notexceed 2.55%. The Adviser can modify or terminate this arrangement at any time.
Please visit our website at www.usfunds.com for updated performanceinformation for different time periods. �55
China Region Fund
THE SIX-MONTH PERIOD IN REVIEW -ECONOMIC AND POLITICAL ISSUES THATAFFECTED THE FUND
China’s swift action in addressing the financial crisis in 2008 helped globaleconomies resume growth in 2009. China’s economy grew 9.1 percent in2009 and accelerated this annual pace in the first quarter of 2010 to 11.9percent. Beginning in mid-2009, concerns arose that China’s economy wasrecovering too quickly. The central government stepped in to tamp downgrowth via a series of policy steps that included removing bank liquidity,reducing bank lending and slowing property price momentum.
After the massive investment in infrastructure in 2009, fixed-asset invest-ment (FAI) was bound to slow down. For 2009, year-over-year FAI was up30.5 percent and has since slowed to 25.5 percent in June 2010. Withgovernment concerns about overbuilding, FAI should moderate further inthe second half of 2010.
Exports have been positive for the last six months. This reflects somewhatimproved economic conditions in the U.S. and Europe, but more accu-rately reflects the increasing trade within Asia.
Retail sales are higher than a year ago. The Beijing government seesconsumption as a long-term driver of GDP growth and has increasedspending on social safety net programs to encourage people to save lessand spend more.
Money supply as measured by M2(2) was very strong in 2009, growing at anaverage rate of 27.7 percent. It has since moderated to 18.5 percent as ofJune 2010.
INVESTMENT HIGHLIGHTS
Overview
The fund returned negative 4.78 percent for the six-month time period,compared to a return of negative 6.64 percent (total return basis) for theHang Seng Composite Index (HSCI), its benchmark.
Because the fund is actively managed, and a holding period is generallynot a consideration in investment decisions, the portfolio turnover ratemay fluctuate from year to year as the fund adjusts its portfolio composi-tion. Its annual portfolio turnover was, and is expected to continue to be,more than 100 percent.
�56
China Region Fund
Strengths
• Country allocation helped the fund outperform the benchmark. Thefund allocated more to Indonesia and South Korea while loweringexposure to Hong Kong and China stocks. Positive contributors toperformance from Indonesia included PT Astra International Tbk,(3)
PT Unilever Indonesia Tbk,(4) PT Indofood Sukses Makmur Tbk(5) andBank Mandiri Tbk PT.(6) In South Korea, Samsung Techwin Co., Ltd.(7)
was the best contributor. Indonesia is an internal growth story with lessreliance on exports to the U.S. and Europe than many of its Asianneighbors. South Korea benefitted from stronger-than-expected growth.
• The focus on consumption as a driver of GDP growth was reflected intwo of the fund’s best performing Hong Kong stocks: Belle Interna-tional Holdings Ltd.(8) and Lianhua Supermarket Holdings Co., Ltd.(9)
Both stocks grew to large holdings as sales and earnings rose and thiswas reflected in share price performance.
• Travel is another area benefitting from a rising middle class. Afterbuying a home and a car, travel is most coveted by this burgeoninggroup. Two fund holdings that benefitted from this trend were HomeInns & Hotels Management, Inc.(10) and Wynn Macau Ltd.(11)
Weaknesses
• The best performing sector in the fund’s benchmark index, the HSCI,was telecommunications. The fund was underweight in this sector, how-ever, given the anemic growth in revenues and earnings.
• Technology was an underperforming sector due to flat earnings growth,which impacted holdings in the fund such as Tencent Holdings Ltd.(12)
CURRENT OUTLOOK
Opportunities
• In the second half of 2010, the question is how much China’s economywill slow and how much of that has already been priced into themarkets. With growing concerns about a slowdown or even a ‘‘double-dip’’ recession in the U.S. and Europe, China may ease up on its policiesdirected at slowing the economy. If that is the case, conditions shouldnot get worse and the stock markets may be poised for a rally in thesecond half of the year.
• Exports continue to surprise to the upside, reducing pressure on thegovernment to keep up a high fixed asset investment to maintain GDPgrowth at the 8 percent level.
�57

China Region Fund
• Urbanization remains an opportunity, as China expects another 90million people to move to cities by 2015. This is a long-term positive foriron ore, copper and other resources.
Threats
• The big threats of 2009 – deflation and deceleration – have beenreplaced by concerns over inflation and ‘‘imbalance.’’ While China’sinflation fell during most of 2009, this should reverse in 2010 as theglobal economy recovers. Imbalance refers to China’s overreliance onfixed-asset investment, which was the biggest contributor to GDP in2009. This is not healthy for the economy in the long run. China needsmore balance in its GDP components, meaning consumption has togrow.
• One key risk is related to inflation – the possibility of more aggressivepolicy tightening as CPI(13) rises. While there is no clear consensus as towhat level CPI needs to rise before interest rates are raised, many Chinastrategists believe action would result if CPI hits 3 percent.
• A threat external to China is the recovery in the United States. Somethink that a slowdown or a recession is possible in the second half of2010. If that happens, China’s GDP growth could weaken.
(1)The China region is defined as any country that either shares a border withChina or is located in the South China Sea or the East China Sea and includes:the People’s Republic of China (PRC or China), Bangladesh, Hong Kong, India,Indonesia, Kazakhstan, Korea, Kyrgyzstan, Laos, Malaysia, Mongolia, Nepal,Pakistan, Philippines, Singapore, Taiwan, Tajikistan, Thailand, and Vietnam.
(2)M1 and M2 are measures of total money supplies. M1 money supply includesfunds that are readily accessible for spending. M2 includes everything in M1 andalso all time-related deposits, savings deposits, and non-institutional money-market funds.
(3)This security comprised 2.76% of the fund’s total net assets as of 06/30/10. (4)This security comprised 1.56% of the fund’s total net assets as of 06/30/10. (5)This security comprised 2.66% of the fund’s total net assets as of 06/30/10. (6)This security comprised 2.60% of the fund’s total net assets as of 06/30/10. (7)This security comprised 2.71% of the fund’s total net assets as of 06/30/10. (8)This security comprised 2.98% of the fund’s total net assets as of 06/30/10. (9)This security comprised 2.30% of the fund’s total net assets as of 06/30/10.
(10)This security comprised 1.23% of the fund’s total net assets as of 06/30/10. (11)This security comprised 1.24% of the fund’s total net assets as of 06/30/10. (12)The fund did not hold this security as of 06/30/10. (13)The Consumer Price Index (CPI) is one of the most widely recognized price
measures for tracking the price of a market basket of goods and servicespurchased by individuals. The weights of components are based on consumerspending patterns.
�58

China Region Fund
Country Distribution*Based on Total Investments(excluding repurchase agreement)
June 30, 2010
* Country distribution shown is based on domicile and not intended to conform tothe China region definition in the prospectus.
�59

China Region Fund
Top 10 Holdings Based on Net AssetsJune 30, 2010
(excluding repurchase agreements)
Belle International Holdings Ltd. 2.98%Retail
PT Astra International Tbk 2.76%Auto Manufacturers
Samsung Techwin Co., Ltd. 2.71%Electronics & Components
China Resources Enterprise Ltd. 2.70%Diversified Operations
PT Indofood Sukses Makmur Tbk 2.66%Food & Beverages
Bank Mandiri Tbk PT 2.60%Commercial Banks - Non US
Zhaojin Mining Industry Co., Ltd. 2.46%Gold Mining
SPDR Gold Trust 2.39%Exchange-Traded Fund
Ctrip.com International Ltd. 2.37%E-Commerce
Lianhue Supermarket Holdings Co., Ltd. 2.30%Food-Retail
TOTAL TOP TEN HOLDINGS 25.93%
�60

Expense Example (unaudited) June 30, 2010
As a shareholder of the funds, you incur two types of costs: (1) transaction costs,including short-term trading fees and exchange fees; and (2) ongoing costs,including management fees and other fund expenses. This example is intendedto help you understand your ongoing costs (in dollars) of investing in othermutual funds.
The example is based on an investment of $1,000 invested at the beginning ofthe period and held for the entire period as indicated below.
• Actual Expenses. The first line of the following table for each fund providesinformation about actual account values and actual expenses. You may usethe information in this line, together with the amount you invested, toestimate the expenses you paid over the period. Simply divide your accountvalue by $1,000 (for example, an $8,600 account value divided by $1,000 =8.6), then multiply the result by the number in the first line under the heading‘‘Expenses Paid During Period’’ to estimate the expenses you paid on youraccount during this period.
• Hypothetical Example for Comparison Purposes. The second line of thefollowing table for each fund provides information about hypotheticalaccount values and hypothetical expenses based on the fund’s actual expenseratio and an assumed rate of return of 5 percent per year before expenses,which is not the fund’s actual return. The hypothetical account values andexpenses may not be used to estimate the actual ending account balance orexpenses you paid for the period. You may use this information to comparethe ongoing costs of investing in these funds and other funds. To do so,compare this 5 percent hypothetical example with the 5 percent hypotheticalexamples that appear in the shareholder reports of other funds.
Please note that the expenses shown in the table are meant to highlight yourongoing costs only and do not reflect any direct or transactional costs, such as smallaccount, exchange or short-term trading fees. Therefore, the second line of the tableis useful in comparing ongoing costs only, and will not help you determine therelative total costs of owning different funds. In addition, if these direct or transac-tional costs were included, your costs would have been higher.
�61

Expense Example (unaudited) June 30, 2010
Six Months Ended June 30, 2010 Beginning EndingAccount Value Account Value Expenses
January 1, June 30, Paid During2010 2010 Period
U.S. Treasury Securities Cash Fund*Based on Actual Fund Return $1,000.00 $1,000.00 $ 0.64Based on Hypothetical 5% Yearly Return $1,000.00 $1,024.15 $ 0.65U.S. Government Securities Savings
Fund*Based on Actual Fund Return $1,000.00 $1,000.00 $ 0.79Based on Hypothetical 5% Yearly Return $1,000.00 $1,024.00 $ 0.80Near-Term Tax Free Fund*Based on Actual Fund Return $1,000.00 $1,021.80 $ 2.26Based on Hypothetical 5% Yearly Return $1,000.00 $1,022.56 $ 2.26Tax Free Fund*Based on Actual Fund Return $1,000.00 $1,029.20 $ 3.52Based on Hypothetical 5% Yearly Return $1,000.00 $1,021.32 $ 3.51All American Equity Fund*Based on Actual Fund Return $1,000.00 $ 958.20 $ 9.52Based on Hypothetical 5% Yearly Return $1,000.00 $1,015.08 $ 9.79Holmes Growth Fund*Based on Actual Fund Return $1,000.00 $ 980.10 $ 9.13Based on Hypothetical 5% Yearly Return $1,000.00 $1,015.57 $ 9.30Global MegaTrends Fund Investor Class*Based on Actual Fund Return $1,000.00 $ 883.40 $10.32Based on Hypothetical 5% Yearly Return $1,000.00 $1,013.84 $11.03Global MegaTrends Fund Institutional
Class**Based on Actual Fund Return $1,000.00 $ 919.10 $ 7.85Based on Hypothetical 5% Yearly Return $1,000.00 $1,016.71 $ 8.15Global Resources Fund Investor Class*Based on Actual Fund Return $1,000.00 $ 936.70 $ 8.21Based on Hypothetical 5% Yearly Return $1,000.00 $1,016.31 $ 8.55Global Resources Fund Institutional
Class**Based on Actual Fund Return $1,000.00 $ 937.30 $ 5.38Based on Hypothetical 5% Yearly Return $1,000.00 $1,019.24 $ 5.61World Precious Minerals Fund Investor
Class*Based on Actual Fund Return $1,000.00 $1,028.70 $ 9.41Based on Hypothetical 5% Yearly Return $1,000.00 $1,015.52 $ 9.35World Precious Minerals Fund
Institutional Class**Based on Actual Fund Return $1,000.00 $1,034.60 $ 6.05Based on Hypothetical 5% Yearly Return $1,000.00 $1,018.84 $ 6.01Gold and Precious Metals Fund*Based on Actual Fund Return $1,000.00 $1,072.40 $ 9.71Based on Hypothetical 5% Yearly Return $1,000.00 $1,015.42 $ 9.44Eastern European Fund*Based on Actual Fund Return $1,000.00 $ 896.80 $ 8.79Based on Hypothetical 5% Yearly Return $1,000.00 $1,015.52 $ 9.35
�62

Expense Example (unaudited) June 30, 2010
Six Months Ended June 30, 2010 Beginning EndingAccount Value Account Value Expenses
January 1, June 30, Paid During2010 2010 Period
Global Emerging Markets Fund*Based on Actual Fund Return $1,000.00 $ 940.90 $14.05Based on Hypothetical 5% Yearly Return $1,000.00 $1,010.31 $14.55China Region Fund*Based on Actual Fund Return $1,000.00 $ 952.20 $10.79Based on Hypothetical 5% Yearly Return $1,000.00 $1,013.74 $11.13
*These calculations are based on expenses incurred in the most recent fiscal half-year. Thefunds’ Investor Class’s annualized expense ratios (after reimbursements and offsets) for thesix-month period ended June 30, 2010, were 0.13%, 0.16%, 0.45%, 0.70%, 1.96%, 1.86%,2.21%, 1.71%, 1.87%, 1.89%, 1.87%, 2.92% and 2.23%, respectively, for the U.S. TreasurySecurities Cash, U.S. Government Securities Savings, Near-Term Tax Free, Tax Free, AllAmerican Equity, Holmes Growth, Global MegaTrends, Global Resources, World PreciousMinerals, Gold and Precious Metals, Eastern European, Global Emerging Markets and ChinaRegion Funds. The dollar amounts shown as ‘‘Expenses Paid’’ are equal to the annualizedexpense ratio multiplied by the average account value over the period, multiplied by 181, thenumber of days in the most recent fiscal half-year, then divided by 365 days in the current fiscalyear.
**These calculations are based on expenses incurred in the period from March 1, 2010 toJune 30, 2010. The funds’ Institutional Class’s annualized expense ratios (after reimburse-ments and offsets) for the four-month period ended June 30, 2010, were 1.63%, 1.12% and1.20%, respectively, for the Global MegaTrends, Global Resources and World PreciousMinerals Funds. The dollar amounts shown as ‘‘Expenses Paid’’ are equal to the annualizedexpense ratio multiplied by the average account value over the period, multiplied by 122, thenumber of days in the period, then divided by 365 days in the current fiscal year.
�63

U.S. TREASURY SECURITIES CASH FUND
Portfolio of Investments (unaudited) June 30, 2010
UNITED STATESGOVERNMENT Coupon Maturity PrincipalOBLIGATIONS 56.99% Rate Date Amount Value
United States Treasury Bills 56.99%Yield 0.15% 07/01/10 $ 20,000,000 $ 20,000,000Yield 0.15% 07/08/10 10,000,000 9,999,718Yield 0.15% 07/15/10 10,000,000 9,999,436Yield 0.16% 07/29/10 20,000,000 19,997,511
Total United States Government Obligations 59,996,665
(cost $59,996,665)
REPURCHASE AGREEMENTS 62.01%
Joint Tri-Party Repurchase Agreements,06/30/10, collateralized by U.S. Treasurysecurities held in joint tri-partyrepurchase accounts:
0.01% Banc of America Securities LLCMerrill Lynch, repurchase price$19,500,005 0.01% 07/01/10 19,500,000 19,500,000
0.01% Credit Suisse Securities USA LLC,repurchase price $25,778,803 0.01% 07/01/10 25,778,795 25,778,795
0.02% UBS Financial Securities, Inc.,repurchase price $20,000,011 0.02% 07/01/10 20,000,000 20,000,000
Total Repurchase Agreements 65,278,795
(cost $65,278,795)
Total Investments 119.00% 125,275,460
(cost $125,275,460)Other assets and liabilities, net (19.00)% (20,002,732)
NET ASSETS 100% $105,272,728
See notes to portfolios of investments and notes to financial statements.
�64

U.S. GOVERNMENT SECURITIES SAVINGS FUND
Portfolio of Investments (unaudited) June 30, 2010
UNITED STATESGOVERNMENT AND AGENCY Coupon Maturity PrincipalOBLIGATIONS 100.03% Rate Date Amount Value
Federal Farm Credit Bank 18.89%Discount Notes:
Yield 0.01% 07/01/10 $ 20,000,000 $ 20,000,000Fixed Rate:
2.88% 09/22/10 5,000,000 5,029,788Variable Rates:
0.18% 09/16/10 10,000,000 9,998,9440.65% 10/15/10 1,350,000 1,351,5140.35% 11/02/10 1,725,000 1,725,4790.42% 07/01/11 5,000,000 5,007,104
43,112,829
Federal Home Loan Bank 76.76%Discount Notes:
Yield 0.02% 07/01/10 60,000,000 60,000,000Yield 0.06% 07/07/10 17,945,000 17,944,821Yield 0.16% 07/09/10 10,000,000 9,999,644Yield 0.11% 07/14/10 32,045,000 32,043,745Yield 0.19% 07/23/10 3,850,000 3,849,565Yield 0.11% 08/04/10 11,300,000 11,298,826Yield 0.22% 09/02/10 931,000 930,642Yield 0.13% 09/10/10 10,514,000 10,511,304Yield 0.17% 09/22/10 2,408,000 2,407,056Yield 0.23% 11/24/10 5,000,000 4,995,438
Fixed Rates:4.13% 08/13/10 2,000,000 2,008,2034.75% 08/13/10 2,450,000 2,463,1660.65% 05/19/11 2,000,000 1,999,823
Variable Rates:0.20% 07/13/10 10,000,000 9,999,9920.24% 11/08/10 1,250,000 1,249,2370.20% 05/06/11 3,500,000 3,498,325
175,199,787
United States Treasury Bill 4.38%Yield 0.11% 07/01/10 10,000,000 10,000,000
Total Investments 100.03% 228,312,616
(cost $228,312,616)Other assets and liabilities, net (0.03)% (70,369)
NET ASSETS 100% $228,242,247
See notes to portfolios of investments and notes to financial statements.
�65

NEAR-TERM TAX FREE FUND
Portfolio of Investments (unaudited) June 30, 2010
Coupon Maturity PrincipalMUNICIPAL BONDS 88.61% Rate Date Amount Value
Alabama 5.11%Alabama State Public School & College Authority 5.00% 12/01/16 $ 290,000 $ 334,127Bessemer, Alabama Water Revenue 4.00% 01/01/16 300,000 286,311Jasper Alabama Water Works & Sewer Board,
Inc., Utilities Revenue, Series A 3.00% 06/01/15 90,000 91,646Jasper Alabama Water Works & Sewer Board,
Inc., Utilities Revenue, Series A 3.00% 06/01/16 90,000 89,998Mountain Brook City Board of Education Capital
Outlay 4.00% 02/15/15 200,000 217,890University of Alabama at Birmingham, Hospital
Revenue, Series A 5.00% 09/01/15 300,000 328,287
1,348,259
Alaska 1.22%Alaska Municipal Bond Bank Authority, Series A 4.00% 02/01/16 300,000 322,287
Arizona 5.13%Arizona Board Regents Certificates of
Participation, Series B 4.50% 06/01/16 200,000 217,128Arizona Health Facilities Authority Revenues,
Series D 5.00% 01/01/14 250,000 270,220Arizona School Facilities Board Certificates,
Series A-1 5.00% 09/01/17 325,000 352,092Arizona State Transportation Board Excise Tax
Revenue 5.00% 07/01/17 175,000 201,915Pima County Unified School District, GO Unlimited,
Refunding 3.70% 07/01/12 300,000 314,676
1,356,031
California 2.18%San Diego, California Community College District,
Capital Appreciation, Election 2002,GO Unlimited (ZCB) 4.34%(1) 05/01/15 300,000 259,401
Vernon, California Electric Systems Revenue,Series A 3.75% 08/01/13 300,000 315,735
575,136
Connecticut 1.85%Connecticut State, Series D, GO Unlimited 5.38% 11/15/18 250,000 277,597Connecticut State, Series E, GO Unlimited 5.13% 11/15/14 200,000 211,408
489,005
See notes to portfolios of investments and notes to financial statements.
�66

NEAR-TERM TAX FREE FUND
Portfolio of Investments (unaudited) June 30, 2010
Coupon Maturity PrincipalMUNICIPAL BONDS Rate Date Amount Value
District of Columbia 2.49%District of Columbia Certifications of Participation 4.00% 01/01/14 $ 250,000 $ 262,187Washington D.C. Convention Center Authority
Dedicated Tax Revenue, Refunding, Series A 5.00% 10/01/13 110,000 119,854Washington D.C. Convention Center Authority
Dedicated Tax Revenue, Refunding, Series A 5.00% 10/01/16 250,000 275,245
657,286
Florida 5.71%Florida State Board of Education Lottery Revenue,
Series A 4.00% 07/01/14 300,000 326,847Fort Pierce, Florida Stormwater Utilities Revenue 4.50% 10/01/17 255,000 262,657Orange County, Florida Tourist Development Tax
Revenue, Refunding 5.00% 10/01/10 300,000 302,391Orange County, Florida Tourist Development Tax
Revenue, Refunding 5.00% 10/01/14 260,000 290,961Reedy Creek, Florida Improvement District Utilities
Revenue, Refunded, Series 2 5.00% 10/01/16 300,000 324,777
1,507,633
Georgia 2.65%Atlanta, Georgia Water & Wastewater Revenue,
Series B 3.50% 11/01/13 400,000 421,676Emanuel County Georgia Hospital Authority
Revenue Anticipation Certificates 4.30% 07/01/17 250,000 278,590
700,266
Illinois 11.23%Aurora, Illinois, Series B, GO Unlimited 3.00% 12/30/15 200,000 211,084Chicago, Illinois Sales Tax Revenue 5.50% 01/01/15 350,000 399,563Chicago, Illinois, Direct Access Bond,
Series E-1 B, GO Unlimited 4.00% 01/01/19 200,000 206,760Chicago, Illinois, Unrefunded Balance, Series B 5.13% 01/01/15 325,000 368,521Dundee Township, GO Unlimited 5.00% 12/01/13 240,000 265,152Illinois Finance Authority Revenue, Refunding 5.00% 07/01/16 390,000 423,614Illinois State Sales Tax Revenue 5.00% 06/15/14 200,000 221,508Illinois State Toll Highway Authority, Toll Highway
Revenue, Series A 5.00% 01/01/16 200,000 222,904Illinois State, Refunding, GO Unlimited 5.00% 01/01/16 300,000 326,658State of Illinois, First Series, Refunding 5.50% 08/01/19 300,000 320,547
2,966,311
See notes to portfolios of investments and notes to financial statements.
�67
NEAR-TERM TAX FREE FUND
Portfolio of Investments (unaudited) June 30, 2010
Coupon Maturity PrincipalMUNICIPAL BONDS Rate Date Amount Value
Indiana 4.82%Hamilton Heights Independent School 5.25% 07/15/11 $ 305,000 $ 319,826Indiana State Finance Authority Revenue,
Refunding 4.00% 05/01/12 350,000 369,404Noblesville Independent Redevelopment Authority
Lease Rent Revenue 5.00% 01/15/24 250,000 255,493Tippecanoe County, Indiana School Improvements 4.00% 01/15/15 300,000 328,968
1,273,691
Iowa 1.95%Ames, Iowa Hospital Revenue, Refunding 5.00% 06/15/15 300,000 304,908Johnston Community School District, GO Unlimited 4.00% 06/01/16 200,000 211,014
515,922
Kansas 0.83%Kansas State Development Finance Authority
Revenue 4.00% 10/01/15 200,000 219,996
Kentucky 1.22%Louisville & Jefferson County Metropolitan Sewer
District & Drain Systems, Series A 5.50% 05/15/15 300,000 320,997
Massachusetts 1.36%New Bedford, Massachusetts, State Qualified
Municipal Loan, GO Limited 3.00% 03/01/15 345,000 359,625
Michigan 4.60%Detroit, Michigan Sewer Disposal Revenue,
Refunding, Series C-1 5.25% 07/01/15 400,000 440,612Michigan State Building Authority Revenue,
Refunding, Series I 5.25% 10/15/14 300,000 324,204Michigan State Grant Anticipation Bonds 5.00% 09/15/16 200,000 222,680Michigan State Hospital Finance Authority
Revenue, Trinity Health, Series A 6.00% 12/01/18 200,000 227,840
1,215,336
Missouri 0.88%Missouri State Health & Educational Facilities
Authority Revenue, Series A 6.75% 05/15/13 200,000 233,498
See notes to portfolios of investments and notes to financial statements.
�68
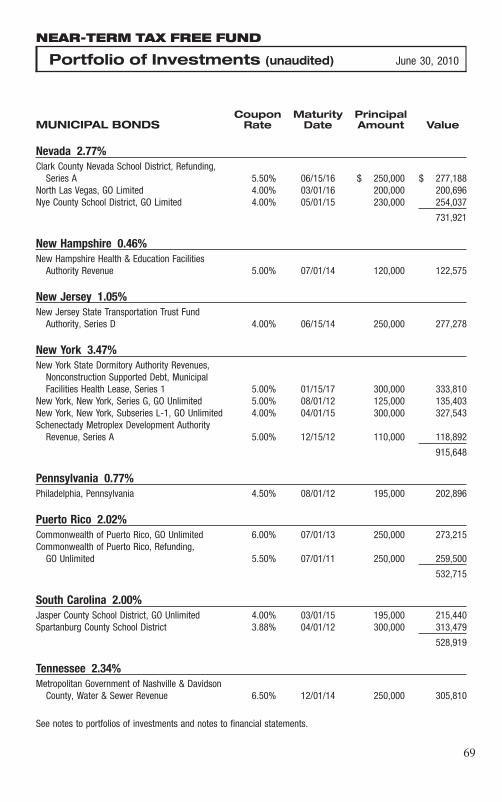
NEAR-TERM TAX FREE FUND
Portfolio of Investments (unaudited) June 30, 2010
Coupon Maturity PrincipalMUNICIPAL BONDS Rate Date Amount Value
Nevada 2.77%Clark County Nevada School District, Refunding,
Series A 5.50% 06/15/16 $ 250,000 $ 277,188North Las Vegas, GO Limited 4.00% 03/01/16 200,000 200,696Nye County School District, GO Limited 4.00% 05/01/15 230,000 254,037
731,921
New Hampshire 0.46%New Hampshire Health & Education Facilities
Authority Revenue 5.00% 07/01/14 120,000 122,575
New Jersey 1.05%New Jersey State Transportation Trust Fund
Authority, Series D 4.00% 06/15/14 250,000 277,278
New York 3.47%New York State Dormitory Authority Revenues,
Nonconstruction Supported Debt, MunicipalFacilities Health Lease, Series 1 5.00% 01/15/17 300,000 333,810
New York, New York, Series G, GO Unlimited 5.00% 08/01/12 125,000 135,403New York, New York, Subseries L-1, GO Unlimited 4.00% 04/01/15 300,000 327,543Schenectady Metroplex Development Authority
Revenue, Series A 5.00% 12/15/12 110,000 118,892
915,648
Pennsylvania 0.77%Philadelphia, Pennsylvania 4.50% 08/01/12 195,000 202,896
Puerto Rico 2.02%Commonwealth of Puerto Rico, GO Unlimited 6.00% 07/01/13 250,000 273,215Commonwealth of Puerto Rico, Refunding,
GO Unlimited 5.50% 07/01/11 250,000 259,500
532,715
South Carolina 2.00%Jasper County School District, GO Unlimited 4.00% 03/01/15 195,000 215,440Spartanburg County School District 3.88% 04/01/12 300,000 313,479
528,919
Tennessee 2.34%Metropolitan Government of Nashville & Davidson
County, Water & Sewer Revenue 6.50% 12/01/14 250,000 305,810
See notes to portfolios of investments and notes to financial statements.
�69

NEAR-TERM TAX FREE FUND
Portfolio of Investments (unaudited) June 30, 2010
Coupon Maturity PrincipalMUNICIPAL BONDS Rate Date Amount Value
Tennessee (Cont’d)Tennessee State, GO Unlimited, Refunding,
Series A 5.00% 05/01/11 $ 300,000 $ 311,379
617,189
Texas 12.03%Addison, Texas Certificates of Obligation,
GO Unlimited 4.00% 02/15/20 250,000 263,750Grand Prairie Independent School District,
Refunding, GO Unlimited (ZCB) 3.92%(1) 08/15/16 400,000 327,712Houston Texas, Public Improvement, Refunding,
Series A 5.38% 03/01/16 180,000 200,083Katy, Texas Independent School District, School
Building, Series D, GO Unlimited 4.50% 02/15/19 325,000 356,314Lewisville, Texas Independent School District,
GO Unlimited, Refunding (ZCB) 4.04%(1) 08/15/15 400,000 357,340Lower Colorado River Authority Texas, Refunding 5.25% 05/15/19 240,000 255,763North Texas Municipal Water District, Regional
Solid Waste Disposal Systems Revenue 3.00% 09/01/12 300,000 307,563Port Arthur, Texas, Refunding, GO Unlimited 2.85% 02/15/11 200,000 202,592San Antonio Water System Revenue 5.00% 05/15/13 100,000 103,400San Antonio, Texas Municipal Drain Utilities
Systems Revenue 4.00% 02/01/16 300,000 313,185San Patricio, Texas Municipal Water District,
Refunding 4.00% 07/10/18 200,000 204,282Texas Municipal Power Agency Revenue,
Refunding 5.00% 09/01/17 250,000 283,857
3,175,841
Utah 1.25%Utah State, Refunding, Series B, GO Unlimited 5.38% 07/01/12 300,000 328,929
Virginia 2.55%Virginia College Building Authority Educational
Facilities Revenue, Prerefunded, Series A 5.00% 09/01/15 10,000 11,680Virginia College Building Authority Educational
Facilities Revenue, Unrefunded, Series A 5.00% 09/01/15 290,000 335,310Virginia State Public Building Authority & Public
Facilities Revenue, Refunding, Series A 5.00% 08/01/12 300,000 326,715
673,705
Washington 2.47%Clark County, Washington School District,
GO Unlimited 5.13% 12/01/11 100,000 106,427
See notes to portfolios of investments and notes to financial statements.
�70

NEAR-TERM TAX FREE FUND
Portfolio of Investments (unaudited) June 30, 2010
Coupon Maturity PrincipalMUNICIPAL BONDS Rate Date Amount Value
Washington (Cont’d)Energy Northwest, Washington Electric Revenue 5.00% 07/01/14 $ 250,000 $ 284,460King County, Washington School District No. 401
Highline Public Schools, GO Unlimited 5.50% 12/01/13 240,000 262,598
653,485
Wisconsin 2.20%Chippewa Valley, Wisconsin, Technical College
District Promissory Notes, Series A,GO Unlimited 4.00% 04/01/14 250,000 272,525
Wisconsin State, Refunding, Series 2,GO Unlimited 4.13% 11/01/16 295,000 307,263
579,788
Total Municipal Bonds 23,402,168
(cost $22,618,989)
REPURCHASE AGREEMENT 9.65%
Joint Tri-Party Repurchase Agreement, CreditSuisse Securities USA LLC, 06/30/10, 0.01%,due 07/01/10, repurchase price $2,548,209,collateralized by U.S. Treasury securities held ina joint tri-party account (cost $2,548,208) 0.01% 07/01/10 2,548,208 2,548,208
Total Investments 98.26% 25,950,376
(cost $25,167,197)Other assets and liabilities, net 1.74% 460,798
NET ASSETS 100% $26,411,174
(1)Represents Yield
See notes to portfolios of investments and notes to financial statements.
�71

TAX FREE FUND
Portfolio of Investments (unaudited) June 30, 2010
Coupon Maturity PrincipalMUNICIPAL BONDS 92.96% Rate Date Amount Value
Alabama 6.34%Alabama 21st Century Authority, Tobacco
Settlement Revenue 5.75% 12/01/19 $ 275,000 $ 280,274Alabama State, GO Unlimited, Series A 4.63% 09/01/22 375,000 391,980Bessemer, Alabama Water Revenue 4.00% 01/01/16 200,000 190,874Mountain Brook City Board of Education Capital
Outlay 4.00% 02/15/15 195,000 212,443University of Alabama at Birmingham, Hospital
Revenue, Series A 5.00% 09/01/15 300,000 328,287
1,403,858
Arizona 1.23%University of Arizona Certificates of Participation,
Series C 5.00% 06/01/22 260,000 272,168
California 13.42%Anaheim, California City School District, Capital
Appreciation, Election 2002, GO Unlimited (ZCB) 4.60%(1) 08/01/28 580,000 178,518California State, GO Unlimited 5.00% 03/01/32 300,000 291,480California State, GO Unlimited 4.75% 03/01/34 205,000 186,788California State, GO Unlimited 5.00% 06/01/37 455,000 433,023Campbell, California Union High School District,
GO Unlimited 4.75% 08/01/34 300,000 294,501Chaffey Community College District, Series C,
GO Unlimited 5.00% 06/01/32 300,000 302,598Imperial Community College District, GO Unlimited 5.00% 08/01/29 500,000 504,210San Diego, California Community College District,
Capital Appreciation, Election 2002,GO Unlimited (ZCB) 4.34%(1) 05/01/15 450,000 389,102
Santa Clara Valley Transportation Authority,Refunding, Series A 5.00% 04/01/27 370,000 391,190
2,971,410
Colorado 0.70%Colorado Health Facilities Authority Revenue 5.00% 09/01/16 150,000 154,663
Connecticut 1.43%Connecticut State, Series E, GO Unlimited 5.13% 11/15/14 300,000 317,112
District of Columbia 1.50%District of Columbia Income Tax Revenue, Series A 5.25% 12/01/27 300,000 331,365
See notes to portfolios of investments and notes to financial statements.
�72

TAX FREE FUND
Portfolio of Investments (unaudited) June 30, 2010
Coupon Maturity PrincipalMUNICIPAL BONDS Rate Date Amount Value
Florida 1.39%Florida Board of Education, GO Unlimited,
Refunding, Series C 4.50% 06/01/28 $ 300,000 $ 307,965
Georgia 2.30%Atlanta Development Authority Revenue 5.25% 07/01/22 500,000 509,805
Guam 1.11%Guam Education Financing Foundation Certificate
of Participation, Series A 4.25% 10/01/18 250,000 246,400
Illinois 9.14%Chicago Board of Education, GO Unlimited 5.25% 12/01/19 300,000 343,557Chicago, Illinois Water Revenue, Refunding 5.75% 11/01/30 225,000 263,517Cook County, Illinois, Series A, Unrefunded 5.00% 11/15/28 325,000 326,011Du Page County, Refunding 5.60% 01/01/21 490,000 574,726Illinois Regional Transportation Authority Revenue,
Series A 7.20% 11/01/20 250,000 300,770State of Illinois, First Series, Refunding 5.50% 08/01/19 200,000 213,698
2,022,279
Indiana 1.40%Indianapolis Local Public Improvement Bond Bank,
Waterworks Project, Series 2007 L 5.25% 01/01/33 305,000 309,901
Kansas 6.38%Kansas State Development Finance Authority,
Hospital Revenue, Series Z 5.00% 12/15/12 500,000 507,835Kansas State Development Finance Authority
Revenue 4.00% 10/01/15 250,000 274,995University of Kansas Hospital Authority Health
Facilities Revenue 5.63% 09/01/27 570,000 629,611
1,412,441
Kentucky 1.06%Bowling Green, Kentucky, GO Unlimited, Series B 4.00% 09/01/16 215,000 234,950
Maryland 1.43%Maryland Health & Higher Educational Facilities
Authority Revenue 5.75% 07/01/21 300,000 315,810
See notes to portfolios of investments and notes to financial statements.
�73

TAX FREE FUND
Portfolio of Investments (unaudited) June 30, 2010
Coupon Maturity PrincipalMUNICIPAL BONDS Rate Date Amount Value
Massachusetts 1.49%Massachusetts Bay Transportation Authority,
Massachusetts Sales Tax Revenue, Refunding,Series A-1 5.25% 07/01/30 $ 285,000 $ 328,993
Michigan 2.07%Detroit, Michigan Local Development Financing
Authority, Refunding, Series A 5.38% 05/01/18 300,000 152,700Macomb County Building Authority, GO Limited 4.50% 11/01/23 300,000 306,480
459,180
Missouri 3.11%Kansas City Water Revenue 4.00% 12/01/22 250,000 273,285St. Louis Airport Development Program,
Prerefunded, Series A 5.00% 07/01/11 165,000 172,396St. Louis Airport Development Program,
Unrefunded, Series A 5.00% 07/01/11 235,000 241,803
687,484
Nevada 1.17%Nye County School District, GO Limited 4.00% 05/01/15 235,000 259,560
New Hampshire 2.21%Manchester, New Hampshire School Facilities
Revenue, Refunding 5.50% 06/01/26 300,000 360,441New Hampshire Health & Education Facilities
Authority Refunding 5.00% 07/01/14 125,000 127,682
488,123
New Jersey 2.08%New Jersey Health Care Facilities Financing
Authority Revenue 4.38% 07/01/10 460,000 460,000
Ohio 1.96%Ohio State Mental Health Facilities Revenue 5.50% 06/01/15 300,000 313,941South Euclid Special Assessment, GO Limited Tax 6.70% 12/01/14 110,000 119,252
433,193
See notes to portfolios of investments and notes to financial statements.
�74

TAX FREE FUND
Portfolio of Investments (unaudited) June 30, 2010
Coupon Maturity PrincipalMUNICIPAL BONDS Rate Date Amount Value
Puerto Rico 2.41%Commonwealth of Puerto Rico, GO Unlimited 6.00% 07/01/13 $ 250,000 $ 273,215Commonwealth of Puerto Rico, Refunding,
GO Unlimited 5.50% 07/01/11 250,000 259,500
532,715
Rhode Island 2.53%Rhode Island State Health & Educational Building
Corporation Revenue 6.50% 08/15/32 500,000 559,795
South Carolina 1.13%South Carolina Jobs Economic Development
Authority Revenue 5.00% 11/01/23 250,000 250,535
Tennessee 1.03%Memphis, Tennessee Sanitary Sewage System
Revenue, Refunding 5.00% 05/01/20 200,000 227,232
Texas 16.97%Baytown, Texas, GO Limited 4.50% 02/01/27 250,000 254,430Dallas, Texas Waterworks & Sewer Systems
Revenue, Refunding 4.50% 10/01/19 225,000 245,574Duncanville, Texas Independent School District,
GO Unlimited, Prerefunded, Series B 5.25% 02/15/32 495,000 531,368Duncanville, Texas Independent School District,
GO Unlimited, Unrefunded, Series B 5.25% 02/15/32 5,000 5,115Forney, Texas, GO Limited 5.00% 02/15/27 500,000 524,325Goose Creek, Texas Independent School District
Schoolhouse, Series A 5.25% 02/15/18 370,000 431,860Greenville, Texas Independent School District,
GO Unlimited, Refunding 4.00% 08/15/17 120,000 129,430Houston Community College System Revenue,
Refunding 4.00% 04/15/17 300,000 310,470North Texas Tollway Authority Revenue, Series F 5.75% 01/01/38 250,000 259,532Prosper, Texas Independent School District,
Capital Appreciation, School Building,GO Unlimited (ZCB) 6.00%(1) 08/15/33 1,000,000 301,840
San Marcos, Texas Tax & Toll Revenue,GO Limited 5.10% 08/15/27 400,000 429,020
White Settlement, Texas Independent SchoolDistrict, GO Unlimited 4.13% 08/15/15 300,000 334,047
3,757,011
See notes to portfolios of investments and notes to financial statements.
�75

TAX FREE FUND
Portfolio of Investments (unaudited) June 30, 2010
Coupon Maturity PrincipalMUNICIPAL BONDS Rate Date Amount Value
Utah 2.63%Utah State Building Ownership Authority, Lease
Revenue, Refunding, Series C 5.50% 05/15/19 $ 500,000 $ 581,315
Washington 2.71%King County, Washington School District No. 401
Highline Public Schools, GO Unlimited 5.50% 12/01/13 300,000 328,248Spokane County, Washington School District,
No. 81, GO Unlimited 5.05% 06/01/22 255,000 272,302
600,550
Wisconsin 0.63%Wisconsin State Health & Educational Facilities
Authority 5.50% 12/01/26 140,000 139,996
Total Municipal Bonds 20,575,809
(cost $19,885,776)
REPURCHASE AGREEMENT 4.68%
Joint Tri-Party Repurchase Agreement, Banc ofAmerica Securities LLC Merrill Lynch, 06/30/10,0.01%, due 07/01/10, repurchase price$1,036,817, collateralized by U.S. Treasurysecurities held in a joint tri-party account(cost $1,036,817) 0.01% 07/01/10 1,036,817 1,036,817
Total Investments 97.64% 21,612,626
(cost $20,922,593)Other assets and liabilities, net 2.36% 523,227
NET ASSETS 100% $22,135,853
(1)Represents Yield
See notes to portfolios of investments and notes to financial statements.
�76

ALL AMERICAN EQUITY FUND
Portfolio of Investments (unaudited) June 30, 2010
COMMON STOCKS 80.47% Shares Value
Aerospace/Defense 2.83%Lockheed Martin Corp. 2,000 $ 149,000Northrop Grumman Corp. 2,500 136,100Raytheon Co. 3,000 145,170
430,270
Applications Software 3.99%Compuware Corp. 17,000 135,660*Salesforce.com, Inc. 5,500 472,010*
607,670
Cable/Satellite TV 1.56%DIRECTV, Class A 7,000 237,440*
Chemicals 3.02%Eastman Chemical Co. 2,500 133,400EI du Pont de Nemours & Co. 4,000 138,360Kraton Performance Polymers, Inc. 10,000 187,900*
459,660
Coatings/Paint 0.91%Sherwin-Williams Co. 2,000 138,380
Computers 4.13%Apple, Inc. 2,500 628,825*
Data Processing 1.01%Dun & Bradstreet Corp. 2,300 154,376
Diversified Banking Institutions 1.89%Bank of America Corp. 20,000 287,400
Diversified Manufacturing Operations 0.79%Leggett & Platt, Inc. 6,000 120,360
Electric - Integrated 2.60%Entergy Corp. 1,800 128,916FirstEnergy Corp. 4,000 140,920Pepco Holdings, Inc. 8,000 125,440
395,276
See notes to portfolios of investments and notes to financial statements.
�77

ALL AMERICAN EQUITY FUND
Portfolio of Investments (unaudited) June 30, 2010
COMMON STOCKS Shares Value
Electronic Components - Semiconductors 3.21%Cree, Inc. 3,000 $ 180,090*Integrys Energy Group, Inc. 4,000 174,960QLogic Corp. 8,000 132,960*
488,010
Financial Services 1.95%E*Trade Financial Corp. 12,500 147,750*Invictus Financial, Inc. 131,125 131*Western Union Co. 10,000 149,100
296,981
Food - Retail 0.90%Safeway, Inc. 7,000 137,620
Food & Beverages 2.34%Campbell Soup Co. 5,000 179,150General Mills, Inc. 5,000 177,600
356,750
Footwear & Related Apparel 1.20%Skechers U.S.A., Inc., Class A 5,000 182,600*
Gas - Distribution 0.95%NiSource, Inc. 10,000 145,000
Gold Mining 3.86%Agnico-Eagle Mines Ltd. 3,000 182,340Eldorado Gold Corp. 12,000 215,520Randgold Resources Ltd., Sponsored ADR 2,000 189,500
587,360
Insurance 4.69%Assurant, Inc. 4,000 138,800Chubb Corp. 3,000 150,030Cincinnati Financial Corp. 6,000 155,220Lincoln National Corp. 5,000 121,450The Travelers Cos, Inc. 3,000 147,750
713,250
Internet 2.40%Akamai Technologies, Inc. 9,000 365,130*
See notes to portfolios of investments and notes to financial statements.
�78
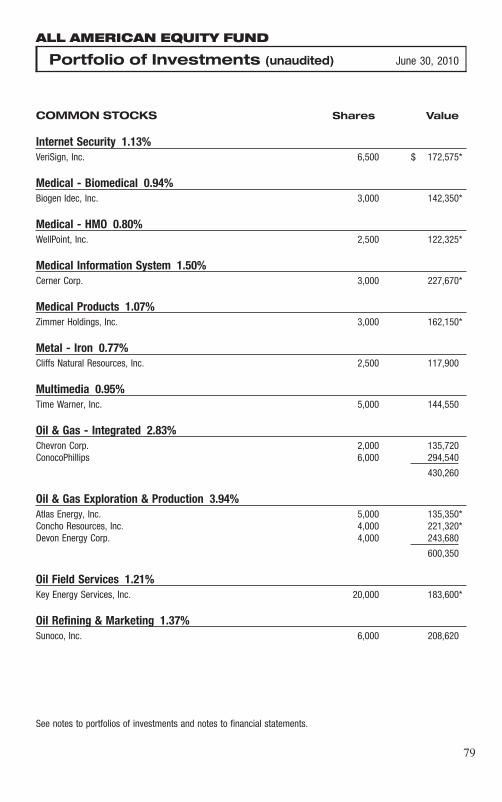
ALL AMERICAN EQUITY FUND
Portfolio of Investments (unaudited) June 30, 2010
COMMON STOCKS Shares Value
Internet Security 1.13%VeriSign, Inc. 6,500 $ 172,575*
Medical - Biomedical 0.94%Biogen Idec, Inc. 3,000 142,350*
Medical - HMO 0.80%WellPoint, Inc. 2,500 122,325*
Medical Information System 1.50%Cerner Corp. 3,000 227,670*
Medical Products 1.07%Zimmer Holdings, Inc. 3,000 162,150*
Metal - Iron 0.77%Cliffs Natural Resources, Inc. 2,500 117,900
Multimedia 0.95%Time Warner, Inc. 5,000 144,550
Oil & Gas - Integrated 2.83%Chevron Corp. 2,000 135,720ConocoPhillips 6,000 294,540
430,260
Oil & Gas Exploration & Production 3.94%Atlas Energy, Inc. 5,000 135,350*Concho Resources, Inc. 4,000 221,320*Devon Energy Corp. 4,000 243,680
600,350
Oil Field Services 1.21%Key Energy Services, Inc. 20,000 183,600*
Oil Refining & Marketing 1.37%Sunoco, Inc. 6,000 208,620
See notes to portfolios of investments and notes to financial statements.
�79

ALL AMERICAN EQUITY FUND
Portfolio of Investments (unaudited) June 30, 2010
COMMON STOCKS Shares Value
Pharmaceuticals 2.23%AmerisourceBergen Corp., Class A 6,000 $ 190,500Bristol-Myers Squibb Co. 6,000 149,640
340,140
Restaurants 3.78%Chipotle Mexican Grill, Inc., Class A 2,000 273,620*Panera Bread Co., Class A 4,000 301,160*
574,780
Retail 0.98%Lululemon Athletica, Inc. 4,000 148,880*
Retail - Auto Parts 1.27%AutoZone, Inc. 1,000 193,220*
Semiconductors 1.10%Analog Devices, Inc. 6,000 167,160
Software Tools 1.03%VMware, Inc., Class A 2,500 156,475*
Telephone - Integrated 4.92%AT&T, Inc. 6,500 157,235Frontier Communications Corp. 20,000 142,200Qwest Communications International, Inc. 30,000 157,500Verizon Communications, Inc. 5,500 154,110Windstream Corp. 13,000 137,280
748,325
Tobacco 1.93%Philip Morris International, Inc. 3,000 137,520Reynolds American, Inc. 3,000 156,360
293,880
Transportation 1.08%Golar LNG Energy Ltd. 2,857 2,905*Ryder System, Inc. 4,000 160,920
163,825
Veterinary Diagnostics 0.68%Neogen Corp. 4,000 104,200*
See notes to portfolios of investments and notes to financial statements.
�80

ALL AMERICAN EQUITY FUND
Portfolio of Investments (unaudited) June 30, 2010
COMMON STOCKS Shares Value
Wireless Equipment 0.73%American Tower Corp., Class A 2,500 $ 111,250*
Total Common Stocks 12,246,843
(cost $11,981,008)
REAL ESTATE INVESTMENT TRUST (REIT) 0.91%
Plum Creek Timber Co., Inc. 4,000 138,120(cost $159,760)
EXCHANGE-TRADED FUNDS (ETF) 3.18%
Energy Select Sector SPDR Fund 3,000 149,040SPDR Barclays Capital High Yield Bond ETF 4,000 151,320SPDR KBW Bank ETF 8,000 183,120
Total Exchange-Traded Funds 483,480
(cost $521,332)
PURCHASED OPTIONS 0.97% Contracts
Exchange-Traded Fund 0.85%PowerShares QQQ, Strike Price 45, Put, Expiration July 2010
(premium $24,220) 105 26,775SPDR Gold Trust, Strike Price 110, Call, Expiration July 2010
(premium $33,375) 30 34,650SPDR S&P 500 ETF Trust, Strike Price 107, Put, Expiration July 2010
(premium $15,550) 50 25,000SPDR S&P 500 ETF Trust, Strike Price 110, Put, Expiration Aug. 2010
(premium $25,325) 50 42,500
128,925
Financial Services 0.12%Citigroup, Inc., Strike Price 8, Call, Expiration Jan. 2012
(premium $30,300) 800 19,200
Total Purchased Options 148,125
(cost $128,770)
Total Securities 13,016,568
(cost $12,790,870)
See notes to portfolios of investments and notes to financial statements.
�81

ALL AMERICAN EQUITY FUND
Portfolio of Investments (unaudited) June 30, 2010
PrincipalREPURCHASE AGREEMENT 10.98% Amount Value
Joint Tri-Party Repurchase Agreement, Banc of America Securities LLCMerrill Lynch, 06/30/10, 0.01%, due 07/01/10, repurchase price$1,671,027, collateralized by U.S. Treasury securities held in a jointtri-party account (cost $1,671,027) $1,671,027 $ 1,671,027
Total Investments 96.51% 14,687,595
(cost $14,461,897)Other assets and liabilities, net 3.49% 531,292
NET ASSETS 100% $15,218,887
See notes to portfolios of investments and notes to financial statements.
�82

HOLMES GROWTH FUND
Portfolio of Investments (unaudited) June 30, 2010
COMMON STOCKS 78.22% Shares Value
Brewery 1.48%Compania de Bebidas das Americas, Sponsored ADR 5,000 $ 505,050
Cable/Satellite TV 1.74%DIRECTV, Class A 17,500 593,600*
Computer Services 1.46%Cognizant Technology Solutions Corp., Class A 10,000 500,600*
Computers 4.93%Apple, Inc. 4,500 1,131,885*Riverbed Technology, Inc. 20,000 552,400*
1,684,285
Computers - Memory Devices 1.09%NetApp, Inc. 10,000 373,100*
Diversified Banking Institutions 2.75%Bank of America Corp. 45,000 646,650JPMorgan Chase & Co. 8,000 292,880
939,530
E-Commerce 2.97%Ctrip.com International Ltd., Sponsored ADR 20,000 751,200MercadoLibre, Inc. 5,000 262,750*
1,013,950
Electronic Components - Semiconductors 5.62%Avago Technologies Ltd. 20,000 421,200*Broadcom Corp., Class A 12,500 412,125Cree, Inc. 10,000 600,300*Netlogic Microsystems, Inc. 18,000 489,600*
1,923,225
Financial Services 5.86%Altisource Portfolio Solutions S.A. 20,000 494,800*Endeavour Financial Corp. 100,000 206,660*GMP Capital, Inc. 28,000 244,873IntercontinentalExchange, Inc. 4,000 452,120*MCO Capital, Inc. (RS) 1,000,000 77,498*+@Visa, Inc., Class A 7,500 530,625
2,006,576
See notes to portfolios of investments and notes to financial statements.
�83

HOLMES GROWTH FUND
Portfolio of Investments (unaudited) June 30, 2010
COMMON STOCKS Shares Value
Footwear & Related Apparel 3.07%Deckers Outdoor Corp. 3,000 $ 428,610*Steven Madden Ltd. 19,750 622,520*
1,051,130
Gold Mining 6.85%Agnico-Eagle Mines Ltd. 6,000 364,680Eldorado Gold Corp. 30,000 538,800Randgold Resources Ltd., Sponsored ADR 12,000 1,137,000Red Back Mining, Inc. 12,000 303,339*
2,343,819
Industrial Audio & Video Products 1.07%Imax Corp. 25,000 365,000*
Internet 2.80%Baidu, Inc., Sponsored ADR 10,000 680,800*Rackspace Hosting, Inc. 15,000 275,100*
955,900
Machinery 0.95%Altra Holdings, Inc. 25,000 325,500*
Marine Services 1.17%Aegean Marine Petroleum Network, Inc. 20,000 399,600
Medical - Biomedical 2.54%Alexion Pharmaceuticals, Inc. 10,000 511,900*Celgene Corp. 7,000 355,740*
867,640
Medical - Hospitals 0.98%African Medical Investments plc 1,000,000 335,823*
Oil & Gas Exploration & Production 8.76%Alange Energy Corp. 1,500,000 493,166*Brigham Exploration Co. 34,000 522,920*Concho Resources, Inc. 16,000 885,280*Newfield Exploration Co. 9,000 439,740*Pacific Rubiales Energy Corp. 29,200 654,466*
2,995,572
See notes to portfolios of investments and notes to financial statements.
�84

HOLMES GROWTH FUND
Portfolio of Investments (unaudited) June 30, 2010
COMMON STOCKS Shares Value
Oil Field Services 2.33%Core Laboratories N.V. 5,400 $ 797,094
Pharmaceuticals 1.84%Valeant Pharmaceuticals International 12,000 627,480*
Pharmacy Services 2.75%Express Scripts, Inc. 20,000 940,400*
Platinum 0.15%Eastern Platinum Ltd. 58,000 52,849*
Radio 7.87%Newfoundland Capital Corp. Ltd., Class A 398,100 2,692,518
Restaurants 1.20%Chipotle Mexican Grill, Inc., Class A 3,000 410,430*
Retail 4.35%Dollar Tree, Inc. 12,750 530,783*TJX Cos, Inc. 7,500 314,625Vitamin Shoppe, Inc. 25,000 641,250*
1,486,658
Retail - Auto Parts 0.88%Advance Auto Parts, Inc. 6,000 301,080
Transport - Truck 0.76%J.B. Hunt Transport Services, Inc. 8,000 261,360
Total Common Stocks 26,749,769
(cost $24,246,983)
EXCHANGE-TRADED FUND (ETF) 1.67%
SPDR KBW Bank ETF 25,000 572,250(cost $635,059)
See notes to portfolios of investments and notes to financial statements.
�85

HOLMES GROWTH FUND
Portfolio of Investments (unaudited) June 30, 2010
WARRANTS 1.11% Shares Value
Gold & Silver Mining 0.04%Medoro Resources Ltd., Warrants (November 2011) 100,000 $ 14,090*
Medical - Hospitals 0.06%African Medical Investments plc, Warrants (June 2011) 500,000 18,672*@
Silver Mining 1.01%Silver Wheaton Corp., Warrants (December 2010) 32,500 346,508*
Total Warrants 379,270
(cost $47,021)
PURCHASED OPTIONS 1.17% Contracts
Exchange-Traded Fund 0.79%PowerShares QQQ, Strike Price 45, Put, Expiration July 2010
(premium $44,980) 195 49,725SPDR Gold Trust, Strike Price 110, Call, Expiration July 2010
(premium $77,875) 70 80,850SPDR S&P 500 ETF Trust, Strike Price 107, Put, Expiration July 2010
(premium $34,210) 110 55,000SPDR S&P 500 ETF Trust, Strike Price 110, Put, Expiration Aug. 2010
(premium $50,650) 100 85,000
270,575
Oil & Gas Exploration & Production 0.38%Anadarko Petroleum Corp., Strike Price 40, Call, Expiration Nov. 2010
(premium $159,050) 250 128,750Pacific Rubiales Energy Corp., Strike Price 20, Put, Expiration July 2010
(premium $43,214) 280 1,447
130,197
Total Purchased Options 400,772
(cost $409,979)
See notes to portfolios of investments and notes to financial statements.
�86

HOLMES GROWTH FUND
Portfolio of Investments (unaudited) June 30, 2010
PrincipalCONVERTIBLE DEBENTURE 1.11% Amount Value
Metal & Mineral Mining 1.11%Grupo Empresarial Ibiza S.A., 12.00%, maturity 05/03/11 (RS) $ 380,000 $ 380,000@
(cost $380,000)
Total Securities 28,482,061
(cost $25,719,042)
REPURCHASE AGREEMENT 11.51%
Joint Tri-Party Repurchase Agreement, Credit Suisse Securities USA LLC,06/30/10, 0.01%, due 07/01/10, repurchase price $3,935,511,collateralized by U.S. Treasury securities held in a joint tri-partyaccount (cost $3,935,510) 3,935,510 3,935,510
Total Investments 94.79% $32,417,571
(cost $29,654,552)Other assets and liabilities, net 5.21% 1,781,109
NET ASSETS 100% $34,198,680
Shares SubjectCALL OPTIONS WRITTEN To Call Value
Anadarko Petroleum Corp., Strike Price 50, Expiration Nov. 2010 25,000 $ 64,000(premiums received $68,799) (Note 2A)
See notes to portfolios of investments and notes to financial statements.
�87

GLOBAL MEGATRENDS FUND
Portfolio of Investments (unaudited) June 30, 2010
COMMON STOCKS 75.75% Shares Value
Airlines 0.86%China Eastern Airlines Corp. Ltd., H shares 400,000 $ 169,193*
Airport Development/Maintenance 1.35%TAV Havalimanlari Holding A.S. 75,000 264,636*
Airports 4.65%Grupo Aeroportuario del Sureste S.A.B. de C.V., Sponsored ADR 20,000 910,800
Auto Manufacturers 2.06%Tofas Turk Otomobil Fabrikasi A.S. 120,000 403,726
Building & Construction 1.27%Aveng Ltd. 27,500 122,606Murray & Roberts Holdings Ltd. 25,000 125,779
248,385
Building Products 2.00%Akcansa Cimento A.S. 50,000 201,218Semen Gresik Persero Tbk PT 200,000 191,376
392,594
Cellular Telecommunications 4.24%America Movil SAB de C.V., Series L, Sponsored ADR 9,000 427,500Mobile TeleSystems, Sponsored ADR 7,500 143,700Vivo Participacoes S.A., Sponsored ADR 10,000 259,200
830,400
Commercial Services 1.13%Stantec, Inc. 10,000 221,300*
Electric - Integrated 9.92%CPFL Energia S.A., Sponsored ADR 12,500 836,875FirstEnergy Corp. 13,000 457,990NextEra Energy, Inc. 7,000 341,320Polska Grupa Energetyczna S.A. 50,000 307,906
1,944,091
Electronics & Components 3.17%Toshiba Corp. 40,000 198,762Zhuzhou CSR Times Electric Co., Ltd., H shares 200,000 423,239
622,001
See notes to portfolios of investments and notes to financial statements.
�88

GLOBAL MEGATRENDS FUND
Portfolio of Investments (unaudited) June 30, 2010
COMMON STOCKS Shares Value
Engineering & Construction 5.26%McDermott International, Inc. 20,000 $ 433,200*SNC-Lavalin Group, Inc. 10,000 400,263URS Corp. 5,000 196,750*
1,030,213
Gold Mining 2.46%Agnico-Eagle Mines Ltd. 3,500 212,730Eldorado Gold Corp. 15,000 269,400
482,130
Holding Company 3.46%Berkshire Hathaway, Inc., Class B 8,500 677,365*
Internet 0.84%Rackspace Hosting, Inc. 9,000 165,060*
Marine Services 1.53%Aegean Marine Petroleum Network, Inc. 15,000 299,700
Metal Processing 0.11%China Wind Systems, Inc. 5,000 22,500*
Non-Ferrous Metals 0.55%Uranium Energy Corp. 45,800 108,088*
Oil & Gas Exploration & Production 0.71%Pacific Rubiales Energy Corp. 6,233 139,702*
Pipelines 2.29%China Gas Holdings Ltd. 800,000 448,855
Platinum 0.11%Eastern Platinum Ltd. 23,500 21,413
Power Converters/Power Supply Equipment 2.04%China High Speed Transmission Equipment Group Co., Ltd. 190,000 399,563
See notes to portfolios of investments and notes to financial statements.
�89

GLOBAL MEGATRENDS FUND
Portfolio of Investments (unaudited) June 30, 2010
COMMON STOCKS Shares Value
Public Thoroughfares 4.65%Compania de Concessoes Rodoviarias 36,000 $ 745,323EcoRodovias Infraestrutura e Logistica S.A. 30,000 165,827*
911,150
Real Estate 1.85%LSR Group OJSC, GDR 28,600 212,950*PIK Group, Sponsored GDR 45,000 150,361*
363,311
Steel - Producers 3.28%Mechel, Sponsored ADR 10,000 181,400Novolipetsk Steel, Sponsored GDR 10,500 268,805Severstal OAO, Sponsored GDR 20,000 192,149*
642,354
Transport - Marine 0.90%China Shipping Development Co. Ltd., H shares 140,000 176,780
Transport & Storage 3.73%Westshore Terminals Income Fund 45,000 731,718
Transportation 5.40%CSX Corp. 10,000 496,300J.B. Hunt Transport Services, Inc. 9,000 294,030Novorossiysk Sea Trade Port, Sponsored GDR 25,000 269,234
1,059,564
Water Treatment Systems 4.80%Beijing Enterprises Water Group Ltd. 240,000 74,693*Hyflux Ltd. 375,000 865,701
940,394
Wireless Equipment 1.13%American Tower Corp., Class A 5,000 222,500*
Total Common Stocks 14,849,486
(cost $15,007,508)
See notes to portfolios of investments and notes to financial statements.
�90

GLOBAL MEGATRENDS FUND
Portfolio of Investments (unaudited) June 30, 2010
WARRANTS 0.06% Shares Value
Building Products 0.06%Polaris Minerals Corp., Warrants (January 2011) 100,000 $ 11,742*
(cost $9,053)
PURCHASED OPTIONS 0.57% Contracts
Exchange-Traded Fund 0.57%iShares MSCI Emerging Markets Index, Strike Price 37, Put, Expiration
July 2010 (premium $49,267) 300 33,300iShares MSCI Emerging Markets Index, Strike Price 39, Put, Expiration
Sep. 2010 (premium $30,200) 100 31,500SPDR Gold Trust, Strike Price 110, Call, Expiration July 2010
(premium $44,500) 40 46,200
Total Purchased Options 111,000
(cost $123,967)
MASTER LIMITED PARTNERSHIPS 4.03% Units
Pipelines 4.03%El Paso Pipeline Partners, L.P. 7,500 215,025NuStar Energy L.P. 10,000 573,900
Total Master Limited Partnerships 788,925
(cost $693,311)
PrincipalCONVERTIBLE DEBENTURE 2.65% Amount
Metal & Mineral Mining 2.65%Grupo Empresarial Ibiza S.A., 12.00%, maturity 05/03/11 (RS) $520,000 520,000@
(cost $520,000)
Total Securities 16,281,153
(cost $16,353,839)
See notes to portfolios of investments and notes to financial statements.
�91

GLOBAL MEGATRENDS FUND
Portfolio of Investments (unaudited) June 30, 2010
PrincipalREPURCHASE AGREEMENT 9.95% Amount Value
Joint Tri-Party Repurchase Agreement, Credit Suisse Securities USA LLC,06/30/10, 0.01%, due 07/01/10, repurchase price $1,951,062,collateralized by U.S. Treasury securities held in a joint tri-partyaccount (cost $1,951,062) $1,951,062 $ 1,951,062
Total Investments 93.01% 18,232,215
(cost $18,304,901)Other assets and liabilities, net 6.99% 1,370,525
NET ASSETS 100% $19,602,740
See notes to portfolios of investments and notes to financial statements.
�92

GLOBAL RESOURCES FUND
Portfolio of Investments (unaudited) June 30, 2010
COMMON STOCKS 75.79% Shares Value
Agricultural Chemicals & Fertilizers 0.01%Spur Ventures, Inc. 274,867 $ 77,460*
Agricultural Operations 0.32%Agriterra Ltd. 46,395,364 2,020,878*+
Coal 0.63%Bounty Mining Ltd. 22,000,000 231,343*@Coalcorp Mining, Inc. 5,732,661 565,431*Lysander Minerals Corp. 500,000 89,240*Xinergy Ltd. 1,335,000 3,072,425*
3,958,439
Copper 0.48%Augusta Resource Corp. 800,000 1,240,000*Catalyst Copper Corp. 1,800,000 202,903*Continental Minerals Corp. 681,060 1,292,322*Los Andes Copper Ltd. 754,000 83,223*Lumina Copper Corp. 168,600 188,468*
3,006,916
Diamond Mining & Exploration 0.06%Diamond Fields International Ltd. 1,800,000 295,899*Rockwell Diamonds, Inc., 144A 950,000 62,468*
358,367
Diversified Minerals 0.10%Woulfe Mining Corp. 8,347,700 627,322*
Energy - Alternative Sources 0.45%Magma Energy Corp. 2,250,000 2,811,047*
Engineering/Research & Development Services 1.31%McDermott International, Inc. 380,000 8,230,800*
Financial Services 0.66%Aberdeen International, Inc. 1,274,750 431,084*Endeavour Financial Corp. 1,806,500 3,733,315*
4,164,399
See notes to portfolios of investments and notes to financial statements.
�93

GLOBAL RESOURCES FUND
Portfolio of Investments (unaudited) June 30, 2010
COMMON STOCKS Shares Value
General Metal & Mineral Mining 2.61%Anfield Nickel Corp., 144A 200,000 $ 582,406*Atacama Minerals Corp. 1,025,000 457,353*Baja Mining Corp. 1,381,050 804,331*Calibre Mining Corp. 550,000 61,998*Canada Zinc Metals Corp. 1,000,000 422,714*Century Mining Corp. 225,911 94,435*Lithium Americas Corp. 141,667 186,308*Lithium Americas Corp. (RS) 425,000 530,975*@Natasa Mining Ltd. 1,038,350 1,527,770*Revett Minerals, Inc. 4,898,000 1,380,301*Sable Mining Africa Ltd. 27,989,506 8,032,407*Savant Explorations Ltd. 54,191 4,327*Sterling Group Ventures, Inc. 500,000 17,750*Terrane Metals Corp. 2,167,000 2,137,382*Toledo Mining Corp. plc 426,200 152,814*Verona Development Corp. 708,800 0*@
16,393,271
Gold & Silver Mining 5.74%Chesapeake Gold Corp. 502,000 3,701,752*Corona Gold Ltd. 50,000 0*@Dundee Precious Metals, Inc. 550,827 2,369,816*Euromax Resources Ltd. 540,840 83,828*Fortress Minerals Corp. 431,425 51,671*Kinross Gold Corp. 1 17Medoro Resources Ltd. 6,760,614 4,445,474*NGEx Resources, Inc. 1,954,005 917,761*Northern Dynasty Minerals Ltd. 400,000 2,596,402*Olympus Pacific Minerals, Inc. 265,000 75,924*Orsu Metals Corp. 147,605 24,958*Planet Exploration, Inc. 160,000 22,921*Randgold Resources Ltd., Sponsored ADR 217,500 20,608,125Rusoro Mining Ltd. 3,150,000 636,184*Rusoro Mining Ltd., 144A 433,333 87,518*TVI Pacific, Inc. 4,850,000 410,032*
36,032,383
Gold Mining 5.84%Barrick Gold Corp. 400,000 18,164,000Newmont Mining Corp. 300,000 18,522,000
36,686,000
See notes to portfolios of investments and notes to financial statements.
�94

GLOBAL RESOURCES FUND
Portfolio of Investments (unaudited) June 30, 2010
COMMON STOCKS Shares Value
Machinery 3.39%Caterpillar, Inc. 100,000 $ 6,007,000Flowserve Corp. 95,000 8,056,000Robbins & Myers, Inc. 331,800 7,213,332
21,276,332
Medical - Hospitals 0.13%African Medical Investments plc 2,386,000 801,275*
Metal - Iron 0.19%Baffinland Iron Mines Corp. 3,350,000 1,211,545*
Metal & Mineral Mining & Exploration 0.11%Peregrine Metals Ltd. 900,000 659,434*
Natural Resource Technology 0.00%I-Pulse, Inc. (RS) 15,971 7,500*@
Oil & Gas - Integrated 9.87%Chevron Corp. 370,000 25,108,200^ConocoPhillips 280,000 13,745,200*Occidental Petroleum Corp. 300,000 23,145,000^
61,998,400
Oil & Gas Drilling 2.82%ENSCO International plc, Sponsored ADR 215,000 8,445,200Transocean Ltd. 200,000 9,266,000*
17,711,200
Oil & Gas Equipment & Services 0.95%Oil States International, Inc. 150,000 5,937,000*
Oil & Gas Exploration & Production 34.12%Africa Oil Corp. 2,050,000 2,214,551*Alange Energy Corp. 26,036,000 8,560,049*Anadarko Petroleum Corp. 375,000 13,533,750^Atlas Energy, Inc. 430,000 11,640,100*Bankers Petroleum Ltd. 1,000,000 6,594,336*BNK Petroleum, Inc. 1,000,000 1,737,823*Brigham Exploration Co. 400,000 6,152,000*Canadian Natural Resources Ltd. 690,000 22,928,700^Cimarex Energy Co. 120,000 8,589,600EOG Resources, Inc. 130,000 12,788,100
See notes to portfolios of investments and notes to financial statements.
�95

GLOBAL RESOURCES FUND
Portfolio of Investments (unaudited) June 30, 2010
COMMON STOCKS Shares Value
Oil & Gas Exploration & Production (Cont’d)Gran Tierra Energy, Inc. 702,500 $ 3,484,400*Green Dragon Gas Ltd. 193,631 1,207,705*HRT Participacoes Em Petroleo (RS) 7,083 10,001,196*@Ivanhoe Energy, Inc. 1,000,000 1,916,303*Niko Resources Ltd. 85,000 7,905,547NiMin Energy Corp. 1,900,000 1,874,031*Noble Energy, Inc. 200,000 12,066,000North Peace Energy Corp. 3,233,400 455,601*Pacific Rubiales Energy Corp. 1,025,000 22,973,557*Petroamerica Oil Corp. 8,010,000 2,407,778*Petromanas Energy, Inc. 2,000,000 563,618*Pioneer Natural Resources Co. 150,000 8,917,500Range Energy Resources, Inc. 15,000,000 2,536,283*+Range Resources Corp. 140,000 5,621,000Royalite Petroleum Co., Inc. 2,266,333 8,159*Shamaran Petroleum Corp. 15,159,900 5,696,266*SM Energy Co. 210,000 8,433,600Southwestern Energy Co. 365,000 14,103,600*Ultra Petroleum Corp. 210,000 9,292,500*
214,203,653
Oil & Gas Refining and Marketing 0.06%Value Creation, Inc. (RS) 336,880 397,591*@
Oil Field Services 4.81%Acergy S.A., Sponsored ADR 450,000 6,655,500CARBO Ceramics, Inc. 135,000 9,745,650*Core Laboratories N.V. 45,000 6,642,450Oceaneering International, Inc. 160,000 7,184,000*
30,227,600
Platinum 0.52%Anooraq Resources Corp. 350,000 355,079*Eastern Platinum Ltd. 3,150,000 2,870,227*Ivanhoe Nickel and Platinum Ltd. (RS) 15,000 19,821*@Osmium Holdings S.A. (RS) 104 0*@
3,245,127
Sugar/Ethanol 0.00%Infinity Bio-Energy Ltd. 682,400 0*@
See notes to portfolios of investments and notes to financial statements.
�96

GLOBAL RESOURCES FUND
Portfolio of Investments (unaudited) June 30, 2010
COMMON STOCKS Shares Value
Uranium 0.61%GoviEx Uranium, Inc. (RS) 750,000 $ 2,062,500*@Uranium Energy Corp. 429,200 1,012,912*Uranium North Resources Corp. 12,500 822*Western Uranium Corp. 1,000,000 751,491*
3,827,725
Total Common Stocks 475,871,664
(cost $522,542,967)
EXCHANGE-TRADED FUND (ETF) 1.36%
SPDR Gold Trust 70,000 8,517,600*(cost $8,191,959)
WARRANTS 4.81%
Coal 0.18%Bounty Mining Ltd., Warrants (December 2011) 5,500,000 0*@Coalcorp Mining, Inc., Warrants (February 2011) 1,228,071 5,768*Coalcorp Mining, Inc., Warrants (August 2011) 885,500 4,159*Coalcorp Mining, Inc., Warrants (June 2013) 3,803,000 71,448*Western Coal Corp., Warrants (June 2012) 425,000 838,382*Xinergy Ltd., Warrants (December 2011) 592,500 207,324*
1,127,081
Financial Services 0.00%Aberdeen International, Inc., Warrants (July 2012) 500,000 25,833*
General Metal & Mineral Mining 0.04%Baja Mining Corp., Warrants (April 2011) 1,055,500 0*@Lithium Americas Corp., Warrants (December 2049) 283,333 0*@Terrane Metals Corp., Warrants (June 2012) 562,500 237,776*
237,776
Gold & Silver Mining 3.35%Chesapeake Gold Corp., Warrants (February 2012) 53,800 181,431*Dundee Precious Metals, Inc., Warrants (November 2015) 625,000 1,315,110*Goldcorp, Inc., Warrants (June 2011) 1,372,941 8,576,448*Medoro Resources Ltd., Warrants (November 2011) 1,250,000 176,131*New Gold, Inc., Warrants (April 2012) 88,500 2,910*
See notes to portfolios of investments and notes to financial statements.
�97

GLOBAL RESOURCES FUND
Portfolio of Investments (unaudited) June 30, 2010
WARRANTS Shares Value
Gold & Silver Mining (Cont’d)New Gold, Inc., Warrants (November 2012) 294,000 $ 63,520*New Gold, Inc., Warrants (June 2017) 822,570 1,066,316*Orsu Metals Corp., Warrants (March 2011) 660,000 3,100*Rusoro Mining Ltd., Warrants (November 2011) 216,667 0*@Rusoro Mining Ltd., Warrants (November 2012) 3,150,000 51,782*Silver Wheaton Corp., Warrants (December 2010) 731,240 7,796,321*Silver Wheaton Corp., Warrants (September 2013) 227,744 1,796,900*
21,029,969
Gold/Mineral Royalty Companies 0.06%Franco-Nevada Corp., Warrants (June 2017) 44,000 334,789*
Medical - Hospitals 0.01%African Medical Investments plc, Warrants (June 2011) 1,162,500 43,412*@
Metal - Iron 0.03%Baffinland Iron Mines Corp., Warrants (December 2012) 1,425,000 200,789*
Metal & Mineral Mining & Exploration 0.00%Peregrine Metals Ltd., Warrants (September 2011) 450,000 29,590*
Natural Resource Technology 0.00%I-Pulse, Inc., Warrants (December 2010) (RS) 15,971 0*@
Oil & Gas Drilling 0.01%Vantage Drilling Co., Warrants (May 2011) 2,461,400 49,228*
Oil & Gas Exploration & Production 1.13%Africa Oil Corp., Warrants (April 2012) 2,050,000 0*@Coastal Energy Co., Warrants (July 2010) 250,000 55,779*@Foothills Resources, Inc., Warrants (September 2011) 633,334 0*@Gran Tierra Energy, Inc., Warrants (June 2012) 1,550,000 6,060,500*@HRT Participacoes Em Petroleo, Warrants (November 2013) (RS) 3,543 0*@Petroamerica Oil Corp., Warrants (October 2014) 8,000,000 976,939*Range Energy Resources, Inc., Warrants (October 2011) 15,000,000 0*@
7,093,218
Uranium 0.00%Denison Mines Corp., Warrants (March 2011) 231,050 24,417*
Total Warrants 30,196,102
(cost $30,698,145)
See notes to portfolios of investments and notes to financial statements.
�98

GLOBAL RESOURCES FUND
Portfolio of Investments (unaudited) June 30, 2010
PURCHASED OPTIONS 0.55% Contracts Value
Copper 0.20%Freeport-McMoRan Copper & Gold, Inc., Strike Price 60, Put, Expiration
Nov. 2010 (premium $1,188,175) 1,500 $ 1,267,500
Exchange-Traded Fund 0.35%SPDR Metals & Mining ETF, Strike Price 48, Put, Expiration Sep. 2010
(premium $948,825) 2,000 1,110,000SPDR Oil & Gas Exploration & Production ETF, Strike Price 43, Put,
Expiration Sep. 2010 (premium $740,280) 2,000 1,080,000
2,190,000
Oil & Gas Exploration & Production 0.00%Pacific Rubiales Energy Corp., Strike Price 20, Put, Expiration July
2010 (premium $531,912) 3,475 17,954
Total Purchased Options 3,475,454
(cost $3,409,192)
PrincipalCONVERTIBLE DEBENTURE 0.78% Amount
Metal & Mineral Mining 0.78%Grupo Empresarial Ibiza S.A., 12.00%, maturity 05/03/11 (RS) $ 4,900,000 4,900,000@
(cost $4,900,000)
Total Securities 522,960,820
(cost $569,742,263)
REPURCHASE AGREEMENT 10.62%
Joint Tri-Party Repurchase Agreement, Credit Suisse Securities USALLC, 06/30/10, 0.01%, due 07/01/10, repurchase price$66,667,007, collateralized by U.S. Treasury securities held in ajoint tri-party account (cost $66,666,988) 66,666,988 66,666,988
Total Investments 93.91% 589,627,808
(cost $636,409,251)Other assets and liabilities, net 6.09% 38,239,818
NET ASSETS 100% $627,867,626
See notes to portfolios of investments and notes to financial statements.
�99

GLOBAL RESOURCES FUND
Portfolio of Investments (unaudited) June 30, 2010
Shares SubjectCALL OPTIONS WRITTEN To Call Value
Anadarko Petroleum Corp., Strike Price 50, Expiration Aug. 2010 100,000 $ 84,000Canadian Natural Resources Ltd., Strike Price 39, Expiration Sep. 2010 100,000 60,000Chevron Corp., Strike Price 80, Expiration Sep. 2010 125,000 42,500Occidental Petroleum Corp., Strike Price 90, Expiration Aug. 2010 50,000 31,000
Total Call Options Written $ 217,500
(premiums received $663,299) (Note 2A)
See notes to portfolios of investments and notes to financial statements.
�100

WORLD PRECIOUS MINERALS FUND
Portfolio of Investments (unaudited) June 30, 2010
COMMON STOCKS 81.18% Shares Value
Agricultural Operations 0.20%Agriterra Ltd. 28,716,944 $ 1,250,845*+
Diamond Mining & Exploration 1.06%Diagem, Inc. 406,350 0*@Diamond Fields International Ltd. 448,600 73,745*Diamonds North Resources Ltd. 2,804,200 493,906*Lucara Diamond Corp. 1,450,000 1,116,904*Olivut Resources Ltd. 675,000 399,464*Petra Diamonds Ltd. 4,000,000 4,265,989*Rockwell Diamonds, Inc. 1,000,000 65,756*Rockwell Diamonds, Inc., 144A 2,575,000 169,320*
6,585,084
Financial Services 1.68%Aberdeen International, Inc. 2,386,000 806,876*Endeavour Financial Corp. 2,642,900 5,461,820*GMP Capital, Inc. 480,000 4,197,830Invictus Financial, Inc. 1,027,000 7,048*
10,473,574
Gold/Mineral Exploration & Development 28.64%African Gold Group, Inc. 1,500,000 380,442*Aldridge Minerals, Inc. 1,300,000 940,303*Amarc Resources Ltd. 695,545 274,415*Ampella Mining Ltd. 600,000 762,412*Andean Resources Ltd. 5,962,856 16,900,117*Atikwa Resources, Inc. 3,062,333 172,599*AuEx Ventures, Inc. 1,000,000 3,240,806*Azumah Resources Ltd. 3,750,000 1,269,960*Brazauro Resources Corp. 3,350,000 4,374,149*Canaco Resources, Inc. 650,000 580,057*Candente Gold Corp. 5,310,000 3,292,095*+Canyon Resources Ltd. 250,000 63,094*Carnavale Resources Ltd. 3,500,000 1,114,369*Chesapeake Gold Corp. 1,607,100 11,850,768*Continental Minerals Corp. 535,000 1,015,171*Continental Precious Minerals, Inc. 267,000 106,594*Corona Gold Ltd. 812,500 0*@Crystallex International Corp. 2,150,000 860,000*Eastmain Resources, Inc. 675,000 811,611*Elissa Resources Ltd. (RS) 36,250 0*@Entree Gold, Inc. 750,000 1,409,046*Erdene Resource Development Corp. 725,000 204,312*Extorre Gold Mines Ltd. 1,013,300 2,547,180*
See notes to portfolios of investments and notes to financial statements.
�101

WORLD PRECIOUS MINERALS FUND
Portfolio of Investments (unaudited) June 30, 2010
COMMON STOCKS Shares Value
Gold/Mineral Exploration & Development (Cont’d)First Point Minerals Corp. 2,423,000 $ 1,183,561*Fortress Minerals Corp. 2,400,000 287,445*Gold Summit Corp. 10,000 845*Golden Alliance Resources Corp. 100,000 69,513*Golden Arrow Resources Corp. 1,000,000 319,384*Golden Odyssey Mining, Inc. 2,656,500 237,065*Golden Predator Corp. 2,000,000 1,014,513*Grandview Gold, Inc. 1,100,000 61,998*Grayd Resource Corp. 2,240,000 1,620,215*Greenock Resources, Inc. 126,200 10,669*Greystar Resources Ltd. 3,000,000 13,611,385*Guyana Goldfields, Inc. 1,000,000 6,509,793*Hainan Mining Corp. plc (RS) 2,018,700 747,827*+@Helio Resource Corp. 502,000 176,835*Inca Pacific Resources, Inc. 337,000 56,982*Kilo Goldmines Ltd. 1,100,000 258,325*Kings Minerals NL 17,691,517 1,136,286*Klondex Mines Ltd. 2,600,000 3,858,908*+Kria Resources, Inc. 268,925 23,999*Leyshon Resources Ltd. 2,000,000 363,890*MAG Silver Corp. 515,000 3,178,385*Malbex Resources, Inc. 1,808,333 679,473*Mindoro Resources Ltd. 2,984,000 504,551*Mirasol Resources Ltd. 735,000 1,139,214*Moss Lake Gold Mines Ltd. 3,182,000 575,393*+Nautilus Minerals, Inc. 175,000 244,939*New Pacific Metals Corp. 657,700 475,721*NGEx Resources, Inc. 3,006,700 1,412,193*Northern Dynasty Minerals Ltd. 500,000 3,245,503*Orsu Metals Corp. 2,100,800 355,215*Pacific North West Capital Corp. 1,291,666 163,802*Pacific Rim Mining Corp. 5,400,713 981,206*Pelangio Exploration, Inc. 1,500,000 288,854*Perseus Mining Ltd. 1,500,000 2,881,332*Planet Exploration, Inc. 1,020,500 146,190*PMI Gold Corp. 8,525,000 1,441,454*Premier Gold Mines Ltd. 1,050,000 4,971,115*Q2 Gold Resources, Inc. (RS) 201,333 0*@Queenston Mining, Inc. 400,000 1,439,106*Radius Gold, Inc. 1,625,000 499,918*Rainy River Resources Ltd. 926,200 5,690,055*Reunion Gold Corp. 2,000,000 375,746*Rochester Resources Ltd. 7,730,000 943,967*+Romarco Minerals, Inc. 20,695,706 34,410,220*Rubicon Minerals Corp. 3,900,000 13,408,483*Rye Patch Gold Corp. 3,800,000 588,981*
See notes to portfolios of investments and notes to financial statements.
�102

WORLD PRECIOUS MINERALS FUND
Portfolio of Investments (unaudited) June 30, 2010
COMMON STOCKS Shares Value
Gold/Mineral Exploration & Development (Cont’d)San Anton Resource Corp. 1,303,200 $ 208,111*Shield Mining Ltd. 1,000,000 168,250*Solitario Exploration & Royalty Corp. 944,522 2,124,964*St Andrew Goldfields Ltd. 877,549 1,088,126*Strikepoint Gold, Inc. 950,000 339,110*Strongbow Exploration, Inc. 880,500 66,169*Temex Resources Corp. 978,268 257,306*Terrane Metals Corp. 1,601,000 1,579,118*Timberline Resources Corp. 321,571 296,031*Valley High Ventures Ltd. 1,125,000 401,578*Verena Minerals Corp. 930,500 332,150*Verona Development Corp. 48,500 0*@VG Gold Corp. 4,806,501 1,354,516*Victoria Gold Corp. 1,000,000 619,980*Virginia Mines, Inc. 675,000 4,514,584*Wesdome Gold Mines Ltd. 461,700 1,019,205
178,129,152
Intermediate & Junior Gold Producers 16.10%Argonaut Gold Ltd. 500,000 1,244,657*Aurizon Mines Ltd. 287,500 1,420,250*Avion Gold Corp. 3,900,000 1,813,442*Centamin Egypt Ltd. 7,400,000 18,003,851*Centamin Egypt Ltd., 144A 3,000,000 7,298,859*Centerra Gold, Inc. 500,000 5,504,673*Century Mining Corp. 2,634,809 1,101,395*Claude Resources, Inc. 2,080,700 2,228,170*DRDGOLD Ltd., Sponsored ADR 100,000 435,000*Dundee Precious Metals, Inc. 1,919,920 8,260,048*Gran Colombia Gold S.A. (RS) 12,300,000 2,888,545*+@Great Basin Gold Ltd. 1,750,000 2,975,436*Kingsgate Consolidated Ltd. 500,000 3,963,015Lake Shore Gold Corp. 3,088,000 9,282,420*Medoro Resources Ltd. 22,287,557 14,655,291*+New Gold, Inc. 100,000 620,920*Olympus Pacific Minerals, Inc. 5,520,000 1,581,513*Pan African Resources plc 15,620,000 1,562,491*Rusoro Mining Ltd. 6,105,000 1,232,986*Rusoro Mining Ltd., 144A 1,120,000 226,199*San Gold Corp. 2,850,000 12,181,203*SEMAFO, Inc. 223,000 1,686,299*
100,166,663
Medical - Hospitals 0.24%African Medical Investments plc 4,489,000 1,507,511*
See notes to portfolios of investments and notes to financial statements.
�103

WORLD PRECIOUS MINERALS FUND
Portfolio of Investments (unaudited) June 30, 2010
COMMON STOCKS Shares Value
Metal & Mineral Mining & Exploration 2.74%Augusta Resource Corp. 600,000 $ 930,000*Baja Mining Corp. 685,450 399,210*Breakwater Resources Ltd. 45,000 104,410*Calibre Mining Corp. 900,000 101,451*Candente Copper Corp. 300,000 101,451*Catalyst Copper Corp. 1,564,000 176,300*Dia Bras Exploration, Inc. 1,404,000 250,585*Farallon Mining Ltd. 700,000 230,144*Imperial Metals Corp. 176,500 2,649,448*Linear Metals Corp. 1,004,410 122,656*Mines Management, Inc. 825,400 1,481,479*Natasa Mining Ltd. 1,306,449 1,922,235*North American Tungsten Corp. 1,282,000 180,640*Odyssey Resources Ltd. 414,900 67,231*Prophecy Resource Corp. 133,400 60,776*Revett Minerals, Inc. 3,200,500 901,930*Roca Mines, Inc. 1,000,000 291,203*Sable Mining Africa Ltd. 18,621,041 5,343,852*Toledo Mining Corp. plc 432,900 155,217*TVI Pacific, Inc. 15,361,428 1,298,698*Uranium North Resources Corp. 517,035 33,998*Wallbridge Mining Co., Ltd. 1,541,000 238,847*
17,041,761
Mining Services 0.56%Energold Drilling Corp. 700,000 1,341,412*Major Drilling Group International, Inc. 105,000 2,139,355
3,480,767
Oil & Gas Exploration & Production 2.61%Alange Energy Corp. 2,000,000 657,555*Atlas Energy, Inc. 300,000 8,121,000*Big Sky Energy Corp. 2,000,000 0*@Pacific Rubiales Energy Corp. 330,000 7,396,365*
16,174,920
Platinum 1.40%Anooraq Resources Corp. 3,150,000 3,234,433*Eastern Platinum Ltd. 4,427,000 4,033,808*Ivanhoe Nickel and Platinum Ltd. (RS) 135,000 178,389*@Osmium Holdings S.A. (RS) 891 0*@Platinum Group Metals Ltd. 750,000 1,275,187*
8,721,817
See notes to portfolios of investments and notes to financial statements.
�104

WORLD PRECIOUS MINERALS FUND
Portfolio of Investments (unaudited) June 30, 2010
COMMON STOCKS Shares Value
Precious Metals 0.50%North American Palladium Ltd. 1,000,000 $ 3,110,000*
Senior Gold Producers 22.02%Agnico-Eagle Mines Ltd. 330,000 20,057,400Barrick Gold Corp. 175,000 7,946,750*IAMGOLD Corp. 235,000 4,154,800Kinross Gold Corp. 170,500 2,914,298Lihir Gold Ltd., Sponsored ADR 110,000 3,958,900Newmont Mining Corp. 139,000 8,581,860*Randgold Resources Ltd., Sponsored ADR 625,000 59,218,750*Red Back Mining, Inc. 507,500 12,828,731*Red Back Mining, Inc. 144A 685,000 17,315,626*
136,977,115
Silver Mining 3.41%Coeur d’Alene Mines Corp. 307,000 4,844,460*ECU Silver Mining, Inc. 1,000,000 582,406*Fortuna Silver Mines, Inc. 1,250,000 2,454,088*Polymetal, Sponsored GDR 224,000 2,780,937*Scorpio Mining Corp. 1,217,000 765,948*Silvercorp Metals, Inc. 1,488,500 9,787,704
21,215,543
Wireless Equipment 0.02%Active Control Technology, Inc. 4,575,000 150,416*
Total Common Stocks 504,985,168
(cost $445,166,602)
EXCHANGE-TRADED FUNDS (ETF) 3.46%
ETFS Platinum Trust 8,400 1,281,630*SPDR Gold Trust 126,000 15,331,680*Sprott Physical Gold Trust 417,000 4,895,580*
Total Exchange-Traded Funds 21,508,890
(cost $20,087,359)
See notes to portfolios of investments and notes to financial statements.
�105

WORLD PRECIOUS MINERALS FUND
Portfolio of Investments (unaudited) June 30, 2010
WARRANTS 8.63% Shares Value
Financial Services 0.14%Endeavour Financial Corp., Warrants (February 2014) 1,110,000 $ 855,009*
Gold/Mineral Exploration & Development 0.26%Candente Gold Corp., Warrants (December 2011) 2,437,500 137,382*@Carnavale Resources Ltd., Warrants (February 2013) 3,500,000 485,822*Chesapeake Gold Corp., Warrants (February 2012) 189,199 638,039*Crystallex International Corp., Warrants (December 2049) 162,500 0*@Fortress Minerals Corp., Warrants (December 2010) 1,400,000 0*@Golden Alliance Resources Corp., Warrants (October 2010)) 100,000 31,938*@Golden Arrow Resources Corp., Warrants (October 2010) 1,000,000 0*@Hainan Mining Corp. plc, Warrants (May 2011) (RS) 313,700 34,676*@Hainan Mining Corp. plc, Warrants (August 2011) (RS) 1,705,000 188,467*@Malbex Resources, Inc., Warrants (April 2011) 666,666 0*@Orsu Metals Corp., Warrants (March 2011) 4,112,000 19,313*Orsu Metals Corp., Warrants (April 2012) 900,000 0*@Rochester Resources Ltd., Warrants (November 2011) 6,630,000 0*@Rye Patch Gold Corp., Warrants (December 2011) 1,800,000 0*@Terrane Metals Corp., Warrants (June 2012) 219,000 92,574*Timberline Resources Corp., Warrants (August 2011) 428,571 0*@
1,628,211
Gold/Mineral Royalty Companies 0.18%Franco-Nevada Corp., Warrants (March 2012) 73,600 387,168*Franco-Nevada Corp., Warrants (June 2017) 94,700 720,558*Gold Wheaton Gold Corp., Warrants (July 2013) 126,200 23,117*
1,130,843
Intermediate & Junior Gold Producers 0.87%Argonaut Gold Ltd., Warrants (December 2012) 250,000 102,743*Avion Gold Corp., Warrants (May 2011) 1,950,000 0*@Dundee Precious Metals, Inc., Warrants (November 2015) 1,125,000 2,367,197*Lake Shore Gold Corp., Warrants (December 2010) 73,000 130,290*@Medoro Resources Ltd., Warrants (November 2011) 5,000,000 704,523*New Gold, Inc., Warrants (April 2012) 2,495,100 82,033*New Gold, Inc., Warrants (November 2012) 326,000 70,434*New Gold, Inc., Warrants (June 2017) 1,452,430 1,882,818*Rusoro Mining Ltd., Warrants (November 2011) 600,000 0*@Rusoro Mining Ltd., Warrants (November 2012) 6,330,750 104,070*
5,444,108
Medical - Hospitals 0.01%African Medical Investments plc, Warrants (June 2011) 2,125,000 79,356*@
See notes to portfolios of investments and notes to financial statements.
�106

WORLD PRECIOUS MINERALS FUND
Portfolio of Investments (unaudited) June 30, 2010
WARRANTS Shares Value
Metal & Mineral Mining & Exploration 0.04%Baja Mining Corp., Warrants (April 2011) 527,750 $ 0*@Coalcorp Mining, Inc., Warrants (February 2011) 113,214 532*Denison Mines Corp., Warrants (March 2011) 206,295 21,801*Mines Management, Inc., Warrants (April 2012) 795,800 236,750*
259,083
Senior Gold Producers 5.02%Agnico-Eagle Mines Ltd., Warrants (December 2013) 141,650 3,420,847*Goldcorp, Inc., Warrants (June 2011) 3,684,302 23,014,991*Kinross Gold Corp., Warrants (September 2011) 1,615,000 2,184,585*Kinross Gold Corp., Warrants (September 2013) 947,571 2,590,232*
31,210,655
Silver Mining 2.10%Hecla Mining Co., Warrants (August 2014) 315,250 857,480*@Silver Wheaton Corp., Warrants (December 2010) 838,820 8,943,316*Silver Wheaton Corp., Warrants (September 2013) 411,995 3,250,641*
13,051,437
Total Warrants 53,658,702
(cost $60,575,853)
SPECIAL WARRANTS 0.00%
Gold/Mineral Exploration & Development 0.00%Miocene Metals Ltd., Special Warrants (October 2011) (RS) 256,833 0*@Western Exploration & Development Ltd., Special Warrants
(December 2049) (RS) 600,000 0*@
Total Special Warrants 0
(cost $300,000)
RIGHTS 0.01%
Gold/Mineral Exploration & Development 0.02%San Anton Resource Corp. (cost $0) 1,303,200 94,874
See notes to portfolios of investments and notes to financial statements.
�107

WORLD PRECIOUS MINERALS FUND
Portfolio of Investments (unaudited) June 30, 2010
PURCHASED OPTIONS 0.03% Contracts Value
Exchange-Traded Fund 0.03%Market Vector Junior Gold, Strike Price 25, Put, Expiration July 2010
(premium $145,275) 1,000 $ 20,000Market Vector Junior Gold, Strike Price 27, Put, Expiration Aug. 2010
(premium $228,610) 1,000 150,000
170,000
Oil & Gas Exploration & Production 0.00%Pacific Rubiales Energy Corp., Strike Price 20, Put, Expiration July
2010 (premium $318,998) 2,085 10,772
Total Purchased Options 180,772
(cost $692,883)
Total Securities 580,428,406
(cost $526,822,697)
PrincipalREPURCHASE AGREEMENT 6.35% Amount
Joint Tri-Party Repurchase Agreement, Banc of America Securities LLCMerrill Lynch, 06/30/10, 0.01%, due 07/01/10, repurchase price$39,471,116, collateralized by U.S. Treasury securities held in ajoint tri-party account (cost $39,471,105) $ 39,471,105 39,471,105
Total Investments 99.66% 619,899,511
(cost $566,293,802)Other assets and liabilities, net 0.34% 2,134,865
NET ASSETS 100% $622,034,376
See notes to portfolios of investments and notes to financial statements.
�108

GOLD & PRECIOUS METALS FUND
Portfolio of Investments (unaudited) June 30, 2010
COMMON STOCKS 76.35% Shares Value
Diamond Mining & Exploration 0.45%Petra Diamonds Ltd. 1,000,000 $ 1,066,497*
Financial Services 1.89%Aberdeen International, Inc. 52,250 17,669*Endeavour Financial Corp. 1,664,700 3,440,270*GMP Capital, Inc. 112,000 979,494
4,437,433
Gold Mining 63.99%Agnico-Eagle Mines Ltd. 230,000 13,979,400Aurizon Mines Ltd. 212,500 1,049,750*Barrick Gold Corp. 375,000 17,028,750Centamin Egypt Ltd. 3,500,000 8,515,335*Centamin Egypt Ltd., 144A 2,000,000 4,865,906*Centerra Gold, Inc. 250,000 2,752,337*Century Mining Corp. 509,512 212,985*Claude Resources, Inc. 3,250,000 3,480,344*DRDGOLD Ltd., Sponsored ADR 500,000 2,175,000Dundee Precious Metals, Inc. 1,771,070 7,619,652*Eldorado Gold Corp. 250,000 4,490,000Gran Colombia Gold S.A. (RS) 4,100,000 962,848*@Harmony Gold Mining Co., Ltd., Sponsored ADR 200,000 2,114,000IAMGOLD Corp. 165,000 2,917,200Jaguar Mining, Inc. 100,000 887,699*Kingsgate Consolidated Ltd. 350,000 2,774,111Kinross Gold Corp. 200,000 3,418,000Kirkland Lake Gold, Inc. 250,000 1,991,452*Lake Shore Gold Corp. 375,000 1,127,237*Lihir Gold Ltd., Sponsored ADR 82,000 2,951,180Medoro Resources Ltd. 2,630,000 1,729,369*New Gold, Inc. 200,000 1,241,839*Newmont Mining Corp. 208,000 12,841,920Pan African Resources plc 10,570,000 1,057,332*Randgold Resources Ltd., Sponsored ADR 246,000 23,308,500Red Back Mining, Inc. 310,500 7,848,908*Red Back Mining, Inc., 144A 215,000 5,434,831*Richmont Mines, Inc. 600,000 2,652,000*Rusoro Mining Ltd. 930,000 187,826*San Gold Corp. 1,425,000 6,090,601*SEMAFO, Inc. 277,000 2,094,641*Troy Resources NL 284,850 584,831
150,385,784
See notes to portfolios of investments and notes to financial statements.
�109

GOLD & PRECIOUS METALS FUND
Portfolio of Investments (unaudited) June 30, 2010
COMMON STOCKS Shares Value
Gold/Mineral Royalty Companies 1.30%Franco-Nevada Corp. 100,000 $ 3,043,540
Medical - Hospitals 0.27%African Medical Investments plc 1,910,000 641,423*
Mining Services 0.52%Major Drilling Group International, Inc. 60,000 1,222,488
Oil & Gas Exploration & Production 0.71%Canadian Natural Resources Ltd. 50,000 1,661,500^
Platinum 0.87%Eastern Platinum Ltd. 2,255,000 2,054,718*
Precious Metals 0.46%North American Palladium Ltd. 350,000 1,088,500*
Silver Mining 5.89%Coeur d’Alene Mines Corp. 202,500 3,195,450*First Majestic Silver Corp. 500,000 2,010,239*Fortuna Silver Mines, Inc. 1,000,000 1,963,271*Polymetal, Sponsored GDR 144,000 1,787,745*Silvercorp Metals, Inc. 744,000 4,892,208
13,848,913
Total Common Stocks 179,450,796
(cost $143,449,293)
EXCHANGE-TRADED FUNDS (ETF) 5.21%
ETFS Platinum Trust 5,600 854,420*SPDR Gold Trust 74,000 9,004,320*Sprott Physical Gold Trust 203,000 2,383,220*
Total Exchange-Traded Funds 12,241,960
(cost $11,698,574)
See notes to portfolios of investments and notes to financial statements.
�110

GOLD & PRECIOUS METALS FUND
Portfolio of Investments (unaudited) June 30, 2010
WARRANTS 9.99% Shares Value
Financial Services 0.13%Endeavour Financial Corp., Warrants (February 2014) 407,000 $ 313,504*
Gold Mining 6.39%Agnico-Eagle Mines Ltd., Warrants (December 2013) 93,350 2,254,403*Crystallex International Corp., Warrants (December 2049) 62,500 0*@Dundee Precious Metals, Inc., Warrants (June 2012) 27,000 2,536*Dundee Precious Metals, Inc., Warrants (November 2015) 1,107,800 2,331,006*Goldcorp, Inc., Warrants (June 2011) 1,000,584 6,250,419*Kinross Gold Corp., Warrants (September 2011) 1,001,000 1,354,037*Kinross Gold Corp., Warrants (September 2013) 773,734 2,115,040*Medoro Resources Ltd., Warrants (November 2011) 100,000 14,090*New Gold, Inc., Warrants (April 2012) 3,078,400 101,211*New Gold, Inc., Warrants (November 2012) 1,082,500 233,878*New Gold, Inc., Warrants (June 2017) 251,800 326,414*Rusoro Mining Ltd., Warrants (November 2012) 1,568,750 25,788*
15,008,822
Gold/Mineral Royalty Companies 0.36%Franco-Nevada Corp., Warrants (March 2012) 92,700 487,643*Franco-Nevada Corp., Warrants (June 2017) 44,700 340,115*Gold Wheaton Gold Corp., Warrants (July 2013) 125,000 22,897*
850,655
Medical - Hospitals 0.01%African Medical Investments plc, Warrants (June 2011) 912,500 34,076*@
Metal & Mineral Mining 0.01%Mines Management, Inc., Warrants (April 2012) 44,000 13,090*
Silver Mining 3.09%Hecla Mining Co., Warrants (August 2014) 169,750 461,720*@Silver Wheaton Corp., Warrants (December 2010) 232,840 2,482,489*Silver Wheaton Corp., Warrants (September 2013) 546,006 4,307,988*
7,252,197
Total Warrants 23,472,344
(cost $19,212,039)
Total Securities 215,165,100
(cost $174,359,906)
See notes to portfolios of investments and notes to financial statements.
�111

GOLD & PRECIOUS METALS FUND
Portfolio of Investments (unaudited) June 30, 2010
PrincipalREPURCHASE AGREEMENT 6.21% Amount Value
Joint Tri-Party Repurchase Agreement, Banc of America Securities LLCMerrill Lynch, 06/30/10, 0.01%, due 07/01/10, repurchase price$14,594,290, collateralized by U.S. Treasury securities held in a jointtri-party account (cost $14,594,286) $14,594,286 $14,594,286
Total Investments 97.76% 229,759,386
(cost $188,954,192)Other assets and liabilities, net 2.24% 5,257,542
NET ASSETS 100% $235,016,928
Shares SubjectCALL OPTIONS WRITTEN To Call Value
Canadian Natural Resources Ltd., Strike Price 39, Expiration Sep. 2010 10,000 $ 6,000(premiums received $15,950) (Note 2A)
See notes to portfolios of investments and notes to financial statements.
�112

EASTERN EUROPEAN FUND
Portfolio of Investments (unaudited) June 30, 2010
COMMON STOCKS 87.65% Shares Value
Airport Development 0.47%TAV Havalimanlari Holding A.S. 500,000 $ 1,764,240*
Appliances 1.69%Arcelik 1,500,000 6,269,094
Auto Manufacturers 1.90%Tofas Turk Otomobil Fabrikasi A.S. 2,100,000 7,065,197
Building Products 0.65%Akcansa Cimento A.S. 600,000 2,414,614
Cellular Telecommunications 2.33%Mobile TeleSystems, Sponsored ADR 452,500 8,669,900
Commercial Banks - Non US 27.13%Albaraka Turk Katilim Bankasi A.S. 1,500,000 2,757,338Bank Pekao S.A. 120,000 5,466,731National Bank of Greece S.A., Sponsored ADR 1,000,000 2,170,000OTP Bank Nyrt. plc 300,000 6,038,198*Powszechna Kasa Oszczednosci Bank Polski S.A. 175,000 1,864,475Sberbank RF 16,607,095 39,937,307@Turkiye Garanti Bankasi A.S. 4,300,082 17,814,316Turkiye Halk Bankasi A.S. 650,000 4,787,587Turkiye Is Bankasi, Class C 2,711,185 8,393,524Turkiye Sinai Kalkinma Bankasi A.S. 2,000,000 2,217,150VTB Bank OJSC, Sponsored GDR 2,000,000 9,459,936
100,906,562
Diversified Metals & Mining 1.39%JSC MMC Norilsk Nickel, Sponsored ADR 300,000 4,291,392*Lysander Minerals Corp. 500,000 89,239Orsu Metals Corp. 4,719,740 798,040*
5,178,671
Diversified Operations 1.08%Haci Omer Sabanci Holding A.S. 1,001,729 4,007,769
Electric - Integrated 1.61%Polska Grupa Energetyczna S.A. 975,000 6,004,163
See notes to portfolios of investments and notes to financial statements.
�113

EASTERN EUROPEAN FUND
Portfolio of Investments (unaudited) June 30, 2010
COMMON STOCKS Shares Value
Electric Utility 0.96%CEZ A.S. 86,471 $ 3,550,906
Food - Meat Products 0.58%Cherkizovo Group, Sponsored GDR 150,000 2,139,790*
Gold Mining 1.37%Centerra Gold, Inc. 250,000 2,752,337*Dundee Precious Metals, Inc. 543,552 2,338,517*
5,090,854
Intermediate & Junior Gold Producers 0.97%Eldorado Gold Corp. 200,000 3,592,000
Investment Companies 0.11%Vostok Nafta Investment Ltd. 130,000 400,461*
Medical - Drugs 2.71%Pharmstandard, Sponsored GDR 300,000 6,544,375*Richter Gedeon Nyrt. 20,000 3,536,638
10,081,013
Metal Processing & Fabrication 0.29%VSMPO-AVISMA Corp. 11,434 1,074,225@
Oil - Field Services 0.70%Eurasia Drilling Co. Ltd., Sponsored GDR 135,000 2,597,715
Oil & Gas - Integrated 13.11%Gazprom OAO, Sponsored ADR 593,901 11,171,278Lukoil OAO, Sponsored ADR 236,810 12,180,317MOL Hungarian Oil & Gas Nyrt. 25,000 2,063,323Rosneft Oil Co. OJSC, Sponsored GDR 2,617,309 15,931,665Tatneft, Sponsored ADR 35,000 978,353TNK-BP Holding 3,126,500 6,434,790
48,759,726
Oil & Gas Exploration & Production 5.96%Alliance Oil Co. Ltd. 300,000 3,315,043*BNK Petroleum, Inc. 500,000 868,911*NovaTek OAO, Sponsored GDR 253,477 17,981,723
22,165,677
See notes to portfolios of investments and notes to financial statements.
�114

EASTERN EUROPEAN FUND
Portfolio of Investments (unaudited) June 30, 2010
COMMON STOCKS Shares Value
Real Estate 1.59%Globe Trade Centre S.A. 300,000 $ 2,041,894*LSR Group OJSC, GDR 477,100 3,552,393*PIK Group, Sponsored GDR 100,000 334,136*
5,928,423
Retail 5.11%Eurocash S.A. 500,000 3,183,573Magnit OAO, Sponsored GDR 400,000 6,846,737X5 Retail Group N.V., Sponsored GDR 270,000 8,970,782*
19,001,092
Retail - Food 0.74%BIM Birlesik Magazalar A.S. 100,000 2,762,923
Silver Mining 1.25%Polymetal, Sponsored GDR 375,000 4,655,587*
Steel - Producers 8.69%Evraz Group S.A., Sponsored GDR 100,000 2,297,694*Magnitogorsk Iron & Steel Works, Sponsored GDR 400,000 3,637,685Mechel, Sponsored ADR 600,000 10,884,000Novolipetsk Steel, Sponsored GDR 350,000 8,960,179OAO TMK, Sponsored GDR 450,000 6,552,036*
32,331,594
Telecommunications 4.25%Hellenic Telecommunications Organization S.A., Sponsored ADR 250,000 935,000Sistema JSFC, Sponsored GDR 325,000 7,438,337Turk Telekomunikasyon A.S. 850,000 2,693,607VimpelCom Ltd., Sponsored ADR 293,157 4,743,280*
15,810,224
Transportation 1.01%Novorossiysk Sea Trade Port, Sponsored GDR 350,000 3,769,281
Total Common Stocks 325,991,701
(cost $290,461,845)
See notes to portfolios of investments and notes to financial statements.
�115

EASTERN EUROPEAN FUND
Portfolio of Investments (unaudited) June 30, 2010
PREFERRED STOCKS 0.93% Shares Value
Oil & Gas Exploration & Production 0.65%Surgutneftegaz, Preferred Stock 5,529,631 $ 2,411,538*@
Steel - Producers 0.28%Mechel, Preferred Stock, ADR 150,000 1,039,500
Total Preferred Stocks 3,451,038
(cost $2,986,447)
WARRANTS 0.28%
Diversified Metals & Mining 0.00%Orsu Metals Corp., Warrants (April 2012) 2,012,500 0*@
Gold Mining 0.28%Dundee Precious Metals, Inc., Warrants (November 2015) 500,000 1,052,088*
Total Warrants 1,052,088
(cost $0)
PURCHASED OPTIONS 0.63% Contracts
Exchange-Traded Fund 0.63%Market Vectors Russia ETF, Strike Price 28, Put, Expiration
July 2010 (premium $388,000) 3,000 285,000Market Vectors Russia ETF, Strike Price 29, Put, Expiration
July 2010 (premium $712,360) 3,000 435,000Market Vectors Russia ETF, Strike Price 29, Put, Expiration
Aug. 2010 (premium $1,183,000) 5,000 1,300,000SPDR Gold Trust, Strike Price 120, Call, Expiration July 2010
(premium $405,500) 1,000 305,000
Total Purchased Options 2,325,000
(cost $2,688,860)
Total Securities 332,819,827
(cost $296,137,152)
See notes to portfolios of investments and notes to financial statements.
�116

EASTERN EUROPEAN FUND
Portfolio of Investments (unaudited) June 30, 2010
PrincipalREPURCHASE AGREEMENT 7.47% Amount Value
Joint Tri-Party Repurchase Agreement, UBS Financial Securities,Inc., 06/30/10, 0.02%, due 07/01/10, repurchase price$27,763,197, collateralized by U.S. Treasury securities held in ajoint tri-party account (cost $27,763,182) $27,763,182 $ 27,763,182
Total Investments 96.97% 360,583,009
(cost $323,900,334)Other assets and liabilities, net 3.04% 11,292,845
NET ASSETS 100% $371,875,854
See notes to portfolios of investments and notes to financial statements.
�117

GLOBAL EMERGING MARKETS FUND
Portfolio of Investments (unaudited) June 30, 2010
COMMON STOCKS 83.19% Shares Value
Airlines 0.72%China Eastern Airlines Corp. Ltd., H shares 200,000 $ 84,597*
Airport Development 0.60%TAV Havalimanlari Holding A.S. 20,000 70,570*
Auto Manufacturers 0.86%Tofas Turk Otomobil Fabrikasi A.S. 30,000 100,931
Auto Parts & Equipment 0.37%China Automotive Systems, Inc. 2,500 44,000*
Brewery 2.45%Compania Cervecerias Unidas S.A., Sponsored ADR 2,000 86,180Compania de Bebidas das Americas, Sponsored ADR 2,000 202,020
288,200
Broadcasting & Cable TV 1.11%Grupo Televisa S.A., Sponsored ADR 7,500 130,575
Building & Construction 1.30%Aveng Ltd. 17,500 78,022Murray & Roberts Holdings Ltd. 15,000 75,468
153,490
Building Products 1.50%Akcansa Cimento A.S. 20,000 80,487Semen Gresik Persero Tbk PT 100,000 95,688
176,175
Cellular Telecommunications 4.98%America Movil SAB de C.V., Series L, Sponsored ADR 4,000 190,000MTN Group Ltd. 7,954 104,272Tim Participacoes S.A., Sponsored ADR 5,000 135,700Vivo Participacoes S.A., Sponsored ADR 6,000 155,520
585,492
Commercial Banks - Non US 10.28%Banco do Brasil S.A. 7,500 102,396Bank of Nova Scotia 3,000 138,060Itau Unibanco Banco Multiplo 9,337 168,071National Bank of Greece S.A., Sponsored ADR 50,000 108,500OTP Bank Nyrt. plc 7,000 140,891*
See notes to portfolios of investments and notes to financial statements.
�118

GLOBAL EMERGING MARKETS FUND
Portfolio of Investments (unaudited) June 30, 2010
COMMON STOCKS Shares Value
Commercial Banks - Non US (Cont’d)Sberbank RF 90,000 $ 216,435@State Bank of India Ltd., Sponsored GDR 2,000 199,358Turkiye Is Bankasi, Class C 43,835 135,708
1,209,419
Department Stores 3.18%Lojas Renner S.A. 13,769 373,681
Diversified Metals & Mining 0.35%Orsu Metals Corp. 243,083 41,102*
E-Commerce 2.81%Ctrip.com International Ltd., Sponsored ADR 6,000 225,360MercadoLibre, Inc. 2,000 105,100*
330,460
Electric - Integrated 1.31%Polska Grupa Energetyczna S.A. 25,000 153,953
Electric Products - Miscellaneous 0.78%LG Innotek Co., Ltd. 700 92,031
Electronics & Components 5.43%China High Speed Transmission Equipment Group Co., Ltd. 45,000 94,633Harbin Electric, Inc. 2,500 41,625*Samsung Electronics Co., Ltd. 458 287,271Samsung Techwin Co., Ltd. 2,500 214,756
638,285
Financial Services 1.66%BM&F BOVESPA S.A. 4,000 25,699Bolsa de Valores de Colombia 3,000,000 56,028Bolsa Mexicana de Valores S.A. 17,000 26,703Bursa Malaysia Bhd 14,000 30,345Hong Kong Exchanges & Clearing Ltd. 1,800 28,114Singapore Exchange Ltd. 5,500 28,775
195,664
Food 3.01%China Mengniu Dairy Co. Ltd. 45,000 145,618Compania Brasileira de Distribuicao Grupo Pao de Acucar, Class A,
Sponsored ADR 3,000 208,560
354,178
See notes to portfolios of investments and notes to financial statements.
�119
GLOBAL EMERGING MARKETS FUND
Portfolio of Investments (unaudited) June 30, 2010
COMMON STOCKS Shares Value
Gold Mining 8.95%Centamin Egypt Ltd. 50,000 $ 121,648*Eldorado Gold Corp. 15,000 269,400Randgold Resources Ltd., Sponsored ADR 5,000 473,750Zhaojin Mining Industry Co., Ltd., H shares 80,000 187,623
1,052,421
Healthcare Equipment & Services 2.00%Opto Circuits India Ltd. 46,048 234,833
Hotels 1.33%Home Inns & Hotels Management, Inc., ADR 4,000 156,160*
Insurance 2.53%CNinsure, Inc., Sponsored ADR 3,500 90,790Powszechny Zaklad Ubezpieczen S.A. 2,000 206,337
297,127
Internet 4.09%Baidu, Inc., Sponsored ADR 3,000 204,240*NCSoft Corp. 600 98,813NHN Corp. 900 133,799*Perfect World Co., Ltd., Sponsored ADR 2,000 44,020*
480,872
Investment Companies 0.52%Vostok Nafta Investment Ltd. 20,000 61,609*
Medical - Drugs 0.93%Pharmstandard, Sponsored GDR 5,000 109,073*
Multimedia 2.57%Naspers Ltd., Class N 9,000 302,485
Oil - Field Services 1.64%Eurasia Drilling Co. Ltd., Sponsored GDR 10,000 192,423
Oil & Gas - Integrated 3.29%PetroChina Co., Ltd., H shares, Sponsored ADR 900 98,757TNK-BP Holding 140,000 288,140
386,897
See notes to portfolios of investments and notes to financial statements.
�120

GLOBAL EMERGING MARKETS FUND
Portfolio of Investments (unaudited) June 30, 2010
COMMON STOCKS Shares Value
Oil & Gas Exploration & Production 0.28%Alange Energy Corp. 100,000 $ 32,878*
Pharmaceuticals 1.29%China Shineway Pharmaceutical Group Ltd. 50,000 152,149
Pipelines 1.91%China Gas Holdings Ltd. 400,000 224,428
Platinum 0.67%Eastern Platinum Ltd. 86,500 78,817*
Real Estate 0.91%LSR Group OJSC, GDR 14,300 106,475*
Retail 4.47%Magnit OAO, Sponsored GDR 5,000 85,584Wal-Mart de Mexico SAB de CV, Series V 123,800 274,180X5 Retail Group N.V., Sponsored GDR 5,000 166,125*
525,889
Retail - Hypermarkets 0.67%Grupo Comercial Chedraui S.A. de CV 30,000 78,384*
Schools 0.55%New Oriental Education & Technology Group, Inc., Sponsored ADR 700 65,233*
Semiconductors 0.37%Taiwan Semiconductor Manufacturing Co., Ltd. 23,230 43,245
Steel - Producers 0.77%Mechel, Sponsored ADR 5,000 90,700
Transport - Marine 0.75%China Shipping Development Co. Ltd., H shares 70,000 88,390
Total Common Stocks 9,783,291
(cost $9,603,757)
See notes to portfolios of investments and notes to financial statements.
�121

GLOBAL EMERGING MARKETS FUND
Portfolio of Investments (unaudited) June 30, 2010
EXCHANGE-TRADED FUNDS (ETF) 6.30% Shares Value
Emerging Global Shares Dow Jones Emerging Markets Energy TitansIndex ETF 600 $ 25,266
Emerging Global Shares Dow Jones Emerging Markets Metals & MiningTitans ETF 500 25,750
Global X/InterBolsa FTSE Colombia 20 ETF 900 30,060iShares FTSE/Xinhua A50 China Index ETF 20,000 29,303iShares FTSE/Xinhua China 25 Index Fund 750 29,347iShares MSCI All Peru Capped Index Fund 800 26,328iShares MSCI Brazil Index Fund 400 24,784iShares MSCI Chile Investable Market Index Fund 550 31,179iShares MSCI Hong Kong Index Fund 1,800 26,586iShares MSCI Malaysia Index Fund 2,400 27,456iShares MSCI Mexico Investable Market Index Fund 540 25,861iShares MSCI Singapore Index Fund 2,400 26,976iShares MSCI South Africa Index Fund 500 26,325iShares MSCI South Korea Index Fund 600 26,826iShares MSCI Taiwan Index Fund 2,500 28,000*Market Vectors Indonesia Index ETF 400 28,692Market Vectors Vietnam ETF 1,100 27,434PowerShares India Portfolio 1,400 31,346*SPDR Gold Trust 2,000 243,360*
Total Exchange-Traded Funds 740,879
(cost $752,431)
WARRANTS 0.00%
Diversified Metals & Mining 0.00%Orsu Metals Corp., Warrants (March 2011) 25,813 121*Orsu Metals Corp., Warrants (April 2012) 100,000 0*@
Total Warrants 121
(cost $0)
See notes to portfolios of investments and notes to financial statements.
�122

GLOBAL EMERGING MARKETS FUND
Portfolio of Investments (unaudited) June 30, 2010
PURCHASED OPTIONS 0.52% Contracts Value
Exchange-Traded Fund 0.52%iShares MSCI Emerging Markets Index, Strike Price 37, Put, Expiration
July 2010 (premium $32,077) 200 $ 22,200iShares MSCI Emerging Markets Index, Strike Price 39, Put, Expiration
Sep. 2010 (premium $15,100) 50 15,750SPDR Gold Trust, Strike Price 110, Call, Expiration July 2010
(premium $22,250) 20 23,100
Total Purchased Options 61,050
(cost $69,427)
Total Securities 10,585,341
(cost $10,425,615)
PrincipalREPURCHASE AGREEMENT 5.80% Amount
Joint Tri-Party Repurchase Agreement, Banc of America Securities LLCMerrill Lynch, 06/30/10, 0.01%, due 07/01/10, repurchase price$682,143, collateralized by U.S. Treasury securities held in a jointtri-party account (cost $682,143) $682,143 682,143
Total Investments 95.81% 11,267,484
(cost $11,107,758)Other assets and liabilities, net 4.19% 493,262
NET ASSETS 100% $11,760,746
See notes to portfolios of investments and notes to financial statements.
�123

CHINA REGION FUND
Portfolio of Investments (unaudited) June 30, 2010
COMMON STOCKS 75.88% Shares Value
Agricultural Chemicals 0.21%China Agritech, Inc. 10,000 $ 101,500*
Agricultural Operations 2.04%Chaoda Modern Agriculture Holdings Ltd. 1,000,000 969,583
Airlines 1.33%Air China Ltd., H shares 300,000 293,988*China Eastern Airlines Corp. Ltd., H shares 800,000 338,386*
632,374
Auto Manufacturers 3.24%Dongfeng Motor Group Co., Ltd., H shares 200,000 225,838PT Astra International Tbk 250,000 1,316,719
1,542,557
Auto Parts & Equipment 0.37%China Automotive Systems, Inc. 10,000 176,000*
Building Products 2.79%PT Holcim Indonesia Tbk 4,000,000 947,426*Semen Gresik Persero Tbk PT 400,000 382,753
1,330,179
Casino Hotels 1.24%Wynn Macau Ltd. 360,000 588,945*
Chemicals - Specialty 2.14%Huabao International Holdings Ltd. 800,000 1,020,782
Coal 2.13%China Shenhua Energy Co., Ltd., H shares 200,000 725,356Yanzhou Coal Mining Co. Ltd., Sponsored ADR 15,000 287,250
1,012,606
Commercial Banks - Non US 4.71%Bank Mandiri Tbk PT 1,900,000 1,237,788Bank of China Ltd., H shares 1,000,000 504,483Industrial and Commercial Bank of China Ltd., H shares 690,000 501,885
2,244,156
See notes to portfolios of investments and notes to financial statements.
�124

CHINA REGION FUND
Portfolio of Investments (unaudited) June 30, 2010
COMMON STOCKS Shares Value
Commercial Services 1.19%SIA Engineering Co., Ltd. 200,000 $ 566,464
Diversified Minerals 0.19%Erdene Resource Development Corp. 100,000 28,181*Woulfe Mining Corp. 834,800 62,734*
90,915
Diversified Operations 2.70%China Resources Enterprise Ltd. 350,000 1,288,184
E-Commerce 2.37%Ctrip.com International Ltd., Sponsored ADR 30,000 1,126,800
Education 0.62%CIBT Education Group, Inc. 453,632 294,027*
Electric Products - Miscellaneous 0.83%LG Innotek Co., Ltd. 3,000 394,420
Electronics & Components 5.83%Avago Technologies Ltd. 15,000 315,900*Byd Co., Ltd., H shares 50,000 368,572Harbin Electric, Inc. 10,000 166,500*Samsung Techwin Co., Ltd. 15,000 1,288,535Yageo Corp., Sponsored GDR 1 0*@Zhuzhou CSR Times Electric Co., Ltd., H shares 300,000 634,859
2,774,366
Financial Services 0.65%Bursa Malaysia Bhd 50,000 108,376Hong Kong Exchanges & Clearing Ltd. 6,500 101,520Singapore Exchange Ltd. 19,500 102,021
311,917
Food & Beverages 5.97%China Mengniu Dairy Co., Ltd. 150,000 485,395China Yurun Food Group Ltd. 350,000 1,095,614PT Indofood Sukses Makmur Tbk 2,800,000 1,264,773
2,845,782
See notes to portfolios of investments and notes to financial statements.
�125

CHINA REGION FUND
Portfolio of Investments (unaudited) June 30, 2010
COMMON STOCKS Shares Value
Food - Retail 2.30%Lianhua Supermarket Holdings Co., Ltd., H shares 300,000 $ 1,097,291
Gold Mining 3.62%Euromax Resources Ltd. 473,235 73,349*Kingsgate Consolidated Ltd. 2,599 20,600Lihir Gold Ltd., Sponsored ADR 8,000 287,920Olympus Pacific Minerals, Inc. 590,500 169,182*Zhaojin Mining Industry Co., Ltd., H shares 500,000 1,172,641
1,723,692
Hotels 1.23%Home Inns & Hotels Management, Inc., ADR 15,000 585,600*
Household Products 1.56%PT Unilever Indonesia Tbk 400,000 743,724
Insurance 2.55%China Life Insurance Co., Ltd., H shares 80,000 350,937CNinsure, Inc., Sponsored ADR 15,000 389,100PICC Property & Casualty Co. Ltd., H shares 500,000 473,847*
1,213,884
Internet 4.86%Asia Broadband, Inc. 500,000 0*@AsiaInfo Holdings, Inc. 15,000 327,900*Baidu, Inc., Sponsored ADR 12,000 816,960*NCSoft Corp. 2,500 411,720NHN Corp. 4,000 594,663*Perfect World Co., Ltd., Sponsored ADR 7,500 165,075*
2,316,318
Machinery 0.29%China Valves Technology, Inc. 15,000 139,950*
Medical Products 1.10%Shandong Weigao Group Medical Polymer Co. Ltd., H shares 120,000 522,783
Metal Processing 0.09%China Wind Systems, Inc. 10,000 45,000*
See notes to portfolios of investments and notes to financial statements.
�126

CHINA REGION FUND
Portfolio of Investments (unaudited) June 30, 2010
COMMON STOCKS Shares Value
Non-Ferrous Metals 0.04%Sterling Group Ventures, Inc. 500,000 $ 17,750*
Oil & Gas - Integrated 0.81%PetroChina Co., Ltd., H shares, Sponsored ADR 3,500 384,055
Oil & Gas Exploration & Production 2.54%CNOOC Ltd., Sponsored ADR 3,000 510,510Green Dragon Gas Ltd. 11,099 69,226*Kunlun Energy Company Ltd. 500,000 630,230
1,209,966
Oil Field Services 0.74%China Oilfield Services Ltd., H shares 300,000 350,800
Petrochemicals 0.00%Danhua Chemical Technology Co., Ltd., B shares 2 2*
Pharmaceuticals 2.04%China Shineway Pharmaceutical Group Ltd. 320,000 973,751
Pipelines 1.88%China Gas Holdings Ltd. 1,600,000 897,711
Power Supply 1.29%Dongfang Electric Corp. Ltd., H shares 200,000 613,965
Precious Metals 0.18%TVI Pacific, Inc. 1,000,000 84,543*
Publishing 0.02%Lingo Media Corp. 22,642 10,528*
Retail 4.86%361 Degrees International Ltd. 400,000 284,091Belle International Holdings Ltd. 1,000,000 1,420,299IT Ltd. 1,500,000 490,190Lao Feng Xiang Co., Ltd., B shares 1 2Little Sheep Group Ltd. 200,000 119,955
2,314,537
See notes to portfolios of investments and notes to financial statements.
�127

CHINA REGION FUND
Portfolio of Investments (unaudited) June 30, 2010
COMMON STOCKS Shares Value
Schools 0.49%New Oriental Education & Technology Group, Inc., Sponsored ADR 2,500 $ 232,975*
Semiconductors 0.53%Samsung Electronics Co., Ltd. 400 250,891
Silver Mining 0.93%Silvercorp Metals, Inc. 67,500 443,850
Steel - Producers 0.22%China Gerui Advanced Materials Group Ltd. 20,000 103,600*
Transport - Marine 0.80%China Shipping Development Co., Ltd., H shares 300,000 378,814
Vitamins & Nutrition Products 0.03%Synutra International, Inc. 1,000 16,170*
Water Treatment Systems 0.33%Beijing Enterprises Water Group Ltd. 500,000 155,611*
Total Common Stocks 36,139,318
(cost $31,402,121)
REAL ESTATE INVESTMENT TRUST (REIT) 1.95%
Champion REIT 2,000,000 929,606(cost $890,156)
EXCHANGE-TRADED FUNDS (ETF) 4.10%
iShares FTSE/Xinhua A50 China Index 70,000 102,560iShares FTSE/Xinhua China 25 Index Fund 2,600 101,738iShares MSCI Hong Kong Index Fund 6,700 98,959iShares MSCI Malaysia Index Fund 9,000 102,960iShares MSCI Singapore Index Fund 9,000 101,160iShares MSCI South Korea Index Fund 2,200 98,362iShares MSCI Taiwan Index Fund 9,000 100,800*Market Vectors Indonesia Index ETF 1,500 107,595Market Vectors Vietnam ETF 4,100 102,254SPDR Gold Trust 8,500 1,034,119*
Total Exchange-Traded Funds 1,950,507
(cost $1,882,993)
See notes to portfolios of investments and notes to financial statements.
�128

CHINA REGION FUND
Portfolio of Investments (unaudited) June 30, 2010
PURCHASED OPTION 0.22% Contracts Value
Exchange-Traded Fund 0.22%SPDR Gold Trust, Strike Price 110, Call, Expiration July 2010 90 $ 103,950
(premium $100,125)
Total Securities 39,123,381
(cost $34,275,395)
PrincipalREPURCHASE AGREEMENT 12.49% Amount
Joint Tri-Party Repurchase Agreement, Banc of America Securities LLCMerrill Lynch, 06/30/10, 0.01%, due 07/01/10, repurchase price$5,950,027, collateralized by U.S. Treasury securities held in a jointtri-party account (cost $5,950,025) $ 5,950,025 5,950,025
Total Investments 94.64% 45,073,406
(cost $40,225,420)Other assets and liabilities, net 5.36% 2,552,696
NET ASSETS 100% $47,626,102
See notes to portfolios of investments and notes to financial statements.
�129

Notes to Portfolios of Investments (unaudited) June 30, 2010
Legend
* Non-income producing security GO General Obligation Bond+ Affiliated company (see following) RS Restricted Security (see following)ADR American Depositary Receipt ZCB Zero Coupon BondGDR Global Depositary Receipt ^ Security or portion of security segregated as
collateral for written options@ Security was fair valued at June 30, 2010, by U.S. Global Investors, Inc. (Adviser) in accordance with
valuation procedures approved by the Board of Trustees. Fair valued securities, which were primarilycomposed of restricted securities, as a percentage of net assets at June 30, 2010, were, 1.39% of HolmesGrowth, 2.65% of Global MegaTrends, 3.87% of Global Resources, 0.85% of World Precious Minerals,0.62% of Gold and Precious Metals, 11.68% of Eastern European, and 1.84% of Global Emerging Markets.See the Fair Valuation of Securities section of these Notes to Portfolios of Investments for further discussionof fair valued securities. See further information and detail on restricted securities in the RestrictedSecurities section of these Notes to Portfolios of Investments.
General
The yields reflect the effective yield from the date of purchase.
Variable Rate Notes have periodic reset features, which effectively shorten the maturity dates and reset theinterest rates as tied to various interest-bearing instruments. Rates shown are current rates at June 30, 2010.
Securities with a 144A designation are exempt from registration under Rule 144A of the Securities Act of 1933.
Joint Tri-Party Repurchase Agreements
The terms of the joint tri-party repurchase agreements and the securities held as collateral at June 30, 2010,were:
Banc of America Securities LLC Merrill Lynch repurchase agreement, 06/30/10, 0.01%, due 07/01/10:Total principal amount: $82,905,402; Total repurchase price: $82,905,425Collateral:$68,462,800 U.S. Treasury Note, 4.875%, 08/15/16$5,938,553 U.S. Treasury Note 0.000%, 02/15/21
(total collateral market value, including accrued interest, of $84,563,510)
Credit Suisse Securities USA LLC repurchase agreement, 06/30/10, 0.01%, due 07/01/10:Total principal amount: $100,880,563; Total repurchase price: $100,880,591Collateral:$102,515,000 U.S. Treasury Note, 2.500%, 06/30/17
(total collateral market value, including accrued interest, of $102,899,428)
UBS Financial Securities, Inc. repurchase agreement, 06/30/10, 0.02%, due 07/01/10:Total principal amount: $47,763,182; Total repurchase price: $47,763,209Collateral:$23,000 U.S. Treasury Note, 0.625%, 06/30/12$19,585,000 U.S. Treasury Note, 3.375%, 06/30/13$18,572,000 U.S. Treasury Note, 3.375%, 07/31/13$2,927,000 U.S. Treasury Note, 4.250%, 08/15/13$3,931,300 U.S. Treasury Note, 2.750%, 10/31/13$90,000 U.S. Treasury Note, 4.625%, 02/15/17
(total collateral market value, including accrued interest, of $48,723,044)
�130

Notes to Portfolios of Investments (unaudited) June 30, 2010
Fair Valuation of Securities
For policies regarding the valuation of investments and other significant accounting policies, please refer to theNotes to Financial Statements.
The Funds are required to disclose information regarding the fair value measurements of a Fund’s assets andliabilities. Fair value is the price that would be received to sell an asset or paid to transfer a liability in an orderlytransaction between market participants at the measurement date. The disclosure requirement established athree-tier hierarchy to maximize the use of observable market data and minimize the use of unobservable inputsand to establish classification of fair value measurements for disclosure purposes. Inputs refer broadly to theassumptions that market participants would use in pricing the asset or liability, including assumptions about risk,for example, the risk inherent in a particular valuation technique used to measure fair value including such apricing model and/or the risk inherent in the inputs to the valuation technique. Inputs may be observable orunobservable. Observable inputs are inputs that reflect the assumptions market participants would use in pricingthe asset or liability developed based on market data obtained from sources independent of the reporting entity.Unobservable inputs are inputs that reflect the reporting entity’s own assumptions about the assumptions marketparticipants would use in pricing the asset or liability developed based on the best information available in thecircumstances.
The inputs or methodology used for valuing securities are not an indication of the risk associated with investing inthose securities. For example, money market securities are valued using amortized cost, in accordance with theinvestment Company Act of 1940. Generally, amortized cost reflects the current fair value of a security, but sincethe value is not obtained from a quoted price in an active market, such securities are reflected as Level 2. Fairvalue determinations are required for securities whose value is affected by a significant event that will materiallyaffect the value of a domestic or foreign security and which occurs subsequent to the time of the close of theprincipal market on which such domestic or foreign security trades but prior to the calculation of the Fund’s NAV.
The three levels defined by the fair value hierarchy are as follows:
Level 1 – quoted prices in active markets for identical securities.
Level 2 – significant observable inputs (including quoted prices for similar securities, interest rates, prepaymentspeeds, credit risk, etc.)
Level 3 – significant unobservable inputs (including the Fund’s own assumptions in determining the fair value ofinvestments).
In some instances, the inputs used to measure fair value might fall in different levels of the fair value hierarchy.The level in the fair value hierarchy within which the fair value measurement in its entirety falls is determinedbased on the lowest input level that is significant to the fair value measurement in its entirety. Because of theinherent uncertainties of valuation, the values reflected in the financial statements may materially differ from thevalue received upon actual sale of those investments.
�131

Notes to Portfolios of Investments (unaudited) June 30, 2010
The following table summarizes the valuation of each Fund’s securities as of June 30, 2010, using the fair valuehierarchy:
Quoted Pricesin Active Significant
Markets for Other SignificantIdentical Observable Unobservable
Investments Inputs Inputs(Level 1) (Level 2) (Level 3) Total
U.S. Treasury Securities Cash FundInvestments in securities*
U.S. Government Obligations $ — $ 59,996,665 $ — $ 59,996,665Repurchase Agreements 65,278,795 — — 65,278,795
Total $ 65,278,795 $ 59,996,665 $ — $125,275,460
U.S. Government Securities Savings FundInvestments in securities*
U.S. Government and Agency Obligations $ — $228,312,616 $ — $228,312,616
Total $ — $228,312,616 $ — $228,312,616
Near-Term Tax Free FundInvestments in securities*
Municipal Bonds $ — $ 23,402,168 $ — $ 23,402,168Repurchase Agreement 2,548,208 — — 2,548,208
Total $ 2,548,208 23,402,168 $ — $ 25,950,376
Tax Free FundInvestments in securities*
Municipal Bonds $ — $ 20,575,809 $ — $ 20,575,809Repurchase Agreement 1,036,817 — — 1,036,817
Total $ 1,036,817 $ 20,575,809 $ — $ 21,612,626
All American Equity FundInvestments in securities*
Common Stocks:Transportation $ 160,920 $ 2,905 $ — $ 163,825All Other Common Stocks 12,083,018 — — 12,083,018
Real Estate Investment Trust 138,120 — — 138,120Exchange-Traded Funds 483,480 — — 483,480Purchased Options 148,125 — — 148,125Repurchase Agreement 1,671,027 — — 1,671,027
Total $ 14,684,690 $ 2,905 $ — $ 14,687,595
�132

Notes to Portfolios of Investments (unaudited) June 30, 2010
Quoted Pricesin Active Significant
Markets for Other SignificantIdentical Observable Unobservable
Investments Inputs Inputs(Level 1) (Level 2) (Level 3) Total
Holmes Growth FundInvestments in securities*
Common Stocks:Financial Services $ 1,929,078 $ — $ 77,498 $ 2,006,576Medical - Hospitals — 335,823 — 335,823All Other Common Stocks 24,407,370 — — 24,407,370
Exchange-Traded Fund 572,250 — — 572,250Warrants:
Medical - Hospitals — 18,672 — 18,672All Other Warrants 360,598 — — 360,598
Purchased Options 400,772 — — 400,772Convertible Debenture:
Metal & Mineral Mining — — 380,000 380,000Repurchase Agreement 3,935,510 — — 3,935,510
Total $ 31,605,578 $ 354,495 $ 457,498 $ 32,417,571
Other Financial Instruments**Written Options $ 4,799 $ — $ — $ 4,799
Global MegaTrends FundInvestments in securities*
Common Stocks:Airlines $ — $ 169,193 $ — $ 169,193Airport Development/Maintenance — 264,636 — 264,636Auto Manufacturers — 403,726 — 403,726Building & Construction — 248,385 — 248,385Building Products — 392,594 — 392,594Electric - Integrated 1,636,185 307,906 — 1,944,091Electronics & Components — 622,001 — 622,001Pipelines — 448,855 — 448,855Power Converters/Power Supply
Equipment — 399,563 — 399,563Public Thoroughfares — 911,149 — 911,149Real Estate — 363,311 — 363,311Steel - Producers 181,400 460,954 — 642,354Transport - Marine — 176,780 — 176,780Transportation 790,330 269,234 — 1,059,564Water Treatment Systems — 940,394 — 940,394All Other Common Stocks 5,862,889 — — 5,862,889
Warrants 11,742 — — 11,742Purchased Options 111,000 — — 111,000Master Limited Partnerships 788,925 — — 788,925Convertible Debenture:
Metal & Mineral Mining — — 520,000 520,000Repurchase Agreement 1,951,062 — — 1,951,062
Total $ 11,333,533 $ 6,378,681 $ 520,000 $ 18,232,214
�133

Notes to Portfolios of Investments (unaudited) June 30, 2010
Quoted Pricesin Active Significant
Markets for Other SignificantIdentical Observable Unobservable
Investments Inputs Inputs(Level 1) (Level 2) (Level 3) Total
Global Resources FundInvestments in securities*
Common Stocks:Agricultural Operations $ — $ 2,020,878 $ — $ 2,020,878Coal 3,727,096 — 231,343 3,958,439General Metal & Mineral Mining 7,677,075 8,716,196 — 16,393,271Oil & Gas Exploration & Production 212,995,948 1,207,705 10,001,196 224,204,849Oil & Gas Refining and Marketing — — 397,591 397,591Medical - Hospitals — 801,275 — 801,275Natural Resource Technology — — 7,500 7,500Platinum 3,225,306 — 19,821 3,245,127Uranium 1,765,225 — 2,062,500 3,827,725All Other Common Stocks 221,015,009 — — 221,015,009
Exchange-Traded Fund 8,517,600 — — 8,517,600Warrants:
Medical - Hospitals — 43,412 — 43,412Oil & Gas Exploration & Production 976,939 6,116,279 — 7,093,218All Other Warrants 23,059,472 — — 23,059,472
Purchased Options 3,475,454 — — 3,475,454Convertible Debenture:
Metal & Mineral Mining — — 4,900,000 4,900,000Repurchase Agreement 66,666,988 — — 66,666,988
Total $ 553,102,112 $ 18,905,745 $17,619,951 $589,627,808
Other Financial Instruments**Written Options $ 445,799 $ — $ — $ 445,799
�134

Notes to Portfolios of Investments (unaudited) June 30, 2010
Quoted Pricesin Active Significant
Markets for Other SignificantIdentical Observable Unobservable
Investments Inputs Inputs(Level 1) (Level 2) (Level 3) Total
World Precious Minerals FundInvestments in securities*
Common Stocks:Agricultural Operations $ — $ 1,250,845 $ — $ 1,250,845Diamond Mining & Exploration 2,319,095 4,265,989 — 6,585,084Gold/Mineral Exploration & Development 159,684,931 17,696,394 747,827 178,129,152Intermediate & Junior Gold Producers 91,752,612 5,525,506 2,888,545 100,166,663Medical - Hospitals — 1,507,511 — 1,507,511Metal & Mineral Mining & Exploration 11,542,692 5,499,069 — 17,041,761Platinum 24,718,348 — 178,389 24,896,737Silver Mining 18,434,606 2,780,937 — 21,215,543All Other Common Stocks 154,191,872 — — 154,191,872
Exchange-Traded Funds 21,508,890 — — 21,508,890Warrants:
Gold/Mineral Exploration & Development 1,235,748 169,320 223,143 1,628,211Intermediate & Junior Gold Producers 5,313,818 130,290 — 5,444,108Medical - Hospitals — 79,356 — 79,356Metal & Mineral Mining & Exploration — — — —Silver Mining 12,193,957 857,480 — 13,051,437All Other Warrants 33,455,590 — — 33,455,590
Special Warrants — — — —Right 94,874 — — 94,874Purchased Options 180,772 — — 180,772Repurchase Agreement 39,471,105 — — 39,471,105
Total $576,098,910 $ 39,762,697 $ 4,037,904 $619,899,511
Gold and Precious Metals FundInvestments in securities*
Common Stocks:Diamond Mining & Exploration $ — $ 1,066,497 $ — $ 1,066,497Gold Mining 145,006,662 4,416,274 962,848 150,385,784Medical - Hospitals — 641,423 — 641,423Silver Mining — 1,787,745 — 1,787,745All Other Common Stocks 25,569,347 — — 25,569,347
Exchange-Traded Funds 12,241,960 — — 12,241,960Warrants:
Gold Mining 15,008,822 — — 15,008,822Medical - Hospitals — 34,076 — 34,076Silver Mining 6,790,477 461,720 — 7,252,197All Other Warrants 1,177,249 — — 1,177,249
Repurchase Agreement 14,594,286 — — 14,594,286
Total $220,388,803 $ 8,407,735 $ 962,848 $229,759,386
Other Financial Instruments**Written Options $ 9,950 $ — $ — $ 9,950
�135

Notes to Portfolios of Investments (unaudited) June 30, 2010
Quoted Pricesin Active Significant
Markets for Other SignificantIdentical Observable Unobservable
Investments Inputs Inputs(Level 1) (Level 2) (Level 3) Total
Eastern European FundInvestments in securities*
Common Stocks:Airport Development $ — $ 1,764,240 $ — $ 1,764,240Appliances — 6,269,094 — 6,269,094Auto Manufacturers — 7,065,197 — 7,065,197Building Products — 2,414,614 — 2,414,614Commercial Banks - Non US 2,170,000 98,736,562 — 100,906,562Diversified Metals & Mining 887,279 4,291,392 — 5,178,671Diversified Operations — 4,007,769 — 4,007,769Electric - Integrated — 6,004,163 — 6,004,163Electric Utility — 3,550,906 — 3,550,906Food - Meat Products — 2,139,790 — 2,139,790Investment Companies — 400,461 — 400,461Medical - Drugs — 10,081,013 — 10,081,013Metal Processing & Fabrication — 1,074,225 — 1,074,225Oil - Field Services — 2,597,715 — 2,597,715Oil & Gas - Integrated 11,171,278 37,588,448 — 48,759,726Oil & Gas Exploration & Production 868,911 21,296,766 — 22,165,677Real Estate — 5,928,423 — 5,928,423Retail — 19,001,092 — 19,001,092Retail - Food — 2,762,923 — 2,762,923Silver Mining — 4,655,587 — 4,655,587Steel - Producers 10,884,000 21,447,594 — 32,331,594Telecommunications 5,678,280 10,131,944 — 15,810,224Transportation — 3,769,281 — 3,769,281All Other Common Stocks 17,352,754 — — 17,352,754
Preferred Stocks:Oil & Gas Exploration & Production — 2,411,538 — 2,411,538Steel - Producers 1,039,500 — — 1,039,500
Warrants 1,052,088 — — 1,052,088Purchased Options 2,325,000 — — 2,325,000Repurchase Agreement 27,763,182 — — 27,763,182
Total $ 81,192,272 $279,390,737 $ — $360,583,009
�136

Notes to Portfolios of Investments (unaudited) June 30, 2010
Quoted Pricesin Active Significant
Markets for Other SignificantIdentical Observable Unobservable
Investments Inputs Inputs(Level 1) (Level 2) (Level 3) Total
Global Emerging Markets FundInvestments in securities*
Common Stocks:Airlines $ — $ 84,597 $ — $ 84,597Airport Development — 70,570 — 70,570Auto Manufacturers — 100,931 — 100,931Building & Construction — 153,490 — 153,490Building Products — 176,175 — 176,175Cellular Telecommunications 481,220 104,272 — 585,492Commercial Banks - Non US 246,560 962,859 — 1,209,419Department Stores — 373,681 — 373,681Electric - Integrated — 153,953 — 153,953Electric Products - Miscellaneous — 92,031 — 92,031Electronics & Components 41,625 596,660 — 638,285Financial Services 56,028 139,636 — 195,664Food 208,560 145,618 — 354,178Gold Mining 864,798 187,623 — 1,052,421Healthcare Equipment & Services — 234,833 — 234,833Insurance 90,790 206,337 — 297,127Internet 248,260 232,612 — 480,872Investment Companies — 61,609 — 61,609Medical - Drugs — 109,073 — 109,073Multimedia — 302,485 — 302,485Oil - Field Services — 192,423 — 192,423Oil & Gas - Integrated 98,757 288,140 — 386,897Pharmaceuticals — 152,149 — 152,149Pipelines — 224,428 — 224,428Real Estate — 106,475 — 106,475Retail — 525,889 — 525,889Semiconductors — 43,245 — 43,245Transport - Marine — 88,390 — 88,390All Other Common Stocks 1,336,509 — — 1,336,509
Exchange-Traded Funds 711,576 29,303 — 740,879Warrants 121 — — 121Purchased Options 61,050 — — 61,050Repurchase Agreement 682,143 — — 682,143
Total $ 5,127,997 $ 6,139,487 $ — $ 11,267,484
�137

Notes to Portfolios of Investments (unaudited) June 30, 2010
Quoted Pricesin Active Significant
Markets for Other SignificantIdentical Observable Unobservable
Investments Inputs Inputs(Level 1) (Level 2) (Level 3) Total
China Region FundInvestments in securities*
Common Stocks:Agricultural Operations $ — $ 969,583 $ — $ 969,583Airlines — 632,374 — 632,374Auto Manufacturers — 1,542,557 — 1,542,557Building Products — 1,330,179 — ,330,179Casino Hotels — 588,945 — 588,945Chemicals - Specialty — 1,020,782 — 1,020,782Coal 287,250 725,356 — 1,012,606Commercial Banks - Non US — 2,244,156 — 2,244,156Commercial Services — 566,464 — 566,464Diversified Operations — 1,288,184 — 1,288,184Electric Products - Miscellaneous — 394,420 — 394,420Electronics & Components 482,400 2,291,966 — 2,774,366Financial Services — 311,917 — 311,917Food & Beverages — 2,845,782 — 2,845,782Food-Retail — 1,097,291 — 1,097,291Gold Mining 530,451 1,193,241 — 1,723,692Household Products — 743,724 — 743,724Insurance 389,100 824,784 — 1,213,884Internet 1,309,935 1,006,383 — 2,316,318Medical Products — 522,783 — 522,783Oil & Gas Exploration & Production 510,510 699,456 — 1,209,966Oil Field Services — 350,800 — 350,800Petrochemicals — 2 — 2Pharmaceuticals — 973,751 — 973,751Pipelines — 897,711 — 897,711Power Supply — 613,965 — 613,965Retail — 2,314,537 — 2,314,537Semiconductors — 250,891 — 250,891Transport - Marine — 378,814 — 378,814Water Treatment Systems — 155,611 — 155,611All Other Common Stocks 3,853,263 — — 3,853,263
Real Estate Investment Trust — 929,606 — 929,606Exchange-Traded Funds 1,665,588 284,919 — 1,950,507Purchased Option 103,950 — — 103,950Repurchase Agreement 5,950,025 — — 5,950,025
Total $ 15,082,472 $ 29,990,934 $ — $ 45,073,406
For the six months ended June 30, 2010, the funds did not have any significant transfers between Level 1 andLevel 2.
* Refer to the portfolio of investments for a detailed list of the fund’s investments.
** Other financial instruments include currency contracts and written options. Currency contracts and writtenoptions are reported at their unrealized appreciation/depreciation at measurement date, which represents thechange in the contract’s value from trade date.
�138

Notes to Portfolios of Investments (unaudited) June 30, 2010
The following is a reconciliation of assets for which significant unobservable inputs (Level 3) were used indetermining fair value during the period January 1, 2010, through June 30, 2010:
Change inunrealized
appreciation(depreciation)
Change in Transfers fromBeginning Total unrealized Net in and/or Ending InvestmentsBalance realized appreciation purchases out of Balance held as of12/31/09 gain (loss) (depreciation) (sales) Level 3 06/30/10 06/30/10
Holmes Growth FundInvestments inSecuritiesCommon Stock:FinancialServices $ 78,523 $ — $ (1,025) $ — $ — $ 77,498 $ (1,025)
Convertible Debenture:Metal & MineralMining — — — 380,000 — 380,000 —
Total Investmentsin Securities $ 78,523 $ — $ (1,025) $ 380,000 $ — $ 457,498 $ (1,025)
Global MegaTrends FundInvestments inSecuritiesConvertible Debenture:Metal & MineralMining $ — $ — $ — $ 520,000 $ — $ 520,000 $ —
Total Investmentsin Securities $ — $ — $ — $ 520,000 $ — $ 520,000 $ —
Global Resources FundInvestments inSecuritiesCommon Stock:Coal $ 247,019 $ — $ (15,676) $ — $ — $ 231,343 $ (15,676)Gold & SilverMining — — — — — — —
NaturalResourceTechnology — — — — 7,500 7,500 —
Oil & GasExploration &Production — — — — 10,001,196 10,001,196 —
Oil & GasRefining andMarketing 537,136 — (139,545) — — 397,591 (139,545)
Platinum 20,966 — (1,145) — — 19,821 (1,145)Sugar/Ethanol — — — — — — —Uranium 525,000 — 1,545,000 — (7,500) 2,062,500 1,545,000
Warrants:Coal — — — — — — —General Metal &Mineral Mining — — — — — — —
Oil & GasExploration &Production — — — — — — —
Units:General Metal &Mineral Mining 809,023 — (91,740) — (717,283) — —
Oil & GasExploration &Production 10,001,196 — — — (10,001,196) — —
Convertible Debenture:Metal & MineralMining — — — 4,900,000 — 4,900,000 —
Total Investmentsin Securities $12,140,340 $ — $1,296,894 $ 4,900,000 $ (717,283) $17,619,951 $1,388,634
�139

Notes to Portfolios of Investments (unaudited) June 30, 2010
Change inunrealized
appreciation(depreciation)
Change in Transfers fromBeginning Total unrealized Net in and/or Ending InvestmentsBalance realized appreciation purchases out of Balance held as of12/31/09 gain (loss) (depreciation) (sales) Level 3* 06/30/10 06/30/10
World Precious Minerals FundInvestments inSecuritiesCommon Stock:DiamondMining &Exploration $ — $ — $ — $ — $ — $ — $ —
Gold/MineralExploration &Development 3,124,059 — (510,014) — (1,866,218) 747,827 (61,278)
Intermediate &Junior GoldProducers — — — 2,888,545 — 2,888,545 —
Platinum 188,690 — (10,301) — — 178,389 (10,301)Warrants:Gold/MineralExploration &Development 241,427 — (18,284) — — 223,143 (18,284)
Intermediate &Junior GoldProducers — — — — — — —
Special Warrants:Gold/MineralExploration &Development — — — — — — —
Notes:Intermediate &Junior GoldProducers 1,027,682 (333,913) 445,070 (1,138,839) — — —
Units:Gold/MineralExploration &Development 1,855,994 — (16,805) — (1,839,189) — —
Total Investmentsin Securities $ 6,437,852 $(333,913) $ (110,334) $ 1,749,706 $ (3,705,407) $ 4,037,904 $ (89,863)
Gold and Precious MetalsInvestments inSecuritiesCommon Stocks:Gold Mining $ — $ — $ — $ 962,848 $ — $ 962,848 $ —
Notes:Gold Mining 285,467 (92,754) 123,631 (316,344) — — —
Total Investmentsin Securities $ 285,467 $ (92,754) $ 123,631 $ (646,504) $ — $ 962,848 $ —
* The Funds’ policy is to recognize transfers in and transfers out as of the end of the reporting period.
�140

Notes to Portfolios of Investments (unaudited) June 30, 2010
Affiliated Companies - Indicated in Portfolio of Investments as ‘‘+’’
The Investment Company Act of 1940 defines affiliates as companies in which the Fund owns at least 5% of theoutstanding voting securities. The following is a summary of transactions with each affiliated company during theperiod ended June 30, 2010.
Shares of Affiliated CompaniesHolmes Growth Fund December 31, 2009 Additions Reductions June 30, 2010
MCO Capital, Inc. 1,000,000 — — 1,000,000
At June 30, 2010, the value of investments in affiliated companies was $77,498, representing 0.23% of netassets, and the total cost was $78,441. There were no realized gains or losses on transactions. There was noincome earned for the period.
Shares of Affiliated CompaniesGlobal Resources Fund December 31, 2009 Additions Reductions June 30, 2010
Agriterra Ltd. 46,380,108 15,256 — 46,395,364Natasa Mining Ltd. 1,099,160 — (60,810) 1,038,350(a)NiMin Energy Corp. 2,631,580 — (731,580) 1,900,000(a)Range Energy Resources, Inc. (formerly
Range Metals, Inc.) 15,000,000 — — 15,000,000
At June 30, 2010, the value of investments in affiliated companies was $4,557,161, representing 0.73% of netassets, and the total cost was $10,431,063. Net realized losses on transactions were $543,497, and there was noincome earned for the period.
Shares of Affiliated CompaniesWorld Precious Minerals Fund December 31, 2009 Additions Reductions June 30, 2010
Agriterra Ltd. 28,207,200 509,744 — 28,716,944Aldridge Minerals, Inc. 1,145,100 154,900 — 1,300,000(a)Candente Gold Corp. 4,875,000 435,000 — 5,310,000Carnavale Resources Ltd. 3,500,000 — — 3,500,000(a)Chesapeake Gold Corp. 2,042,219 7,781 (442,900) 1,607,100(a)Gran Colombia Gold, S.A. — 12,300,000 — 12,300,000Hainan Mining Corp. plc 2,018,700 — — 2,018,700Klondex Mines Ltd. 2,575,000 25,000 — 2,600,000Medoro Resources Ltd. 10,687,557 11,600,000 — 22,287,557Moss Lake Gold Mines Ltd. 3,182,000 — — 3,182,000Rochester Resources Ltd. 7,130,000 600,000 — 7,730,000Romarco Minerals, Inc. 16,845,706 4,270,000 (420,000) 20,695,706(a)Rye Patch Gold Corp. 3,800,000 — — 3,800,000(a)
At June 30, 2010, the value of investments in affiliated companies was $28,212,871, representing 4.54% of netassets, and the total cost was $24,955,019. Net realized gains on transactions were $3,179,948, and there wasno income earned for the period.
(a) At June 30, 2010, the company is no longer defined as an affiliate, although it was an affiliated companyduring the year.
�141

Notes to Portfolios of Investments (unaudited) June 30, 2010
Restricted Securities - Indicated in Portfolio of Investments as‘‘RS’’
The following securities are subject to contractual and regulatory restrictions on resale or transfer. Theseinvestments may involve a high degree of business and financial risk. Because of the thinly traded markets forthese investments, a Fund may be unable to liquidate its securities in a timely manner, especially if there isnegative news regarding the specific securities or the markets overall. These securities could decline significantlyin value before the Fund could liquidate these securities. The issuer bears the cost of registration, if any, involvedin the disposition of these securities.
Acquisition Cost perHolmes Growth Fund Date Share/Unit
Grupo Empresarial Ibiza S.A., Convertible Debenture 04/19/10 $100.00MCO Capital, Inc. 12/04/09 $0.08
As of June 30, 2010, the total cost of restricted securities was $458,441 and the total value was $457,498,representing 1.34% of net assets.
Acquisition Cost perGlobal MegaTrends Fund Date Share/Unit
Grupo Empresarial Ibiza S.A., Convertible Debenture 04/19/10 $100.00
As of June 30, 2010, the total cost of restricted securities was $520,000 and the total value was $520,000,representing 2.65% of net assets.
Acquisition Cost perGlobal Resources Fund Date Share/Unit
GoviEX Uranium, Inc. 10/04/07 $1.96Grupo Empresarial Ibiza S.A., Convertible Debenture 04/19/10 $100.00HRT Participacoes Em Petroleo 10/28/09 $1,412.00HRT Participacoes Em Petroleo, Warrants (November 2013) 10/28/09 $0.00I-Pulse, Inc. (formerly GoviEx IP Holdings, Inc.) 10/04/07 $1.88I-Pulse, Inc., Warrants (December 2010) 10/04/07 $0.00Ivanhoe Nickel and Platinum Ltd. 07/09/03 $5.00Lithium Americas Corp. 12/22/09 $1.42Osmium Holdings S.A. 10/22/96-01/29/98 $987.07Value Creation, Inc. 08/11/06 $10.60
As of June 30, 2010, the total cost of restricted securities was $20,754,342 and the total value was $17,919,583,representing 2.85% of net assets.
Acquisition Cost perWorld Precious Minerals Fund Date Share/Unit
Elissa Resources Ltd. 04/19/10 $0.00Gran Colombia Gold, S.A. 04/20/10 $0.25Hainan Mining Corp. plc 08/31/06-05/16/07 $0.85Hainan Mining Corp. plc, Warrants (May 2011) 05/16/07 $0.00Hainan Mining Corp. plc, Warrants (August 2011) 08/31/06 $0.00Ivanhoe Nickel and Platinum Ltd. 07/09/03 $5.00Miocene Metals Ltd., Special Warrants (October 2011) 04/28/10 $0.00Osmium Holdings S.A. 10/22/96-01/29/98 $1,280.75Q2 Gold Resources, Inc. 06/18/07 $0.00Western Exploration & Development Ltd., 144A, Special
Warrants (December 2049) 08/14/97 $0.50
�142

Notes to Portfolios of Investments (unaudited) June 30, 2010
As of June 30, 2010, the total cost of restricted securities was $6,915,129 and the total value was $4,037,904,representing 0.65% of net assets.
Acquisition Cost perGold and Precious Metals Fund Date Share/Unit
Gran Colombia Gold, S.A. 04/20/10 $0.25
As of June 30, 2010, the total cost of restricted securities was $1,026,643, and the total value was $962,848,representing 0.41% of net assets.
�143

Statements of Assets and Liabilities (unaudited)
U.S. TreasurySecuritiesCash Fund
Investments, at identified cost $ 125,275,460
ASSETSInvestments, at value:
Securities $ 59,996,665Repurchase agreements 65,278,795
Cash 154Receivables:
Investments sold —Interest 24Capital shares sold 334,975From adviser 17,904
Other assets 14,527Total Assets 125,643,044
LIABILITIESPayables:
Investments purchased 19,997,511Capital shares redeemed 354,218Dividends and distributions 6Accounts payable and accrued expenses 18,581Due to custodian —
Total Liabilities 20,370,316
Net Assets $105,272,728
NET ASSETS CONSIST OF:Paid-in capital $ 105,271,803Accumulated undistributed net investment income 1,210Accumulated net realized gain (loss) on investments (285)Net unrealized appreciation of investments —
Net assets applicable to capital shares outstanding $ 105,272,728
By share classNet AssetsInvestor class $ 105,272,728
Capital shares outstanding, an unlimited number ofno par shares authorizedInvestor class 105,347,600
Net Asset Value, Public Offering Price, RedemptionPrice, per shareInvestor class $ 1.00
See accompanying notes to financial statements.
�144

June 30, 2010
U.S. GovernmentSecurities Near-Term Tax Free
Savings Fund Tax Free Fund Fund
$ 228,312,616 $ 25,167,197 $ 20,922,593
$ 228,312,616 $ 23,402,168 $ 20,575,809— 2,548,208 1,036,817
554 — 154
— 25,000 106,458125,035 301,335 272,560227,704 165,221 178,992
9,601 3,674 22024,795 2,182 2,659
228,700,305 26,447,788 22,173,669
— — —424,234 3,831 1,292
16 7,991 12,61433,808 24,446 23,910
— 346 —458,058 36,614 37,816
$228,242,247 $26,411,174 $22,135,853
$ 227,979,943 $ 25,895,799 $ 21,916,587261,366 21,345 36,979
938 (289,149) (507,746)— 783,179 690,033
$ 228,242,247 $ 26,411,174 $ 22,135,853
$ 228,242,247 $ 26,411,174 $ 22,135,853
228,408,919 11,830,040 1,795,559
$ 1.00 $ 2.23 $ 12.33
�145

Statements of Assets and Liabilities (unaudited)
All American Holmes GrowthEquity Fund Fund
Investments, at identified cost $ 14,461,897 $ 29,654,552
ASSETSInvestments, at value:
Securities of unaffiliated issuers $ 13,016,568 $ 28,404,563Securities of affiliated issuers — 77,498Repurchase agreements 1,671,027 3,935,510
Cash 154 154Foreign currencies (Cost $0, $808, $0, $90,413 and
$108,052) — 796Receivables:
Investments sold 521,361 1,898,370Dividends and interest 17,237 12,550Capital shares sold 61,581 970
Other assets 8,030 9,543Total Assets 15,295,958 34,339,954
LIABILITIESPayables:
Investments purchased — —Capital shares redeemed 40,113 7,152Adviser and affiliates 10,049 37,323Accounts payable and accrued expenses 26,909 32,799Written options at value (Premiums $0, $68,799, $0,
$663,299 and $0) — 64,000Due to custodian — —
Total Liabilities 77,071 141,274
Net Assets $15,218,887 $34,198,680
NET ASSETS CONSIST OF:Paid-in capital $ 19,559,630 $ 39,509,010Accumulated undistributed net investment income
(distributions in excess of net investment income) 12,339 (409,888)Accumulated net realized loss on investments and foreign
currencies (4,578,780) (7,668,248)Net unrealized appreciation (depreciation) of investments and
other assets and liabilities denominated in foreigncurrencies 225,698 2,767,806
Net assets applicable to capital shares outstanding $ 15,218,887 $ 34,198,680
By share classNet AssetsInvestor class $ 15,218,887 $ 34,198,680Institutional class n/a n/a
Capital shares outstanding, anunlimited number of no par sharesauthorizedInvestor class 810,453 2,246,059Institutional class n/a n/a
Net Asset Value, Public OfferingPrice, Redemption Price, per shareInvestor class $ 18.78 $ 15.23Institutional class n/a n/aSee accompanying notes to financial statements.
�146
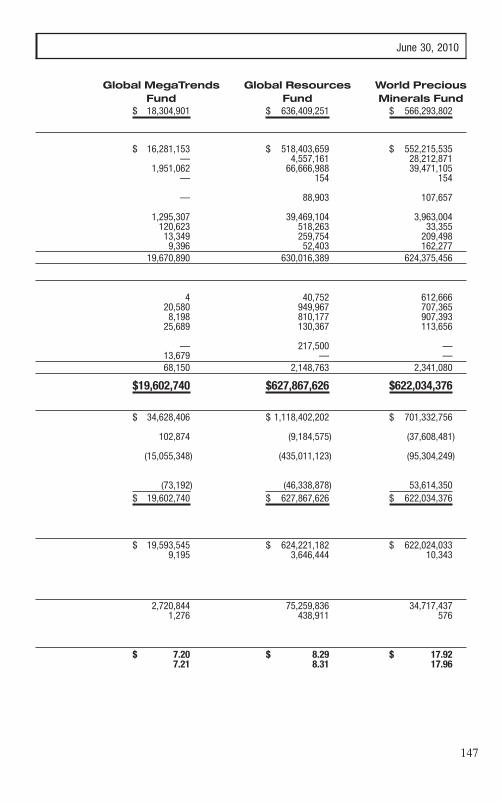
June 30, 2010
Global MegaTrends Global Resources World PreciousFund Fund Minerals Fund
$ 18,304,901 $ 636,409,251 $ 566,293,802
$ 16,281,153 $ 518,403,659 $ 552,215,535— 4,557,161 28,212,871
1,951,062 66,666,988 39,471,105— 154 154
— 88,903 107,657
1,295,307 39,469,104 3,963,004120,623 518,263 33,35513,349 259,754 209,4989,396 52,403 162,277
19,670,890 630,016,389 624,375,456
4 40,752 612,66620,580 949,967 707,3658,198 810,177 907,393
25,689 130,367 113,656
— 217,500 —13,679 — —68,150 2,148,763 2,341,080
$19,602,740 $627,867,626 $622,034,376
$ 34,628,406 $ 1,118,402,202 $ 701,332,756
102,874 (9,184,575) (37,608,481)
(15,055,348) (435,011,123) (95,304,249)
(73,192) (46,338,878) 53,614,350$ 19,602,740 $ 627,867,626 $ 622,034,376
$ 19,593,545 $ 624,221,182 $ 622,024,0339,195 3,646,444 10,343
2,720,844 75,259,836 34,717,4371,276 438,911 576
$ 7.20 $ 8.29 $ 17.927.21 8.31 17.96
�147

Statements of Assets and Liabilities (unaudited)
Gold and PreciousMetals Fund
Investments, at identified cost $ 188,954,192
ASSETSInvestments, at value:
Securities $ 215,165,100Repurchase agreements 14,594,286
Cash 154Foreign currencies (Cost $222,790, $46,947, $6,046 and $294,495) 221,974Receivables:
Investments sold 5,606,807Dividends and interest 26,335Capital shares sold 297,234
Other assets 29,863Total Assets 235,941,753
LIABILITIESPayables:
Investments purchased 249,089Capital shares redeemed 290,797Adviser and affiliates 309,179Accounts payable and accrued expenses 69,760Written options at value (Premiums $15,950, $0, $0 and $0) 6,000
Total Liabilities 924,825
Net Assets $235,016,928
NET ASSETS CONSIST OF:Paid-in capital 208,058,392Distributions in excess of net investment income (3,742,492)Accumulated net realized loss on investments and foreign currencies (10,099,890)Net unrealized appreciation of investments and other assets and liabilities
denominated in foreign currencies 40,800,918Net assets applicable to capital shares outstanding $ 235,016,928
By share class
Net AssetsInvestor class $ 235,016,928
Capital shares outstanding, an unlimited numberof no par shares authorizedInvestor class 14,176,137
Net Asset Value, Public Offering Price,Redemption Price, per shareInvestor class $ 16.58See accompanying notes to financial statements.
�148
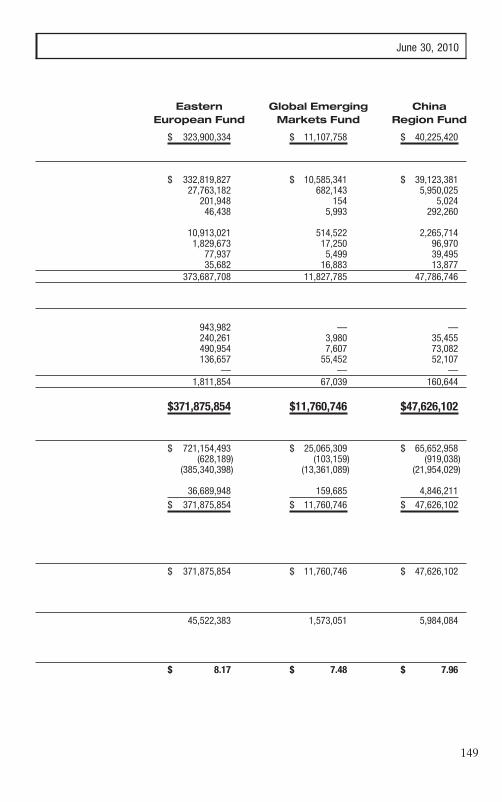
June 30, 2010
Eastern Global Emerging ChinaEuropean Fund Markets Fund Region Fund
$ 323,900,334 $ 11,107,758 $ 40,225,420
$ 332,819,827 $ 10,585,341 $ 39,123,38127,763,182 682,143 5,950,025
201,948 154 5,02446,438 5,993 292,260
10,913,021 514,522 2,265,7141,829,673 17,250 96,970
77,937 5,499 39,49535,682 16,883 13,877
373,687,708 11,827,785 47,786,746
943,982 — —240,261 3,980 35,455490,954 7,607 73,082136,657 55,452 52,107
— — —1,811,854 67,039 160,644
$371,875,854 $11,760,746 $47,626,102
$ 721,154,493 $ 25,065,309 $ 65,652,958(628,189) (103,159) (919,038)
(385,340,398) (13,361,089) (21,954,029)
36,689,948 159,685 4,846,211$ 371,875,854 $ 11,760,746 $ 47,626,102
$ 371,875,854 $ 11,760,746 $ 47,626,102
45,522,383 1,573,051 5,984,084
$ 8.17 $ 7.48 $ 7.96
�149

Statements of Operations (unaudited)
U.S. TreasurySecuritiesCash Fund
NET INVESTMENT INCOME
Income:Interest and other $ 71,545
Expenses:Management fee 262,544Administrative services fee 42,007Transfer agent fees and expenses 117,770Accounting service fees and expenses 10,172Professional fees 17,012Custodian fees 29,320Shareholder reporting expenses 12,926Registration fees 11,287Trustee fees and expenses 9,397Miscellaneous expenses 18,148
Total expenses before reductions 530,583Expenses offset - Note 1 H —Expenses reimbursed - Note 3 (464,294)
Net Expenses 66,289
Net Investment Income 5,256
NET REALIZED AND UNREALIZED GAIN (LOSS)ON INVESTMENTS
Realized gain (loss) from securities —Net change in unrealized appreciation of Investments —
Net Realized and Unrealized Gain on Investments —
Net Increase In Net AssetsResulting From Operations $ 5,256
See accompanying notes to financial statements.
�150

For the Six Months Ended June 30, 2010
U.S. Government Near-TermSecurities Tax Free
Savings Fund Fund Tax Free Fund
$ 201,960 $ 367,751 $ 472,641
598,538 61,050 81,04395,842 9,768 8,645
148,540 26,635 25,67420,065 19,091 17,40822,961 18,456 17,62628,926 6,345 5,15219,377 1,959 2,33713,320 9,121 8,2359,397 9,396 9,396
34,053 3,758 4,333
991,019 165,579 179,849— (56) (85)
(801,036) (110,578) (104,124)
189,983 54,945 75,640
11,977 312,806 397,001
938 (444) 13,128— 198,324 209,835
938 197,880 222,963
$12,915 $510,686 $619,964
�151
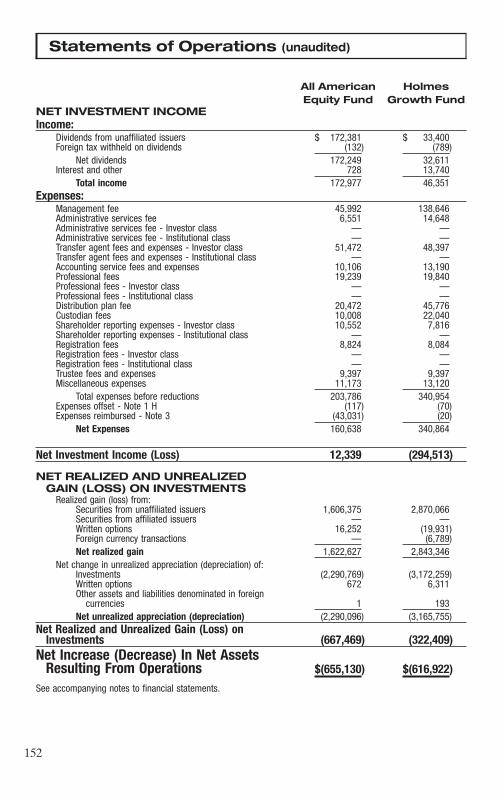
Statements of Operations (unaudited)
All American HolmesEquity Fund Growth Fund
NET INVESTMENT INCOMEIncome:
Dividends from unaffiliated issuers $ 172,381 $ 33,400Foreign tax withheld on dividends (132) (789)
Net dividends 172,249 32,611Interest and other 728 13,740
Total income 172,977 46,351Expenses:
Management fee 45,992 138,646Administrative services fee 6,551 14,648Administrative services fee - Investor class — —Administrative services fee - Institutional class — —Transfer agent fees and expenses - Investor class 51,472 48,397Transfer agent fees and expenses - Institutional class — —Accounting service fees and expenses 10,106 13,190Professional fees 19,239 19,840Professional fees - Investor class — —Professional fees - Institutional class — —Distribution plan fee 20,472 45,776Custodian fees 10,008 22,040Shareholder reporting expenses - Investor class 10,552 7,816Shareholder reporting expenses - Institutional class — —Registration fees 8,824 8,084Registration fees - Investor class — —Registration fees - Institutional class — —Trustee fees and expenses 9,397 9,397Miscellaneous expenses 11,173 13,120
Total expenses before reductions 203,786 340,954Expenses offset - Note 1 H (117) (70)Expenses reimbursed - Note 3 (43,031) (20)
Net Expenses 160,638 340,864
Net Investment Income (Loss) 12,339 (294,513)
NET REALIZED AND UNREALIZEDGAIN (LOSS) ON INVESTMENTS
Realized gain (loss) from:Securities from unaffiliated issuers 1,606,375 2,870,066Securities from affiliated issuers — —Written options 16,252 (19,931)Foreign currency transactions — (6,789)Net realized gain 1,622,627 2,843,346
Net change in unrealized appreciation (depreciation) of:Investments (2,290,769) (3,172,259)Written options 672 6,311Other assets and liabilities denominated in foreign
currencies 1 193Net unrealized appreciation (depreciation) (2,290,096) (3,165,755)
Net Realized and Unrealized Gain (Loss) onInvestments (667,469) (322,409)
Net Increase (Decrease) In Net AssetsResulting From Operations $(655,130) $(616,922)
See accompanying notes to financial statements.
�152

For the Six Months Ended June 30, 2010
Global MegaTrends Global Resources World PreciousFund Fund Minerals Fund
$ 344,056 $ 2,330,992 $ 487,452(20,929) (103,614) (46,598)
323,127 2,227,378 440,85417,319 277,396 81,079
340,446 2,504,774 521,933
106,105 3,638,297 3,821,0286,632 191,548 167,3833,255 96,525 87,193
1 235 149,792 862,833 626,1784,746 4,738 4,746
17,373 121,952 106,05918,237 49,569 56,268
601 601 6011,246 1,246 1,246
30,891 899,155 795,54422,510 93,196 127,0956,865 123,500 73,821
432 568 4328,267 16,334 17,584
139 131 1315,767 5,767 5,7679,400 9,398 9,397
12,592 70,250 61,405304,851 6,185,843 5,961,879
(69) (100) (48)(31,838) (12,555) (12,192)
272,944 6,173,188 5,949,639
67,502 (3,668,414) (5,427,706)
1,003,432 63,989,003 15,358,235— (543,497) 3,179,948
13,370 (157,855) 210,890(3,945) 10,959 (434,716)
1,012,857 63,298,610 18,314,357
(3,923,722) (104,545,303) 4,555,204— 356,318 —
(365) (2,373) (23,575)(3,924,087) (104,191,358) 4,531,629
(2,911,230) (40,892,748) 22,845,986
$(2,843,728) $(44,561,162) $17,418,280
�153

Statements of Operations (unaudited)
Gold and PreciousMetals FundNET INVESTMENT INCOME
Income:Dividends $ 335,783Foreign tax withheld on dividends (32,671)
Net dividends 303,112Interest and other 28,617
Total income 331,729
Expenses:Management fee 1,289,112Administrative services fee 90,295Transfer agent fees and expenses 223,273Accounting service fees and expenses 45,995Professional fees 28,803Distribution plan fee 282,171Custodian fees 71,702Shareholder reporting expenses 44,034Registration fees 14,478Trustee fees and expenses 9,397Miscellaneous expenses 39,321
Total expenses before reductions 2,138,581Expenses offset - Note 1 H (24)Expenses reimbursed - Note 3 —
Net Expenses 2,138,557
Net Investment Income (Loss) (1,806,828)
NET REALIZED AND UNREALIZEDGAIN (LOSS) ON INVESTMENTS
Realized gain (loss) from:Securities from unaffiliated issuers 13,555,374Written options 62,961Foreign currency transactions (103,009)
Net realized gain 13,515,326
Net change in unrealized appreciation (depreciation) of:Investments 3,484,350Written options 9,950Other assets and liabilities denominated in foreign currencies (31,278)
Net unrealized appreciation (depreciation) 3,463,022
Net Realized and Unrealized Gain (Loss) on Investments 16,978,348
Net Increase (Decrease) In Net AssetsResulting From Operations $15,171,520
See accompanying notes to financial statements.
�154

For the Six Months Ended June 30, 2010
Eastern European Global Emerging China RegionFund Markets Fund Fund
$ 4,127,831 $ 115,706 $ 344,450(565,355) (9,485) (24,396)
3,562,476 106,221 320,05421,768 423 4,158
3,584,244 106,644 324,212
2,247,030 74,626 273,898175,958 5,230 20,894538,080 37,747 91,152
80,824 15,075 21,22931,741 25,110 24,369
549,868 16,343 65,293340,195 25,527 31,78770,590 5,396 15,55310,556 8,863 9,877
9,397 9,397 9,39747,949 15,676 18,280
4,102,188 238,990 581,729(68) (86) (39)— (48,245) (163)
4,102,120 190,659 581,527
(517,876) (84,015) (257,315)
744,942 1,095 2,815,925— 6,463 22,204
(256,061) (2,306) (19,096)
488,881 5,252 2,819,033
(44,291,537) (723,252) (5,274,387)— — —
35,758 (94) (7,861)
(44,255,779) (723,346) (5,282,248)
(43,766,898) (718,094) (2,463,215)
$(44,284,774) $(802,109) $(2,720,530)
�155

Statements of Changes in Net Assets
U.S. Treasury SecuritiesCash Fund
Six Months Ended Year EndedJune 30, 2010 December 31,
(unaudited) 2009
INCREASE (DECREASE)IN NET ASSETS
From operations:Net investment income $ 5,256 $ 11,265Net realized gain (loss) — —Net unrealized appreciation — —
Net increase in net assets from operations 5,256 11,265
Distributions to shareholders:From net investment income
Investor class (4,875) (10,436)
Total distributions to shareholders (4,875) (10,436)
From capital share transactions:Proceeds from shares sold
Investor class 68,506,797 153,649,644Distributions reinvested
Investor class 4,745 10,353
68,511,542 153,659,997Cost of shares redeemed
Investor class (67,128,583) (171,181,575)
Net increase (decrease) in net assets fromcapital share transactions 1,382,959 (17,521,578)
NET INCREASE (DECREASE) IN NET ASSETS 1,383,340 (17,520,749)
NET ASSETSBeginning of period 103,889,388 121,410,137
End of period $105,272,728 $103,889,388Accumulated undistributed net investment income, end of period $ 1,210 $ 829
Capital Share ActivityInvestor class:Shares sold 68,506,797 153,649,644Shares reinvested 4,745 10,353Shares redeemed (67,128,583) (171,181,575)
Net share activity 1,382,959 (17,521,578)
See accompanying notes to financial statements.
�156

U.S. Government SecuritiesSavings Fund Near-Term Tax Free Fund
Six Months Ended Year Ended Six Months Ended Year EndedJune 30, 2010 December 31, June 30, 2010 December 31,
(unaudited) 2009 (unaudited) 2009
$ 11,977 $ 333,999 $ 312,806 $ 495,023938 — (444) (722)— — 198,324 427,850
12,915 333,999 510,686 922,151
(11,345) (334,574) (312,936) (494,773)
(11,345) (334,574) (312,936) (494,773)
78,542,914 151,396,515 6,262,577 14,685,709
11,017 319,050 269,366 402,076
78,553,931 151,715,565 6,531,943 15,087,785
(103,544,892) (256,393,375) (3,655,598) (6,167,222)
(24,990,961) (104,677,810) 2,876,345 8,920,563
(24,989,391) (104,678,385) 3,074,095 9,347,941
253,231,638 357,910,023 23,337,079 13,989,138
$228,242,247 $253,231,638 $26,411,174 $23,337,079$ 261,366 $ 260,734 $ 21,345 $ 21,475
78,542,914 151,396,515 2,815,557 6,661,14711,017 319,050 121,175 182,801
(103,544,892) (256,393,375) (1,645,963) (2,790,990)
(24,990,961) (104,677,810) 1,290,769 4,052,958
�157

Statements of Changes in Net Assets
Tax Free FundSix Months Ended Year Ended
June 30, 2010 December 31,(unaudited) 2009
INCREASE (DECREASE)IN NET ASSETS
From operations:Net investment income (loss) $ 397,001 $ 715,558Net realized gain (loss) 13,128 1,626Net unrealized appreciation (depreciation) 209,835 700,396
Net increase (decrease) in net assets fromoperations 619,964 1,417,580
Distributions to shareholders:From net investment income
Investor class (394,162) (715,942)
Total distributions to shareholders (394,162) (715,942)
From capital share transactions:Proceeds from shares sold
Investor class 3,589,358 9,240,470Distributions reinvested
Investor class 321,076 557,292Proceeds from short-term trading fees
Investor class — —
3,910,434 9,797,762Cost of shares redeemed
Investor class (4,102,462) (5,343,353)
Net increase (decrease) in net assets fromcapital share transactions (192,028) 4,454,409
NET INCREASE (DECREASE) IN NET ASSETS 33,774 5,156,047
NET ASSETSBeginning of period 22,102,079 16,946,032
End of period $22,135,853 $22,102,079Accumulated undistributed net investment income, (distributions in
excess of net investment income), end of period $ 36,979 $ 34,140
Capital Share ActivityInvestor class:Shares sold 291,725 759,141Shares reinvested 26,152 46,071Shares redeemed (333,815) (439,867)
Net share activity (15,938) 365,345
See accompanying notes to financial statements.
�158

All American Equity Fund Holmes Growth FundSix Months Ended Year Ended Six Months Ended Year Ended
June 30, 2010 December 31, June 30, 2010 December 31,(unaudited) 2009 (unaudited) 2009
$ 12,339 $ (113,977) $ (294,513) $ (320,658)1,622,627 (997,174) 2,843,346 (5,028,765)(2,290,096) 3,091,465 (3,165,755) 12,371,233
(655,130) 1,980,314 (616,922) 7,021,810
— (91,991) — —
— (91,991) — —
1,289,074 2,018,841 1,664,217 2,773,433
— 90,879 — —
149 469 237 132
1,289,223 2,110,189 1,664,454 2,773,565
(1,851,449) (3,796,615) (3,997,830) (5,134,081)
(562,226) (1,686,426) (2,333,376) (2,360,516)
(1,217,356) 201,897 (2,950,298) 4,661,294
16,436,243 16,234,346 37,148,978 32,487,684
$15,218,887 $16,436,243 $34,198,680 $37,148,978
$ 12,339 $ — $ (409,888) $ (115,375)
65,318 117,450 103,102 217,283— 4,761 — —
(93,239) (220,835) (248,135) (366,984)
(27,921) (98,624) (145,033) (149,701)
�159

Statements of Changes in Net Assets
Global MegaTrendsFund
Six Months Ended Year EndedJune 30, 2010 December 31,
(unaudited) 2009
INCREASE (DECREASE)IN NET ASSETS
From operations:Net investment income (loss) $ 67,502 $ 119,187Net realized gain (loss) 1,012,857 (1,465,573)Net unrealized appreciation (depreciation) (3,924,087) 8,655,684
Net increase (decrease) in net assets fromoperations (2,843,728) 7,309,298
Distributions to shareholders:From net investment income
Investor class — (86,578)
Total distributions to shareholders — (86,578)
From capital share transactions:Proceeds from shares sold
Investor class 3,526,244 11,166,132Institutional class(a) 10,000 —
Distributions reinvestedInvestor class — 81,740
Proceeds from short-term trading feesInvestor class 122 1,360Institutional class(a) — —
3,536,366 11,249,232Cost of shares redeemed
Investor class (9,647,213) (11,949,778)Institutional class(a) — —
Net increase (decrease) in net assets fromcapital share transactions (6,110,847) (700,546)
NET INCREASE (DECREASE) IN NET ASSETS (8,954,575) 6,522,174
NET ASSETSBeginning of period 28,557,315 22,035,141
End of period $19,602,740 $28,557,315Accumulated undistributed net investment income, (distributions in
excess of net investment income), end of period $ 102,874 $ 35,372
Capital Share ActivityInvestor class:Shares sold 443,712 1,647,632Shares reinvested — 10,129Shares redeemed (1,225,119) (1,665,659)
Net share activity (781,407) (7,898)Institutional class(a):Shares sold 1,276 —Shares reinvested — —Shares redeemed — —
Net share activity 1,276 —
(a)Institutional class commenced operations on March 1, 2010.See accompanying notes to financial statements.
�160

World Precious MineralsGlobal Resources Fund Fund
Six Months Ended Year Ended Six Months Ended Year EndedJune 30, 2010 December 31, June 30, 2010 December 31,
(unaudited) 2009 (unaudited) 2009
$ (3,668,414) $ (455,031) $ (5,427,706) $ (6,444,886)63,298,610 (49,597,871) 18,314,357 24,568,769
(104,191,358) 350,482,946 4,531,629 292,475,132
(44,561,162) 300,430,044 17,418,280 310,599,015
— — — (24,089,084)
— — — (24,089,084)
82,811,820 181,440,914 96,756,030 139,489,3454,369,532 — 10,000 —
— — — 23,204,309
24,527 30,658 80,011 58,9462 — — —
87,205,881 181,471,572 96,846,041 162,752,600
(154,811,571) (206,354,015) (131,265,263) (169,346,997)(37,111) — — —
(67,642,801) (24,882,443) (34,419,222) (6,594,397)
(112,203,963) 275,547,601 (17,000,942) 279,915,534
740,071,589 464,523,988 639,035,318 359,119,784
$ 627,867,626 $740,071,589 $622,034,376 $639,035,318
$ (9,184,575) $ (5,516,161) $ (37,608,481) $ (32,180,775)
9,004,826 26,149,328 5,433,820 10,066,467— — — 1,380,387
(17,370,496) (30,816,159) (7,393,675) (12,317,772)
(8,365,670) (4,666,831) (1,959,855) (870,918)
443,190 — 576 —— — — —
(4,279) — — —438,911 — 576 —
�161
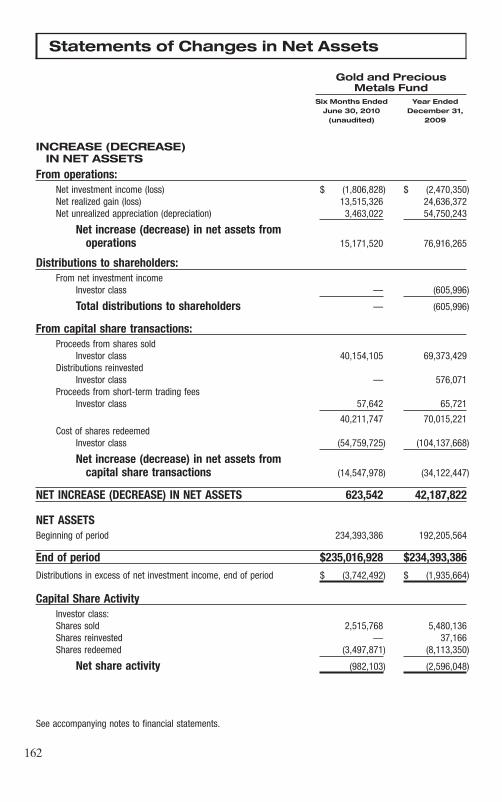
Statements of Changes in Net Assets
Gold and PreciousMetals Fund
Six Months Ended Year EndedJune 30, 2010 December 31,
(unaudited) 2009
INCREASE (DECREASE)IN NET ASSETS
From operations:Net investment income (loss) $ (1,806,828) $ (2,470,350)Net realized gain (loss) 13,515,326 24,636,372Net unrealized appreciation (depreciation) 3,463,022 54,750,243
Net increase (decrease) in net assets fromoperations 15,171,520 76,916,265
Distributions to shareholders:From net investment income
Investor class — (605,996)
Total distributions to shareholders — (605,996)
From capital share transactions:Proceeds from shares sold
Investor class 40,154,105 69,373,429Distributions reinvested
Investor class — 576,071Proceeds from short-term trading fees
Investor class 57,642 65,721
40,211,747 70,015,221Cost of shares redeemed
Investor class (54,759,725) (104,137,668)
Net increase (decrease) in net assets fromcapital share transactions (14,547,978) (34,122,447)
NET INCREASE (DECREASE) IN NET ASSETS 623,542 42,187,822
NET ASSETSBeginning of period 234,393,386 192,205,564
End of period $235,016,928 $234,393,386Distributions in excess of net investment income, end of period $ (3,742,492) $ (1,935,664)
Capital Share ActivityInvestor class:Shares sold 2,515,768 5,480,136Shares reinvested — 37,166Shares redeemed (3,497,871) (8,113,350)
Net share activity (982,103) (2,596,048)
See accompanying notes to financial statements.
�162

Global Emerging MarketsEastern European Fund Fund
Six Months Ended Year Ended Six Months Ended Year EndedJune 30, 2010 December 31, June 30, 2010 December 31,
(unaudited) 2009 (unaudited) 2009
$ (517,876) $ 12,626 $ (84,015) $ (87,232)488,881 (259,277,580) 5,252 (5,043,969)
(44,255,779) 465,669,916 (723,346) 9,749,634
(44,284,774) 206,404,962 (802,109) 4,618,433
— — — —
— — — —
21,515,716 60,092,169 911,638 2,643,707
— — — —
126,380 259,343 7,427 8,428
21,642,096 60,351,512 919,065 2,652,135
(69,890,347) (119,667,750) (2,175,408) (3,114,125)
(48,248,251) (59,316,238) (1,256,343) (461,990)
(92,533,025) 147,088,724 (2,058,452) 4,156,443
464,408,879 317,320,155 13,819,198 9,662,755
$371,875,854 $464,408,879 $11,760,746 $13,819,198$ (628,189) $ (110,313) $ (103,159) $ (19,144)
2,260,337 8,490,410 114,170 401,295— — — —
(7,720,080) (19,544,443) (279,740) (488,408)
(5,459,743) (11,054,033) (165,570) (87,113)
�163
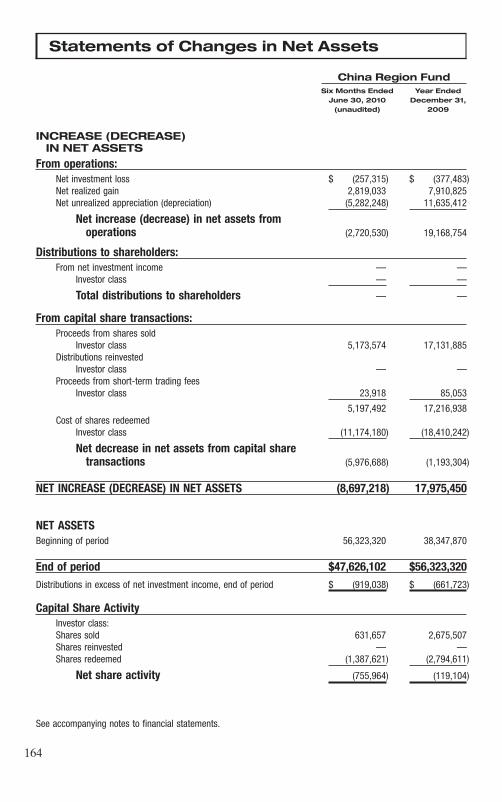
Statements of Changes in Net Assets
China Region FundSix Months Ended Year Ended
June 30, 2010 December 31,(unaudited) 2009
INCREASE (DECREASE)IN NET ASSETS
From operations:Net investment loss $ (257,315) $ (377,483)Net realized gain 2,819,033 7,910,825Net unrealized appreciation (depreciation) (5,282,248) 11,635,412
Net increase (decrease) in net assets fromoperations (2,720,530) 19,168,754
Distributions to shareholders:From net investment income — —
Investor class — —
Total distributions to shareholders — —
From capital share transactions:Proceeds from shares sold
Investor class 5,173,574 17,131,885Distributions reinvested
Investor class — —Proceeds from short-term trading fees
Investor class 23,918 85,053
5,197,492 17,216,938Cost of shares redeemed
Investor class (11,174,180) (18,410,242)
Net decrease in net assets from capital sharetransactions (5,976,688) (1,193,304)
NET INCREASE (DECREASE) IN NET ASSETS (8,697,218) 17,975,450
NET ASSETSBeginning of period 56,323,320 38,347,870
End of period $47,626,102 $56,323,320Distributions in excess of net investment income, end of period $ (919,038) $ (661,723)
Capital Share ActivityInvestor class:Shares sold 631,657 2,675,507Shares reinvested — —Shares redeemed (1,387,621) (2,794,611)
Net share activity (755,964) (119,104)
See accompanying notes to financial statements.
�164

Notes to Financial Statements (unaudited) June 30, 2010
NOTE 1: SIGNIFICANT ACCOUNTING POLICIES
U.S. Global Investors Funds (Trust), consisting of thirteen separate funds (Funds),is organized as a Delaware statutory trust. Each Fund is an open-end managementinvestment company registered under the Investment Company Act of 1940, asamended. All funds are diversified with the exception of Global Resources, WorldPrecious Minerals, Gold and Precious Metals, Eastern European, Global Emerg-ing Markets and China Region. A nondiversified fund may invest a significantportion of its assets in a small number of companies.
Effective March 1, 2010, Global MegaTrends, Global Resources and World Pre-cious Minerals Funds offered a new Institutional class of shares (InstitutionalClass). For all funds, the class existing prior to March 1, 2010, was renamed theInvestor Class (Investor Class).
The following is a summary of significant accounting policies consistently followedby the Funds in the preparation of their financial statements. The policies are inconformity with U.S. generally accepted accounting principles.
A. Security ValuationsThe Funds value investments traded on national or international securitiesexchanges or over-the-counter at the last sales price reported by the security’sprimary exchange of its market at the time of daily valuation. Securities for whichno sale was reported are valued at the mean between the last reported bid andasked quotation. Short-term investments with effective maturities of sixty days orless at the date of purchase may be valued at amortized cost, which approximatesmarket value. An independent pricing service values municipal securities, long-term U.S. Government obligations and corporate debt securities using a systembased on such factors as credit rating, maturity, coupon and type of security todetermine fair value.
B. Fair Valued SecuritiesSecurities for which market quotations are not readily available or which aresubject to legal restrictions are valued at their fair value as determined in goodfaith under consistently applied procedures under the general supervision of theBoard of Trustees. The following factors are generally considered in determiningfair value: nature and duration of any trading restrictions, trading volume, marketvalues of unrestricted shares of the same or similar class, investment manage-ment’s judgment regarding the market experience of the issuer, financial statusand other operational and market factors affecting the issuer, issuer’s manage-ment, quality of the underlying property based on review of independent geologi-cal studies, the extent of a Fund’s investment in the trading securities of the issuer;and other relevant matters. The fair values may differ from what would have beenused had a broader market for these securities existed.
�165
Notes to Financial Statements (unaudited) June 30, 2010
For securities traded on international exchanges, if events which may materiallyaffect the value of a Fund’s securities occur after the close of the primary exchangeand before a Fund’s net asset value is next determined, then those securities willbe valued at their fair value as determined in good faith under the supervision ofthe Board of Trustees. The Funds may use a systematic fair value model providedby an independent third party to value international securities. At June 30, 2010,this model was used to value certain foreign securities in All American Equity,Holmes Growth, Global MegaTrends, Global Resources, World Previous Miner-als, Gold and Precious Metals, Eastern European, Global Emerging Markets andChina Region Funds (Equity Funds).
C. Security Transactions and Investment IncomeSecurity transactions are accounted for on trade date. Realized gains and lossesfrom security transactions are determined on an identified-cost basis. Dividendincome is recorded on the ex-dividend date except that certain dividends fromforeign securities where the ex-dividend date may have passed are recorded assoon as a Fund is informed of the ex-dividend data in the exercise of reasonablediligence. Interest income, which may include original issue discount, is recordedon an accrual basis. Discounts and premiums on securities purchased are accretedand amortized, respectively, on a yield-to-maturity basis as adjustments to interestincome. Investment income is recorded net of foreign taxes withheld whererecovery of such taxes is uncertain. Investment income and realized and unreal-ized gains (losses) are allocated to each Fund’s share class based on their respec-tive net assets.
The Funds may purchase securities on a when-issued or delayed-delivery basis andsegregate the liquid assets on their books collateral with a value at least equal tothe amount of the commitment. Losses may arise due to the changes in the valueof the underlying securities or if the counterparty does not perform under thecontract.
The Equity Funds may invest in private placements and initial public offerings(IPOs), the volatility of which may significantly affect performance. There is noguarantee that these high-risk investments will affect a Fund’s performance in thesame way in the future.
D. Repurchase AgreementsThe Funds may enter into repurchase agreements with recognized financial insti-tutions or registered broker-dealers and, in all instances, hold as collateral, under-lying securities with a value exceeding the principal amount of the repurchaseobligation. The Funds use joint tri-party repurchase agreement accounts withother funds under common management where uninvested cash is collectivelyinvested in repurchase agreements, and each participating fund owns an undividedinterest in the account.
�166
Notes to Financial Statements (unaudited) June 30, 2010
E. Foreign Currency TransactionsSome Funds may invest in securities of foreign issuers. The accounting records ofthese Funds are maintained in U.S. dollars. At each net asset value determinationdate, the value of assets and liabilities denominated in foreign currencies aretranslated into U.S. dollars using the current prevailing exchange rate. Securitytransactions, income and expenses are converted at the prevailing rate ofexchange on the respective dates of the transactions. The effect of changes inforeign exchange rates on foreign denominated securities is included with the netrealized and unrealized gain or loss on securities. Other foreign currency gains orlosses are reported separately.
F. Federal Income TaxesThe Funds intend to continue to comply with the requirements of Subchapter M ofthe Internal Revenue Code applicable to regulated investment companies and todistribute substantially all of their taxable income to shareholders. Accordingly,no provision for federal income taxes is required. Each Fund may be subject toforeign taxes on income and gains on investments, which are accrued based on theFund’s understanding of the tax rules and regulations in the foreign markets.
The Funds recognize the tax benefits of uncertain tax positions only where theposition is ‘‘more likely than not’’ to be sustained assuming examination by taxauthorities. Management has analyzed the Funds’ tax positions, and has concludedthat no liability for unrecognized tax benefits should be recorded related touncertain tax positions taken on returns filed for open tax years or expected to betaken in 2009 tax returns. Tax years 2005 through 2008 remain subject to examina-tion by major tax jurisdictions, which include the United States of America andthe Commonwealth of Massachusetts. The Funds have no examinations in pro-gress. Management is not aware of any tax positions for which it is reasonablypossible that the total amounts of unrecognized tax benefits will change materiallyin the next 12 months.
G. Dividends and Distributions to ShareholdersThe Funds record dividends and distributions to shareholders on the ex-dividenddate. Distributions are determined in accordance with income tax regulations,which may differ from accounting principles generally accepted in the UnitedStates. Accordingly, periodic reclassifications related to permanent book and taxbasis differences are made within the Funds’ capital accounts to reflect income andgains available for distribution under income tax regulations.
The Funds generally pay income dividends and distribute capital gains, if any,annually. The U.S. Treasury Securities Cash and U.S. Government SecuritiesSavings Funds accrue dividends on a daily basis with payment monthly. The TaxFree and Near-Term Tax Free Funds pay monthly dividends. Dividends and
�167

Notes to Financial Statements (unaudited) June 30, 2010
distributions payable at period end are processed for reinvestment on the follow-ing business day. A Fund may elect to designate a portion of the earnings andprofits distributed to shareholders on the redemption of fund shares during theyear as distributions for federal income tax purposes.
H. ExpensesFund specific expenses are allocated to that Fund and pro rata across share classes.Expenses that are not fund specific are allocated among Funds and pro rata acrossshare classes. Class specific expenses (including, but not limited to, distributionplan fees, if any, a portion of the administrative services fees, transfer agency feesand expenses, shareholder reporting expenses and certain legal and registrationfees) are allocated to the class that incurs such expense. Expense offset arrange-ments have been made with the Funds’ custodian so the custodian fees may bepaid indirectly by credits earned on the Funds’ cash balances. Such depositarrangements are an alternative to overnight investments.
I. Short-Term Trading (Redemption) FeesShares held in the All American Equity Fund 30 days or less are subject to a short-term trading fee equal to 0.10% of the proceeds of the redeemed shares. Sharesheld in the Holmes Growth, Global MegaTrends and Global Resources Funds 30days or less are subject to a short-term trading fee equal to 0.25% of the proceedsof the redeemed shares. Shares held in the World Precious Minerals and Gold andPrecious Metals Funds 30 days or less are subject to a short-term trading fee equalto 0.50% of the proceeds of the redeemed shares. Shares held in the EasternEuropean and Global Emerging Markets Funds 180 days or less are subject to ashort-term trading fee equal to 2.00% of the proceeds of the redeemed shares.Shares held in the China Region Fund 180 days or less are subject to a short-termtrading fee equal to 1.00% of the proceeds of the redeemed shares. These fees,which are retained by the Funds, are accounted for as an addition to paid-incapital.
J. Use of Estimates in Financial Statement PreparationThe preparation of financial statements in conformity with accounting principlesgenerally accepted in the United States requires management to make estimatesand assumptions that affect the reported amounts of assets and liabilities anddisclosure of contingent assets and liabilities at the date of the financial statementsand the reported amounts of income and expenses during the reporting period.Actual results could differ from those estimates.
K. Subsequent Events EvaluationManagement has evaluated subsequent events after the balance sheet datethrough the date that the financial statements were issued and determined thatthere were no events or transactions that would require recognition or disclosurein the financial statements.
�168

Notes to Financial Statements (unaudited) June 30, 2010
L. New Accounting PronouncementsIn January 2010, the Financial Accounting Standards Board (FASB) issuedAccounting Standards Update (ASU) No. 2010-06, Improving Disclosures aboutFair Value Measurements. This ASU adds new requirements for disclosures intoand out of Levels 1 and 2 fair-value measurements and information on purchases,sales, issuances and settlements on a gross basis in the reconciliation of Level 3fair-value measurements. It also clarifies existing fair value disclosures about thelevel of disaggregation, inputs and valuation techniques. Except for the detailedLevel 3 reconciliation disclosures, the guidance in the ASU is effective for annualand interim reporting periods in fiscal years beginning after December 15, 2009,and has been incorporated in these financial statements. The new disclosures forLevel 3 activity are effective for annual and interim reporting periods in fiscalyears beginning after December 15, 2010.
NOTE 2: FINANCIAL DERIVATIVE INSTRUMENTS
A. Options ContractsEquity Funds purchase or write (sell) options on securities to manage theirexposure to stock or commodity markets as well as fluctuations in interest andcurrency conversion rates. The use of options carries the risks of a change in valueof the underlying instruments, an illiquid secondary market, or failure of thecounterparty to perform its obligations.
A put option gives the purchaser of the option, upon payment of a premium, theright to sell, and the issuer of the option the obligation to buy, the underlyingsecurity, commodity, index, currency or other instrument at the exercise price. Acall option, upon payment of a premium, gives the purchaser of the option theright to buy, and the issuer the obligation to sell, the underlying instrument at theexercise price.
Purchasing a put option tends to decrease a Fund’s exposure to the underlyinginstrument, whereas purchasing a call option tends to increase a Fund’s exposureto the underlying instrument. A Fund pays a premium which is included in theStatement of Assets and Liabilities as an investment and subsequently marked tomarket to reflect the current value of the option. Premiums paid to purchaseoptions which expire are treated as realized losses. Premiums paid to purchaseoptions which are exercised or closed are added to the cost of securities acquiredor the proceeds from securities sold. The risk associated with purchasing put andcall options is limited to the premium paid.
The Funds will realize a loss equal to all or a part of the premium paid for anoption if the price of the underlying security or other instrument decreases or doesnot increase by more than the premium (in the case of a call option), or if the priceof the underlying security or other instrument increases or does not decrease bymore than the premium (in the case of a put option).
�169

Notes to Financial Statements (unaudited) June 30, 2010
Writing a put option tends to increase a Fund’s exposure to the underlyinginstrument, whereas writing a call option tends to decrease a Fund’s exposure tothe underlying instrument. The premium received is recorded as liability in theStatement of Assets and Liabilities and subsequently marked to market to reflectthe current value of the option written. Premiums received from writing optionswhich expire are treated as realized gains. Premiums received from options whichare exercised or closed are added to the proceeds or offset against amounts paidon the underlying transaction to determine the realized gain or loss. Writtenoptions include a risk of loss in excess of the option premium. A Fund as a writerof an option has no control over whether the underlying instrument may be sold(call) or purchased (put) and thus bears the market risk of an unfavorable changein the price of the instrument underlying the written option. There is the risk aFund may not be able to enter into a closing transaction because of an illiquidmarket.
A Fund’s ability to close out its position as a purchaser or seller of a put or calloption is dependent, in part, upon the liquidity of the market for that particularoption. There can be no guarantee that a fund will be able to close out an optionposition when desired. An inability to close out its options positions may reduce aFund’s anticipated profits or increase its losses.
As of June 30, 2010, portfolio securities valued at $19,272,000 and $332,300 wereheld in escrow by the custodian as cover for call options written for the GlobalResources Fund and Gold and Precious Metals Fund, respectively.
Transactions in written call options during the year ended June 30, 2010, were asfollows:
All American HolmesEquity Fund Growth Fund
Number of Premiums Number of PremiumsContracts Received Contracts Received
Options outstanding at December 31, 2009 16 $ 3,488 36 $ 7,848Options written 55 51,804 853 317,025Options closed (40) (41,199) (573) (227,016)Options expired (31) (14,093) (66) (29,058)Options exercised — — — —
Options outstanding at June 30, 2010 — $ — 250 $ 68,799
Global GlobalMegaTrends Fund Resources Fund
Number of Premiums Number of PremiumsContracts Received Contracts Received
Options outstanding at December 31, 2009 — $ — 2,000 $ 727,981Options written 50 18,945 8,900 1,908,838Options closed (50) (18,945) (7,150) (1,973,520)Options expired — — — —Options exercised — — — —
Options outstanding at June 30, 2010 — $ — 3,750 $ 663,299
�170

Notes to Financial Statements (unaudited) June 30, 2010
World Precious Gold and PreciousMinerals Fund Metals Fund
Number of Premiums Number of PremiumsContracts Received Contracts Received
Options outstanding at December 31, 2009 — $ — — $ —Options written 3,440 262,200 1,960 153,992Options closed (891) (68,878) (1,159) (92,984)Options expired (2,099) (160,234) (351) (19,323)Options exercised (450) (33,088) (350) (25,735)
Options outstanding at June 30, 2010 — $ — 100 $ 15,950
Global Emerging ChinaMarkets Fund Region Fund
Number of Premiums Number of PremiumsContracts Received Contracts Received
Options outstanding at December 31, 2009 — $ — — $ —Options written 30 3,489 200 23,260Options closed (30) (3,489) (200) (23,260)Options expired — — — —Options exercised — — — —
Options outstanding at June 30, 2010 — $ — — $ —
B. Forward Foreign Currency ContractsThe Funds enter into forward foreign currency contracts to lock in the U.S. dollarcost of purchase and sale transactions or to defend the portfolio against currencyfluctuations. A forward foreign currency contract is a commitment to purchase orsell a foreign currency at a future date at a negotiated rate. These contracts arevalued daily, and the Fund’s net equity therein, representing unrealized gain orloss on the contracts as measured by the difference between the forward foreignexchange rates at the dates of entry into the contracts and the forward rates at thereporting, is included in the statement of assets and liabilities. Realized andunrealized gains and losses are included in the statement of operations. Risks mayarise upon entering into these contracts from the potential inability of counterpar-ties to meet the terms of the contract and from unanticipated movements in thevalue of foreign currencies relative to the U.S. dollar.
There were no open forward foreign currency contracts at June 30, 2010.
�171

Notes to Financial Statements (unaudited) June 30, 2010
C. Summary of Derivative InstrumentsThe following is a summary of the valuations of derivative instruments categorizedby location in the Statement of Assets and Liabilities as of June 30, 2010:
AllAmerican Holmes Global Global
Equity Growth MegaTrends ResourcesLocation Fund Fund Fund Fund
Asset derivativesInvestments, at value
Equity contracts - Note 2 A $ 148,125 $ 400,772 $ 111,000 $ 3,475,454
Total $ 148,125 $ 400,772 $ 111,000 $ 3,475,454
Liability derivativesWritten options at value
Equity contracts - Note 2 A $ — $ 64,000 $ — $ 217,500
Total $ — $ 64,000 $ — $ 217,500
World Gold & GlobalPrecious Precious Eastern Emerging ChinaMinerals Metals European Markets Region
Location Fund Fund Fund Fund Fund
Asset derivativesInvestments, at value
Equity contracts - Note 2 A $ 180,772 $ — $2,325,000 $ 61,050 $103,950
Total $ 180,772 $ — $2,325,000 $ 61,050 $103,950
Liability derivativesWritten options at value
Equity contracts - Note 2 A $ — $ 6,000 $ — $ — $ —
Total $ — $ 6,000 $ — $ — $ —
�172

Notes to Financial Statements (unaudited) June 30, 2010
The following is a summary of the effect of derivative instruments on the Statementof Operations for the six-month period ended June 30, 2010:
AllAmerican Holmes Global Global
Equity Growth MegaTrends ResourcesLocation Fund Fund Fund Fund
Realized Gain/(Loss) on derivativesrecognized in income
Realized gain (loss) from securitiesEquity contracts $ (40,864) $ 196,723 $ 17,368 $(1,696,573)
Realized gain (loss) on written optionsEquity contracts 16,252 (19,931) 13,370 (157,855)
Net realized gain (loss) on foreign currencytransactions
Foreign exchange contracts — — — —
(24,612) 176,792 30,738 (1,854,428)
Change in Unrealized Appreciation/(Depreciation) on derivatives recognized inincome
Net change in unrealized appreciation(depreciation) on investments
Equity contracts 15,979 (11,658) (14,499) 1,281,702
Net change in unrealized appreciation(depreciation) on options written
Equity contracts 672 6,311 — 356,318
Net change in unrealized appreciation(depreciation) on translation of assets andliabilities denominated in foreign currencies
Foreign exchange contracts — — — —
16,651 (5,347) (14,499) 1,638,020
Total $ (7,961) $ 171,445 $ 16,239 $ (216,408)
�173

Notes to Financial Statements (unaudited) June 30, 2010
World Gold & GlobalPrecious Precious Eastern Emerging ChinaMinerals Metals European Markets Region
Location Fund Fund Fund Fund Fund
Realized Gain/(Loss) on derivativesrecognized in income
Realized gain (loss) from securitiesEquity contracts $(4,633,479) $(1,118,557) $ 275,271 $ 13,606 $ (49,282)
Realized gain on written optionsEquity contracts 210,890 62,961 — 6,463 22,204
Net realized gain (loss) on foreign currencytransactions
Foreign exchange contracts — — — — —
(4,422,589) (1,055,596) 275,271 20,069 (27,078)
Change in Unrealized Appreciation/(Depreciation) on derivatives recognized inincome
Net change in unrealized appreciation(depreciation) on investments
Equity contracts 1,880,449 821,995 (156,860) (9,296) 148
Net change in unrealized appreciation(depreciation) on options written
Equity contracts — 9,950 — — —
Net change in unrealized appreciation(depreciation) on translation of assets andliabilities denominated in foreign currencies
Foreign exchange contracts 12 — — — —
1,880,461 831,945 (156,860) (9,296) 148
Total $(2,542,128) $ (223,651) $ 118,411 $ 10,773 $ (26,930)
The average notional amounts of written options, purchased options and forwardcurrency contracts outstanding during the six-month period ended June 30, 2010,were approximately as follows:
ForwardsWritten Purchased CurrencyOptions Options Contracts
All American Equity Fund $ 1,767 $ 52,808 $ —Holmes Growth Fund 41,302 102,558 —Global MegaTrends Fund — 28,078 —Global Resources Fund 351,827 1,496,397 50,885World Precious Minerals Fund 54,979 3,741,803 13,657Gold & Precious Metals Fund 23,075 1,519,941 4,537Eastern European Fund — 525,435 5Global Emerging Markets Fund 1,680 15,280 —China Region Fund 7,723 33,578 —
NOTE 3: RELATED PARTY TRANSACTIONS
U.S. Global Investors, Inc. (Adviser), under an investment advisory agreement withthe Trust in effect through September 30, 2011, furnishes management and invest-ment advisory services and, subject to the supervision of the trustees, directs theinvestments of each Fund according to its investment objectives, policies and
�174

Notes to Financial Statements (unaudited) June 30, 2010
limitations. The Adviser also furnishes all necessary office facilities, business equip-ment and personnel for administering the affairs of the Trust. Frank E. Holmes, atrustee of the Funds, is the controlling owner of the Adviser.
For the services of the Adviser, each Fund pays a base management or advisory feebased upon its net assets. Fees are accrued daily and paid monthly. The contractualmanagement fee for each fund is:
Annual Percentage ofFund Average Daily Net Assets
U.S. Treasury Securities Cash and .50% of the first $250,000,000 andU.S. Government Securities Savings .375% of the excessNear-Term Tax Free 0.50%Tax Free .75% of the first $250,000,000 and
.50% of the excessAll American Equity .80% of the first $500,000,000 and
.75% of the excessHolmes Growth and Global MegaTrends 1.00%Global Resources .95% of the first $500,000,000;
.90% of $500,000,001 to $1,000,000,000and .85% of the excess
World Precious Minerals 1.00% of the first $500,000,000;.95% of $500,000,001 to $1,000,000,000and .90% of the excess
Gold and Precious Metals .90% of the first $500,000,000and .85% of the excess
Eastern European 1.25%Global Emerging Markets 1.375%China Region 1.25%
�175

Notes to Financial Statements (unaudited) June 30, 2010
The advisory agreement also provides, effective October 1, 2009, that the baseadvisory fee of the Equity Funds will be adjusted upwards or downwards by 0.25percent if there is a performance difference of 5 percent or more between a Fund’sperformance and that of its designated benchmark index over the prior 12 months.The performance adjustment is calculated separately for each share class. Forpurposes of calculating the performance adjustment for the Institutional Class, theperformance will include the performance of the Investor Class shares for periodsprior to March 1, 2011. After such time, for purposes of calculating the perform-ance adjustment, the performance of each class will be calculated based on itsrespective performance. The benchmarks are as follows:
Fund Benchmark Index
All American Equity S&P 500 Index
Holmes Growth S&P Composite 1500 Index
Global MegaTrends S&P 500 Index
Global Resources Morgan Stanley Commodity RelatedEquity Index
World Precious Minerals NYSE Arca Gold Miners Index
Gold and Precious Metals FTSE Gold Mines Index
Eastern European MSCI Emerging Markets Europe 10/40Index (Net Total Return)
Global Emerging Markets MSCI Emerging Markets Total Net ReturnIndex
China Region Hang Seng Composite Index
No performance adjustment is applied unless the difference between the class’sinvestment performance and the benchmark is 5 percent or greater (positive ornegative) during the applicable performance measurement period. The perform-ance fee adjustment is calculated monthly in arrears and is accrued ratably duringthe month. The management fee, net of any performance fee adjustment, is paidmonthly in arrears.
�176

Notes to Financial Statements (unaudited) June 30, 2010
The Funds’ prospectus and statement of additional information contain additionalinformation about the performance adjustment. The amounts shown as manage-ment fees on the Statements of Operations reflects the base fee plus/minus anyperformance adjustment. During the six months ended June 30, 2010, the Fundsrecorded performance adjustments as follows:
Investor Class Institutional ClassPerformance Fee Performance Fee
Fund Adjustment Adjustment
All American Equity $ (19,520) N/A
Holmes Growth (44,457) N/A
Global MegaTrends (17,489) $ (4)
Global Resources 269,950 30
World Precious Minerals 673,952 3
Gold and Precious Metals 273,295 N/A
Eastern European (502,310) N/A
Global Emerging Markets (15,257) N/A
China Region (52,565) N/A
Under an administrative services agreement, the U.S. Treasury Securities Cash,U.S. Government Securities Savings, Near-Term Tax Free, Tax Free, All Ameri-can Equity, Holmes Growth, Gold and Precious Metals, Eastern European,Global Emerging Markets and China Region Funds compensate the Adviser at anannual rate of 0.08% of the average daily net assets of each Fund for administra-tive services provided. The Global MegaTrends, Global Resources and WorldPrecious Minerals Funds compensate the Adviser at an annual rate of 0.08% ofthe average daily net assets for the Investor Class and 0.06% of the average dailynet assets for the Institutional Class for administrative services provided, of whichhalf is a fund-level fee and half is a class-level fee.
The Investor Class shares for Equity Funds in the Trust have adopted a distribu-tion plan pursuant to Rule 12b-1 of the Investment Company Act of 1940 in whicha subsidiary of the Adviser is paid a fee at an annual rate of 0.25% of the averagedaily net assets of the Investor Class for sales and promotional services related tothe distribution of Investor Class shares. The Institutional Class does not incurdistribution plan fees.
Effective October 1, 2009, the Adviser has voluntarily agreed to reimburse specificfunds so that their total operating expenses will not exceed certain annual percent-ages of average net assets. The expenses for the six months ended June 30, 2010,were limited as follows for the Investor Class: U.S. Treasury Securities Cash Fundat 1.00%, U.S. Government Securities Savings Fund at 0.45%, Near-Term TaxFree Fund at 0.45%, Tax Free Fund at 0.70%, All American Equity Fund at2.20%, Holmes Growth Fund at 2.20%, Global MegaTrends Fund at 2.35%,
�177

Notes to Financial Statements (unaudited) June 30, 2010
Global Resources, World Precious Minerals, and Gold and Precious Metals Fundsat 1.90%, Eastern European Fund at 2.85%, Global Emerging Markets Fund at3.15% and China Region Fund at 2.55%. These expense limitations are exclusiveof any performance fee adjustments and will continue on a voluntary basis at theAdviser’s discretion.
Effective March 1, 2010, the Adviser has agreed to waive all class specific expensesfor the Institutional Class. The expense waiver is exclusive of performance fees,and the Adviser can modify or terminate this arrangement at any time.
The Adviser has voluntarily agreed to waive fees and/or reimburse U.S. TreasurySecurities Cash Fund and U.S. Government Securities Savings Fund to the extentnecessary to maintain the respective fund’s yield at a certain level as determinedby the Adviser (Minimum Yield). The Adviser may recapture any fees waivedand/or expenses reimbursed within three years after the end of the fiscal year ofsuch waiver and/or reimbursement to the extent that such recapture would notcause the fund’s yield to fall below the Minimum Yield. For the six months endedJune 30, 2010, fees waived and/or expenses reimbursed as a result of this agree-ment were $458,074 and $349,127 for the U.S. Treasury Securities Cash Fund andthe U.S. Government Securities Savings Fund, respectively. These amounts arerecoverable by the Adviser through December 31, 2013. In addition, $170,642 isrecoverable by the Adviser from the U.S. Treasury Securities Cash Fund throughDecember 31, 2011, and $789,420 and $258,561 is recoverable by the Adviser fromthe U.S. Treasury Securities Cash Fund and the U.S. Government SecuritiesSavings Fund, respectively, through December 31, 2012, for fees waived and/orexpenses reimbursed in previous fiscal years.
United Shareholder Services, Inc. (USSI), a wholly-owned subsidiary of theAdviser, is the transfer agent for the Funds. Each Fund’s share class pays anannual fee based on the number of shareholder accounts, certain base fees andtransaction-and activity-based fees for transfer agency services. Certain accountfees are paid directly by shareholders to the transfer agent, which, in turn, reducesits charge to the Funds.
The Adviser was reimbursed for services of the Funds’ Chief Compliance Officerduring the six months ended June 30, 2010, in the amount of $87,666.
Brown Brothers Harriman & Co. (BBH) serves as the custodian, fund accountingand administration service agent with a fee structure based on average net assetsof the Funds, certain base fees and transaction-based fees. BBH voluntarilywaived certain fund accounting service fees for the six-month period endedDecember 31, 2009. This voluntary fee waiver ended December 31, 2009.
The independent Trustees receive compensation for serving on the Board. Trust-ees serving as Chairman of the Board or a special committee or as a member of acommittee receive additional compensation. Trustees are also reimbursed for out-
�178

Notes to Financial Statements (unaudited) June 30, 2010
of-pocket expenses incurred while attending meetings. Frank E. Holmes receivesno compensation from the Funds for serving on the Board.
NOTE 4: INVESTMENTS
Cost of purchases and proceeds from sales of long-term securities for the sixmonths ended June 30, 2010, are summarized as follows:
Fund Purchases Sales
Near-Term Tax Free $ 3,554,797 $ 25,000Tax Free 2,086,352 1,577,055All American Equity 26,655,260 27,672,504Holmes Growth 25,600,918 30,947,750Global MegaTrends 9,551,520 15,184,726Global Resources 465,761,963 618,073,087World Precious Minerals 204,758,886 242,202,258Gold and Precious Metals 121,206,302 131,774,528Eastern European 145,855,470 200,107,904Global Emerging Markets 10,184,509 11,674,375China Region 51,689,354 60,269,413
U.S. Treasury Securities Cash and U.S. Government Securities Savings held onlyshort-term investments. The Funds neither purchased nor sold long-term U.S.government securities during the period.
Investments in foreign issuers as a percent of total investments at June 30, 2010,were: 5.03% of All American Equity, 29.20% of Holmes Growth, 65.75% ofGlobal MegaTrends, 43.69% of Global Resources, 84.65% of World PreciousMinerals, 81.78% of Gold and Precious Metals, 91.41% of Eastern European,87.09% of Global Emerging Markets and 82.43% of China Region.
�179

Notes to Financial Statements (unaudited) June 30, 2010
NOTE 5: TAX INFORMATION
The following table presents the income tax basis of securities owned at June 30,2010, and the tax basis components of net unrealized appreciation (depreciation):
Gross Gross Net UnrealizedAggregate Unrealized Unrealized Appreciation/
Fund Tax Cost Appreciation Depreciation (Depreciation)
U.S. Treasury Securities Cash $125,275,460 $ — $ — $ —U.S. Government Securities Savings 228,312,616 — — —Near-Term Tax Free 25,167,197 813,559 (30,380) 783,179Tax Free 20,922,593 977,449 (287,416) 690,033All American Equity 14,461,897 1,020,841 (795,143) 225,698Holmes Growth 29,654,552 4,104,798 (1,341,779) 2,763,019Global MegaTrends 18,304,901 1,583,408 (1,656,094) (72,686)Global Resources 636,409,251 70,807,356 (117,588,799) (46,781,443)World Precious Minerals 566,293,802 182,835,040 (129,229,331) 53,605,709Gold and Precious Metals 188,954,192 54,900,227 (14,095,033) 40,805,194Eastern European 323,900,334 64,562,282 (27,879,607) 36,682,675Global Emerging Markets 11,107,758 1,191,164 (1,031,438) 159,726China Region 40,225,420 6,092,774 (1,244,788) 4,847,986
As of December 31, 2009, the components of distributable earnings on a tax basiswere as follows:
Undistributed Undistributed Undistributed Net UnrealizedTax-Exempt Ordinary Long-Term Appreciation
Fund Income Income Capital Gains (Depreciation)
U.S. Treasury Securities Cash $ — $ 829 $— $ —U.S. Government Securities Savings — 260,734 — —Near-Term Tax Free 9,817 11,658 — 584,855Tax Free 3,509 30,631 — 480,198All American Equity — — — 2,433,624Holmes Growth — 456,807 — 5,253,511Global MegaTrends — 35,372 — 3,791,494Global Resources — 22,010,983 — 19,391,505World Precious Minerals — 76,506,233 — (62,607,300)Gold and Precious Metals — 4,005,264 — 29,308,697Eastern European — — — 38,907,053Global Emerging Markets — — — 807,441China Region — — — 9,195,906
The differences between book-basis and tax-basis unrealized appreciation (depre-ciation) for All American Equity, Holmes Growth, Global MegaTrends, GlobalResources, World Precious Minerals, Gold and Precious Metals, Eastern Euro-pean, Global Emerging Markets and China Region Funds are attributable primar-ily to the tax deferral of losses on wash sales, investment in passive foreigninvestment companies (PFIC), forwards marked to markets, unreversed return of
�180

Notes to Financial Statements (unaudited) June 30, 2010
capital in Canadian Trusts, adjustments for partnerships, tax straddle loss deferralson written options, and adjustments for grantor trusts.
The tax character of distributions paid during the six months ended June 30, 2010,were as follows:
Tax-Exempt Ordinary Long-TermFund Income Income Capital Gains Total
U.S. Treasury Securities Cash $ — $ 4,875 $— $ 4,875U.S. Government Securities Savings — 11,345 — 11,345Near-Term Tax Free 292,298 20,638 — 312,936Tax Free 371,666 22,496 — 394,162All American Equity — — — —Holmes Growth — — — —Global MegaTrends — — — —Global Resources — — — —World Precious Minerals — — — —Gold and Precious Metals — — — —Eastern European — — — —Global Emerging Markets — — — —China Region — — — —
The tax character of distributions paid during the fiscal year ended December 31,2009, were as follows:
Tax-Exempt Ordinary Long-TermFund Income Income Capital Gains Total
U.S. Treasury Securities Cash $ — $ 10,436 $— $ 10,436U.S. Government Securities Savings — 334,574 — 334,574Near-Term Tax Free 462,656 32,117 — 494,773Tax Free 677,673 38,269 — 715,942All American Equity — 91,991 — 91,991Holmes Growth — — — —Global MegaTrends — 86,578 — 86,578Global Resources — — — —World Precious Minerals — 24,089,084 — 24,089,084Gold and Precious Metals — 605,996 — 605,996Eastern European — — — —Global Emerging Markets — — — —China Region — — — —
Net realized capital loss carryforwards, for federal income tax purposes, may beused to offset current or future capital gains until expiration. The Funds’ tax-basiscapital gains and losses are determined only at the end of each fiscal year. The loss
�181

Notes to Financial Statements (unaudited) June 30, 2010
carryforwards and related expiration dates for each fund, as of December 31, 2009,are as follows:
Expiration DateFund 2010 2011 2012 2013 2014
U.S. Treasury Securities Cash $285 $ — $ — $ — $ —U.S. Government Securities Savings — — — — —Near-Term Tax Free — 46,218 33,686 2,760 202,719Tax Free — 88,733 421,236 — —All American Equity — — — — —Holmes Growth — — — — —Global MegaTrends — — — — —Global Resources — — — — —World Precious Minerals — — — — —Gold and Precious Metals — — — — —Eastern European — — — — —Global Emerging Markets — — — — —
Expiration DateFund 2015 2016 2017 Total
U.S. Treasury Securities Cash $ — $ — $ — $ 285U.S. Government Securities Savings — — — —Near-Term Tax Free 2,488 112 722 288,705Tax Free — 10,697 — 520,666All American Equity — 3,190,748 2,938,489 6,129,237Holmes Growth 2,281,824 2,829,615 5,264,310 10,375,749Global MegaTrends 8,605,703 5,994,166 995,675 15,595,544Global Resources — 174,185,267 313,190,635 487,375,902World Precious Minerals — 43,501,061 65,130,599 108,631,660Gold and Precious Metals — 18,761,278 2,765,666 21,526,944Eastern European — 83,605,572 257,523,539 341,129,111Global Emerging Markets 4,262,898 2,965,929 5,814,949 13,043,776China Region — 24,409,458 — 24,409,458
Post October 31, 2009Fund Capital Loss Deferral
Tax Free $ 208Holmes Growth 27,977Global MegaTrends 413,260World Precious Minerals 1,983,933Eastern European 2,771,807Global Emerging Markets 266,119China Region 92,773
The above amounts, in accordance with tax rules, are deemed to have occurred onJanuary 1, 2010.
�182
Notes to Financial Statements (unaudited) June 30, 2010
NOTE 6: RISKS OF CONCENTRATIONS
The Near-Term Tax Free Fund and the Tax Free Fund may be exposed to risksrelated to concentration of investments in a particular state or geographic area.These investments present risks resulting from changes in economic conditions ofthe region or the issuer.
The investment policies of the World Precious Minerals and Gold and PreciousMetals Funds present unique risks to their respective portfolios’ values. The pricesof gold and other precious metals may be subject to fluctuations caused byinternational monetary and political developments including trade or currencyrestrictions, currency devaluation and revaluation, and social and political condi-tions within a country. Fluctuations in the prices of gold and other precious metalswill affect the market values of the securities held by these funds.
The Eastern European and Global Emerging Markets Funds may be exposed torisks not typically associated with investment in the United States due to theirconcentration of investments in emerging markets. These risks include possiblerevaluation of currencies, less public information about companies, disruptivepolitical or economic conditions and the possible imposition of adverse govern-mental laws or currency exchange restrictions. Moreover, securities of manyforeign issuers and their markets may be less liquid and their prices more volatilethan those securities of comparable U.S. issuers.
The China Region Fund may be exposed to risks not typically associated withinvestments in the United States, due to concentration of investments in foreignissuers in the region. These investments present risks resulting from disruptivepolitical or economic conditions and the potential imposition of adverse govern-mental laws or currency exchange restrictions affecting the area.
NOTE 7: CREDIT ARRANGEMENTS
Each of the Funds, along with other funds under common management, has arevolving credit facility with BBH. Borrowings of each Fund are collateralized byany or all of the securities held by BBH as the Fund’s custodian up to the amountof the borrowing. Interest on borrowings is charged at the current overnightFederal Funds Rate plus 2%. Each Fund has a maximum borrowing limit of 10%of qualified assets. The aggregate of borrowings by all Funds under the agreementcannot exceed $30,000,000 at any one time. There were no borrowings under therevolving credit facility during the period ended June 30, 2010. The U.S. GlobalInvestors Funds paid BBH a total of $22,625 in commitment fees for the sixmonths ended June 30, 2010, under this arrangement.
�183

Notes to Financial Statements (unaudited) June 30, 2010
NOTE 8: SHARES OF BENEFICIAL INTEREST
At June 30, 2010, individual shareholders holding more than 5% of outstandingInvestor Class shares comprised 14.26% of the Tax Free Fund In addition, theAdviser held 11.11%, 5.84%, 7.56% of the Investor Class shares of U.S. Govern-ment Securities Savings Fund, Near-Term Tax Free Fund and Tax Free Fund,respectively. At June 30, 2010, an individual shareholder held 99.74% of theoutstanding Institutional Class shares of the Global Resources Fund, and theAdviser held the remaining shares. The Adviser held 100.00% of the InstitutionalClass shares of Global MegaTrends Fund and World Precious Minerals Fund.Control is defined by the 1940 Act as the beneficial ownership, either directly orthrough one or more controlled companies, of more than 25% of the votingsecurities of a company. Investment activities of these shareholders could have amaterial impact on the Funds.
�184

Financial Highlights
U.S. TREASURY SECURITIES CASH FUND
For a capital share outstanding during the
Investor Class
Six Months Year Six MonthsEnded Ended Ended
Year Ended June 30,June 30, 2010 December 31, December 31,(unaudited) 2009 2008* 2008 2007 2006
Net asset value, beginning of period $1.00 $1.00 $1.00 $1.00 $1.00 $1.00
Investment ActivitiesNet investment income —(a) —(a) —(a) .02 .04 .03Net realized and unrealized gain — — — — — —
Total from investment activities —(a) —(a) —(a) .02 .04 .03
Distributions from net investment income —(a) —(a) —(a) (.02) (.04) (.03)
Net asset value, end of period $1.00 $1.00 $1.00 $1.00 $1.00 $1.00
Total Return (excluding account fees) (b) — .01% .23% 2.46% 4.36% 3.11%Ratios to Average Net Assets: (c)
Net investment income .01% .01% .44% 2.43% 4.27% 3.06%Total expenses 1.01% 1.01% 1.11% 1.09% .91% .92%Expenses waived or reimbursed (d)(e) (.88)% (.75)% (.38)% (.09)% (.02)% —Net recouped fees (e) — — — —(g) — .03%Net expenses (f) .13% .26% .73% 1.00% .89% .95%
Net assets, end of period (in thousands) $105,273 $103,889 $121,410 $111,955 $116,012 $119,028
* Effective December 31, 2008, the fiscal year changed to December 31.
(a) The per share amount does not round to a full penny.
(b) Total returns for periods less than one year are not annualized. Assumes investment at the net asset value at thebeginning of the period, reinvestment of all distribution and a complete redemption of the investment at the net assetvalue at the end of the period.
(c) Ratios are annualized for periods of less than one year.
(d) Expenses waived or reimbursed reflect reductions to total expenses, as discussed in the notes to the financialstatements. These amounts would decrease the net investment income ratio had such reductions not occurred.
(e) During the year ended June 30, 2004, the Adviser waived fees and/or reimbursed expenses as a result of a MinimumYield Agreement in the amount of $45,136. As allowed by the recapture provision of this agreement, the U.S. TreasurySecurities Cash Fund reimbursed the Adviser the previously waived amount of $45,136 during the year ended June 30,2006. During the year ended June 30, 2008, the Adviser waived fees and/or reimbursed expenses under the MinimumYield Agreement in the amount of $4,259. The Fund reimbursed the Adviser the $4,259 during the year ended June 30,2008. During the six months ended December 31, 2008, the year ended December 31, 2009, and the six monthsended June 30, 2010, the Adviser waived fees and/or reimbursed expenses under the Minimum Yield Agreement in theamount of $170,642, $789,420 and $458,074, respectively.
(f) The net expense ratios shown above reflect expenses after waivers and reimbursements but exclude the effect ofreductions to total expenses for any expenses offset. Expense offset arrangements reduce total expenses, asdiscussed in the notes to the financial statements. These amounts would decrease the net investment income ratiohad such reductions not occurred. The effects of expenses offset are as follows:
Investor Class
Six Months Year Six MonthsEnded Ended Ended
Year Ended June 30,June 30, 2010 December 31, December 31,(unaudited) 2009 2008* 2008 2007 2006
Ratios to Average Net Assets (c):Expenses offset (g) — — — — — —
(g) Effect on the expense ratio was not greater than 0.005%.
See accompanying notes to financial statements.
�185

Financial Highlights
U.S. GOVERNMENT SECURITIES SAVINGS FUND
For a capital share outstanding during the
Investor Class
Six Months Year Six MonthsEnded Ended Ended
Year Ended June 30,June 30, 2010 December 31, December 31,(unaudited) 2009 2008* 2008 2007 2006
Net asset value, beginning of period $1.00 $1.00 $1.00 $1.00 $1.00 $1.00
Investment ActivitiesNet investment income —(a) —(a) .01 .03 .05 .04Net realized and unrealized gain — — —(a) —(a) —(a) —
Total from investment activities —(a) —(a) .01 .03 .05 .04
Distributions from net investment income —(a) —(a) (.01) (.03) (.05) (.04)
Net asset value, end of period $1.00 $1.00 $1.00 $1.00 $1.00 $1.00
Total Return (excluding account fees) (b) — .10% .67% 3.47% 4.86% 3.69%Ratios to Average Net Assets: (c)
Net investment income .01% .11% 1.36% 3.42% 4.75% 3.64%Total expenses .83% .78% .73% .65% .62% .64%Expenses waived or reimbursed (d) (.67)% (.42)% (.26)% (.20)% (.17)% (.19)%Net expenses (e) .16% .36% .47%(g) .45% .45% .45%
Net assets, end of period (in thousands) $228,242 $263,232 $357,910 $446,208 $469,095 $435,417
* Effective December 31, 2008, the fiscal year changed to December 31.
(a) The per share amount does not round to a full penny.
(b) Total returns for periods less than one year are not annualized. Assumes investment at the net asset value at thebeginning of the period, reinvestment of all distributions and a complete redemption of the investment at the net assetvalue at the end of the period.
(c) Ratios are annualized for periods of less than one year.
(d) Expenses waived or reimbursed reflect reductions to total expenses, as discussed in the notes to the financialstatements. These amounts would decrease the net investment income ratio had such reductions not occurred. Duringthe year ended December 31, 2009 and the six months ended June 30, 2010, the Adviser waived fees and/orreimbursed expenses under the Minimum Yield Agreement in the amount of $258,561 and $349,127, respectively.
(e) The net expense ratios shown above reflect expenses after waivers and reimbursements but exclude the effect ofreductions to total expenses for any expenses offset. Expense offset arrangements reduce total expenses, asdiscussed in the notes to the financial statements. These amounts would decrease the net investment income ratiohad such reductions not occurred. The effect of expenses offset are as follows:
Investor Class
Six Months Year Six MonthsEnded Ended Ended
Year Ended June 30,June 30, 2010 December 31, December 31,(unaudited) 2009 2008* 2008 2007 2006
Ratios to Average Net Assets (c):Expenses offset (f) — — — — — —
(f) Effect on the expense ratio was not greater than 0.005%.
(g) The annualized net expense ratio for the six months ended December 31, 2008, exceeded the limitation for the perioddue to the cost of participating in the U.S. Treasury Guarantee Program for the Money Market Funds. The cost toparticipate was without regard to the expense limitation.
See accompanying notes to financial statements.
�186

Financial Highlights
NEAR-TERM TAX FREE FUND
For a capital share outstanding during the
Investor Class
Six Months Year Six MonthsEnded Ended Ended
Year Ended June 30,June 30, 2010 December 31, December 31,(unaudited) 2009 2008* 2008 2007 2006
Net asset value, beginning of period $2.21 $2.16 $2.14 $2.12 $2.12 $2.17
Investment ActivitiesNet investment income .03 .06 .03 .07 .07 .07Net realized and unrealized gain (loss) .02 .05 .02 .02 —(a) (.05)
Total from investment activities .05 .11 .05 .09 .07 .02
Distributions from net investment income (.03) (.06) (.03) (.07) (.07) (.07)
Net asset value, end of period $2.23 $2.21 $2.16 $2.14 $2.12 $2.12
Total Return (excluding account fees) (b) 2.18% 5.00% 2.55% 4.42% 3.51% .75%Ratios to Average Net Assets: (c)
Net investment income 2.56% 2.63% 3.15% 3.41% 3.43% 3.08%Total expenses 1.36% 1.53% 1.82% 1.91% 1.63% 1.54%Expenses waived or reimbursed (d) (.91)% (1.08)% (1.37)% (1.46)% (1.18)% (1.09)%Net expenses (e) .45% .45% .45% .45% .45% .45%
Portfolio turnover rate —(g) —(g) 8% 8% 22% 33%
Net assets, end of period (in thousands) $26,411 $23,337 $13,989 $13,603 $13,383 $15,830
* Effective December 31, 2008, the fiscal year changed to December 31.
(a) The per share amount does not round to a full penny.
(b) Total returns for periods less than one year are not annualized. Assumes investment at the net asset value at thebeginning of the period, reinvestment of all distributions and a complete redemption of the investment at the net assetvalue at the end of the period.
(c) Ratios are annualized for periods of less than one year.
(d) Expenses waived or reimbursed reflect reductions to total expenses, as discussed in the notes to the financialstatements. These amounts would decrease the net investment income ratio had such reductions not occurred.
(e) The net expense ratios shown above reflect expenses after waivers and reimbursements but exclude the effect ofreductions to total expenses for any expenses offset. Expense offset arrangements reduce total expenses, asdiscussed in the notes to the financial statements. These amounts would decrease the net investment income ratiohad such reductions not occurred. The effect of expenses offset are as follows:
Investor Class
Six Months Year Six MonthsEnded Ended Ended
Year Ended June 30,June 30, 2010 December 31, December 31,(unaudited) 2009 2008* 2008 2007 2006
Ratios to Average Net Assets (c):Expenses offset (f) — — — — — —
(f) Effect on the expense ratio was not greater than 0.005%.
(g) Portfolio turnover was not greater than 0.5%
See accompanying notes to financial statements.
�187

Financial Highlights
TAX FREE FUND
For a capital share outstanding during the
Investor Class
Six Months Year Six MonthsEnded Ended Ended
Year Ended June 30,June 30, 2010 December 31, December 31,(unaudited) 2009 2008* 2008 2007 2006
Net asset value, beginning of period $12.20 $11.72 $11.93 $11.98 $11.98 $12.33
Investment ActivitiesNet investment income .22 .45 .23 .47 .50 .52Net realized and unrealized gain (loss) .13 .48 (.21) (.05) —(a) (.36)
Total from investment activities .35 .93 .02 .42 .50 .16
Distributions from net investment income (.22) (.45) (.23) (.47) (.50) (.51)
Net asset value, end of period $12.33 $12.20 $11.72 $11.93 $11.98 $11.98
Total Return (excluding account fees) (b) 2.92% 8.03% .22% 3.54% 4.15% 1.30%Ratios to Average Net Assets: (c)
Net investment income 3.67% 3.73% 3.92% 3.91% 4.09% 4.01%Total expenses 1.66% 1.75% 1.91% 1.94% 1.86% 1.69%Expenses waived or reimbursed (d) (.96)% (1.05)% (1.21)% (1.24)% (1.16)% (.99)%Net expenses (e) .70% .70% .70% .70% .70% .70%
Portfolio turnover rate 8% —(g) 6% 11% 6% 19%
Net assets, end of period (in thousands) $22,136 $22,102 $16,946 $18,380 $15,940 $14,992
* Effective December 31, 2008, the fiscal year changed to December 31.
(a) The per share amount does not round to a full penny.
(b) Total returns for periods less than one year are not annualized. Assumes investment at the net asset value at thebeginning of the period, reinvestment of all distributions and a complete redemption of the investment at the net assetvalue at the end of the period.
(c) Ratios are annualized for periods of less than one year.
(d) Expenses waived or reimbursed reflect reductions to total expenses, as discussed in the notes to the financialstatements. These amounts would decrease the net investment income ratio had such reductions not occurred.
(e) The net expense ratios shown above reflect expenses after waivers and reimbursements but exclude the effect ofreductions to total expenses for any expenses offset. Expense offset arrangements reduce total expenses, asdiscussed in the notes to the financial statements. These amounts would decrease the net investment income ratiohad such reductions not occurred. The effect of expenses offset are as follows:
Investor Class
Six Months Year Six MonthsEnded Ended Ended
Year Ended June 30,June 30, 2010 December 31, December 31,(unaudited) 2009 2008* 2008 2007 2006
Ratios to Average Net Assets (c):Expenses offset (f) — — — — — —
(f) Effect on the expense ratio was not greater than 0.005%.
(g) Portfolio turnover was not greater than 0.5%
See accompanying notes to financial statements.
�188

Financial Highlights
ALL AMERICAN EQUITY FUND
For a capital share outstanding during the
Investor Class
Six Months Year Six MonthsEnded Ended Ended
Year Ended June 30,June 30, 2010 December 31, December 31,(unaudited) 2009 2008* 2008 2007 2006
Net asset value, beginning of period $19.60 $17.33 $27.27 $28.58 $27.59 $24.47
Investment ActivitiesNet investment gain (loss) .02 (.13) .04 (.15) (.08) (.18)Net realized and unrealized gain (loss) (.84) 2.51 (9.97) 1.98 4.94 3.89
Total from investment activities (.82) 2.38 (9.93) 1.83 4.86 3.71
DistributionsFrom net investment income — (.11) (.01) — — —From net realized gains — — — (3.01) (3.87) (.59)From tax return of capital — — — (.13) — —
Total distributions — (.11) (.01) (3.14) (3.87) (.59)
Short-Term Trading Fees**(a) — — — — — —
Net asset value, end of period $18.78 $19.60 $17.33 $27.27 $.28.58 $27.59
Total Return (excluding account fees) (b) (4.18)% 13.75% (36.42)% 5.99% 19.59% 15.25%Ratios to Average Net Assets: (c)
Net investment income (loss) .15% (.74)% .35% (.55)% (.28)% (.67)%Total expenses 2.49% 2.79% 2.37% 1.98% 2.01% 2.20%Expenses waived or reimbursed (d) (.53)% (.96)% (.62)% (.23)% (.26)% (.44)%Net expenses (e) 1.96% 1.83% 1.75% 1.75% 1.75% 1.76%
Portfolio turnover rate 186% 343% 205% 225% 223% 369%
Net assets, end of period (in thousands) $15,219 $16,436 $16,234 $26,513 $23,479 $21,547
* Effective December 31, 2008, the fiscal year changed to December 31.
** Based on average monthly shares outstanding.
(a) The per share amount does not round to a full penny.
(b) Total returns for periods less than one year are not annualized. Assumes investment at the net asset value at thebeginning of the period, reinvestment of all distribution and a complete redemption of the investment at the net assetvalue at the end of the period.
(c) Ratios are annualized for periods of less than one year.
(d) Expenses waived or reimbursed reflect reductions to total expenses, as discussed in the notes to the financialstatements. These amounts would increase the net investment loss ratio or decrease the net investment income ratio,as applicable, had such reductions not occurred.
(e) The net expense ratios shown above reflect expenses after waivers and reimbursements but exclude the effect ofreductions to total expenses for any expenses offset. Expense offset arrangements reduce total expenses, asdiscussed in the notes to the financial statements. These amounts would increase the net investment loss ratio, ordecrease the net investment income ratio, as applicable, had such reductions not occurred. The effect of expensesoffset are as follows:
Investor Class
Six Months Year Six MonthsEnded Ended Ended
Year Ended June 30,June 30, 2010 December 31, December 31,(unaudited) 2009 2008* 2008 2007 2006
Ratios to Average Net Assets (c):Expenses offset (f) —(f) —(f) —(f) —(f) —(f) (0.01)%
(f) Effect on the expense ratio was not greater than 0.005%.
See accompanying notes to financial statements.
�189

Financial Highlights
HOLMES GROWTH FUND
For a capital share outstanding during the
Investor Class
Six Months Year Six MonthsEnded Ended Ended
Year Ended October 31,June 30, 2010 December 31, December 31,(unaudited) 2009 2008* 2008 2007 2006 2005
Net asset value, beginning of period $15.54 $12.79 $14.14 $24.78 $18.34 $16.56 $14.38
Investment ActivitiesNet investment loss (.13) (.13) (.01) (.15) (.14) (.14) (.18)Net realized and unrealized gain (loss) (.18) 2.88 (1.34) (10.49) 6.58 1.92 2.36
Total from investment activities (.31) 2.75 (1.35) (10.64) 6.44 1.78 2.18
Distributions — — — — — — —Short-Term Trading Fees**(a) — — — — — — —
Net asset value, end of period $15.23 $15.54 $12.79 $14.14 $24.78 $18.34 $16.56
Total Return (excluding account fees) (b) (1.99)% 21.50% (9.55)% (42.94)% 35.11% 10.75% 15.16%Ratios to Average Net Assets: (c)
Net investment loss (1.61)% (.93)% (.27)% (.65)% (.62)% (.69)% (.98)%Total expenses 1.86% 2.10% 2.51% 1.74% 1.72% 1.74% 1.83%Expenses waived or reimbursed (d) —(f) (.33)% (.76)% — — — —Net expenses (e) 1.86% 1.77% 1.75% 1.74% 1.72% 1.74% 1.83%
Portfolio turnover rate 79% 219% 20% 140% 98% 290% 268%
Net assets, end of period (in thousands) $34,199 $37,149 $32,488 $36,231 $68,881 $61,810 $65,065
* Effective December 31, 2008, the fiscal year changed to December 31.
** Based on average monthly shares outstanding.
(a) The per share amount does not round to a full penny.
(b) Total returns for periods less than one year are not annualized. Assumes investment at the net asset value at thebeginning of the period, reinvestment of all distributions and a complete redemption of the investment at the net assetvalue at the end of the period.
(c) Ratios are annualized for periods of less than one year.
(d) Expenses waived or reimbursed reflect reductions to total expenses, as discussed in the notes to the financialstatements. These amounts would increase the net investment loss ratio or decrease the net investment income ratio,as applicable, had such reductions not occurred.
(e) The net expense shown above reflect expenses after waivers and reimbursements but exclude the effect of reductionsto total expenses for any expenses offset. Expense offset arrangements reduce total expenses, as discussed in thenotes to the financial statements. These amounts would increase the net investment loss ratio, or decrease the netinvestment income ratio, as applicable, had such reductions not occurred. The effect of expenses offset are as follows:
Investor Class
Six Months Year Six MonthsEnded Ended Ended
Year Ended October 31,June 30, 2010 December 31, December 31,(unaudited) 2009 2008* 2008 2007 2006 2005
Ratios to Average Net Assets (c):Expenses offset (f) —(f) —(f) —(f) —(f) —(f) (0.01)% —(f)
(f) Effect on the expense ratio was not greater than 0.005%.
See accompanying notes to financial statements.
�190

Financial Highlights
GLOBAL MEGATRENDS FUND
For a capital share outstanding during the
InstitutionalInvestor Class Class
Six Months Year Six Months PeriodEnded Ended Ended Ended
Year Ended October 31,June 30, 2010 December 31, December 31, 6/30/2010(e)(unaudited) 2009 2008* 2008 2007** 2006 2005 (unaudited)
Net asset value, beginning of period $8.15 $6.28 $6.60 $12.75 $11.07 $10.30 $9.20 $7.89
Investment ActivitiesNet investment income (loss) .03 .03 —(a) —(a) (.11) (.10) (.14) .05Net realized and unrealized gain
(loss) (.98) 1.86 (.31) (5.30) 2.63 1.18 1.24 (.73)
Total from investment activities (.95) 1.89 (.31) (5.30) 2.52 1.08 1.10 (.68)
DistributionsFrom net investment income — (.02) — — — — — —From net realized gains — — — (.85) (.84) (.31) — —From tax return of capital — — (.01) — — — — —
Total distributions — (.02) (.01) (.85) (.84) (.31) — —
Short-Term Trading Fees***(a) — — — — — — — —
Net asset value, end of period $7.20 $8.15 $6.28 $6.60 $12.75 $11.07 $10.30 $7.21
Total Return(excluding account fees) (b) (11.66)% 30.15% (4.74)% (44.50)% 24.49% 10.53% 11.96% (8.09)%
Ratios to Average Net Assets: (c)Net investment income (loss) .55% .45% (.20)% (.06)% (.93)% (.89)% (1.37)% 1.84%Total expenses 2.37% 2.43% 2.96% 2.21% 2.49% 2.55% 2.83% 368.59%Expenses waived or reimbursed (d) (.16)% (.48)% (1.11)% (.21)% — — — (366.96)%Net expenses (f) 2.21% 1.95% 1.85% 2.00% 2.49% 2.55% 2.83% 1.63%
Portfolio turnover rate (h) 44% 100% 29% 92% 65% 75% 54% 44%
Net assets, end of period (inthousands) $19,594 $28,557 $22,035 $25,387 $17,723 $17,077 $14,276 $9
* Effective December 31, 2008, the fiscal year changed to December 31.** Effective October 1, 2007, U.S. Global Investors, Inc. assumed management of Global MegaTrends Fund from the
former subadviser.*** Based on average monthly shares outstanding.(a) The per share amount does not round to a full penny.(b) Total returns for periods less than one year are not annualized. Assumes investment at the net asset value at the
beginning of the period, reinvestment of all distributions and a complete redemption of the investment at the net assetvalue at the end of the period.
(c) Ratios are annualized for periods of less than one year.(d) Expenses waived or reimbursed reflect reductions to total expenses, as discussed in the notes to the financial
statements. These amounts would increase the net investment loss ratio or decrease the net investment income ratio,as applicable, had such reductions not occurred.
(e) From March 1, 2010, commencement of operations for the Institutional Class.(f) The expense ratios shown above exclude the effect of reductions to total expenses for any expenses offset. Expense
offset arrangements reduce total expenses, as discussed in the notes to financial statements. These amounts wouldincrease the net investment loss ratio, or decrease the net investment income ratio, as applicable, had such reductionsnot occurred. The effect of expenses offset are as follows:
InstitutionalInvestor Class Class
Six Months Year Six Months PeriodEnded Ended Ended Ended
Year Ended October 31,June 30, 2010 December 31, December 31, 6/30/2010(e)(unaudited) 2009 2008* 2008 2007 2006 2005 (unaudited)
Ratios to Average Net Assets (c):Expenses offset (g) — — — — — — — —
(g) Effect on the expense ratio was not greater than 0.005%.(h) Portfolio turnover rate is calculated at the fund level.
See accompanying notes to financial statements.
�191

Financial Highlights
GLOBAL RESOURCES FUND
For a capital share outstanding during theInstitutional
Investor Class Class
Six Months Year Six Months PeriodEnded Ended Ended Ended
Year Ended June 30,June 30, 2010 December 31, December 31, 6/30/2010(e)(unaudited) 2009 2008* 2008 2007 2006 (unaudited)
Net asset value, beginning ofperiod $8.85 $5.26 $20.52 $17.70 $17.22 $12.67 $8.96
Investment ActivitiesNet investment income (loss) (.05) (.01) (.02)** .05** .21 .29 —(a)Net realized and unrealized gain
(loss) (.51) 3.60 (13.92)** 5.86** 2.86 5.63 (.65)
Total from investment activities (.56) 3.59 (13.94) 5.91 3.07 5.92 (.65)
DistributionsFrom net investment income — — — (.95) (.88) (.32) —From net realized gains — — (1.32) (2.14) (1.71) (1.05) —
Total distributions — — (1.32) (3.09) (2.59) (1.37) —
Short-Term Trading Fees**(a) — — — — — — —
Net asset value, end of period $8.29 $8.85 $5.26 $20.52 $17.70 $17.22 $8.31
Total Return (excluding accountfees) (b) (6.33)% 68.25% (67.70)% 37.59% 20.94% 48.91% (6.27)%
Ratios to Average Net Assets: (c)Net investment income (loss) (1.02)% (.08)% (.34)% .28% .74% 1.07% (.10)%Total expenses 1.71% 1.64% 1.20% .88% .95% .96% 2.69%Expenses waived or reimbursed (d) — (.17)% (.12)% — — — (1.57)%Net expenses (f) 1.71% 1.47% 1.08% .88% .95% .96% 1.12%
Portfolio turnover rate (h) 72% 189% 100% 133% 122% 157% 72%
Net assets, end of period (inthousands) $624,221 $740,072 $464,524 $2,010,581 $1,383,250 $1,281,664 $3,646
* Effective December 31, 2008, the fiscal year changed to December 31.** Based on average monthly shares outstanding.(a) The per share amount does not round to a full penny.(b) Total returns for periods less than one year are not annualized. Assumes investment at the net asset value at the
beginning of the period, reinvestment of all distributions and a complete redemption of the investment at the net assetvalue at the end of the period.
(c) Ratios are annualized for periods of less than one year.(d) Expenses waived or reimbursed reflect reductions to total expenses, as discussed in the notes to the financial
statements. These amounts would increase the net investment loss ratio or decrease the net investment income ratio,as applicable, had such reductions not occurred.
(e) From March 1, 2010, commencement of operations for the Institutional Class.(f) The net expense ratios shown above reflect expenses after waivers and reimbursements but exclude the effect of
reductions to total expenses for any expenses offset. Expense offset arrangements reduce total expenses, asdiscussed in the notes to the financial statements. These amounts would increase the net investment loss ratio, ordecrease the net investment income ratio, as applicable, had such reductions not occurred. The effect of expensesoffset are as follows:
InstitutionalInvestor Class Class
Six Months Year Six Months PeriodEnded Ended Ended Ended
Year Ended June 30,June 30, 2010 December 31, December 31, 6/30/2010(e)(unaudited) 2009 2008* 2008 2007 2006 (unaudited)
Ratios to Average Net Assets (c):Expenses offset —(g) —(g) —(g) (0.01)% (0.01)% (0.01)% —
(g) Effect on the expense ratio was not greater than 0.005%.(h) Portfolio turnover rate is calculated at the fund level.
See accompanying notes to financial statements.
�192
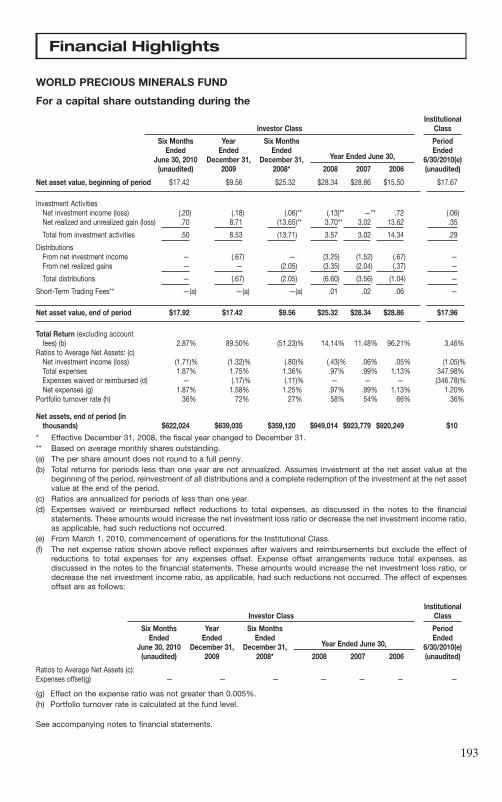
Financial Highlights
WORLD PRECIOUS MINERALS FUND
For a capital share outstanding during the
InstitutionalInvestor Class Class
Six Months Year Six Months PeriodEnded Ended Ended Ended
Year Ended June 30,June 30, 2010 December 31, December 31, 6/30/2010(e)(unaudited) 2009 2008* 2008 2007 2006 (unaudited)
Net asset value, beginning of period $17.42 $9.56 $25.32 $28.34 $28.86 $15.50 $17.67
Investment ActivitiesNet investment income (loss) (.20) (.18) (.06)** (.13)** —** .72 (.06)Net realized and unrealized gain (loss) .70 8.71 (13.65)** 3.70** 3.02 13.62 .35
Total from investment activities .50 8.53 (13.71) 3.57 3.02 14.34 .29
DistributionsFrom net investment income — (.67) — (3.25) (1.52) (.67) —From net realized gains — — (2.05) (3.35) (2.04) (.37) —
Total distributions — (.67) (2.05) (6.60) (3.56) (1.04) —
Short-Term Trading Fees** —(a) —(a) —(a) .01 .02 .06 —
Net asset value, end of period $17.92 $17.42 $9.56 $25.32 $28.34 $28.86 $17.96
Total Return (excluding accountfees) (b) 2.87% 89.50% (51.23)% 14.14% 11.48% 96.21% 3.46%
Ratios to Average Net Assets: (c)Net investment income (loss) (1.71)% (1.32)% (.80)% (.43)% .06% .05% (1.05)%Total expenses 1.87% 1.75% 1.36% .97% .99% 1.13% 347.98%Expenses waived or reimbursed (d) — (.17)% (.11)% — — — (346.78)%Net expenses (g) 1.87% 1.58% 1.25% .97% .99% 1.13% 1.20%
Portfolio turnover rate (h) 36% 72% 27% 58% 54% 66% 36%
Net assets, end of period (inthousands) $622,024 $639,035 $359,120 $949,014 $923,779 $920,249 $10
* Effective December 31, 2008, the fiscal year changed to December 31.** Based on average monthly shares outstanding.(a) The per share amount does not round to a full penny.(b) Total returns for periods less than one year are not annualized. Assumes investment at the net asset value at the
beginning of the period, reinvestment of all distributions and a complete redemption of the investment at the net assetvalue at the end of the period.
(c) Ratios are annualized for periods of less than one year.(d) Expenses waived or reimbursed reflect reductions to total expenses, as discussed in the notes to the financial
statements. These amounts would increase the net investment loss ratio or decrease the net investment income ratio,as applicable, had such reductions not occurred.
(e) From March 1, 2010, commencement of operations for the Institutional Class.(f) The net expense ratios shown above reflect expenses after waivers and reimbursements but exclude the effect of
reductions to total expenses for any expenses offset. Expense offset arrangements reduce total expenses, asdiscussed in the notes to the financial statements. These amounts would increase the net investment loss ratio, ordecrease the net investment income ratio, as applicable, had such reductions not occurred. The effect of expensesoffset are as follows:
InstitutionalInvestor Class Class
Six Months Year Six Months PeriodEnded Ended Ended Ended
Year Ended June 30,June 30, 2010 December 31, December 31, 6/30/2010(e)(unaudited) 2009 2008* 2008 2007 2006 (unaudited)
Ratios to Average Net Assets (c):Expenses offset(g) — — — — — — —
(g) Effect on the expense ratio was not greater than 0.005%.(h) Portfolio turnover rate is calculated at the fund level.
See accompanying notes to financial statements.
�193

Financial Highlights
GOLD AND PRECIOUS METALS FUND
For a capital share outstanding during the
Investor Class
Six Months Year Six MonthsEnded Ended Ended
Year Ended June 30,June 30, 2010 December 31, December 31,(unaudited) 2009 2008* 2008 2007 2006
Net asset value, beginning of period $15.46 $10.83 $17.18 $14.99 $15.48 $7.67
Investment ActivitiesNet investment income (loss) (.13) (.17)** (.03) (.08)** .05 (.01)**Net realized and unrealized gain (loss) 1.25 4.84 (5.59) 4.69 (.56) 7.88
Total from investment activities 1.12 4.67 (5.62) 4.61 (.51) 7.87
DistributionsFrom net investment income — (.04) — — — (.12)From net realized gains — — (.73) (2.43) — —
Total distributions — (.04) (.73) (2.43) — (.12)
Short-Term Trading Fees** —(a) —(a) —(a) .01 .02 .06
Net asset value, end of period $16.58 $15.46 $10.83 $17.18 $14.99 $15.48
Total Return (excluding account fees) (b) 7.24% 43.11% (31.51)% 33.49% (3.17)% 104.15%Ratios to Average Net Assets: (c)
Net investment income (loss) (1.60)% (1.16)% (.66)% (.41)% .31% (.06)%Total expenses 1.89% 1.69% 1.54% 1.27% 1.29% 1.47%Expenses waived or reimbursed (d) — (.15)% (.15)% — — —Net expenses (e) 1.89% 1.54% 1.39% 1.27% 1.29% 1.47%
Portfolio turnover rate 63% 135% 61% 93% 72% 78%
Net assets, end of period (in thousands) $235,017 $234,393 $192,206 $259,022 $178,762 $208,027
* Effective December 31, 2008, the fiscal year changed to December 31.
** Based on average monthly shares outstanding.
(a) The per share amount does not round to a full penny.
(b) Total returns for periods less than one year are not annualized. Assumes investment at the net asset value at thebeginning of the period, reinvestment of all distributions and a complete redemption of the investment at the net assetvalue at the end of the period.
(c) Ratios are annualized for periods of less than one year.
(d) Expenses waived or reimbursed reflect reductions to total expenses, as discussed in the notes to the financialstatements. These amounts would increase the net investment loss ratio or decrease the net investment income ratio,as applicable, had such reductions not occurred.
(e) The net expense ratios shown above reflect expenses after waivers and reimbursements but exclude the effect ofreductions to total expenses for any expenses offset. Expense offset arrangements reduce total expenses, asdiscussed in the notes to the financial statements. These amounts would increase the net investment loss ratio, ordecrease the net investment income ratio, as applicable, had such reductions not occurred. The effect of expensesoffset are as follows:
Investor Class
Six Months Year Six MonthsEnded Ended Ended
Year Ended June 30,June 30, 2010 December 31, December 31,(unaudited) 2009 2008* 2008 2007 2006
Ratios to Average Net Assets (c):Expenses offset —(f) —(f) —(f) —(f) (0.01)% —(f)
(f) Effect on the expense ratio was not greater than 0.005%.
See accompanying notes to financial statements.
�194

Financial Highlights
EASTERN EUROPEAN FUND
For a capital share outstanding during theInvestor Class
Six Months Year Six MonthsEnded Ended Ended
Year Ended October 31,June 30, 2010 December 31, December 31,(unaudited) 2009 2008*/** 2008*** 2007*** 2006*** 2005***
Net asset value, beginning ofperiod $9.11 $5.12 $6.35 $19.91 $15.44 $12.88 $9.47
Investment ActivitiesNet investment income (loss) (.01) —(a) (.03) (.03) (.10) .13 (.03)****Net realized and unrealized
gain (loss) (.93) 3.99 (1.20) (10.10) 6.83 3.60 3.81****
Total from investment activities (.94) 3.99 (1.23) (10.13) 6.73 3.73 3.78
DistributionsFrom net investment income — — — — (.29) — (.09)From net realized gains — — — (3.46) (1.98) (1.22) (.31)
Total distributions — — — (3.46) (2.27) (1.22) (.40)
Short-Term Trading Fees**** —(a) —(a) —(a) .03 .01 .05 .03
Net asset value, end of period $8.17 $9.11 $5.12 $6.35 $19.91 $15.44 $12.88
Total Return (excluding accountfees) (b) (10.32)% 77.93% (19.37)% (61.36)% 48.74% 31.03% 41.43%
Ratios to Average Net Assets: (c)Net investment income (loss) (.24)% —(f) (3.02)% (.15)% (.61)% .71% (.31)%Total expenses 1.87% 2.04% 2.37% 1.96% 1.98% 1.95% 2.00%Expenses waived or
reimbursed (d) — (.08)% (.27)% —(f) — — —Net expenses (e) 1.87% 1.96% 2.10% 1.96% 1.98% 1.95% 2.00%
Portfolio turnover rate 39% 80% 11% 82% 54% 68% 95%
Net assets, end of period (inthousands) $371,876 $464,409 $317,320 $415,494 $1,582,707 $1,347,149 $903,855
* Effective December 31, 2008, the fiscal year changed to December 31.** Effective November 7, 2008, U.S. Global Investors, Inc. assumed management of the fund from Charlemagne Capital
(IOM) Limited.*** The per share amounts shown were adjusted to reflect the 3-for-1 stock split which was effective on May 27, 2008.**** Based on average monthly shares outstanding.(a) The per share amount does not round to a full penny.(b) Total returns for periods less than one year are not annualized. Assumes investment at the net asset value at the
beginning of the period, reinvestment of all distributions and a complete redemption of the investment at the net assetvalue at the end of the period.
(c) Ratios are annualized for periods of less than one year.(d) Expenses waived or reimbursed reflect reductions to total expenses, as discussed in the notes to the financial
statements. These amounts would increase the net investment loss ratio or decrease the net investment income ratio,as applicable, had such reductions not occurred.
(e) The expense ratios shown above exclude the effect of reductions to total expenses for any expenses offset and forfees rebated from the subadviser. Expense offset arrangements reduce total expenses, as discussed in the notes tothe financial statements. Through June 2006, the subadviser of the above fund provided advisory services to twoclosed-end investment companies that the above fund had invested in. The subadviser rebated amounts to the abovefund representing the portion of management fees paid by the two investment companies to the subadviser based onthe above funds investment. Fees rebated by the subadviser also reduced total expenses. These amounts wouldincrease the net investment loss ratio, or decrease the net investment income ratio, as applicable, had such reductionsnot occurred. The effect of expenses offset and expenses rebated by the subadviser are as follows:
Investor Class
Six Months Year Six MonthsEnded Ended Ended
Year Ended October 31,June 30, 2010 December 31, December 31,(unaudited) 2009 2008 2008 2007 2006 2005
Ratios to Average Net Assets (c):Expenses offset —(f) —(f) —(f) (0.01)% (0.01)% (0.01)% (0.01)%Expenses rebated by subadviser n/a n/a n/a n/a n/a (0.01)% (0.02)%
(f) Effect on the expense ratio was not greater than 0.005%.
See accompanying notes to financial statements.
�195

Financial Highlights
GLOBAL EMERGING MARKETS FUND
For a capital share outstanding during the
Investor Class
Six Months Year Six Months PeriodEnded Ended Ended Ended
Year Ended October 31,June 30, 2010 December 31, December 31, October 31,(unaudited) 2009 2008*/** 2008 2007 2006 2005(a)
Net asset value, beginning of period $7.95 $5.29 $5.94 $21.88 $13.93 $10.65 $10.00
Investment ActivitiesNet investment income (loss) (.06) (.05) (.01) (.43) (.13) .02 .06Net realized and unrealized gain (loss) (.41) 2.71 (.56) (11.98) 9.18 3.50 .56
Total from investment activities (.47) 2.66 (.57) (12.41) 9.05 3.52 .62
DistributionsFrom net investment income — — — (.46) — (.05) —From net realized gains — — — (3.11) (1.13) (.26) —From tax return of capital — — (.08) — — — —
Total distributions — — (.08) (3.57) (1.13) (.31) —
Short-Term Trading Fees*** —(b) —(b) —(b) .04 .03 .07 .03
Net asset value, end of period $7.48 $7.95 $5.29 $5.94 $21.88 $13.93 $10.65
Total Return (excluding account fees) (c) (5.91)% 50.28% (9.59)% (66.81)% 69.52% 34.16% 6.50%Ratios to Average Net Assets: (d)
Net investment income (loss) (1.29)% (.77)% (1.16)% (1.01)% (.92)% .13% 1.08%Total expenses 3.66% 4.02% 6.83% 2.80% 2.75% 3.07% 4.16%Expenses waived or reimbursed (e) (.74)% (1.38)% (4.33)% (.30)% (.39)% (1.05)% (2.16)%Net expenses (f) 2.92% 2.64% 2.50% 2.50% 2.36% 2.02% 2.00%
Portfolio turnover rate 87% 166% 21% 83% 125% 136% 93%
Net assets, end of period (in thousands) $11,761 $13,819 $9,663 $11,708 $59,621 $29,029 $16,157
* Effective December 31, 2008, the fiscal year changed to December 31.** Effective November 7, 2008, U.S. Global Investors, Inc. assumed management of the fund from Charlemagne Capital
(IOM) Limited.*** Based on average monthly shares outstanding.(a) From February 24, 2005, commencement of operations.(b) The per share amount does not round to a full penny.(c) Total returns for periods less than one year are not annualized. Assumes investment at the net asset value at the
beginning of the period, reinvestment of all distributions and a complete redemption of the investment at the net assetvalue at the end of the period.
(d) Ratios are annualized for periods of less than one year.(e) Expenses waived or reimbursed reflect reductions to total expenses, as discussed in the notes to the financial
statements. These amounts would increase the net investment loss ratio or decrease the net investment income ratio,as applicable, had such reductions not occurred.
(f) The expense ratios shown above exclude the effect of reductions to total expenses for any expenses offset and forfees rebated from the subadviser. Expense offset arrangements reduce total expenses, as discussed in the notes tothe financial statements. Through June 2006, the subadviser of the above fund provided advisory services to a closed-end investment company that the above fund had invested in. The subadviser rebated amounts to the above fundrepresenting the portion of management fees paid by the investment company to the subadviser based on the abovefunds investment. Fees rebated by the subadviser also reduced total expenses. These amounts would increase the netinvestment loss ratio, or decrease the net investment income ratio, as applicable, had such reductions not occurred.The effect of expenses offset and expenses rebated by the subadviser are as follows:
Investor Class
Six Months Year Six Months PeriodEnded Ended Ended Ended
Year Ended October 31,June 30, 2010 December 31, December 31, October 31,(unaudited) 2009 2008 2008 2007 2006 2005(a)
Ratios to Average Net Assets (d):Expenses offset —(g) —(g) —(g) —(g) n/a n/a n/aExpenses rebated by subadviser n/a n/a n/a n/a n/a (0.02)% —(g)
(g) Effect on the expense ratio was not greater than 0.005%.
See accompanying notes to financial statements.
�196

Financial Highlights
CHINA REGION FUND
For a capital share outstanding during the
Investor Class
Six Months Year Six MonthsEnded Ended Ended
Year Ended June 30,June 30, 2010 December 31, December 31,(unaudited) 2009 2008* 2008 2007 2006
Net asset value, beginning of period $8.36 $5.59 $9.09 $12.55 $8.71 $6.87
Investment ActivitiesNet investment income (.05) (.05) (.02)** (.03)** —** (.01)Net realized and unrealized gain (loss) (.35) 2.81 (3.49)** (.27)** 3.98** 2.02
Total from investment activities (.40) 2.76 (3.51) (.30) 3.98 2.01
DistributionsFrom net investment income — — — (.10) (.16) (.19)From net realized gains — — — (2.93) — —From tax return of capital — — — (.17) — —
Total distributions — — — (3.20) (.16) (.19)
Short-Term Trading Fees** —(a) .01 .01 .04 .02 .02
Net asset value, end of period $7.96 $8.36 $5.59 $9.09 $12.55 $8.71
Total Return (excluding account fees) (b) (4.78)% 49.55% (38.50)% (8.58)% 46.34% 30.03%Ratios to Average Net Assets: (c)
Net investment income (loss) (.99)% (.79)% (.47)% (.26)% .02% (.08)%Total expenses 2.23% 2.47% 2.46% 1.95% 2.02% 2.31%Expenses waived or reimbursed (d) —(f) (.45)% (.27)% — — —Net expenses (e) 2.23% 2.02% 2.19% 1.95% 2.02% 2.31%
Portfolio turnover rate 116% 327% 117% 208% 208% 292%
Net assets, end of period (in thousands) $47,626 $56,323 $38,348 $81,109 $93,805 $67,761
* Effective December 31, 2008, the fiscal year changed to December 31.
** Based on average monthly shares outstanding.
(a) The per share amount does not round to a full penny.
(b) Total returns for periods less than one year are not annualized. Assumes investment at the net asset value at thebeginning of the period, reinvestment of all distributions and a complete redemption of the investment at the net assetvalue at the end of the period.
(c) Ratios are annualized for periods of less than one year.
(d) Expenses waived or reimbursed reflect reductions to total expenses, as discussed in the notes to the financialstatements. These amounts would increase the net investment loss ratio or decrease the net investment income ratio,as applicable, had such reduction not occurred.
(e) The net expense ratios shown above reflect expenses after waivers and reimbursements but exclude the effect ofreductions to total expenses for any expenses offset. Expense offset arrangements reduce total expenses, asdiscussed in the notes to the financial statements. These amounts would increase the net investment loss ratio, ordecrease the net investment income ratio, as applicable, had such reductions not occurred. The effect of expensesoffset are as follows:
Investor Class
Six Months Year Six MonthsEnded Ended Ended
Year Ended June 30,June 30, 2010 December 31, December 31,(unaudited) 2009 2008* 2008 2007 2006
Ratios to Average Net Assets (c):Expenses offset —(f) —(f) —(f) —(f) —(f) (0.01)%
(f) Effect on the expense ratio was not greater than 0.005%.
See accompanying notes to financial statements.
�197

Additional Information (unaudited)
Proxy Voting
A description of the policies and procedures that the Funds use to determine howto vote proxies relating to portfolio securities is available without charge, uponrequest, by calling 1-800-US-FUNDS (1-800-873-8637). It also appears in theFunds’ statement of additional information (Form 485B), which can be found onthe SEC’s website at www.sec.gov.
Information regarding how the Funds voted proxies relating to portfolio securitiesduring the most recent 12-month period ended June 30 is available without charge,upon request, by calling 1-800-US-FUNDS (1-800-873-8637) or accessing theFunds’ Form N-PX on the SEC’s website at www.sec.gov.
Availability of Quarterly Portfolio Schedules
The Funds provide complete lists of holdings four times in each fiscal year, at thequarter-ends. For the second and fourth quarters, the lists appear in the Funds’semi-annual and annual reports to shareholders. For the first and third quarters,the Funds file the lists with the SEC on Form N-Q. Shareholders can look up theFunds’ Forms N-Q on the SEC’s website at www.sec.gov. You may also visit or callthe SEC’s Public Room in Washington, D.C. (1-202-942-8090) or send a requestplus a duplicating fee to the SEC, Public Reference Section, Washington, DC20549-0102 or by electronic request at the following e-mail address:[email protected].
�198

Rev. 08/2010
FACTS WHAT DOES U.S. GLOBAL INVESTORSDO WITH YOUR PERSONAL INFORMATION?
Why? Financial companies choose how they share your personal information. Federal law gives consumers the right to limit some but not all sharing. Federal law also requires us to tell you how we collect, share, and protect your personal information. Please read this notice carefully to understand what we do.
What? The types of personal information we collect and share depend on the product or service you have with us. This information can include:
Social Security number and account balances• transaction history and checking account information• account transactions and wire transfer instructions•
When you are no longer our customer, we continue to share your information as described in this notice.
How? All fi nancial companies need to share customers’ personal information to run their everyday business. In the section below, we list the reasons fi nancial companies can share their customers’ personal information; the reasons U.S. Global Investors chooses to share; and whether you can limit this sharing.
Reasons we can share your personal information
Does U.S. Global Investors share?
Can you limit this sharing?
For our everyday business purposes—such as to process your transactions, maintain your account(s), respond to court orders and legal investigations, or report to credit bureaus
Yes No
For our marketing purposes—to offer our products and services to you
Yes No
For joint marketing with other fi nancial companies
No We don’t share
For our affi liates’ everyday business purposes—information about your transactions and experiences
No We don’t share
For our affi liates’ everyday business purposes—information about your creditworthiness
No We don’t share
For nonaffi liates to market to you No We don’t share
Questions? Call 1-800-US-Funds (1-800-873-8637) or go to www.usfunds.com
10-496_ModelPrivacyPolicyForm.indd 110-496_ModelPrivacyPolicyForm.indd 1 8/3/10 3:15:45 PM8/3/10 3:15:45 PM

Page 2
Who we are
Who is providing this notice?
U.S. Global Investors, Inc., U.S. Global Investors Funds, United Shareholder Services, Inc., and U.S. Global Brokerage, Inc. (collectively known as U.S. Global Investors)
What we do
How does U.S. Global Investors protect my personal information?
To protect your personal information from unauthorized access and use, we use security measures that comply with federal law. These measures include computer safeguards and secured fi les and buildings.
How does U.S. Global Investors collect my personal information?
We collect your personal information, for example, when you open an account or buy securities from us• direct us to sell your securities or give us your • contact informationtell us where to send the money•
Why can’t I limit all sharing?
Federal law gives you the right to limit only sharing for affi liates’ everyday business purposes — • information about your creditworthiness affi liates from using your information to market to you• sharing for nonaffi liates to market to you•
State laws and individual companies may give you additional rights to limit sharing.
Defi nitions
Affi liates Companies related by common ownership or control. They can be fi nancial and nonfi nancial companies.
• Our affi liates include U.S. Global Investors, Inc., U.S. Global Investors Funds, United Shareholder Services, Inc., and U.S. Global Brokerage, Inc.
Nonaffi liates Companies not related by common ownership or control. They can be fi nancial and nonfi nancial companies.
• Nonaffi liates we share personal information with include companies that perform marketing on our behalf, printing and mailing companies, and companies that service your account(s).
Joint marketing A formal agreement between nonaffi liated fi nancial companies that together market fi nancial products or services to you.
U.S. Global Investors doesn’t jointly market.•
10-496_ModelPrivacyPolicyForm.indd 210-496_ModelPrivacyPolicyForm.indd 2 8/3/10 3:15:45 PM8/3/10 3:15:45 PM

[THIS PAGE INTENTIONALLY LEFT BLANK]

[THIS PAGE INTENTIONALLY LEFT BLANK]

[THIS PAGE INTENTIONALLY LEFT BLANK]

[THIS PAGE INTENTIONALLY LEFT BLANK]

[THIS PAGE INTENTIONALLY LEFT BLANK]

[THIS PAGE INTENTIONALLY LEFT BLANK]


June 30, 2010
U.S. Global Investors Funds Semi-Annual Report
U.S
. G
lob
al
Inve
sto
rs
P.O. B
ox 65
9405
San
Anto
nio,
Texa
s 78
265-
9604
U.S. Global Investors Funds Sem
i-Annual Report June 30, 2010
Wan
t to
redu
ce p
aper
was
te?
You
can
rece
ive th
is re
port
and
othe
r im
port
ant d
ocum
ents
el
ectr
onic
ally
. Ple
ase
visi
t w
ww
.usf
unds
.com
and
sig
n up
at A
cces
s M
y Ac
coun
t. If
you
need
furth
er a
ssis
tanc
e,
plea
se c
all u
s at 8
00-8
73-8
637.
10-421_InvestorsSemiAnnualCover.indd 110-421_InvestorsSemiAnnualCover.indd 1 8/3/10 4:48:50 PM8/3/10 4:48:50 PM