U.S. DOE NETL Cooperative Agreement DE-FC26-02NT41589 ...
292
EVALUATION OF MERCURY EMISSIONS FROM COAL-FIRED FACILITIES WITH SCR AND FGD SYSTEMS Topical Report No. 9 (Plant 7) U.S. DOE NETL Cooperative Agreement DE-FC26-02NT41589 Issued: January 2006 J. A. Withum S. C. Tseng J. E. Locke CONSOL Energy Inc., Research & Development 4000 Brownsville Rd. South Park, PA 15129 (412) 854-6600
Transcript of U.S. DOE NETL Cooperative Agreement DE-FC26-02NT41589 ...

EVALUATION OF MERCURY EMISSIONS FROM COAL-FIRED FACILITIES WITH SCR AND FGD SYSTEMS
Topical Report No. 9 (Plant 7)
U.S. DOE NETL Cooperative Agreement DE-FC26-02NT41589
Issued: January 2006
J. A. Withum S. C. Tseng J. E. Locke
CONSOL Energy Inc., Research & Development
4000 Brownsville Rd. South Park, PA 15129
(412) 854-6600

i
DISCLAIMER
This report was prepared as an account of work sponsored by an agency of the United States Government. Neither the United States Government nor any agency thereof, nor any of their employees, makes any warranty, express or implied, or assumes any legal liability or responsibility for the accuracy, completeness, or usefulness of any information, apparatus, product, or process disclosed, or represents that its use would not infringe privately owned rights. Reference herein to any specific commercial product, process, or service by trade name, trademark, manufacturer, or otherwise does not necessarily constitute or imply its endorsement, recommendation, or favoring by the United States Government or any agency thereof. The views and opinions of authors expressed herein do not necessarily state or reflect those of the United States Government or any agency thereof.

ii
ABSTRACT
CONSOL Energy Inc., Research & Development (CONSOL), with support from the U.S. Department of Energy, National Energy Technology Laboratory (DOE) and the Electric Power Research Institute (EPRI), is evaluating the effects of selective catalytic reduction (SCR) on mercury (Hg) capture in coal-fired plants equipped with an electrostatic precipitator (ESP) - wet flue gas desulfurization (FGD) combination or a spray dyer absorber – fabric filter (SDA-FF) combination. In this program CONSOL is determining mercury speciation and removal at 10 coal-fired facilities. The principal purpose of this work is to develop a better understanding of the potential mercury removal "co-benefits" achieved by NOx, and SO2 control technologies. It is expected that these data will provide the basis for fundamental scientific insights into the nature of mercury chemistry in flue gas, the catalytic effect of SCR systems on mercury speciation and the efficacy of different FGD technologies for mercury capture. Ultimately, this insight could help to design and operate SCR and FGD systems to maximize mercury removal. The objectives are 1) to evaluate the effect of SCR on mercury capture in the ESP-FGD and SDA-FF combinations at coal-fired power plants, 2) evaluate the effect of SCR catalyst degradation on mercury capture; 3) evaluate the effect of low load operation on mercury capture in an SCR-FGD system, and 4) collect data that could provide the basis for fundamental scientific insights into the nature of mercury chemistry in flue gas, the catalytic effect of SCR systems on mercury speciation and the efficacy of different FGD technologies for mercury capture. This document, the ninth in a series of topical reports, describes the results and analysis of mercury sampling performed on Unit 1 at Plant 7, a 566 MW unit burning a bituminous coal containing 3.6% sulfur. The unit is equipped with a SCR, ESP, and wet FGD to control NOx, particulate, and SO2 emissions, respectively. Four sampling tests were performed in August 2004 during ozone season with the SCR operating; flue gas mercury speciation and concentrations were determined at the SCR inlet, SCR outlet, air heater outlet (ESP inlet), ESP outlet (FGD inlet), and at the stack (FGD outlet) using the Ontario Hydro method. Three sampling tests were also performed in November 2004 during non-ozone season with the SCR bypassed; flue gas mercury speciation and concentrations were determined at the ESP outlet (FGD inlet), and at the stack (FGD outlet). Process samples for material balances were collected during the flue gas measurements. The results show that, at the point where the flue gas enters the FGD, a greater percentage of the mercury was in the oxidized form when the SCR was operating compared to when the SCR was bypassed (97% vs 91%). This higher level of oxidation resulted in higher mercury removals in the FGD because the FGD removed 90-94% of the oxidized mercury in both cases. Total coal-to-stack mercury removal was 86% with the SCR operating, and 73% with the SCR bypassed. The average mercury mass balance closure was 81% during the ozone season tests and 87% during the non-ozone season tests.

iii
TABLE OF CONTENTS Page
ABSTRACT ..................................................................................................................ii LIST OF FIGURES...................................................................................................... v LIST OF TABLES........................................................................................................iv LIST OF APPENDICES............................................................................................... v LIST OF ABBREVIATIONS.........................................................................................vi INTRODUCTION......................................................................................................... 1 HOST UTILITY DESCRIPTION .................................................................................. 1 MERCURY SAMPLING RESULTS ............................................................................. 2
I. Test Matrix ......................................................................................................... 2 II. Flue Gas Mercury Sampling Results................................................................. 3
A. SCR inlet ..................................................................................................... 3 B. SCR outlet................................................................................................... 4 C. Air heater outlet........................................................................................... 4 D. FGD inlet..................................................................................................... 5 E. Stack ......................................................................................................... 6
III. SCR/FGD System Hg Removal ....................................................................... 7 IV. Mercury Material Balance................................................................................ 8
EXPERIMENTAL AND SAMPLING METHODS........................................................ 10 I. Flue Gas Sampling Locations and Sampling Points ........................................ 11
A. SCR inlet ................................................................................................... 11 B. SCR outlet................................................................................................. 11 C. Air heater outlet......................................................................................... 12 D. FGD inlet................................................................................................... 12 E. Stack ....................................................................................................... 12
II. Flue Gas Mercury Measurements................................................................... 13 III. Coal Sampling and Analysis .......................................................................... 14
A. Coal samples ............................................................................................ 14 B. Results of analyses of coal samples ......................................................... 15
IV. Process Sample Collection and Analysis ...................................................... 18 A. Bottom ash ................................................................................................ 18 B. Limestone slurry........................................................................................ 19 C. ESP hopper ash........................................................................................ 23 D. FGD slurry................................................................................................. 33 E. FGD makeup water ................................................................................... 38 F. ME wash water samples............................................................................ 39
QUALITY ASSURANCE/QUALITY CONTROL......................................................... 42 I. Blank Samples ................................................................................................. 42 II. NIST Standard Reference Material Checks .................................................... 43 III. Spike Sample Recoveries.............................................................................. 43 IV. Duplicate Analyses ........................................................................................ 43 V. Flue Gas Mercury Concentration Detection Limits ......................................... 43 VI. Mercury Material Balance Closure................................................................. 44
VII. Heat input-based mercury emission........................................................ 46

iv
LIST OF TABLES Table 1. Coal-fired facilities in program.......................................................................... 1 Table 2. Sampling test matrix......................................................................................... 3 Table 3. Flue gas mercury speciation at the SCR inlet................................................... 4 Table 4. Flue gas mercury speciation at the SCR outlet ................................................ 4 Table 5. Flue gas mercury speciation at the air heater outlet......................................... 5 Table 6a. Flue gas mercury speciation at the FGD inlet (SCR in operation) .................. 5 Table 6b. Flue gas mercury speciation at the FGD inlet (SCR is bypassed).................. 6 Table 7a. Flue gas mercury speciation at the stack (SCR in operation)......................... 7 Table 7b. Flue gas mercury speciation at the stack (SCR is bypassed)......................... 7 Table 8a. Flue gas mercury removal (with SCR in operation) ........................................ 8 Table 8b. Flue gas mercury removal (SCR bypassed)................................................... 8 Table 9a. Mercury material balance closure (with SCR in operation)............................. 9 Table 9b. Mercury material balance closure (SCR bypassed) ....................................... 9 Table 12. Mercury speciation by train component........................................................ 13 Table 13. List of coal samples...................................................................................... 15 Table 14. Coal sample analyses – ozone season samples......................................... 16 Table 15. Coal sample analyses – non-ozone season samples.................................. 17 Table 16a. Results of analyses of bottom ash filtered solids........................................ 18 Table 16b. Results of analyses of bottom ash filtrate................................................... 19 Table 17. Results of analyses of limestone slurry solids samples – ozone season
tests............................................................................................................ 20 Table 18. Results of analyses of limestone slurry solids samples – non-ozone
season tests ............................................................................................... 21 Table 19. Results of analyses of limestone slurry filtrate samples – ozone season
tests............................................................................................................ 22 Table 20. Results of analyses of limestone slurry filtrate samples – non-ozone
season tests ............................................................................................... 23 Table 21. Results of analyses of ESP hopper ash samples collected in Test 1 ........... 24 Table 21. (Continued)................................................................................................... 25 Table 22. Results of analyses of ESP hopper ash samples collected in Test 2 ........... 26 Table 22. (Continued)................................................................................................... 27 Table 23. Results of analyses of ESP hopper ash samples collected in Test 3 ........... 28 Table 23. (Continued)................................................................................................... 29 Table 24. Results of analyses of ESP hopper ash samples collected in Test 4 ........... 30 Table 24. (Continued)................................................................................................... 31 Table 24. (Continued)................................................................................................... 32 Table 27. Results of analyses of FGD slurry filtrate samples – ozone season tests .... 36 Table 28. Results of analyses of FGD slurry filtrate samples – non-ozone season
tests............................................................................................................ 37 Table 29. Results of analyses of FGD makeup water samples – ozone season tests . 38 Table 30 Results of analyses of FGD makeup water samples – non-ozone season
tests............................................................................................................ 39 Table 33. NIST SRM analyses ..................................................................................... 43 Table 34. Flue gas mercury detection limits ................................................................. 44 Table 35. Summary of material balance closure for mercury, ozone season tests. ..... 45
v
Table 36. Summary of material balance closure for mercury, non-ozone season tests............................................................................................................ 46
Table 37. Heat input-based mercury emission ............................................................. 47
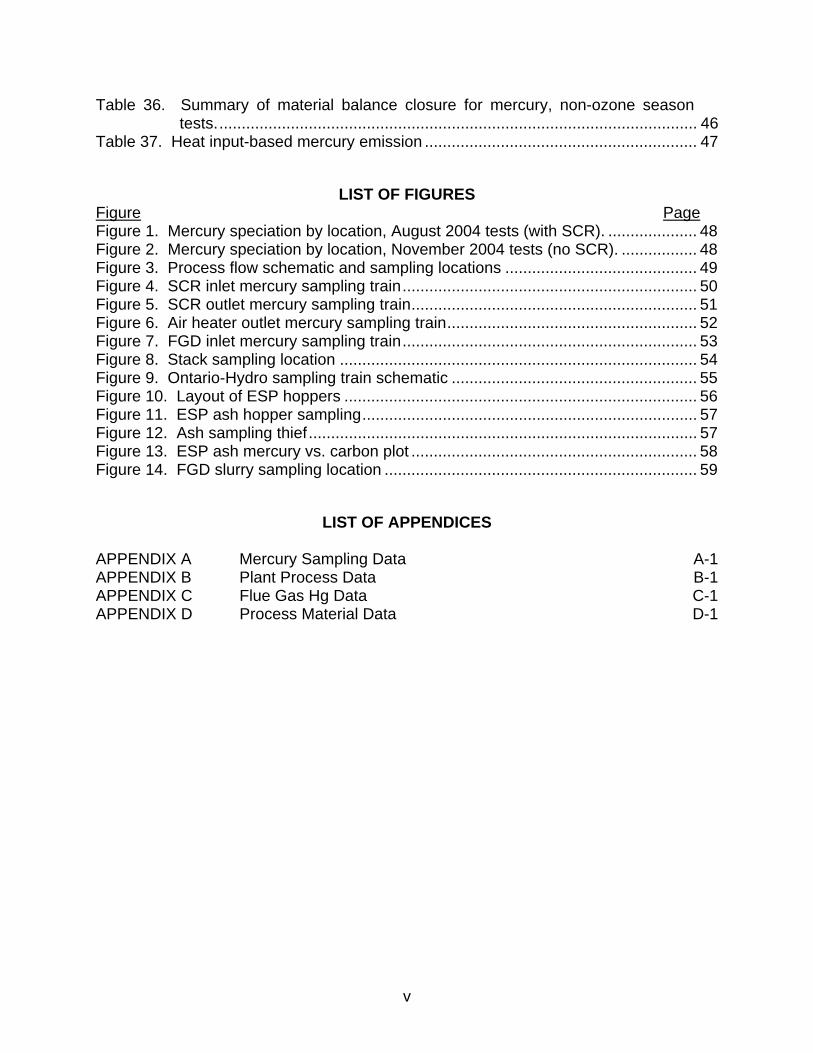
LIST OF FIGURES Figure Page Figure 1. Mercury speciation by location, August 2004 tests (with SCR). .................... 48 Figure 2. Mercury speciation by location, November 2004 tests (no SCR). ................. 48 Figure 3. Process flow schematic and sampling locations ........................................... 49 Figure 4. SCR inlet mercury sampling train.................................................................. 50 Figure 5. SCR outlet mercury sampling train................................................................ 51 Figure 6. Air heater outlet mercury sampling train........................................................ 52 Figure 7. FGD inlet mercury sampling train.................................................................. 53 Figure 8. Stack sampling location ................................................................................ 54 Figure 9. Ontario-Hydro sampling train schematic ....................................................... 55 Figure 10. Layout of ESP hoppers ............................................................................... 56 Figure 11. ESP ash hopper sampling........................................................................... 57 Figure 12. Ash sampling thief....................................................................................... 57 Figure 13. ESP ash mercury vs. carbon plot ................................................................ 58 Figure 14. FGD slurry sampling location ...................................................................... 59
LIST OF APPENDICES APPENDIX A Mercury Sampling Data A-1 APPENDIX B Plant Process Data B-1 APPENDIX C Flue Gas Hg Data C-1 APPENDIX D Process Material Data D-1

vi
LIST OF ABBREVIATIONS acfm - actual cubic feet per minute (wet) am - morning Btu - heating value in British Thermal Units Ca/S - calcium-sulfur ratio cfm - cubic feet per minute CO2 - carbon dioxide CONSOL R&D - CONSOL Energy Inc., Research and Development CVAA - cold vapor atomic absorption DI - deionized water DOE - U.S. Department of Energy dscf - dry standard cubic feet dscfm - dry standard cubic feet per minute EPA - U.S. Environmental Protection Agency EPRI - Electric Power Research Institute ESP - electrostatic precipitator FGD - flue gas desulphurization ft - feet ft2 - square feet ft3 - cubic feet gm - grams gpm - gallons per minute gr - grains HCl - hydrochloric acid Hg - mercury Hgpart - mercury in particulate form Hgtotal - total mercury in particulate, oxidized, and elemental forms Hg++ - mercury in oxidized form Hgo - mercury in elemental form HNO3 - nitric acid HCOF - hydroclone overflow HCUF - hydroclone underflow H2O - water H2O2 - hydrogen peroxide hr - hour ICP-AES - inductively coupled plasma-atomic emission spectrometer in - inch KCl - potassium chloride KMnO4 - potassium permanganate L - liter lb - pound m - meter m3 - cubic meter ME - mist eliminator mg - milligram, 10-3 gram

vii
LIST OF ABBREVIATIONS (continued) min - minute mL - milliliter M - molar, mol/L MM - million mol - mole ng - nanogram, 10-9 gram N2 - molecular nitrogen NIST - National Institute of Standards and Technology NO - nitric oxide NO2 - nitrogen dioxide O2 - molecular oxygen O3 - ozone pm - afternoon PM - particulate matter ppb - parts per billion (109) ppm - parts per million ppmv - parts per million by volume PRSD - percent relative standard deviation QA - quality assurance QC - quality control rpm - revolutions per minute scf - standard cubic feet (68EF and 29.92"Hg) scfm - standard cubic feet per minute SRM - Standard Reference Material temp - temperature tph - tons per hour TBtu - trillion (1012) British thermal unit wt - weight v - volts vs - versus ° F - temperature in degrees Fahrenheit < - less than > - more than µg - microgram, 10-6 gram

1
INTRODUCTION CONSOL Energy Inc. Research and Development (CONSOL R&D) is determining mercury speciation and removal at 10 coal-fired facilities with SCR/FGD combinations (Table 1). CONSOL R&D conducted two series of flue gas mercury (Hg), measurements on Unit 1 at Plant 7 in 2004. During “ozone season,” tests were conducted August 17-19 with the plant’s selective catalytic reduction (SCR) unit operating. During “non-ozone season,” tests were conducted November 5 with the SCR bypassed. The tests were performed under U. S. Department of Energy (DOE) Cooperative Agreement No. DE-FC26-02NT41589, and the Electric Power Research Institute (EPRI) Agreement No. EP-P13687/C6820. The ozone season test program consisted of four sets of measurements across the combustion emission control system that consists of the SCR unit, electrostatic precipitator (ESP), and flue gas desulfurization (FGD) system. The non-ozone season test program consisted of three sets of measurements at the FGD inlet and the stack.
The mercury measurements were made using the Ontario-Hydro Flue Gas Hg Speciation Method. The testing conducted by CONSOL R&D is documented in this report.
Table 1. Coal-fired facilities in program
Site # MW Air Pollution Control Devices Coal Ozone Unit1 330 SCR / Spray Dryer / Baghouse Bit year round2 245 SCR / Spray Dryer / Baghouse Bit year round 3 508 SCR / ESP/ Limestone FGD, inhibited oxidation Bit Yes
4 Unit 1 468 ESP/ Limestone FGD, natural oxidation Bit (1) 4 Unit 2 468 SCR / ESP/ Limestone FGD, natural oxidation Bit year round5 Unit 1 1,300 SCR / ESP/ Limestone FGD, in-situ oxidation Bit Yes 5 Unit 2 1,300 ESP/ Limestone FGD, in-situ oxidation Bit (1)
6 (2) 544 SCR / ESP/ Limestone FGD, ex-situ oxidation Bit Yes 7 (2) 566 SCR / ESP/ Limestone FGD, ex-situ oxidation Bit Yes
8 684 SCR / ESP / Lime FGD, ex-situ oxidation Bit Yes 9 640 SCR / ESP/ Lime FGD, inhibited oxidation Bit Yes
10 1,300 SCR / ESP/ Lime FGD, inhibited oxidation Bit Yes (1) SCR was not installed when tests were conducted. (2) Tests were also conducted during non-ozone seasons while flue gas bypassed SCR.
HOST UTILITY DESCRIPTION
Plant 7 is a generation facility operating coal- and gas-fired units. The coal unit typically burns bituminous coal containing approximately 3-4% sulfur, and is equipped with ESP and limestone-based wet FGD to control the emissions of particulate matter

2
and sulfur dioxide (SO2). The FGD was designed for 90% SO2 reduction1. Unit 1 is also equipped with an SCR unit for NOx control. Anhydrous ammonia is injected in front of the plate-type SCR catalyst (provided by Hitachi) beds to react with NOx. The SCR unit is operated only during the ozone season.
Mercury measurements and speciation tests were conducted at Unit 1, a 566 MW dry-bottom wall-fired boiler with a nominal design heat input of 5,025 MM Btu per hour.2 Particulate matter is removed by ESPs arranged in two blocks. Each block has 20 ash hoppers arranged in five rows of four hoppers each. The limestone-based wet FGD system has two scrubber modules and all the combustion flue gas is scrubbed. The calcium sulfite rich scrubber sludge is oxidized in external vessels (ex-situ oxidation). The calcium sulfate (or gypsum) slurry formed in the oxidizers is pumped into a hydroclone bank. The hydroclone underflow (HCUF) stream, which contains the larger gypsum crystals, is further dewatered by drum filters inside the gypsum building. The hydroclone overflow (HCOF) stream flows back to the scrubber modules for volume makeup. The scrubbed flue gas exits through a 760 foot stack.
MERCURY SAMPLING RESULTS
I. Test Matrix
The ozone season mercury measurements consisted of a total of four tests over two days, the non-ozone season measurements were three tests performed in one day. The test matrix is shown in Table 2. A total of 20 flue gas mercury measurements were conducted at five locations (SCR inlet, SCR outlet, air heater outlet, FGD inlet, and stack) during the August test program; a total of 6 flue gas mercury measurements were conducted at two locations (FGD inlet and stack) during the November test program. The Ontario Hydro Method (ASTM Method D-6784-02) was used to perform the measurements. Mercury measurements were performed with a maximum duration of 160 minutes. Details of sampling conditions are provided later in this report.
To calculate the material balance, CONSOL R&D and plant personnel obtained process samples (coal, bottom ash, ESP ash, limestone slurry, FGD slurry, FGD makeup water, hydroclone overflow slurry, hydroclone underflow slurry, mist eliminator wash water, and gypsum) simultaneously during the gas sampling periods. CONSOL R&D performed all the laboratory analyses; no analysis was subcontracted out. Detailed results of analyses are included in this report.
1 U.S. Department of Energy, Energy Information Administration, F767 database for year 2003. 2 Per facility’s Title V permit.

3
Table 2. Sampling test matrix
II. Flue Gas Mercury Sampling Results
Figures 1 and 2 show the mercury speciation for the four tests conducted at each location in August 2004 and November 2004, respectively. All gas streams were sampled isokinetically. A complete compendium of mercury analyses is in Appendix C. The test results at each sampling location are discussed in the following sections; the tables list the flue gas mercury concentrations and the mercury mass flow rates for each location.
A. SCR inlet
Four mercury measurements were conducted at the SCR inlet in August 2004. Table 3 summarizes the mercury measurements at the SCR inlet. The results show that more than 99% of the mercury was in the gas phase and less than 1% of the mercury was in the particulate form (Hgpart). The high percentage of gas phase mercury is expected due to the gas temperature (660°F) at this location. Eighty-five percent of the total mercury was in the oxidized form (Hg++).
SCR Inlet
SCR Outlet
Air Heater Outlet
FGD Inlet Stack Coal Bottom
AshESP Ash
Limestone Slurry
FGD Slurry
FGD Makeup Water
Hydroclone Overflow
Slurry
Hydroclone Underflow
Slurry
ME Wash Water
16-Aug Setup --- --- --- --- --- --- --- --- --- --- --- --- --- ---17-Aug Test 1 X X X X X X X X X X X --- --- ---
Test 2 X X X X X X X X X X X --- --- ---Test 3 X X X X X X X X X X X X X X
19-Aug Test 4 X X X X X X X X X X X X X X
20-Aug Pack, Demobilize --- --- --- --- --- --- --- --- --- --- --- --- --- ---
4-Nov Setup --- --- --- --- --- --- --- --- --- --- --- --- --- ---Test 1 --- --- --- X X X --- --- X X X X X XTest 2 --- --- --- X X X --- --- X X X X X XTest 3 --- --- --- X X X --- --- X X X X X X
6-Nov Pack, Demobilize --- --- --- --- --- --- --- --- --- --- --- --- --- ---
18-Aug
5-Nov
Flue Gas Sampling Process Sampling
Date Activity

4
Table 3. Flue gas mercury speciation at the SCR inlet
Hg Concentration, µg/m3 (dry std conditions)
Hg Flow, mg/sec Date Test No.
Hgpart Hg++ Hg0 Hgtotal Hgpart Hg++ Hg0 Hgtotal
8/17 1 0.025 10.9 2.53 13.5 0.011 4.90 1.13 6.05
8/18 2 0.033 9.71 0.95 10.7 0.015 4.32 0.42 4.76 8/18 3 0.023 9.97 1.38 11.4 0.011 4.49 0.62 5.12 8/19 4 0.029 9.47 1.98 11.5 0.013 4.31 0.90 5.23
AverageStandard Deviation
PRSD
0.028 0.004 15%
10.0 0.64 6%
1.71 0.69 41%
11.8 1.21 10%
0.012 0.002 15%
4.51 0.28 6%
0.77 0.31 41%
5.29 0.55 10%
B. SCR outlet
Four mercury measurements were conducted at the SCR outlet location in August 2004. Table 4 summarizes the mercury measurements at this location. Most (79%) of the mercury was vapor-phase Hg++.
Table 4. Flue gas mercury speciation at the SCR outlet
Hg Concentration, µg/m3 (dry std conditions) Hg Flow, mg/sec
Date Test No.
Hgpart Hg++ Hg0 Hgtotal Hgpart Hg++ Hg0 Hgtotal
8/17 1 0.089 10.92 5.25 16.3 0.040 4.94 2.37 7.35 8/18 2 0.248 8.19 1.29 9.73 0.109 3.59 0.57 4.26 8/18 3 0.094 12.5 1.98 14.6 0.042 5.60 0.88 6.53 8/19 4 0.039 9.30 2.17 11.5 0.018 4.18 0.97 5.17
AverageStandard Deviation
PRSD
0.118 0.090 77%
10.2 1.90 19%
2.67 1.76 66%
13.0 2.95 23%
0.052 0.039 75%
4.58 0.88 19%
1.20 0.80 67%
5.83 1.38 24%
C. Air heater outlet
Four mercury measurements were conducted at the air heater outlet location in August 2004. Table 5 summarizes the mercury measurements at this location. The majority (97%) of the mercury was vapor-phase Hg++.

5
Table 5. Flue gas mercury speciation at the air heater outlet
Hg Concentration, µg/m3 (dry std conditions) Hg Flow, mg/sec
Date Test No.
Hgpart Hg++ Hg0 Hgtotal Hgpart Hg++ Hg0 Hgtotal
8/17 1 0.030 16.0 0.31 16.3 0.014 7.37 0.14 7.52 8/18 2 0.189 14.6 0.24 15.1 0.089 6.88 0.11 7.08 8/18 3 0.078 12.9 0.26 13.2 0.036 5.98 0.12 6.14 8/19 4 0.125 13.1 0.39 13.6 0.058 6.14 0.18 6.38
AverageStandard Deviation
PRSD
0.106 0.068 64%
14.2 1.45 10%
0.30 0.07 22%
14.6 1.42 10%
0.049 0.032 65%
6.59 0.65 10%
0.14 0.03 22%
6.78 0.64 9%
D. FGD inlet
Four mercury measurements were conducted at the FGD inlet location in August 2004 and three in November 2004. Tables 6a and 6b summarize the mercury measurements. In both sets of tests, nearly 100% of the flue gas mercury was in the gaseous phase. With the SCR in operation (Table 6a), 97% of the total mercury was Hg++; with the SCR bypassed (Table 6b), 91% of the total mercury was Hg++.
Table 6a. Flue gas mercury speciation at the FGD inlet (SCR in operation)
Hg Concentration, µg/m3 (dry std conditions) Hg Flow, mg/sec
Date Test No.
Hgpart Hg++ Hg0 Hgtotal Hgpart Hg++ Hg0 Hgtotal
8/17 1 0.002 10.1 0.21 10.3 0.001 4.75 0.10 4.85
8/18 2 0.036 11.2 0.61 11.8 0.017 5.37 0.29 5.68
8/18 3 0.018 10.6 0.20 10.8 0.009 5.11 0.09 5.22 8/19 4 0.002 11.2 0.33 11.5 0.001 5.44 0.16 5.60
AverageStandard Deviation
PRSD
0.015 0.016 110%
10.7 0.53 5%
0.34 0.19 57%
11.1 0.70 6%
0.007 0.008 110%
5.17 0.31 6%
0.16 0.09 57%
5.34 0.38 7%

6
Table 6b. Flue gas mercury speciation at the FGD inlet (SCR is bypassed)
Hg Concentration, µg/m3 (dry std conditions) Hg Flow, mg/sec
Date Test No.
Hgpart Hg++ Hg0 Hgtotal Hgpart Hg++ Hg0 Hgtotal
11/05 1 0.129 7.06 0.64 7.83 0.063 3.42 0.31 3.79
11/05 2 0.062 13.1 0.68 13.9 0.029 6.11 0.32 6.45
11/05 3 0.418 9.86 0.95 11.2 0.198 4.67 0.45 5.32
AverageStandard Deviation
PRSD
0.203 0.189 93%
10.0 3.04 30%
0.76 0.17 23%
11.0 3.02 28%
0.096 0.089 93%
4.73 1.35 28%
0.36 0.08 22%
5.19 1.34 26%
E. Stack Four mercury measurements were conducted at the stack in August 2004 and three in November 2004. Tables 7a and 7b summarize the mercury measurements. With the SCR in operation (Table 7a), 46% of the total mercury was Hg++; with the SCR bypassed (Table 7b), only 27% of the total mercury was Hg++.
With the SCR operating, elemental mercury increased by 0.28 mg/sec, from 0.16 mg/sec at the FGD inlet to 0.44 mg/sec at the stack. With the SCR bypassed, the increase was greater, 0.84 mg/sec (0.36 mg/sec at the FGD inlet and 1.20 mg/sec at the stack). An increase of Hg0 across wet scrubbers has been observed by CONSOL R&D at other plants.3,4
3 DeVito, M. S., Withum, J. A., and Statnick, R. M., “Flue Gas Measurements from Coal-Fired Boilers Equipped with Wet Scrubbers,” Int. J. of Environ. Pollution 17 (1/2), 2002, p. 126-142 4 Evaluation of Mercury Emissions from Coal-Fired Facilities with SCR and FGD Systems - Topical Report Nos. 1 and 4 through 8, U.S. DOE Cooperative Agreement DE-FC26-02NT41589

7
Table 7a. Flue gas mercury speciation at the stack (SCR in operation)
Hg Concentration, µg/m3 (dry std conditions)
Hg Flow, mg/sec Date Test No.
Hgpart Hg++ Hg0 Hgtotal Hgpart Hg++ Hg0 Hgtotal
8/17 1 0.011 0.74 0.32 1.07 0.005 0.36 0.16 0.52 8/18 2 0.002 0.61 0.84 1.45 0.001 0.29 0.40 0.69 8/18 3 0.012 0.77 0.80 1.58 0.006 0.37 0.39 0.76 8/19 4 0.002 0.52 1.70 2.22 0.001 0.25 0.82 1.07
AverageStandard Deviation
PRSD
0.007 0.006 83%
0.66 0.12 18%
0.92 0.57 62%
1.58 0.48 30%
0.003 0.003 83%
0.32 0.06 18%
0.44 0.28 62%
0.76 0.23 30%
Table 7b. Flue gas mercury speciation at the stack (SCR is bypassed)
Hg Concentration, µg/m3 (dry std conditions)
Hg Flow, mg/sec Date Test No.
Hgpart Hg++ Hg0 Hgtotal Hgpart Hg++ Hg0 Hgtotal
11/05 1 0.002 0.91 2.53 3.45 0.001 0.43 1.19 1.62 11/05 2 0.002 1.33 2.75 4.09 0.001 0.64 1.32 1.96 11/05 3 0.006 0.69 2.24 2.93 0.003 0.34 1.10 1.44
AverageStandard Deviation
PRSD
0.003 0.002 67%
0.97 0.33 34%
2.51 0.26 10%
3.49 0.58 17%
0.002 0.001 69%
0.47 0.15 33%
1.20 0.11 9%
1.67 0.26 16%
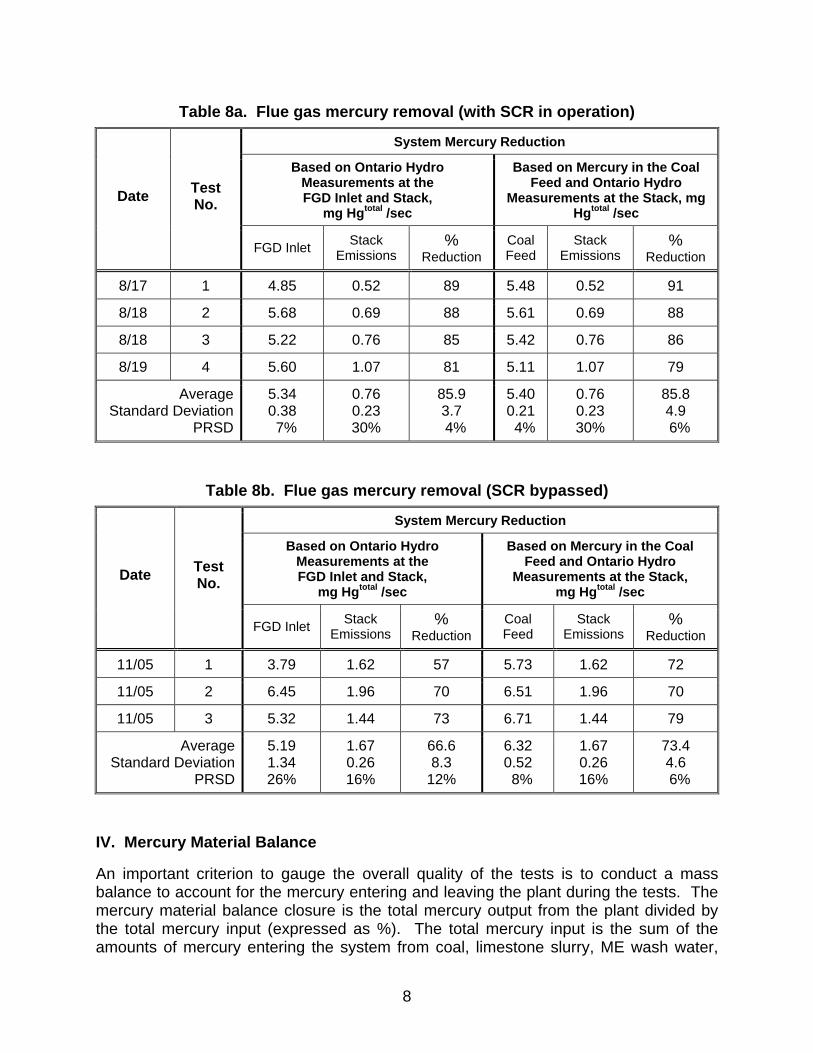
III. SCR/FGD System Hg Removal Tables 8a and 8b summarize the flue gas mercury removal for the two test periods. With the SCR operating (Table 8a), the coal-to-stack mercury removal ranged from 79 to 91% and the average coal-to-stack mercury removal was 86%. This is typical of the removals observed on other units with SCR-FGD combinations in this project4. With the SCR bypassed (Table 8b), the coal-to-stack mercury removal ranged from 70 to 79% and the average coal-to-stack mercury removal was 73%. Again, this is similar to the removals observed in other plants in this test program when the SCR is not present or is bypassed.
8
Table 8a. Flue gas mercury removal (with SCR in operation)
System Mercury Reduction
Based on Ontario Hydro Measurements at the FGD Inlet and Stack,
mg Hgtotal /sec
Based on Mercury in the Coal Feed and Ontario Hydro
Measurements at the Stack, mg Hgtotal /sec
Date Test No.
FGD Inlet Stack Emissions
% Reduction
Coal Feed
Stack Emissions
% Reduction
8/17 1 4.85 0.52 89 5.48 0.52 91
8/18 2 5.68 0.69 88 5.61 0.69 88
8/18 3 5.22 0.76 85 5.42 0.76 86
8/19 4 5.60 1.07 81 5.11 1.07 79
Average Standard Deviation
PRSD
5.34 0.38 7%
0.76 0.23 30%
85.9 3.7
4%
5.40 0.21 4%
0.76 0.23 30%
85.8 4.9
6%
Table 8b. Flue gas mercury removal (SCR bypassed)
System Mercury Reduction
Based on Ontario Hydro Measurements at the FGD Inlet and Stack,
mg Hgtotal /sec
Based on Mercury in the Coal Feed and Ontario Hydro
Measurements at the Stack, mg Hgtotal /sec
Date Test No.
FGD Inlet Stack Emissions
% Reduction
Coal Feed
Stack Emissions
% Reduction
11/05 1 3.79 1.62 57 5.73 1.62 72
11/05 2 6.45 1.96 70 6.51 1.96 70
11/05 3 5.32 1.44 73 6.71 1.44 79
Average Standard Deviation
PRSD
5.19 1.34 26%
1.67 0.26 16%
66.6 8.3
12%
6.32 0.52 8%
1.67 0.26 16%
73.4 4.6
6%
IV. Mercury Material Balance
An important criterion to gauge the overall quality of the tests is to conduct a mass balance to account for the mercury entering and leaving the plant during the tests. The mercury material balance closure is the total mercury output from the plant divided by the total mercury input (expressed as %). The total mercury input is the sum of the amounts of mercury entering the system from coal, limestone slurry, ME wash water,

9
and make-up water. The total mercury output is the sum of the amounts of mercury leaving the system via bottom ash, ESP hopper ash, FGD slurry, and stack flue gas.
Tables 9a and 9b summarize the mercury material balance closures for the tests conducted at this unit. The mercury material balance closures ranged from 78% to 85% in the August tests and between 77 and 102% in the November tests. The material balance closures for mercury for all individual tests are within our QA/QC criterion of 70-130% for a single test. The average material balance closure is 81% for the August tests and 87% for the November tests, within our QA/QC criterion of 80-120% for multiple tests. The measurements, calculations, and assumptions for calculating the material balances are described later in this report.
Table 9a. Mercury material balance closure (with SCR in operation)
Test No. 1 2 3 4 Total Hg Input (mg/sec) 5.62 5.73 5.60 5.25
Total Hg Output (mg/sec) 4.52 4.46 4.74 4.15
Hg Material Balance Closure (output / input) 80% 78% 85% 79%
Average Hg Material Balance Closure (%) 81 ± 3 %
Table 9b. Mercury material balance closure (SCR bypassed)
Test No. 1 2 3 Total Hg Input (mg/sec) 3.97 6.66 5.56
Total Hg Output (mg/sec) 3.84 5.90 4.16 Hg Material Balance Closure (output / input) 97% 89% 75% Average Hg Material Balance Closure (%) 87 ± 11 %
SCR/Non-SCR Test Comparison The results show that the SCR does indeed increase the oxidation of the mercury. At the point where the flue gas enters the FGD, a greater percentage of the mercury is in the oxidized form when the SCR is operating compared to when the SCR is bypassed. Table 10 shows the average mercury speciation of the flue gas in the FGD inlet duct for both test periods. Because this location is downstream of the plant’s ESP, there is very little particulate mercury.

10
Table 10. Comparison of Average Flue Gas Mercury Speciation at the FGD Inlet Ozone Season Tests
(with SCR) Non-Ozone Season Tests
(without SCR)
Hgpart 0.1% 1.9%
Hg++ 96.9% 90.9%
Hg0 3.0% 7.2%
This higher level of oxidation resulted in higher mercury removals in the scrubber. Table 11 shows that total mercury removal was 86% with the SCR, and 68% without the SCR; the removal of oxidized mercury in the scrubber was about the same (90-94%) in both cases. The difference was due to a greater percentage of oxidized mercury being reduced to elemental mercury in the scrubber during the tests with SCR; this increase in elemental mercury in wet scrubbers has been observed in tests at other plants in this program4. The reason for the greater effect in the November tests compared to the August tests is not clear; scrubber sulfite concentration is believed to play a role but this has not been verified. Scrubber sulfite concentration was not measured in this test program. Table 11. Comparison of Average Mercury Reductions Across the FGD Scrubber
Ozone Season Tests (with SCR)
Non-ozone Season Tests (without SCR)
FGD Inlet, mg Hg/sec
Stack, mg Hg/sec Reduction FGD Inlet,
mg Hg/secStack,
mg Hg/sec Reduction
Hgpart 0.007 0.003 54% 0.096 0.002 98%
Hg++ 5.17 0.32 94% 4.73 0.47 90%
Hg0 0.16 0.44 -171% 0.36 1.20 -235%
Total Hg 5.34 0.76 86% 5.19 1.67 67%
EXPERIMENTAL AND SAMPLING METHODS
CONSOL R&D performed flue gas mercury determinations using the Ontario-Hydro sampling method. As a quality assurance/quality control (QA/QC) measure, samples of the coal, bottom ash, FGD slurry, limestone slurry, and ESP ash, were taken to determine a mercury balance across the system.

11
I. Flue Gas Sampling Locations and Sampling Points
Five sampling locations, the SCR inlet, SCR outlet, air heater outlet (upstream of the ESP), FGD inlet, and stack outlet, were tested. Figure 3 is a flow schematic indicating the sampling locations at this unit.
Flue gas exits the economizer through two ducts (designated Ducts A and B) and passes through the SCR, air heater, ESP, and FGD, before it combines to form a single flue tube at the stack. All sampling at points leading to the stack was conducted in Duct A. The mercury mass flow rates were calculated using the measured flue gas mercury concentrations and a calculated gas flow rate for each sampling location (except for the stack location, where the gas flow rate was measured). The gas flow rate calculation was based on the stack gas flow rate, with a correction for air in-leakage based on the location’s flue gas oxygen concentration relative to the stack gas oxygen concentration. The stack was the only location where flow could be measured accurately using a full pitot traverse. Individual sampling locations are detailed in the following sections.
A. SCR inlet The SCR inlet consists of two vertical, rectangular ducts, measuring 13 feet deep by 28 feet, 6 inches wide at the sampling plane. Three sample ports are spaced across the face of each duct.
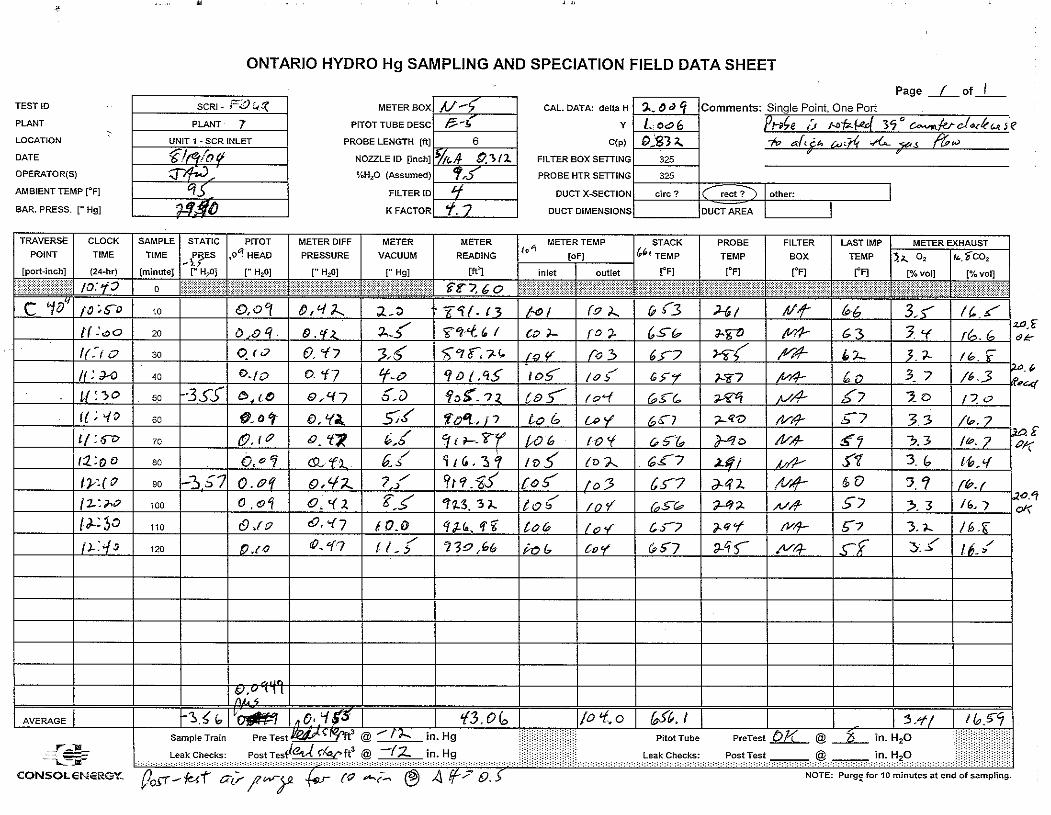
Only Duct A was sampled in this program. Preliminary pitot surveys conducted on August 16, 2004, indicated that the gas flow was straight, not cyclonic or swirling. The flue gas was sampled through the middle test port at a single point for the full duration of the test. Parametric readings were recorded every ten minutes. Total test duration was 120 minutes. Mercury measurements were conducted with the sampling nozzle oriented parallel to and directly into the flow.
Four mercury measurements were performed isokinetically at the SCR inlet. The sample train was prepared in EPA Method 17 configuration using an in-stack 19 mm x 90 mm quartz-fiber thimble filter. The filter apparatus was attached to a heated probe that was connected to the impinger train with a flexible heated Teflon sample line. Figure 4 is a photograph of the mercury sampling train at the SCR inlet.
B. SCR outlet The SCR outlet consists of two vertical, rectangular ducts, each measuring 25 feet, 11 inches deep by 55 feet wide. Eight sample ports are spaced across the face of each duct.
Only Duct A was sampled in this program. Preliminary pitot surveys conducted on August 16, 2004, indicated that the gas flow was straight, not cyclonic or swirling. The flue gas was sampled through four test ports, each at a single point for 30 minutes, with parametric readings every ten minutes. Mercury measurements were conducted with the sampling nozzle oriented parallel to and directly into the flow for a period of 120 minutes.

12
Four mercury measurements were performed isokinetically at the SCR outlet. The sample train was prepared in EPA Method 17 configuration using an in-stack 19 mm x 90 mm quartz-fiber thimble filter. The filter apparatus was attached to a heated probe that was connected to the impinger train with a flexible heated Teflon sample line. Figure 5 is a photograph of the mercury sampling train at the SCR outlet.
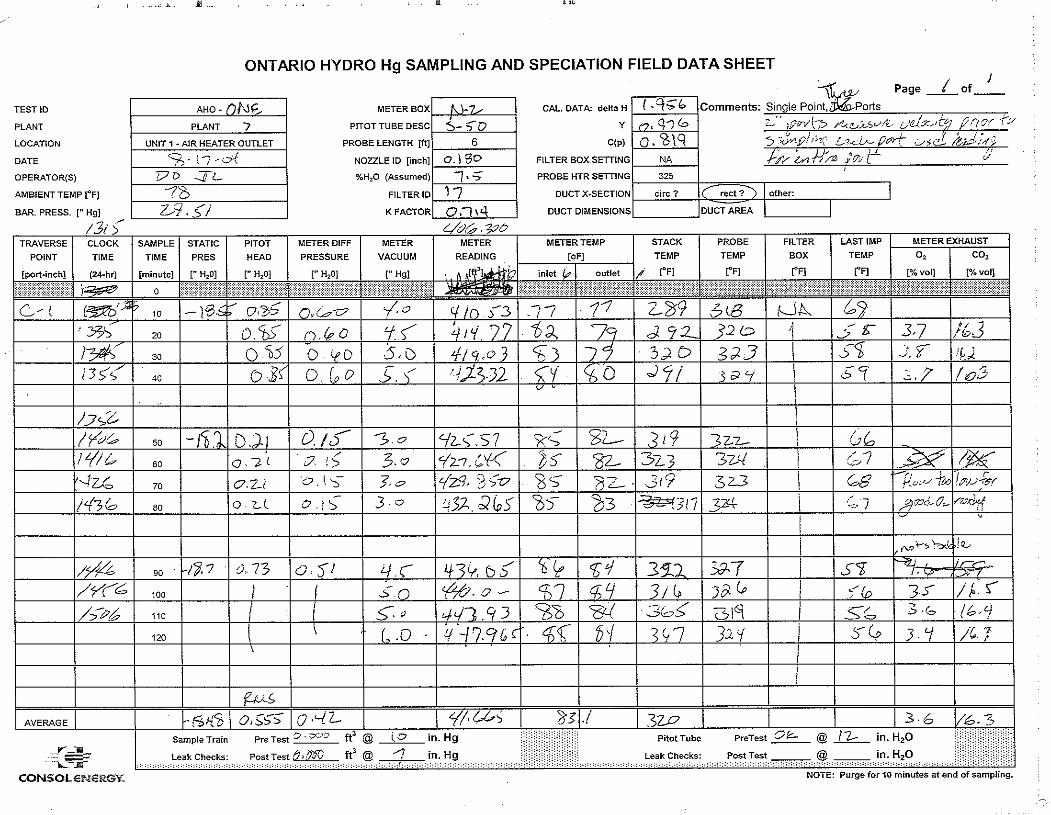
C. Air heater outlet The air heater outlet duct consists of two horizontal ducts, each approximately 9 feet deep and 34 feet wide. Eight test ports are located across the top of each duct. Preliminary pitot surveys conducted on August 16, 2004, indicated that the gas flow was parallel to the duct walls.
The flue gas was sampled through two test ports. Ideally three points would have been sampled in each port for 20 minutes each; however, the port length prevented the probe from reaching the deepest point. As a result the middle point was sampled twice for a total of 40 minutes. Total test durations were 120 minutes with parametric readings recorded every ten minutes. Mercury measurements were conducted with the sampling nozzle oriented parallel to and directly into the flow.
Four mercury measurements were performed isokinetically at the air heater outlet. The sample train was prepared in EPA Method 17 configuration using an in-stack 19 mm x 90 mm quartz-fiber thimble filter. The filter apparatus was attached to a heated probe that was connected to the impinger train with a flexible heated Teflon sample line. Figure 6 is a photograph of the mercury sampling train and a blank train (for QA/QC purposes) at the air heater outlet location.
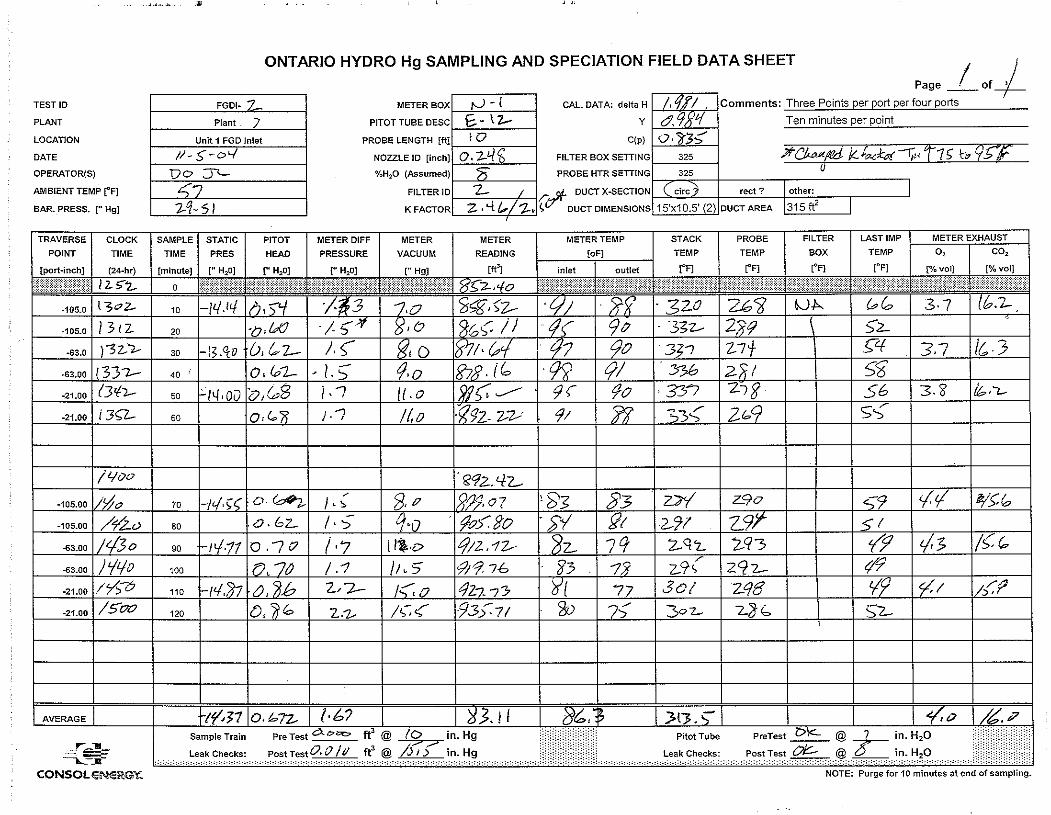
D. FGD inlet The FGD inlet consists of two ducts leading to two pair of FGD modules. A single test port was available in the A duct, downstream of the induced draft fan. A single point, near the center of the duct was sampled. A preliminary pitot survey conducted on August 16, 2004, indicated that the gas flow was parallel to the duct walls at this point.
Parametric readings were recorded every ten minutes over the test periods, which varied from 120 minutes to 160 minutes. Mercury measurements were conducted isokinetically with the sampling nozzle oriented parallel to and directly into the flow.
Four mercury measurements were performed at the FGD inlet in August and four in November. The sample train was prepared in EPA Method 17 configuration using an in-stack 47-mm quartz-fiber disc filter. The filter apparatus was attached to a heated probe that was connected to the impinger train with a flexible heated Teflon sample line. Figure 7 is a photograph of the mercury sampling train on the FGD inlet location.
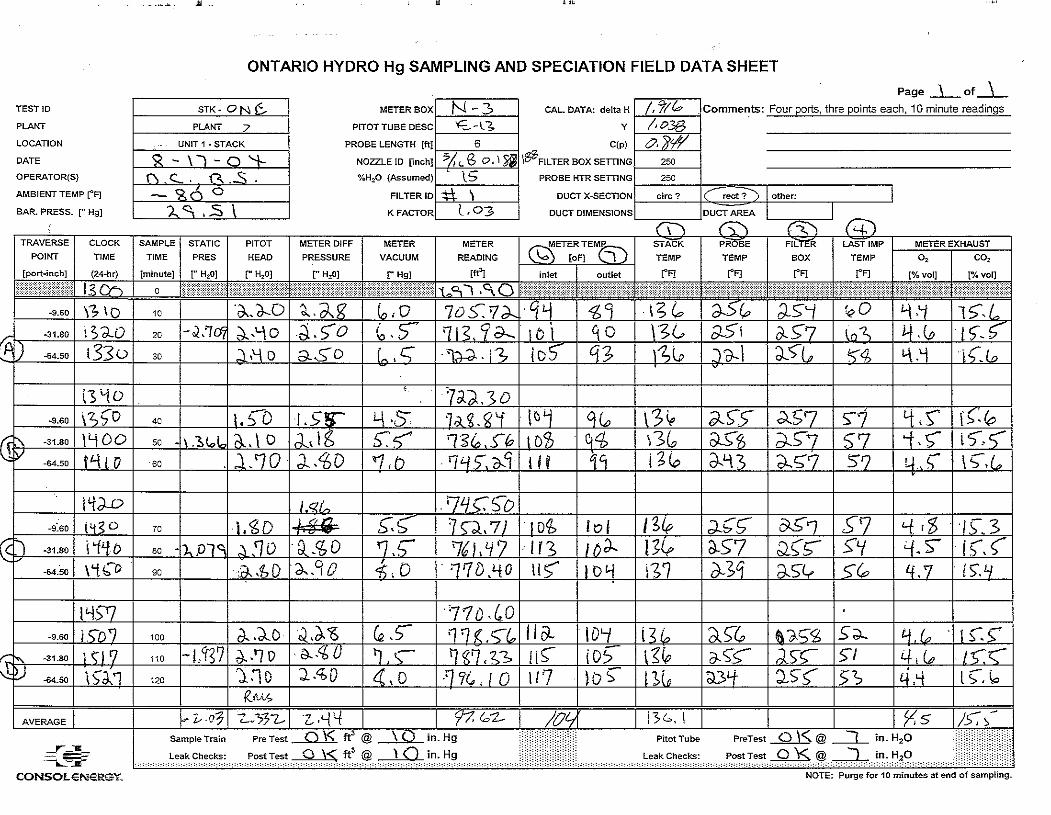
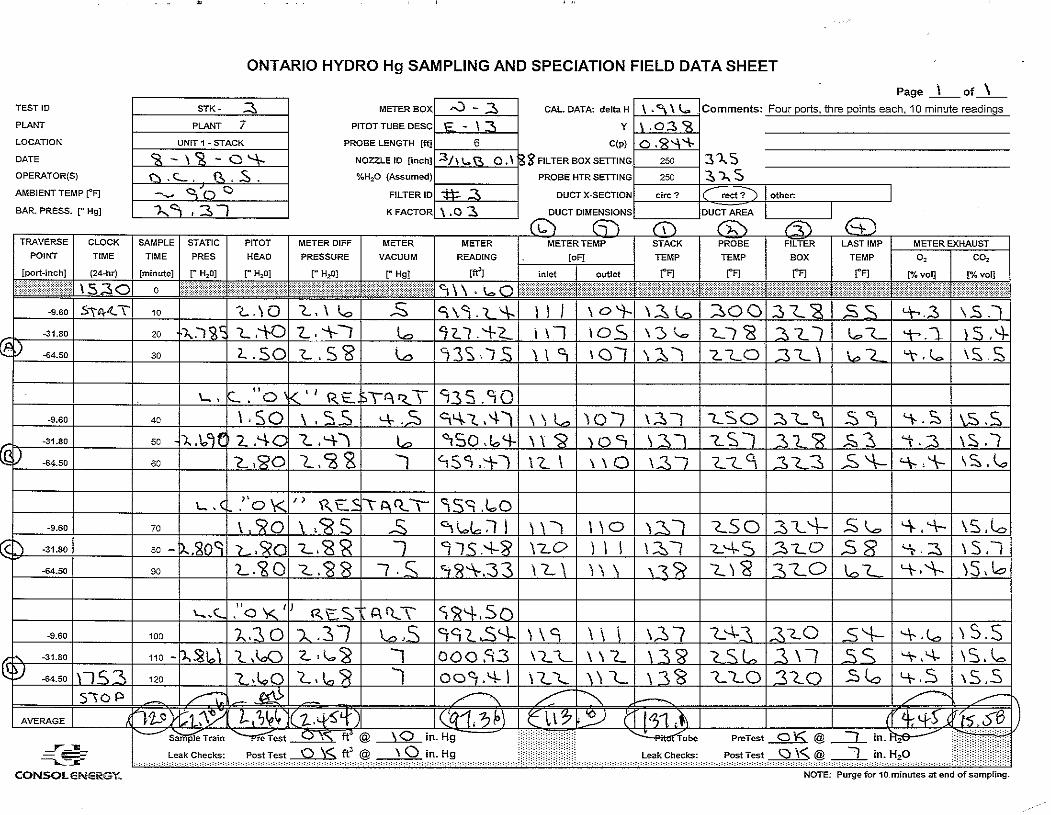
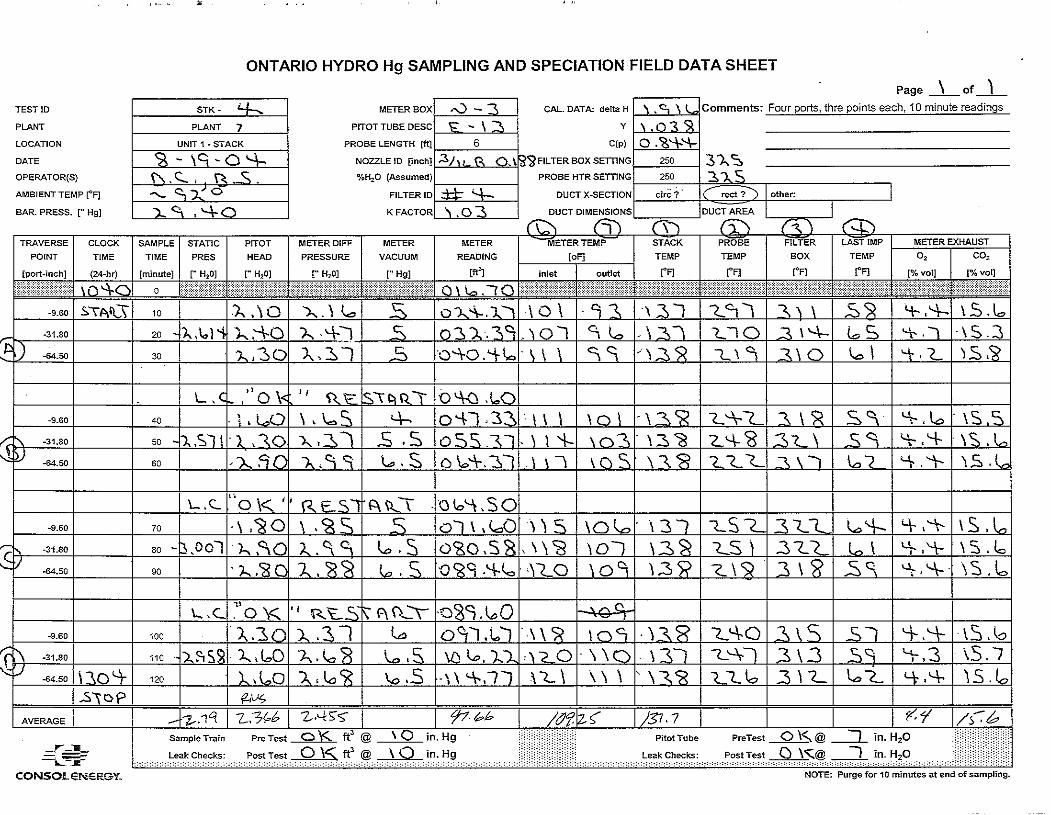
E. Stack The stack is approximately 18 feet in diameter. Three points were sampled in each of four sample access ports for a total of 12 traverse points. Each point was sampled for a period of 10 minutes resulting in 120 minute tests.

13
Preliminary pitot surveys conducted on August 16, 2004, indicated that the gas flow was axial. Mercury measurements were conducted with the nozzle oriented horizontally, directly into the flow. Four measurements were performed isokinetically at this location in August and four in November. A standard EPA Method 5 sample train configuration was utilized for this location. Figure 8 is a photograph of the mercury sampling train on the stack location.
II. Flue Gas Mercury Measurements
Flue gas mercury measurements were conducted using the Ontario-Hydro mercury speciation train. A schematic of the sampling train is shown in Figure 9.
The flue gas was extracted from the duct and pulled through a heated glass-lined probe and quartz filter. Total particulate matter mass loading was calculated from the solids collected prior to and on the filter. Probe temperatures were set at 325 ± 25 °F at the SCR inlet and outlet, the air heater outlet and the FGD inlet. Probe and filter temperatures were maintained at 250 ± 25 °F at the stack. Where particle loading is high, the probe and filter are maintained as close as practical to the flue gas temperature.
Mercury collected prior to and on the filter is assumed to be Hgpart. The flue gas exits the quartz filter and passes through a series of chilled impingers. The first three impingers are filled with 100 mL of a 1M-potassium chloride (KCl) solution. It is assumed that these impingers capture Hg++ in the flue gas. The next impinger is filled with 100 mL of a 5% nitric acid and 10% hydrogen peroxide (H2O2) solution. The purpose of this impinger is to remove SO2 from the flue gas to preserve the oxidizing strength of the two downstream impingers with acidic potassium permanganate (KMnO4) solution. Mercury collected in this impinger is assumed to be Hg0. The next two impingers are filled with 100 mL of an acidic KMnO4 solution. It is assumed that these impingers capture Hg0. The next impinger is blank to catch any excess moisture. The gas exits the impinger train through a silica gel-filled impinger that removes the moisture from the flue gas. The mercury species collected by the Ontario-Hydro sampling train component are listed in Table 12.
Table 12. Mercury speciation by train component
Train Component Species Measured
Probe & Nozzle Rinse Hgpart
Quartz Filter Hgpart
KCl Impingers Hg++
HNO3/H2O2 Impinger Hg0
KMnO4 Impingers Hg0
HCl Rinse of KMnO4 Impingers Hg0

14
The absorbing solutions were made fresh daily. The impingers were charged and the sampling components were transported to the required locations. The sampling trains were assembled, pre-heated, and checked for pitot and sample line leaks as detailed in EPA Methods 2 and 5, respectively. After passing the leak-check procedure, the sampling probes were inserted into their respective ducts, in-stack filters were allowed to heat to stack temperature, and sampling was initiated. Leak checks were also performed during port changes.
Oxygen readings were monitored at the outlet of the sampling train using a Teledyne Model Max 5 portable analyzer (electrochemical O2 sensor). At the completion of the sampling period, the sample trains were checked for leaks, purged for 10 min, and then disassembled. The components were transported back to the lab trailer for recovery. The mercury concentration of the individual impinger solutions was determined by cold vapor atomic absorption (CVAA) as specified in the methodology. The concentration of mercury on the solids was determined by acid digestion followed by CVAA.
The amount of mercury collected in the impinger solutions was determined as outlined in EPA Method 29 and the Ontario-Hydro Draft Method. An aliquot of the impinger solution was acidified and the mercury is determined using cold vapor-atomic absorption spectroscopy. The atomic absorption spectrometer was calibrated with commercial mercury standard. The calibration was verified using NIST Standard Reference Materials (SRM) 1641D and 1633b. The calibration was reassessed periodically by analyzing a quality control standard. The instrument was recalibrated as required. Each sample matrix was analyzed as a set and an individual calibration curve was used for each set. Depending on sample type, selected samples were spiked with 2, 5, 10, or 15 ng/ml (ppb) of mercury and reanalyzed. Spike recovery must be within ±30% or the sample is diluted and reanalyzed. Selected samples were analyzed in duplicate. The duplicates must be within ±30% or the analyses are repeated.
Where sufficient solids were collected, particulate mercury was analyzed using a 0.5-1.0 gm ash sample with the direct combustion method (ASTM Method D6722). In cases where the particulate catch was low (primarily stack filters), the entire filter sample was digested with aqua-regia in pressure vessels prior to analysis by CVAA.
III. Coal Sampling and Analysis
A. Coal samples Plant personnel collected coal samples from coal feed bins in service. In the August test program,two 5-gallon coal samples were taken during each test, one at the start of the test and the second near the end of the test. The coal properties did not vary substantially from one sample to the next; therefore, in the November test program only one sample was taken during each test. Listed in Table 13 are the coal samples collected.

15
Table 13. List of coal samples Ozone Season Test No.
1 2 3 4
Sample Date 8/17/2004 8/18/2004 8/18/2004 8/19/2004
Sample I.D.
Coal-Start
of Test 1
Coal-End of
Test 1
Coal-Start
of Test 2
Coal- End of
Test 2
Coal-Start
of Test 3
Coal-End of
Test 3
Coal-Start
of Test 4
Coal-End of
Test 4Non-Ozone
Season Test No.
1 2 3
Sample Date 11/05/2004 11/05/2004 11/05/2004
Sample I.D. Coal-1 Coal-2 Coal-3
B. Results of analyses of coal samples
Coal samples were analyzed using a direct mercury analyzer following the procedures prescribed in ASTM Method D6722. Detailed analyses of the coal samples collected in each test are presented in Appendix D and the results are summarized in Tables 14 and 15. The coal mercury content increased between August and November. The mercury measured in the August coal samples ranged from 0.104 to 0.128 ppm and in the November coal samples ranged from 0.127 to 0.148 ppm.

16
Table 14. Coal sample analyses – ozone season samples
Sample Description Coal Start of Test #1
Coal End of Test #1
Coal Start of Test #2
Coal End of Test #2
Coal Start of Test #3
Coal End of Test #3
Coal Start of Test #4
Coal End of Test #4
Sample Date 08/17/2004 08/17/2004 08/18/2004 08/18/2004 08/18/2004 08/18/2004 08/19/2004 08/19/2004
Analytical No. 20044136 20044137 20044138 20044139 20044140 20044141 20044142 20044143
Total Moisture, as rec'd (%) 9.89 9.12 10.21 10.44 10.30 9.93 10.56 10.48
Moisture, as det'd (%) 6.19 6.17 6.36 6.28 6.07 6.13 6.36 6.20
VM (%, dry) 38.35 38.14 38.7 39.06 38.98 38.92 38.68 39.25
Ash (%, dry) 11.11 11.32 10.48 10.8 11.01 11.01 11.65 10.47
Carbon (%, dry) 71.33 71.28 71.48 71.25 71.65 69.93 71.02 71.63
Hydrogen (%, dry) 3.89 4.06 4.11 4.01 4.22 4.00 4.14 4.02
Nitrogen (%, dry) 1.81 1.85 1.86 1.88 1.85 1.86 1.77 1.94
Total Sulfur (%, dry) 3.23 3.23 3.67 3.80 3.53 3.69 3.62 3.64
HHV (Btu/Ib, dry) 12,774 12,759 12,808 12,783 12,795 12,740 12,606 12,810
Chlorine (%, dry) 0.02 0.02 0.01 0.01 0.01 0.01 0.01 0.01
Hg (ppm, as det'd) 0.104 0.128 0.118 0.117 0.112 0.117 0.106 0.105
Major Ash Elements (%, dry)SiO2 49.22 50.07 46.05 44.31 47.80 47.01 47.86 47.05Al2O3 23.45 23.39 21.38 20.91 21.98 22.12 22.22 21.21TiO2 1.10 1.09 0.99 0.97 1.04 1.00 1.00 0.97
Fe2O3 20.5 19.58 24.93 26.02 22.53 24.22 22.18 23.27
CaO 1.42 1.33 1.55 1.96 1.48 1.23 1.79 1.95
MgO 0.93 0.92 0.88 0.86 0.96 0.96 1.02 0.89Na2O 0.32 0.3 0.29 0.32 0.28 0.28 0.32 0.28K2O 2.88 2.88 2.63 2.57 2.79 3.05 3.18 2.89P2O5 0.26 0.24 0.25 0.23 0.24 0.26 0.24 0.23SO3 1.36 1.31 1.46 1.98 1.52 1.08 1.48 1.61

17
Table 15. Coal sample analyses – non-ozone season samples
Sample Description Coal -1 Coal-2 Coal-3Sample DateAnalytical No. 20045578 20045579 20045580
Total Moisture [%] 10.85 10.68 10.44 Moisture, as det'd [%] 3.22 3.20 3.37 VM [%, dry] 37.62 37.49 37.49 Ash [%, dry] 11.88 12.16 12.21 Total Carbon [%, dry] 71.59 71.69 71.06 Hydrogen [%, dry] 4.66 4.63 4.63 Nitrogen [%, dry] 1.54 1.56 1.57 Total Sulfur [%, dry] 3.63 3.73 3.67 Oxygen [%, dry], by difference 6.64 6.17 6.81 HHV [Btu/Ib, dry] 12,868 12,901 12,856 HHV [Btu/Ib, MAF] 14,603 14,687 14,644 Chlorine [%, dry] 0.062 0.056 0.052 Hg [ppm, as det'd] 0.127 0.144 0.148
Major Ash Elements [%, dry] SiO2 44.78 44.67 45.11 Al2O3 21.35 20.48 20.46 TiO2 0.98 0.99 0.99
Fe2O3 23.02 22.68 22.85 CaO 2.73 2.96 2.82 MgO 0.82 0.83 0.80 Na2O 0.47 0.43 0.43 K2O 2.67 2.48 2.38 P2O5 0.25 0.27 0.23 SO3 2.52 2.53 2.34
11/05/2004

18
IV. Process Sample Collection and Analysis CONSOL R&D and plant personnel collected samples of bottom ash, ESP hopper ash, limestone slurry, FGD slurry, HCOF slurry, HCUF slurry, ME wash water, and FGD makeup water. CONSOL R&D completed comprehensive analyses using a direct mercury analyzer and following prescribed in the procedures of ASTM Method D6722. Detailed results of the analyses of those process samples are presented in Appendix D.
A. Bottom ash
Plant operators collected the bottom ash samples from the sluice pipe. One sample was collected at the end of each test day. No bottom ash samples were obtained during the November testing. The samples were filtered to generate a filtrate and a solid residue (i.e., filter cake) before analysis. Listed in Tables 16a and 16b are the results of analyses of the bottom ash samples. The mercury in the solids ranged from 0.009 to 0.022 ppm; the mercury in the filtrate samples was below the detection limit of 1.0 µg/L.
Table 16a. Results of analyses of bottom ash filtered solids
Sample ID Bottom Ash Test#1 Bottom Ash Test 2&3 Bottom Ash Test #4
Sample Date 08/17/2004 08/18/2004 08/19/2004
Analytical No. 20044145 20044146 20044147
Residual moisture (%) 0.20 0.40 0.32
Ash (%, dry) 99.51 97.17 99.33
Carbon (%, dry) 1.00 3.26 1.08
Total Sulfur (%, dry) 0.13 0.68 0.28
Chlorine (%, dry) 0.041 0.066 0.053
Hg (ppm, as det'd) 0.009 0.022 0.007
Major Ash Elements (%, dry) SiO2 48.15 44.89 47.28 Al2O3 21.26 18.93 19.66 TiO2 1.03 0.91 0.96
Fe2O3 24.87 28.70 26.65
CaO 1.80 1.90 1.73
MgO 0.95 0.90 0.97 Na2O 0.27 0.25 0.24 K2O 2.31 2.11 2.37 P2O5 0.09 0.08 0.09 SO3 0.33 1.69 0.71

19
Table 16b. Results of analyses of bottom ash filtrate
Sample ID Bottom Ash Liquid Test 1
Bottom Ash Liquid Tests 2 & 3
Bottom Ash Liquid Test 4
Test No. 1 2 & 3 4
Sample Date 08/17/2004 08/18/2004 08/19/2004
Analytical No 20044240 20044241 20044242
Ca (µg/mL) 745 853 1110
Total Iron (µg/mL) < 0.05 < 0.05 < 0.05
Mg (µg/mL) 1,310 1,150 961
K (µg/mL) 85.2 74.6 77.2
Na (µg/mL) 210 184 182
Ammonia as NH3 (µg/mL) <10 < 10 < 10
Cl (µg/mL) 1,700 1,690 1,720
NO3 as N (µg/mL) < 10 < 10 < 10
SO4 (µg/mL) 5,110 4,580 4,280
Hg (µg/L) < 1.0 < 1.0 < 1.0
B. Limestone slurry
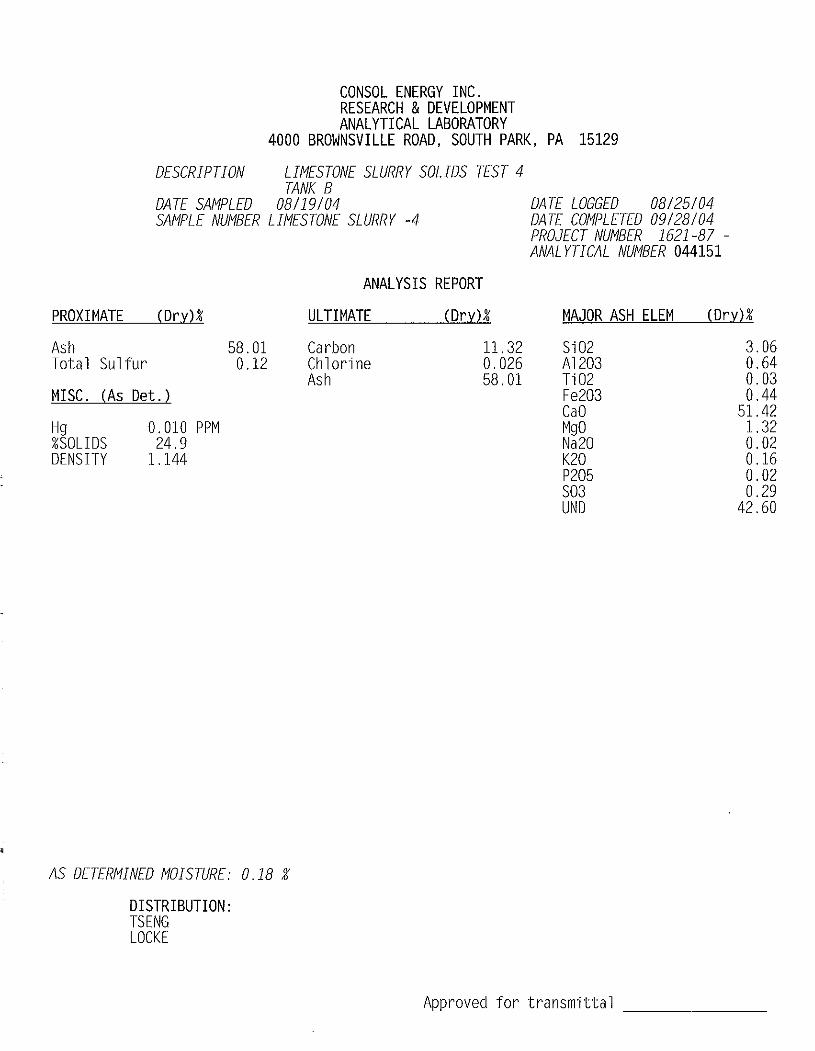
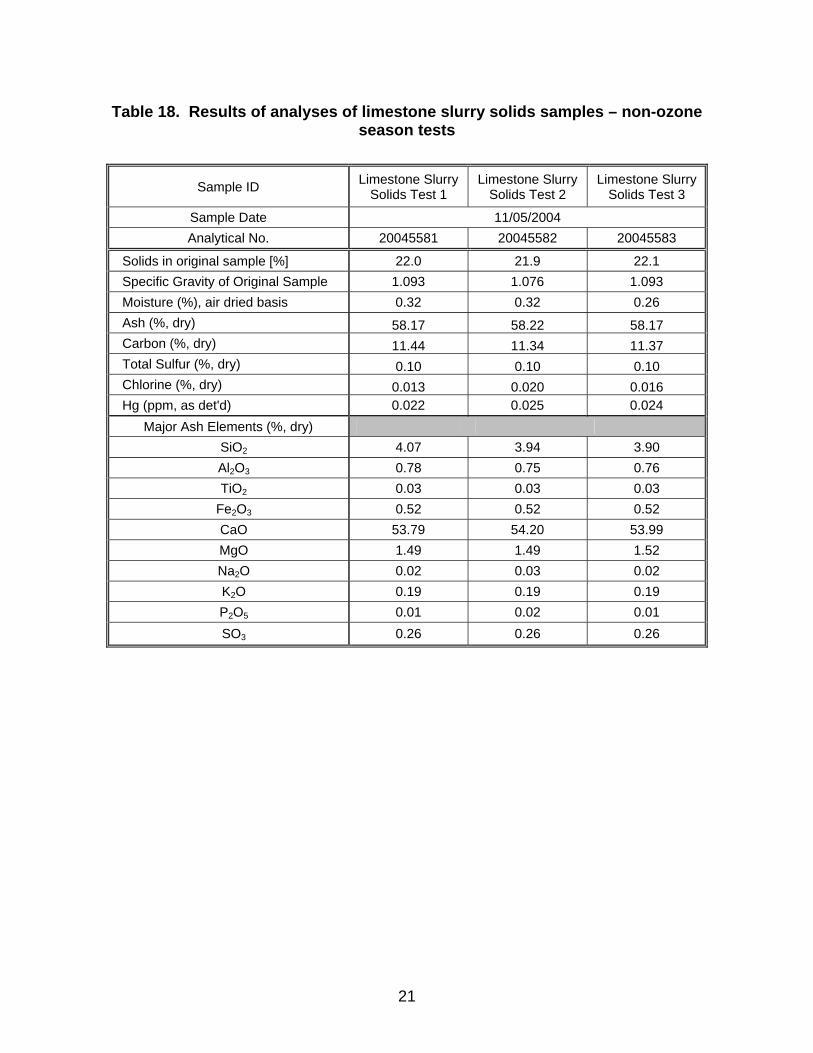
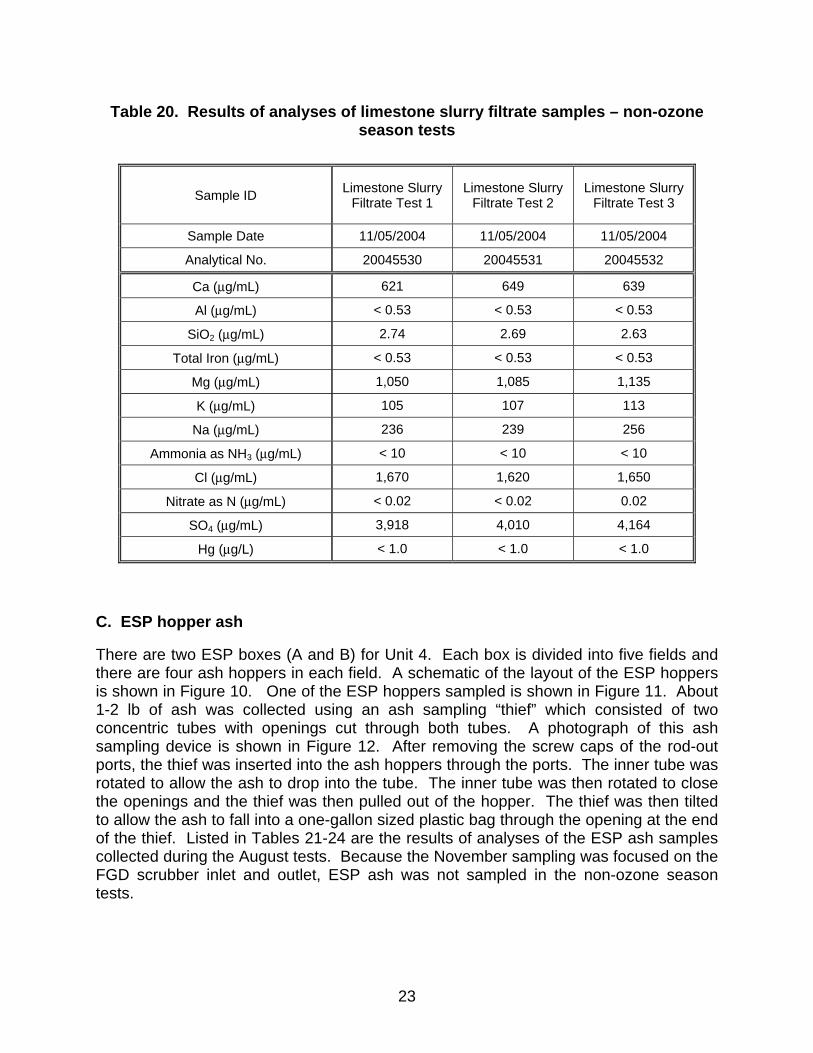
CONSOL R&D personnel collected a slurry sample of approximately 500 mL from each of the two limestone slurry storage tanks during each test in August. In the November test program, CONSOL R&D personnel collected a slurry sample of approximately 500 mL from the discharge side of Pump #B1 during each test since this was the only limestone stream running during these tests. Upon arrival at CONSOL R&D’s analytical labs, the limestone slurry samples were filtered to generate a filtrate and a solid residue (i.e., filter cake). The air-dried solids and the filtrates were analyzed separately. Listed in Table 17 and 18 are the results of analyses of the limestone slurry solids samples. Listed in Table 19 and 20 are the results of analyses of the limestone slurry filtrate samples.

20
Table 17. Results of analyses of limestone slurry solids samples – ozone season tests
Sample ID Limestone
Slurry Solids Test 1
Limestone Slurry Solids
Test 2
Limestone Slurry Solids
Test 3
Limestone Slurry Solids
Test 4
Sample Date 08/19/2004 08/19/2004 08/18/2004 08/19/2004
Analytical No. 20044148 20044149 20044150 20044151
Solids in original sample (%) 25.7 23.6 24.2 24.9 Density of Original Sample (g/mL) 1.144 1.144 1.157 1.144
Moisture (%) 0.16 0.25 0.10 0.18
Ash (%, dry) 58.36 58.30 58.15 58.01
Carbon (%, dry) 11.18 11.25 10.95 11.32
Chlorine (%, dry) 0.03 0.04 0.03 0.03
Hg (ppm, as det'd) 0.006 0.007 0.006 0.010
Major Ash Elements (%, dry)
SiO2 3.92 3.60 3.36 3.05
Al2O3 0.83 0.76 0.70 0.64
TiO2 0.03 0.03 0.03 0.03
Fe2O3 0.49 0.48 0.46 0.44
CaO 51.29 51.02 51.36 51.33
MgO 1.26 1.26 1.34 1.32
Na2O 0.02 0.01 0.01 0.02
K2O 0.20 0.18 0.18 0.16
P2O5 0.02 0.02 0.02 0.02
SO3 0.29 0.28 0.31 0.29
UND 41.65 42.36 42.23 42.70
21
Table 18. Results of analyses of limestone slurry solids samples – non-ozone season tests
Sample ID Limestone Slurry Solids Test 1
Limestone Slurry Solids Test 2
Limestone Slurry Solids Test 3
Sample Date 11/05/2004 Analytical No. 20045581 20045582 20045583
Solids in original sample [%] 22.0 21.9 22.1 Specific Gravity of Original Sample 1.093 1.076 1.093 Moisture (%), air dried basis 0.32 0.32 0.26 Ash (%, dry) 58.17 58.22 58.17 Carbon (%, dry) 11.44 11.34 11.37 Total Sulfur (%, dry) 0.10 0.10 0.10 Chlorine (%, dry) 0.013 0.020 0.016 Hg (ppm, as det'd) 0.022 0.025 0.024
Major Ash Elements (%, dry) SiO2 4.07 3.94 3.90 Al2O3 0.78 0.75 0.76 TiO2 0.03 0.03 0.03
Fe2O3 0.52 0.52 0.52 CaO 53.79 54.20 53.99 MgO 1.49 1.49 1.52 Na2O 0.02 0.03 0.02 K2O 0.19 0.19 0.19 P2O5 0.01 0.02 0.01 SO3 0.26 0.26 0.26

22
Table 19. Results of analyses of limestone slurry filtrate samples – ozone season tests
Sample ID Limestone
Slurry Liquid Test 1
Limestone Slurry Liquid
Test 2
Limestone Slurry Liquid
Test 3
Limestone Slurry Liquid
Test 4 Analytical No. 20044243 20044244 20044245 20044246
Ca (µg/mL) 671 684 722 696
Total Iron (µg/mL) 0.41 0.05 0.21 < 0.05
Mg (µg/mL) 1,120 1,130 1,140 1,130
K (µg/mL) 81.3 81.2 77.0 80.7
Na (µg/mL) 191 190 183 189
Ammonia as NH3 (µg/mL) < 10 < 10 < 10 < 10
Cl (µg/mL) 1,650 1,660 1,650 1,800 NO3 as N (µg/mL) < 10 < 10 < 10 < 10 SO4 (µg/mL) 4,290 4,340 4,380 4,360 Hg (µg/L) 3.8 < 1.0 < 1.0 < 1.0
23
Table 20. Results of analyses of limestone slurry filtrate samples – non-ozone season tests
Sample ID Limestone Slurry Filtrate Test 1
Limestone Slurry Filtrate Test 2
Limestone Slurry Filtrate Test 3
Sample Date 11/05/2004 11/05/2004 11/05/2004
Analytical No. 20045530 20045531 20045532
Ca (µg/mL) 621 649 639
Al (µg/mL) < 0.53 < 0.53 < 0.53
SiO2 (µg/mL) 2.74 2.69 2.63
Total Iron (µg/mL) < 0.53 < 0.53 < 0.53
Mg (µg/mL) 1,050 1,085 1,135
K (µg/mL) 105 107 113
Na (µg/mL) 236 239 256
Ammonia as NH3 (µg/mL) < 10 < 10 < 10
Cl (µg/mL) 1,670 1,620 1,650
Nitrate as N (µg/mL) < 0.02 < 0.02 0.02
SO4 (µg/mL) 3,918 4,010 4,164
Hg (µg/L) < 1.0 < 1.0 < 1.0
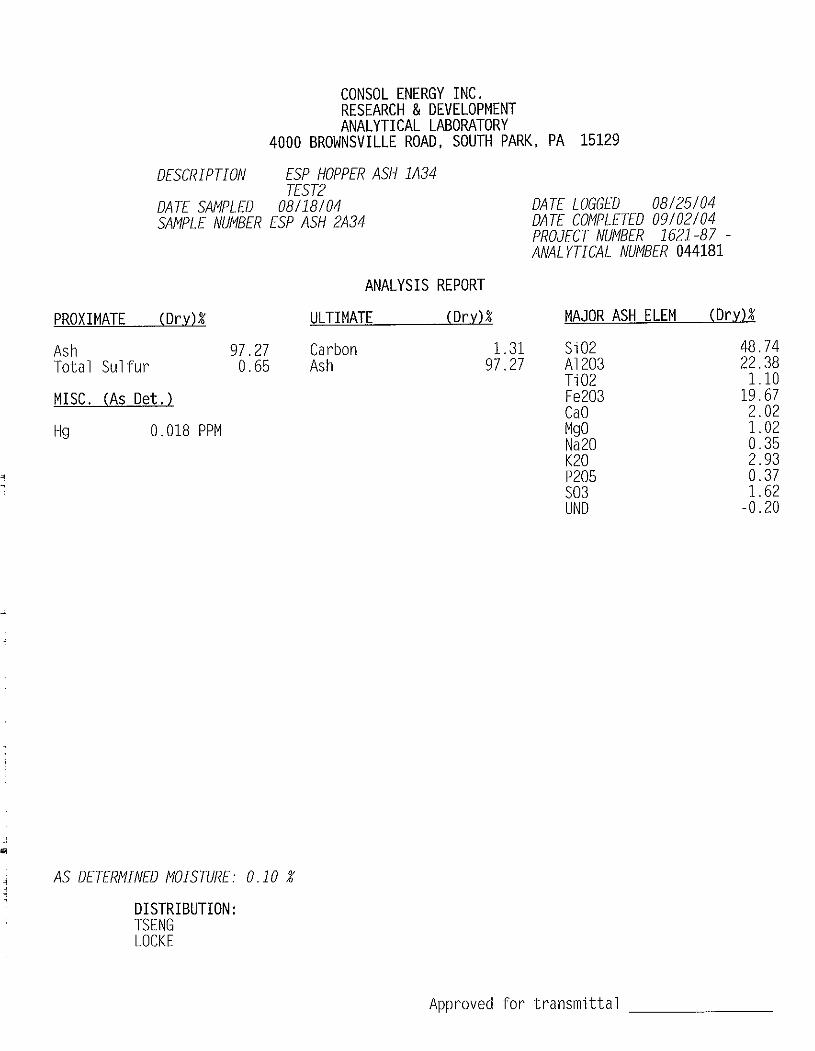
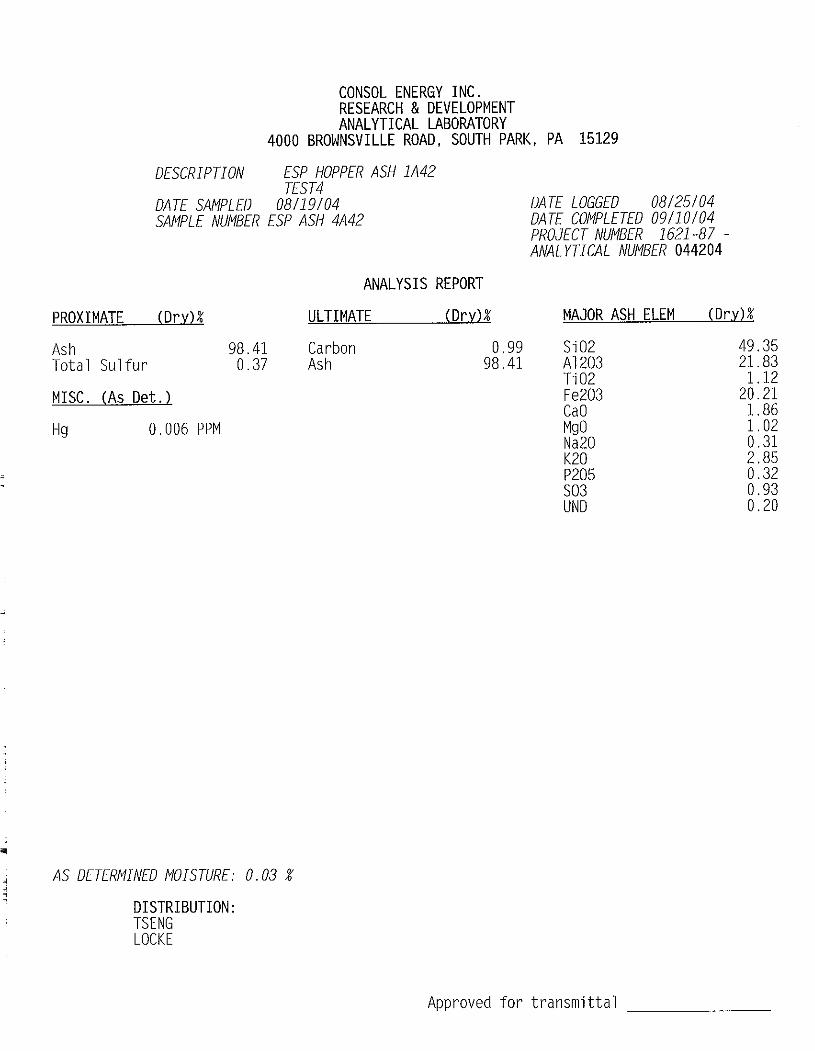
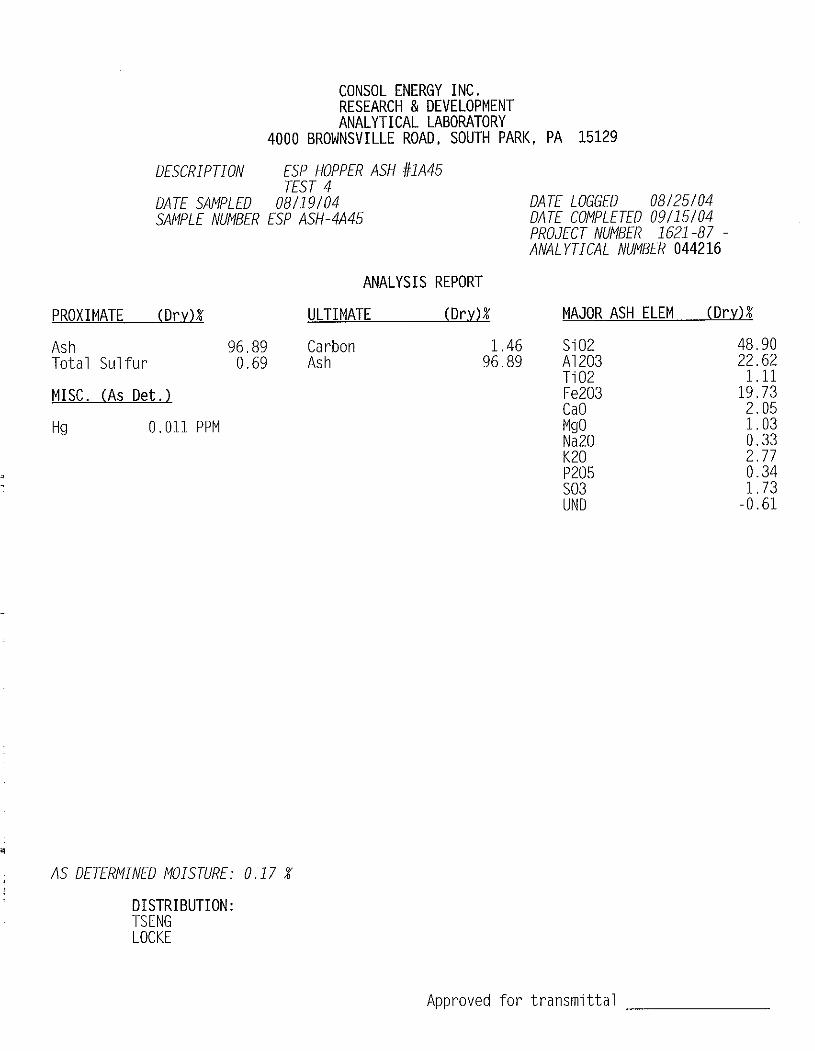
C. ESP hopper ash
There are two ESP boxes (A and B) for Unit 4. Each box is divided into five fields and there are four ash hoppers in each field. A schematic of the layout of the ESP hoppers is shown in Figure 10. One of the ESP hoppers sampled is shown in Figure 11. About 1-2 lb of ash was collected using an ash sampling “thief” which consisted of two concentric tubes with openings cut through both tubes. A photograph of this ash sampling device is shown in Figure 12. After removing the screw caps of the rod-out ports, the thief was inserted into the ash hoppers through the ports. The inner tube was rotated to allow the ash to drop into the tube. The inner tube was then rotated to close the openings and the thief was then pulled out of the hopper. The thief was then tilted to allow the ash to fall into a one-gallon sized plastic bag through the opening at the end of the thief. Listed in Tables 21-24 are the results of analyses of the ESP ash samples collected during the August tests. Because the November sampling was focused on the FGD scrubber inlet and outlet, ESP ash was not sampled in the non-ozone season tests.

24
In tests conducted at other plants, CONSOL R&D has observed that the mercury content in the ESP ash samples tend to correlate with the carbon content in the samples. In the tests at this plant, however, the correlation is not very strong. Figure 13 shows an R2 of only 0.56 for the linear regression line between ESP ash carbon concentration and mercury concentration. This is due to the low carbon content (<3 wt %) of the ESP ash combined with the relatively high ESP gas temperature (327 °F) compared with the other plants. Low carbon content tends to reduce the amount of mercury captured in the ESP ash, and high ESP gas temperature tends to reduce the amount of mercury captured by the carbon in the ash.
Table 21. Results of analyses of ESP hopper ash samples collected in Test 1
Sample ID ESP Ash 1A21
ESP Ash 1A31
ESP Ash 1A41
ESP Ash 1A22
ESP Ash 1A32
ESP Ash 1A42
ESP Hopper No. #1A21 #1A31 #1A41 #1A22 #1A32 #1A42
ESP Electric Field First Field Second Field
Sample Date 08/17/2004 08/17/2004
Analytical No. 20044161 20044162 20044163 20044164 20044165 20044166
Moisture (%) 0.08 0.02 0.05 0.04 0.04 0.05
Ash (%, dry) 98.91 98.78 98.83 98.59 98.38 98.37
Carbon (%, dry) 0.77 0.80 0.81 0.84 0.96 0.84
Total Sulfur (%, dry) 0.28 0.28 0.35 0.37 0.41 0.44
Hg (ppm, as det'd) 0.017 0.008 0.008 0.022 0.015 0.007 Major Ash Elements (%,
dry)
SiO2 49.17 48.72 49.54 48.94 48.89 49.13 Al2O3 23.71 23.05 23.38 23.94 23.89 24.04 TiO2 1.14 1.12 1.13 1.12 1.12 1.14
Fe2O3 20.56 20.77 19.72 19.77 19.41 18.59 CaO 1.84 1.84 2.08 1.96 2.05 1.91 MgO 0.99 0.99 1.04 1.01 1.04 1.05 Na2O 0.35 0.32 0.44 0.42 0.42 0.42 K2O 2.87 2.74 2.83 2.90 3.00 3.08 P2O5 0.23 0.24 0.28 0.30 0.29 0.31 SO3 0.69 0.69 0.87 0.93 1.02 1.09

25
Table 21. (Continued)
Sample ID ESP Ash 1A33
ESP Ash 1A43
ESP Ash 1A34
ESP Ash 1A44
ESP Ash 1A35
ESP Ash 1A45
ESP Hopper No. #1A33 #1A43 #1A34 #1A44 #1A35 #1A45
ESP Electric Field Third Field Fourth Field Fifth Field
Sample Date 08/17/2004 08/17/2004 08/17/2004
Analytical No. 20044167 20044168 20044169 20044170 20044171 20044172
Moisture (%) 0.01 0.04 0.05 0.05 0.13 0.01
Ash (%, dry) 97.98 97.89 97.53 97.46 97.20 96.85
Carbon (%, dry) 1.09 1.07 1.21 1.26 2.13 1.49
Total Sulfur (%, dry) 0.50 0.52 0.60 0.62 0.25 0.82
Hg (ppm, as det'd) 0.015 0.009 0.024 0.016 0.081 0.022 Major Ash Elements (%,
dry)
SiO2 49.25 48.90 48.71 48.69 48.76 48.82 Al2O3 24.28 23.48 23.06 23.08 21.80 23.55 TiO2 1.15 1.13 1.12 1.12 1.00 1.13
Fe2O3 18.45 18.38 18.57 18.15 20.89 17.11 CaO 1.87 1.93 2.14 2.10 2.40 2.35 MgO 1.07 1.05 1.03 1.03 0.93 1.01 Na2O 0.39 0.38 0.39 0.40 0.30 0.43 K2O 3.09 2.85 2.79 2.76 2.39 2.73 P2O5 0.34 0.34 0.36 0.36 0.17 0.35 SO3 1.24 1.31 1.51 1.56 0.62 2.04

26
Table 22. Results of analyses of ESP hopper ash samples collected in Test 2
Sample ID ESP Ash 2A21
ESP Ash 2A31
ESP Ash 2A41
ESP Ash 2A22
ESP Ash 2A32
ESP Ash 2A42
ESP Hopper No. #1A21 #1A31 #1A41 #1A22 #1A32 #1A42
ESP Electric Field First Field Second Field
Sample Date 08/18/2004 08/18/2004
Analytical No. 20044173 20044174 20044175 20044176 20044177 20044178
Moisture (%) 0.02 0.16 0.07 0.01 0.04 0.15
Ash (%, dry) 98.76 98.71 98.88 98.40 98.12 98.36
Carbon (%, dry) 0.88 0.90 0.62 0.91 1.14 0.93
Total Sulfur (%, dry) 0.27 0.27 0.33 0.36 0.40 0.38
Hg (ppm, as det'd) 0.013 0.009 0.008 0.022 0.012 0.007
Major Ash Elements (%, dry)
SiO2 49.16 49.00 49.94 49.06 49.21 49.54
Al2O3 21.61 22.11 23.15 22.03 22.27 22.67
TiO2 1.09 1.10 1.14 1.10 1.11 1.13
Fe2O3 22.61 21.00 19.65 21.50 20.71 19.27
CaO 1.71 1.79 2.08 1.74 1.74 1.90
MgO 0.98 0.98 1.02 1.01 1.02 1.03
Na2O 0.29 0.32 0.44 0.30 0.31 0.36
K2O 2.69 2.82 2.90 2.87 2.98 2.90
P2O5 0.26 0.28 0.27 0.31 0.33 0.34
SO3 0.67 0.68 0.82 0.91 0.99 0.96

27
Table 22. (Continued)
Sample ID ESP Ash 2A33
ESP Ash 2A43
ESP Ash 2A34
ESP Ash 2A44
ESP Ash 2A35
ESP Ash 2A45
ESP Hopper No. #1A33 #1A43 #1A34 #1A44 #1A35 #1A45
ESP Electric Field Third Field Fourth Field Fifth Field
Sample Date 08/18/2004 08/18/2004 08/18/2004
Analytical No. 20044179 20044180 20044181 20044182 20044183 20044184
Moisture (%) 0.12 0.15 0.10 0.16 0.17 0.17
Ash (%, dry) 97.54 97.66 97.27 97.22 96.28 96.81
Carbon (%, dry) 1.33 1.14 1.31 1.24 2.30 1.60
Total Sulfur (%, dry) 0.50 0.57 0.65 0.71 0.24 0.70
Hg (ppm, as det'd) 0.014 0.009 0.018 0.016 0.145 0.018
Major Ash Elements (%, dry)
SiO2 48.98 48.88 48.74 48.73 47.61 48.26
Al2O3 22.35 22.41 22.38 22.54 20.54 22.09
TiO2 1.12 1.13 1.10 1.11 0.97 1.07
Fe2O3 19.79 19.58 19.67 19.10 25.25 19.37
CaO 1.81 1.86 2.02 1.97 2.24 2.20
MgO 1.03 1.03 1.02 1.02 0.90 0.98
Na2O 0.32 0.32 0.35 0.38 0.26 0.35
K2O 2.93 2.94 2.93 2.95 2.31 2.66
P2O5 0.37 0.37 0.37 0.38 0.17 0.32
SO3 1.24 1.42 1.62 1.77 0.60 1.76

28
Table 23. Results of analyses of ESP hopper ash samples collected in Test 3
Sample ID ESP Ash 3A21
ESP Ash 3A31
ESP Ash 3A41
ESP Ash 3A22
ESP Ash 3A32
ESP Ash 3A42
ESP Hopper No. #1A21 #1A31 #1A41 #1A22 #1A32 #1A42
ESP Electric Field First Field Second Field
Sample Date 08/18/2004 08/18/2004
Analytical No. 20044185 20044186 20044187 20044188 20044189 20044190
Moisture (%) 0.10 0.10 0.06 0.09 0.11 0.08
Ash (%, dry) 99.02 98.80 98.87 98.54 98.37 98.37
Carbon (%, dry) 0.78 0.85 0.65 0.93 1.00 0.98
Total Sulfur (%, dry) 0.28 0.30 0.33 0.38 0.40 0.42
Hg (ppm, as det'd) 0.013 0.007 0.008 0.016 0.011 0.007
Major Ash Elements (%, dry)
SiO2 48.77 49.38 49.98 48.82 49.10 49.31
Al2O3 22.33 22.20 23.21 22.11 22.42 22.61
TiO2 1.11 1.10 1.12 1.10 1.12 1.12
Fe2O3 21.76 21.68 19.10 21.49 21.14 19.88
CaO 2.19 1.87 2.10 2.16 2.01 1.94
MgO 0.97 0.98 1.02 0.98 1.01 1.02
Na2O 0.32 0.33 0.43 0.32 0.33 0.35
K2O 2.76 2.92 2.89 2.87 2.87 2.98
P2O5 0.21 0.24 0.26 0.27 0.28 0.31
SO3 0.71 0.76 0.83 0.95 1.00 1.06

29
Table 23. (Continued)
Sample ID ESP Ash 3A33
ESP Ash 3A43
ESP Ash 3A34
ESP Ash 3A44
ESP Ash 3A35
ESP Ash 3A45
ESP Hopper No. #1A33 #1A43 #1A34 #1A44 #1A35 #1A45
ESP Electric Field Third Field Fourth Field Fifth Field
Sample Date 08/18/2004 08/18/2004 08/18/2004
Analytical No. 20044191 20044192 20044193 20044194 20044195 20044196
Moisture (%) 0.09 0.12 0.13 0.18 0.11 0.09
Ash (%, dry) 97.80 97.71 97.40 97.32 97.20 96.84
Carbon (%, dry) 1.19 1.17 1.31 1.21 2.05 1.28
Total Sulfur (%, dry) 0.51 0.58 0.63 0.68 0.43 0.87
Hg (ppm, as det'd) 0.012 0.009 0.020 0.016 0.040 0.010
Major Ash Elements (%, dry)
SiO2 49.26 49.39 49.04 48.84 48.63 48.67
Al2O3 23.11 22.96 22.88 22.73 21.83 22.98
TiO2 1.12 1.12 1.11 1.11 1.02 1.11
Fe2O3 19.44 19.33 19.03 18.90 21.17 18.23
CaO 1.84 1.80 1.95 1.97 2.14 2.12
MgO 1.03 1.03 1.02 1.03 0.95 1.01
Na2O 0.36 0.35 0.39 0.36 0.30 0.39
K2O 3.36 3.14 3.15 2.95 2.76 2.89
P2O5 0.33 0.36 0.35 0.35 0.21 0.36
SO3 1.28 1.46 1.57 1.69 1.08 2.18

30
Table 24. Results of analyses of ESP hopper ash samples collected in Test 4
Sample ID ESP Ash 4A11
ESP Ash 4A21
ESP Ash 4A31
ESP Ash 4A41
ESP Ash 4A12
ESP Ash 4A22
ESP Ash 4A32
ESP Ash 4A42
ESP Hopper No. #1A11 #1A21 #1A31 #1A41 #1A12 #1A22 #1A32 #1A42
ESP Electric Field First Field Second Field
Sample Date 08/19/2004 08/19/2004
Analytical No. 20044197 20044198 20044199 20044200 20044201 20044202 20044203 20044204
Moisture (%) 0.13 0.09 0.07 0.12 0.19 0.07 0.10 0.03
Ash (%, dry) 98.80 99.11 98.96 98.64 98.40 98.62 98.37 98.41
Carbon (%, dry) 0.75 0.74 0.83 0.77 0.99 0.90 1.05 0.99
Total Sulfur (%, dry) 0.28 0.21 0.25 0.36 0.39 0.33 0.37 0.37
Hg (ppm, as det'd) 0.016 0.013 0.005 0.006 0.022 0.018 0.011 0.006
Major Ash Elements (%, dry)
SiO2 50.18 49.75 49.93 48.66 49.85 48.74 49.31 49.35
Al2O3 21.95 21.85 21.51 21.42 22.20 21.28 21.48 21.83
TiO2 1.09 1.08 1.09 1.10 1.13 1.10 1.11 1.12
Fe2O3 20.50 22.06 22.05 21.65 19.76 21.10 20.60 20.21
CaO 1.79 1.70 1.78 2.02 1.77 1.88 1.85 1.86
MgO 1.01 0.99 0.97 0.97 1.04 1.00 1.02 1.02
Na2O 0.33 0.29 0.29 0.32 0.32 0.28 0.28 0.31
K2O 2.97 2.88 2.80 2.66 3.03 2.69 2.68 2.85
P2O5 0.26 0.21 0.20 0.24 0.34 0.27 0.32 0.32
SO3 0.69 0.53 0.62 0.91 0.98 0.82 0.92 0.93

31
Table 24. (Continued)
Sample ID ESP Ash 4A13
ESP Ash 4A23
ESP Ash 4A33
ESP Ash 4A43
ESP Ash 4A14
ESP Ash 4A24
ESP Ash 4A34
ESP Ash 4A44
ESP Hopper No. #1A13 #1A23 #1A33 #1A43 #1A14 #1A24 #1A34 #1A44
ESP Electric Field Third Field Fourth Field
Sample Date 08/19/2004 08/19/2004
Analytical No. 20044205 20044206 20044207 20044208 20044209 20044210 20044211 20044212
Moisture (%) 0.22 0.12 0.22 0.13 0.38 0.13 0.06 0.16
Ash (%, dry) 98.11 97.97 98.03 98.10 97.48 97.89 97.75 97.65
Carbon (%, dry) 0.87 1.16 1.02 0.98 1.25 1.37 1.12 1.14
Total Sulfur (%, dry) 0.53 0.46 0.48 0.49 0.58 0.42 0.56 0.60
Hg (ppm, as det'd) 0.029 0.025 0.012 0.008 0.038 0.032 0.014 0.011
Major Ash Elements (%, dry)
SiO2 49.92 49.00 48.80 48.75 48.66 48.37 49.26 48.44
Al2O3 22.62 21.90 21.81 21.64 22.45 21.77 23.01 22.37
TiO2 1.13 1.09 1.12 1.11 1.14 1.05 1.14 1.13
Fe2O3 17.64 20.08 19.53 18.89 19.89 21.97 19.57 19.33
CaO 1.99 1.90 1.95 1.87 1.95 1.94 1.87 1.88
MgO 1.06 1.02 1.02 1.03 1.03 0.99 1.07 1.07
Na2O 0.39 0.33 0.32 0.33 0.32 0.30 0.33 0.33
K2O 3.08 2.92 2.86 2.83 2.83 2.78 2.98 2.79
P2O5 0.39 0.34 0.35 0.35 0.36 0.26 0.38 0.38
SO3 1.32 1.15 1.19 1.22 1.45 1.04 1.41 1.49

32
Table 24. (Continued)
Sample ID ESP Ash 4A15
ESP Ash 4A25
ESP Ash 4A35
ESP Ash 4A45
ESP Hopper No. #1A15 #1A25 #1A35 #1A45 ESP Electric Field Fifth Field
Sample Date 08/19/2004 Analytical No. 20044213 20044214 20044215 20044216
Moisture (%) 0.34 0.14 0.17 0.17 Ash (%, dry) 96.72 97.44 96.83 96.89 Carbon (%, dry) 1.75 2.04 2.25 1.46 Total Sulfur (%, dry) 0.66 0.38 0.40 0.69 Hg (ppm, as det'd) 0.048 0.050 0.048 0.011 Major Ash Elements (%, dry)
SiO2 47.43 47.64 48.62 48.90 Al2O3 21.70 21.17 21.76 22.62 TiO2 1.11 1.02 1.04 1.11
Fe2O3 20.16 22.41 21.68 19.73 CaO 1.91 1.92 1.92 2.05 MgO 1.02 0.98 0.98 1.03 Na2O 0.32 0.28 0.27 0.33 K2O 2.93 2.67 2.65 2.77 P2O5 0.28 0.20 0.21 0.34 SO3 1.66 0.94 0.99 1.73

33
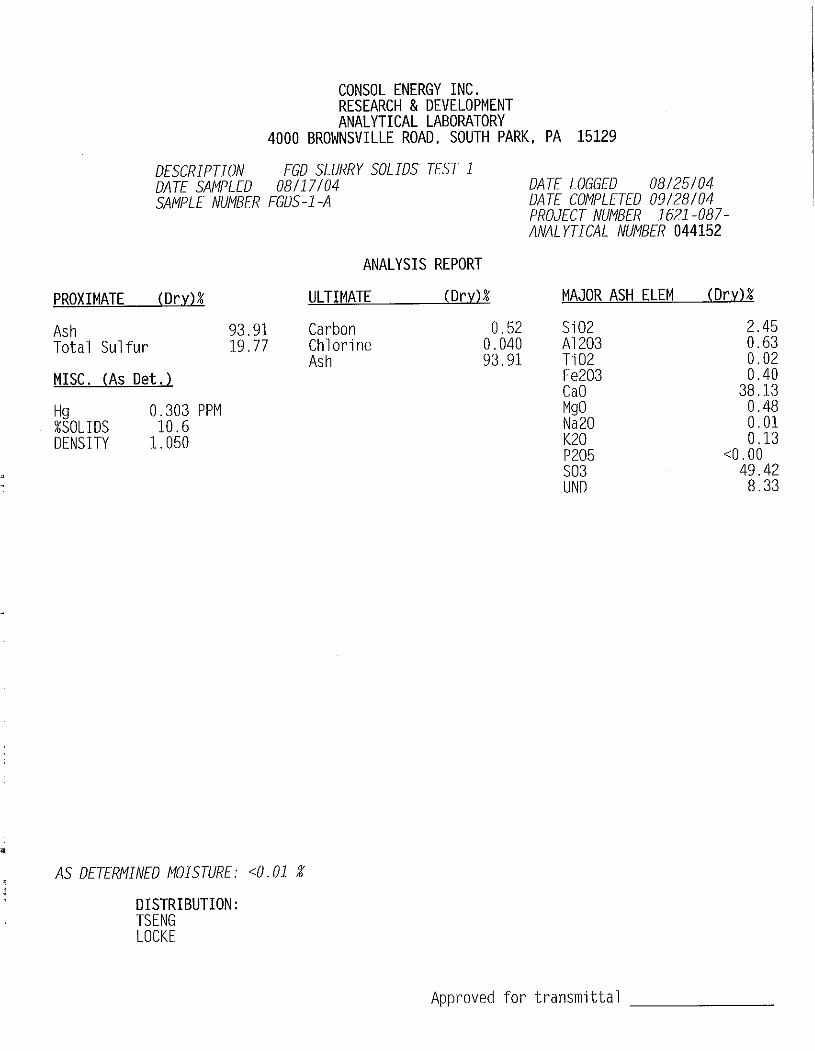
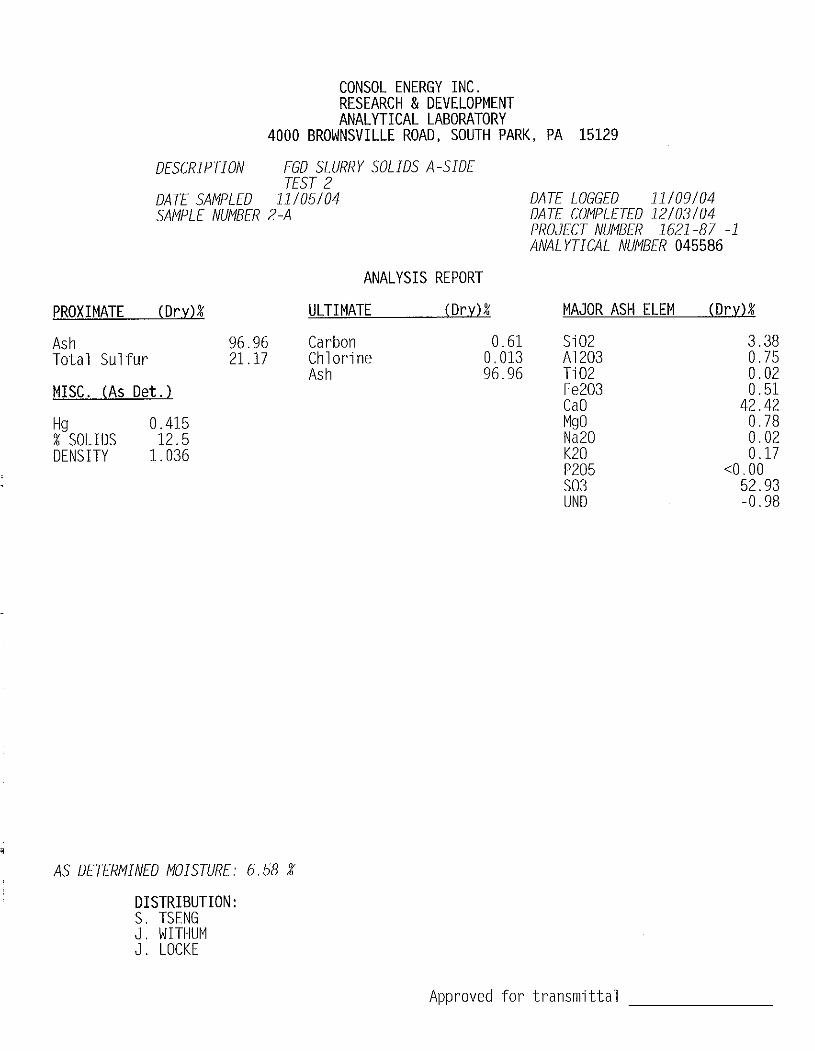
D. FGD slurry
This unit has two scrubber modules. A bleed stream of the liquor is pumped iinto an oxidizer, where the calcium sulfite rich liquor is oxidized into gypsum that is sold to a wallboard manufacturing plant.
The FGD slurry samples were collected from the transfer pipes connecting the recycle tanks to the oxidizers. The slurry sample was allowed to discharge from the pipe into a sink for about 20 seconds before a 500 mL of slurry sample was collected. Figure 14 is a picture of a transfer pipe and its corresponding sink.
Upon arrival at CONSOL R&D’s analytical lab, each slurry sample was filtered to generate a filtrate and a solid residue (i.e., filter cake) samples. The air-dried solids and the filtrates were analyzed separately. Listed in Tables 25 and 26 are the results of analyses of the FGD slurry solids samples. Listed in Tables 27 and 28 are the results of analyses of the limestone slurry filtrate samples.

34
Table 25. Results of analyses of FGD slurry solids samples – ozone season tests
Sample ID FGDS-1-A FGDS-1-B FGDS-2-A FGDS-2-B FGDS-3-A FGDS-3-B FGDS-4-A FGDS-4-B
Sample Date 08/17/2004 08/17/2004 08/18/2004 08/18/2004 08/18/2004 08/18/2004 08/19/2004 08/19/2004
Analytical No. 20044152 20044153 20044154 20044155 20044156 20044157 20044158 20044159
Solids in original sample (%) 10.60 10.20 9.10 9.60 10.80 10.70 11.00 10.43 Density of original sample (g/mL) 1.050 1.042 1.041 1.036 1.045 1.040 1.040 1.044
Moisture (%) 0.00 0.00 0.01 0.01 0.01 0.01 0.01 0.01
Ash (%, dry) 93.90 95.12 93.47 92.63 93.84 94.48 93.96 93.94
Carbon (%, dry) 0.52 0.39 0.37 0.45 0.50 0.37 0.46 0.47
Chlorine (%, dry) 0.04 0.02 0.02 0.02 0.02 0.02 0.02 0.02
Hg (ppm, as det'd) 0.303 0.312 0.190 0.274 0.424 0.413 0.231 0.385
Major Ash Elements (%, dry)
SiO2 2.45 3.00 2.34 2.94 2.13 1.74 1.56 1.69
Al2O3 0.63 0.84 0.66 0.85 0.58 0.49 0.44 0.47
TiO2 0.02 0.03 0.03 0.03 0.02 0.02 0.02 0.02
Fe2O3 0.40 0.54 0.39 0.48 0.38 0.32 0.31 0.33
CaO 38.13 38.51 37.87 38.09 39.02 38.70 39.00 39.03
MgO 0.48 0.56 0.44 0.53 0.40 0.35 0.33 0.36
Na2O 0.01 0.01 0.01 0 0 0 0 0
K2O 0.13 0.17 0.14 0.16 0.12 0.11 0.09 0.10
P2O5 0 0 0 0 0 0 0 0
SO3 49.42 49.45 49.25 49.14 50.65 50.57 51.16 50.99

35
Table 26. Results of analyses of FGD slurry solids samples – non-ozone season tests
Sample ID FGDS-1-A FGDS-1-B FGDS-2-A FGDS-2-B FGDS-3-A FGDS-3-B Sample Date 11/05/2004
Test No. 1 2 3 Analytical No. 20045584 20045585 20045586 20045587 20045588 20045589
Solids in original sample [%] 13.2 13.3 12.5 7.0 13.3 15.0 Specific Gravity of original sample [g/cc] 1.061 1.046 1.036 1.030 1.021 1.021 Moisture [%] 6.26 6.22 6.58 9.01 15.29 16.01 Ash [%, dry] 96.90 95.97 96.96 94.38 96.42 96.21 Carbon [%, dry] 0.59 0.83 0.61 1.22 0.54 0.73 Total Sulfur [%, dry] 21.53 20.91 21.17 18.92 21.36 21.32 Chlorine [%, dry] 0.020 0.014 0.013 0.015 0.011 0.006 Hg [ppm, as det'd] 0.322 0.246 0.415 0.506 0.355 0.229
Major Ash Elements [%, dry] SiO2 3.03 2.88 3.38 5.51 3.03 2.66 Al2O3 0.64 0.65 0.75 1.33 0.67 0.60 TiO2 0.02 0.02 0.02 0.05 0.02 0.02
Fe2O3 0.46 0.47 0.51 0.88 0.46 0.43 CaO 43.08 43.42 42.42 40.18 42.14 42.49 MgO 0.69 0.65 0.78 1.23 0.71 0.62 Na2O 0.02 0.02 0.02 0.03 0.01 0.01 K2O 0.15 0.13 0.17 0.27 0.15 0.12 P2O5 0.00 0.00 0.00 0.00 0.00 0.00 SO3 53.83 52.28 52.93 47.30 53.41 53.30

36
Table 27. Results of analyses of FGD slurry filtrate samples – ozone season tests
Sample ID FGD Slurry Filtrate-1-A
FGD Slurry Filtrate-1-B
FGD Slurry Filtrate-2-A
FGD Slurry Filtrate-2-B
FGD Slurry Filtrate-3-A
FGD Slurry Filtrate-3-B
FGD Slurry Filtrate-4-A
FGD Slurry Filtrate-4-B
Test No. 1 2 3 4
Sample Date 08/17/2004 08/18/2004 08/18/2004 08/19/2004
Analytical No. 20044247 20044248 20044249 20044250 20044251 20044252 20044253 20044254
Ca (µg/mL) 611 634 604 555 545 553 549 549
Total Iron (µg/mL) 0.44 0.54 0.45 0.81 1.10 1.28 1.16 1.14
Mg (µg/mL) 1,970 1,970 1,830 1,750 1,790 1,730 1,860 1,790
K (µg/mL) 114 105 127 124 124 120 138 134
Na (µg/mL) 264.0 253 283.0 279 277 270 304.0 296 Ammonia as NH3 (µg/mL) < 10 < 10 < 10 < 10 < 10 < 10 < 10 < 10
Cl (µg/mL) 2,800 2,800 2,700 2,700 2,700 2,650 2,750 2,750
NO3 as N (µg/mL) < 10 < 10 <10 <10 <10 <10 <10 <10
SO4 (µg/mL) 6,930 7,180 6,880 6,630 6,560 6,480 6,910 6,580
Hg (µg/L) 29.9 23.6 28.4 11.1 14.1 2.1 11.6 1.8

37
Table 28. Results of analyses of FGD slurry filtrate samples – non-ozone season tests
Sample ID
FGD Slurry Filtrate
Test 1-A
FGD Slurry Filtrate
Test 1-B
FGD Slurry Filtrate
Test 2-A
FGD Slurry Filtrate
Test 2-B
FGD Slurry Filtrate
Test 3-A
FGD Slurry Filtrate
Test 3-B Test No. 1 2 3
FGD Module ID A B A B A B
Sample Date 11/05/2004 11/05/2004 11/05/2004
Analytical No. 20045539 20045540 20045541 20045542 20045543 20045544
Ca (µg/mL) 594 651 626 654 636 599
Al (µg/mL) 0.94 0.96 1.34 1.24 1.23 1.09
SiO2 (µg/mL) 15.86 18.55 17.32 18.95 16.96 17.13
Total Iron (µg/mL) 0.57 < 0.53 1.30 < 0.53 1.64 < 0.53
Mg (µg/mL) 2,055 2,087 2,127 2,119 2,160 1,931
K (µg/mL) 159 160 155 161 159 148
Na (µg/mL) 336 341 332 346 339 316 Ammonia as NH3 (µg/mL) < 10 < 10 < 10 < 10 < 10 < 10
Cl (µg/mL) 3,340 3,150 3,340 3,220 3,320 3,180 Nitrate as N (µg/mL) 25.0 23.5 17.4 26.1 30.6 21.4 SO4 (µg/mL) 6,600 6,775 6,880 6,871 6,980 6,260 Hg (ng/mL) < 1.0 2.2 < 1.0 2.2 < 1.0 6.9

38
E. FGD makeup water
CONSOL R&D personnel collected an FGD makeup water sample of about 250 mL at the same time the FGD slurry sample was collected. Listed in Tables 29 and 30 are the results of analyses of the makeup water samples.
Table 29. Results of analyses of FGD makeup water samples – ozone season tests
Sample ID
FGD Makeup
Water Test 1
FGD Makeup
Water Test 2
FGD Makeup
Water Test 3
FGD Makeup
Water Test 4
Test No. 1 2 3 4
Sample Date 08/17/2004 08/18/2004 08/18/2004 08/19/2004
Analytical No 20044255 20044256 20044257 20044258
Ca (µg/mL) 683 601 584 582
Total Iron (µg/mL) 0.15 0.24 0.25 0.18
Mg (µg/mL) 1,310 1,150 1,240 1,230
K (µg/mL) 73 67 91 89
Na (µg/mL) 181 166 213 208 Ammonia as NH3 (µg/mL) <10 < 10 < 10 < 10
Cl (µg/mL) 1,850 1,850 1,950 1,900
NO3 as N (µg/mL) < 10 < 10 < 10 < 10
SO4 (µg/mL) 5,140 4,540 4,790 4,760
Hg (µg/L) < 1.0 < 1.0 1.3 < 1.0

39
Table 30 Results of analyses of FGD makeup water samples – non-ozone season tests
Sample ID FGD Makeup Water Test 1
FGD Makeup Water Test 2
FGD Makeup Water Test 3
Sample Date 11/05/2004 11/05/2004 11/05/2004
Analytical No. 20045536 20045537 20045538
Ca (µg/mL) 518 491 573
Al (µg/mL) 4.70 4.33 4.33
SiO2 (µg/mL) 9.59 8.83 9.52
Total Iron (µg/mL) < 0.53 < 0.53 < 0.53
Mg (µg/mL) 1,220 1,154 1,158
K (µg/mL) 113 109 102
Na (µg/mL) 251 242 221 Ammonia as NH3 (µg/mL) < 10 < 10 < 10
Cl (µg/mL) 1,720 1,720 1,720 Nitrate as N (µg/mL) 3.76 0.03 3.99 SO4 (µg/mL) 4,392 4,153 4,460 Hg (µg/L) < 1.0 < 1.0 1.1
F. ME wash water samples
The ME wash water was collected by CONSOL R&D personnel from the ME wash water storage tank. About 250 mL of sample was collected each time. Listed in Tables 31 and 32 are the results of analyses of the ME wash water samples. The concentration of mercury was below the detection limit of 1.0 µg/L for all of the samples.

40
Table 31. Results of analyses of ME wash water samples – ozone season tests.
Sample ID ME Wash
Water Test 1
ME Wash Water Test
2
ME Wash Water Test
3
ME Wash Water Test
4 Test No. 1 2 3 4
Sample Date 08/17/2004 08/18/2004 08/18/2004 08/19/2004
Analytical No 20044259 20044260 20044261 20044262
Ca (µg/mL) 40.5 40.0 40.1 40.0
Total Iron (µg/mL) < 0.05 0.21 < 0.05 < 0.05
Mg (µg/mL) 12.1 11.8 11.5 11.5
K (µg/mL) 3.83 3.82 3.67 3.66
Na (µg/mL) 29.9 30.7 29.1 29.3 Ammonia as NH3 (µg/mL) <10 < 10 < 10 < 10
Cl (µg/mL) 200 200 150 150
NO3 as N (µg/mL) < 10 < 10 < 10 < 10
SO4 (µg/mL) 68.0 65.9 64.6 64.3
Hg (µg/L) < 1.0 < 1.0 < 1.0 < 1.0

41
Table 32. Results of analyses of ME wash water samples – non-ozone season tests.
Sample ID ME Wash Water Test 1
ME Wash Water Test 2
ME Wash Water Test 3
Sample Date 11/05/2004 11/05/2004 11/05/2004
Analytical No. 20045533 20045534 20045535
Ca (µg/mL) 43.9 43.0 41.1
Al (µg/mL) < 0.53 < 0.53 < 0.53
SiO2 (µg/mL) 2.79 3.29 2.54
Total Iron (µg/mL) < 0.53 0.93 < 0.53
Mg (µg/mL) 12.4 11.7 12.5
K (µg/mL) < 5.35 < 5.35 < 5.35
Na (µg/mL) 13.7 14.1 14.2
Ammonia as NH3 (µg/mL) < 10 < 10 < 10
Cl (µg/mL) 15.0 14.0 10.0
Nitrate as N (µg/mL) 0.02 0.02 0.67
SO4 (µg/mL) 56.1 53.5 55.4
Hg (µg/L) < 1.0 < 1.0 < 1.0

42
QUALITY ASSURANCE/QUALITY CONTROL
The sampling and analysis QA/QC procedures are described below.
• Personnel specifically trained and experienced in power plant sampling methods, including the Ontario-Hydro mercury sampling method, conducted all sampling,
• The sampling equipment was maintained and calibrated as required,
• Consistent sample preparation and recovery procedures were used,
• Samples were logged and tracked under the direction of sample team Group Leader,
• Individual calibration curves were developed for each sample matrix,
• NIST Standard Reference Material (SRM) and lab QC samples were analyzed to verify calibration curves,
• Duplicates of selected samples were analyzed to assure repeatability,
• Analyses of selected “spiked” samples were analyzed to assure sample recovery, and
• Interim data were reviewed to assure sample completeness.
All samples were obtained using the procedures described in EPA Method 5 and the Ontario-Hydro mercury speciation draft method. Data were recorded on standard forms, which are included in Appendix A. The field data were reduced using standard “in-house” spreadsheets. Copies of the summary sheets are included in Appendix A. To assure consistency, all of the Ontario-Hydro train components were prepared and recovered under the supervision of a senior technician experienced in the Ontario-Hydro mercury speciation lab techniques. Copies of the recovery sheets are included in Appendix C.
The Ontario-Hydro sampling train analysis consisted of eight sub-samples. Each sub-sample analysis consisted of developing a calibration curve (absorbance versus mercury concentration in solution), checks of field and lab blanks, calibration checks against SRM and lab standards, selected duplicates and selected sample spikes. The laboratory summaries for each of these runs are contained in Appendix C.
A total of 207 individual Ontario-Hydro mercury determinations were completed, including 14 blank samples, 28 NIST SRM or lab QC checks, 11 sample spikes, and 11 duplicate analyses.
I. Blank Samples
A total of 9 blank liquid samples were analyzed. The blank values were all below the detection limit of the analysis method (<0.2 ng/mL for all sample matrices except KMnO4 acid rinse, which is <1.0 ng/mL). Consequently, in this report, blank concentrations were not subtracted out from any mercury determination.

43
II. NIST Standard Reference Material Checks
Twenty-eight NIST SRM checks were conducted throughout the mercury determinations. Two standards were used in the determinations as detailed in Table 33.
Table 33. NIST SRM analyses
NIST SRM
Standard Value
(ng/mL) Sample Fraction Samples
Analyzed
Average Result
(ng/mL)
Percent of
Standard
Standard Deviation (ng/mL)
Percent Relative Standard Deviation
Ontario Hydro Liquids 23 8.2 102.3 0.19 2.3
1641D 8.0 Ontario Hydro
Filters 4 8.2 102.3 0.096 1.2
1633b 141 Ontario Hydro Filters 1 141 100.0 -- --
III. Spike Sample Recoveries
A total of 11 samples were spiked with a 2 or 10 µg/L mercury standard and then re-analyzed to determine the percent spike recovery. The result of this QA/QC procedure was an average spike recovery of 94.7% recovery with a ±8.4% standard deviation.
IV. Duplicate Analyses
A total of 9 duplicate analyses were conducted periodically throughout the mercury determinations. The result of this QA/QC procedure was an average mercury determination that was within 12.0% of the original mercury determination, with a ±18.3% standard deviation. Two pairs of duplicate analyses were outside the QA/QC criterion of ±20% of the average value. These two samples were re-digested, re-spiked and the analyses repeated. Both samples passed the criterion after re-digestion. The results from the re-digested samples were used as the reported values. The average recovery for the 9 samples using the re-digested sample values instead of the original values within 6.7% recovery with a ±8.6% standard deviation.
V. Flue Gas Mercury Concentration Detection Limits
For liquid samples, the flue gas mercury concentration was calculated using the following equation:
[ ] ( )( )1000
/ 3
xVVxC
mgHggas
impimp=µ
where: Cimp = Mercury concentration of impinger solution [ ng/mL (ppb) ] Vimp = Liquid volume of impinger solution [ mL ] Vgas = Flue gas sample volume [ dry standard m3 ] 1000 = Conversion factor [1000 ng per µg ]

44
The flue gas mercury detection limit is reduced when the flue gas sample volume is increased or liquid volume of impinger solution is decreased. The CVAA is calibrated between 0 and 20 ng/mL. Over this range, the calibration curve between absorbance and concentration is linear. The lowest concentration standard used to develop the calibration curve is 0.500 ng/mL. In addition, the detection limit of the liquid CVAA analysis was <0.2 ng/mL for all samples except the HCl rinse of the KMnO4 impingers . The prescribed sampling and recovery procedures result in final liquid volumes varying between 55 and 839 mL. The volume of flue gas collected varied between 0.995 and 2.67 dscm. The sampling variables result in sample-specific flue gas detection limits. The flue gas mercury detection limit for each sample matrix is listed in Table 34. Depending on the matrix, the flue gas mercury detection limit ranged from 0.03 to 0.17 µg/m3.
Table 34. Flue gas mercury detection limits
Matrix Maximum Liquid Volume (mL)
Minimum Gas Volume (dscm)
Flue Gas Detection Limit
(µg/m3)
Probe Rinse 172 0.995 0.03
KCl Impinger 839 0.995 0.17
HNO3/H2O2 Impingers 193 0.995 0.04
KMnO4 Impingers 253 0.995 0.05
HCl Rinse 100 0.995 0.10 VI. Mercury Material Balance Closure One important criterion to gauge the overall quality of the tests is to conduct a mass balance to account for the mercury entering and leaving the plant during the time of the tests. The mercury material balance closure (expressed in %) is the total mercury output from the unit divided by the total mercury input. The total mercury input is the sum of the mass flow rates of mercury entering the unit from coal, limestone slurry, ME wash water, and FGD makeup water. The total mercury output is the sum of the mass flow rates of mercury leaving the unit through bottom ash, ESP hopper ash, FGD slurry, and stack flue gas. Because no bottom ash or ESP ash samples were collected in November, balance for the November tests is around the scrubber instead of the entire plant. In this case, the total mercury input is the sum of the mass flow rates of mercury entering the scrubber in the flue gas, limestone slurry, ME wash water, and FGD makeup water, and the total mercury output is the sum of the mass flow rates of mercury leaving the unit through the FGD slurry, and stack flue gas. Tables 35 and 36 summarize the results of the mercury material balance closure calculations. For the four tests conducted during ozone season, the calculated mercury material balance closures ranged from 78% to 85% with an average of 81%. For the three tests conducted during non-ozone season, the calculated mercury material balance closures ranged from 75% to 97% with an average of 87%. The mercury material balance
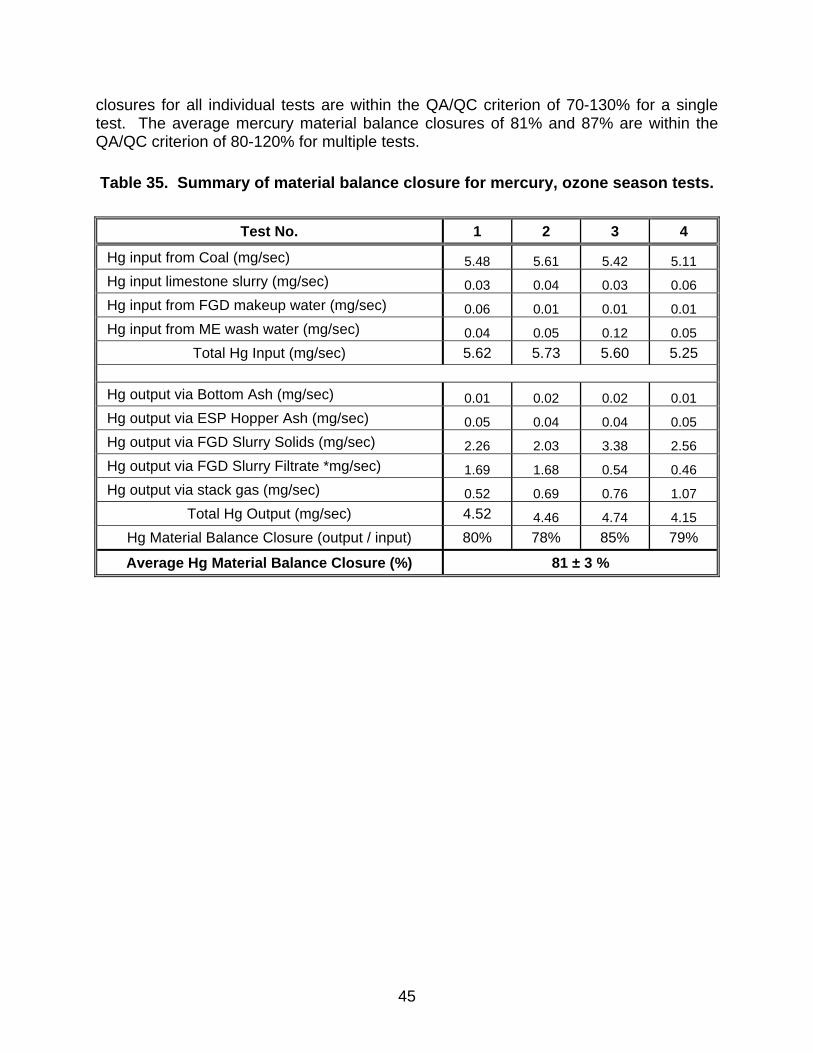
45
closures for all individual tests are within the QA/QC criterion of 70-130% for a single test. The average mercury material balance closures of 81% and 87% are within the QA/QC criterion of 80-120% for multiple tests.
Table 35. Summary of material balance closure for mercury, ozone season tests.
Test No. 1 2 3 4
Hg input from Coal (mg/sec) 5.48 5.61 5.42 5.11 Hg input limestone slurry (mg/sec) 0.03 0.04 0.03 0.06 Hg input from FGD makeup water (mg/sec) 0.06 0.01 0.01 0.01 Hg input from ME wash water (mg/sec) 0.04 0.05 0.12 0.05
Total Hg Input (mg/sec) 5.62 5.73 5.60 5.25 Hg output via Bottom Ash (mg/sec) 0.01 0.02 0.02 0.01 Hg output via ESP Hopper Ash (mg/sec) 0.05 0.04 0.04 0.05 Hg output via FGD Slurry Solids (mg/sec) 2.26 2.03 3.38 2.56 Hg output via FGD Slurry Filtrate *mg/sec) 1.69 1.68 0.54 0.46 Hg output via stack gas (mg/sec) 0.52 0.69 0.76 1.07
Total Hg Output (mg/sec) 4.52 4.46 4.74 4.15 Hg Material Balance Closure (output / input) 80% 78% 85% 79%
Average Hg Material Balance Closure (%) 81 ± 3 %

46
Table 36. Summary of material balance closure for mercury, non-ozone season tests.
Test No. 1 2 3
Hg input from flue gas at FGD inlet (mg/sec) 3.79 6.45 5.30 Hg input limestone slurry (mg/sec) 0.14 0.16 0.15 Hg input from FGD makeup water (mg/sec) 0.03 0.04 0.08 Hg input from ME wash water (mg/sec) 0.02 0.02 0.02
Total Hg Input (mg/sec) 3.97 6.66 5.56 Hg output via FGD Slurry Solids (mg/sec) 2.15 3.83 2.52 Hg output via FGD Slurry Filtrate *mg/sec) 0.07 0.10 0.19 Hg output via stack gas (mg/sec) 1.62 1.96 1.44
Total Hg Output (mg/sec) 3.84 5.90 4.16 Hg Material Balance Closure (output / input) 97% 89% 75%
Average Hg Material Balance Closure (%) 87 ± 11 % VII. Heat input-based mercury emission The heat input based mercury emission rates were calculated by using the Ontario-Hydro data and the heat input to the boiler, and the results are summarized in Table 37. The mercury emissions ranged from 1.70 to 2.27 Ib/TBtu with an average emission rate of 1.77 Ib/TBtu during the ozone season tests. The mercury emissions ranged from 2.01 to 3.11 Ib/TBtu with an average emission rate of 2.34 Ib/TBtu during the ozone season tests.

47
Table 37. Heat input-based mercury emission
Ozone Season Test No. 1 2 3 4
Stack Total Hg [µg/m3] 1.07 1.45 1.58 2.22
Stack Flow [DSCMM] 29,200 28,700 29,000 29,000
Stack Hg Flow [mg/sec] 0.52 0.69 0.76 1.07
Stack Hg Flow [Ib/hr] 4.14x 10⁻³ 5.48 x 10⁻³ 6.06 x 10⁻³ 8.49 x 10⁻³
Heat Input (MM Btu/Hr) 4,780 4,830 4,780 4,870
Stack Hg Emissions (Ib/TBtu) 0.87 1.14 1.27 1.75
Average Stack Hg Emissions (Ib/TBtu) 1.25
Non-ozone Season Test No. 1 2 3
Stack Total Hg [µg/m3] 3.45 4.09 2.93
Stack Flow [DSCMM] 28,200 28,800 29,500
Stack Hg Flow [mg/sec] 1.62 1.96 1.44
Stack Hg Flow [Ib/hr] 1.28x 10⁻² 1.55x 10⁻² 1.14x 10⁻²
Heat Input (MM Btu/Hr) 4,780 4,780 4,780
Stack Hg Emissions (Ib/TBtu) 2.68 3.25 2.39
Average Stack Hg Emissions (Ib/TBtu) 2.77

48
Figure 1. Mercury speciation by location, August 2004 tests (with SCR).
Plant 7 - No SCRMercury Speciation By Location
0
2
4
6
8
10
12
14
16
FGD-1 STK-1 FGD-2 STK-2 FGD-3 STK-3
Location / Test No.
Hg
( µg/
dscm
)
ElementalOxidizedParticulate
Figure 2. Mercury speciation by location, November 2004 tests (no SCR).
Plant 7 - SCR OperatingMercury Speciation By Location
0
2
4
6
8
10
12
14
16
18
SCRI-1
SCRO-1
AHO-1
FGD-1STK-1
SCRI-2
SCRO-2
AHO-2
FGD-2STK-2
SCRI-3
SCRO-3
AHO-3
FGD-3STK-3
SCRI-4
SCRO-4
AHO-4
FGD-4STK-4
Location / Test No.
Hg
( µg/
dscm
)
Elem. HgOx. HgPart. Hg

49
Figure 3. Process flow schematic and sampling locations
Air
Boiler
Air
ESP
Fan
Air Heater
Coal SCR Ammonia Storage
Evaporator
Stack
ID Fan
ESP Ash
Flue Gas Sample Point
Process Stream Sample
Bottom Ash
ME Wash Water
Limestone Slurry
FGD Slurry
Hydroclone
To FGD
Gypsum Plant
Oxidizer
Air
Makeup Water
Vent HCOF Slurry

50
Figure 4. SCR inlet mercury sampling train

51
Figure 5. SCR outlet mercury sampling train

52
Figure 6. Air heater outlet mercury sampling train

53
Figure 7. FGD inlet mercury sampling train

54
Figure 8. Stack sampling location

55
Figure 9. Ontario-Hydro sampling train schematic

56
Figure 10. Layout of ESP hoppers
1A41 1A31 1A21 1A11
1A42 1A32 1A22 1A12
1A43 1A33 1A23 1A13
1A44 1A34 1A24 1A14
1A45 1A35 1A25 1A15
Air Heater
FGD
B-side ESP Hoppers

57
Figure 11. ESP ash hopper sampling
Figure 12. Ash sampling thief

58
Figure 13. ESP ash mercury vs. carbon plot
Hg = 0.0416 * Carbon - 0.0277R2 = 0.56
0.00
0.03
0.06
0.09
0.12
0.15
0.0 0.5 1.0 1.5 2.0 2.5Carbon in ESP Ash (%)
Hg
in E
SP A
sh (p
pm)

59
Figure 14. FGD slurry sampling location