Us dep energy critical materials strategy
171
PREDECISIONAL December 9, 2010 DRAFT CRITICAL MATERIALS STRATEGY—NOT FOR PUBLIC RELEASE 1 December 2010
Transcript of Us dep energy critical materials strategy
PREDECISIONAL December 9, 2010
DRAFT CRITICAL MATERIALS STRATEGY—NOT FOR PUBLIC RELEASE 1
December 2010

CRITICAL MATERIALS STRATEGY 2

CRITICAL MATERIALS STRATEGY 3
Table of Contents
FOREWORD ............................................................................................................................................... 4
ACKNOWLEDGEMENTS .............................................................................................................................. 5
EXECUTIVE SUMMARY ............................................................................................................................... 6
CHAPTER 1. INTRODUCTION ..................................................................................................................... 10
CHAPTER 2. USE OF KEY MATERIALS IN CLEAN ENERGY TECHNOLOGIES ................................................... 14
CHAPTER 3. HISTORICAL SUPPLY, DEMAND AND PRICES FOR THE KEY MATERIALS .................................... 28
CHAPTER 4. CURRENT DOE PROGRAMS .................................................................................................... 54
CHAPTER 5. OTHER U.S. GOVERNMENT PROGRAMS ................................................................................. 59
CHAPTER 6. MATERIALS STRATEGIES FROM OTHER NATIONS ................................................................... 62
CHAPTER 7. SUPPLY AND DEMAND PROJECTIONS..................................................................................... 70
CHAPTER 8. CRITICALITY ASSESSMENT...................................................................................................... 96
CHAPTER 9. PROGRAM AND POLICY DIRECTIONS.................................................................................... 101
APPENDIX A: CRITICALITY ASSESSMENTS BY ELEMENT............................................................................ 112
APPENDIX B: MARKET SHARE ASSUMPTIONS AND MATERIAL CONTENT CALCULATION .......................... 128
APPENDIX C: 111TH CONGRESS RARE EARTHS AND CRITICAL MATERIALS LEGISLATION ............................ 135
APPENDIX D: TREM CONFERENCE 2010 ADDRESS – ASSISTANT SECRETARY DAVID SANDALOW .............. 141
APPENDIX E: U.S.–JAPAN ROUNDTABLE ON RARE EARTH ELEMENTS RESEARCH AND DEVELOPMENT FOR CLEAN ENERGY TECHNOLOGIES AGENDA ................................................................ 148
APPENDIX F: TRANS-ATLANTIC WORKSHOP ON RARE EARTH ELEMENTS AND OTHER CRITICAL MATERIALS FOR A CLEAN ENERGY FUTURE .............................................................................. 153
APPENDIX G: ARPA-E WORKSHOP AGENDA ............................................................................................ 161

CRITICAL MATERIALS STRATEGY 4
Foreword Each day, researchers, entrepreneurs and many others across the United States are working to develop and deploy the clean energy technologies that will enhance our security, reduce pollution and promote prosperity.
Many new and emerging clean energy technologies, such as the components of wind turbines and electric vehicles, depend on materials with unique properties. The availability of a number of these materials is at risk due to their location, vulnerability to supply disruptions and lack of suitable substitutes.
As part of the Department of Energy’s efforts to advance a clean energy economy, we have developed a Critical Materials Strategy to examine and address this challenge.
The Critical Materials Strategy builds on the Department’s previous work in this area and provides a foundation for future action. This Strategy is a first step toward a comprehensive response to the challenges before us. We hope it will also encourage others to engage in a dialogue about these issues and work together to achieve our Nation’s clean energy goals. Ensuring reliable access to critical materials will help the United States lead in the new clean energy economy.
Steven Chu Secretary of Energy December 2010

CRITICAL MATERIALS STRATEGY 5
Acknowledgements This report was drafted by the Office of Policy and International Affairs (PI) under the direction of Assistant Secretary David Sandalow. Principal authors were Diana Bauer, David Diamond, Jennifer Li, David Sandalow, Paul Telleen and Brent Wanner. Irving Mintzer of Mintzer Energy Group provided invaluable industry expertise, analytical insight and critical feedback. Michaelangelo Tabone (currently of University of California, Berkeley) provided extensive analytical support. Substantial contributions were made by a team of experts throughout the Department, particularly Mark Gielecki, Gwendolyn Jacobs, Tom Leckey and Fred Mayes of the Energy Information Administration; Steve Boyd, Tien Duong and Collin McCormick of the Office of Energy Efficiency and Renewable Energy; Mark Johnson of the Advanced Research Projects Agency-Energy; Linda Horton of the Office of Science; and Dave Schoeberlein and Jacqueline Zanders-Hubbard of PI. The effort benefitted from interagency input and feedback, particularly from the U.S. Geological Survey, U.S Department of Defense, White House Office of Science and Technology Policy and Council on Environmental Quality (CEQ). Other reviewers included Karl Gschneidner of Ames Laboratory and Rodd Eggert of Colorado School of Mines. The 35 respondents to a Request for Information (RFI) substantially added to our industrial insight. Navigant Consulting analyzed the RFI submissions. Energetics Incorporated provided editing services.

CRITICAL MATERIALS STRATEGY 6
Executive Summary This report examines the role of rare earth metals and other materials in the clean energy economy. It was prepared by the U.S. Department of Energy (DOE) based on data collected and research performed during 2010. Its main conclusions include:
• Several clean energy technologies—including wind turbines, electric vehicles, photovoltaic cells and fluorescent lighting—use materials at risk of supply disruptions in the short term. Those risks will generally decrease in the medium and long term.
• Clean energy technologies currently constitute about 20 percent of global consumption of critical materials. As clean energy technologies are deployed more widely in the decades ahead, their share of global consumption of critical materials will likely grow.
• Of the materials analyzed, five rare earth metals (dysprosium, neodymium, terbium, europium and yttrium), as well as indium, are assessed as most critical in the short term. For this purpose, “criticality” is a measure that combines importance to the clean energy economy and risk of supply disruption.
• Sound policies and strategic investments can reduce the risk of supply disruptions, especially in the medium and long term.
• Data with respect to many of the issues considered in this report are sparse.
In the report, DOE describes plans to (i) develop its first integrated research agenda addressing critical materials, building on three technical workshops convened by the Department during November and December 2010; (ii) strengthen its capacity for information-gathering on this topic; and (iii) work closely with international partners, including Japan and Europe, to reduce vulnerability to supply disruptions and address critical material needs. DOE will work with other stakeholders—including interagency colleagues, Congress and the public—to shape policy tools that strengthen the United States’ strategic capabilities. DOE also announces its plan to develop an updated critical materials strategy, based upon additional events and information, by the end of 2011.
DOE’s strategy with respect to critical materials rests on three pillars. First, diversified global supply chains are essential. To manage supply risk, multiple sources of materials are required. This means taking steps to facilitate extraction, processing and manufacturing here in the United States, as well as encouraging other nations to expedite alternative supplies. In all cases, extraction and processing should be done in an environmentally sound manner. Second, substitutes must be developed. Research leading to material and technology substitutes will improve flexibility and help meet the material needs of the clean energy economy. Third, recycling, reuse and more efficient use could significantly lower world demand for newly extracted materials. Research into recycling processes coupled with well-designed policies will help make recycling economically viable over time.
The scope of this report is limited. It does not address the material needs of the entire economy, the entire energy sector or even all clean energy technologies. Time and resource limitations precluded a comprehensive scope. Among the topics that merit additional research are the use of rare earth metals in catalytic converters and in petroleum refining. These topics are discussed briefly in Chapter 2.

CRITICAL MATERIALS STRATEGY 7
DOE welcomes comments on this report and, in particular, supplemental information that will enable the Department to refine its critical materials strategy over time. Comments and additional information can be sent to [email protected].
The structure of this report is as follows:
Chapter 1 provides a brief Introduction.
Chapter 2 reviews the supply chains of four components used in clean energy technologies:
• Permanent magnets (used in wind turbines and electric vehicles)
• Advanced batteries (used in electric vehicles)
• Thin-film semiconductors (used in photovoltaic power systems)
• Phosphors (used in high-efficiency lighting systems)
These components were selected for two reasons. First, the deployment of the clean energy technologies that use them is projected to increase, perhaps significantly, in the short, medium and long term. Second, each uses significant quantities of rare earth metals or other key materials.
Chapter 3 presents historical data on supply, demand and prices. Data is provided for 14 materials, including 9 rare earth elements (yttrium, lanthanum, cerium, praseodymium, neodymium, samarium, europium, terbium and dysprosium) as well as indium, gallium, tellurium, cobalt and lithium.
Chapters 4, 5 and 6 describe current programs related to critical materials within DOE, the rest of the federal government and other nations.
Chapter 7 presents supply and demand projections. Potential supply/demand mismatches are identified and shown graphically. Complexities that complicate market response to these mismatches are also discussed.
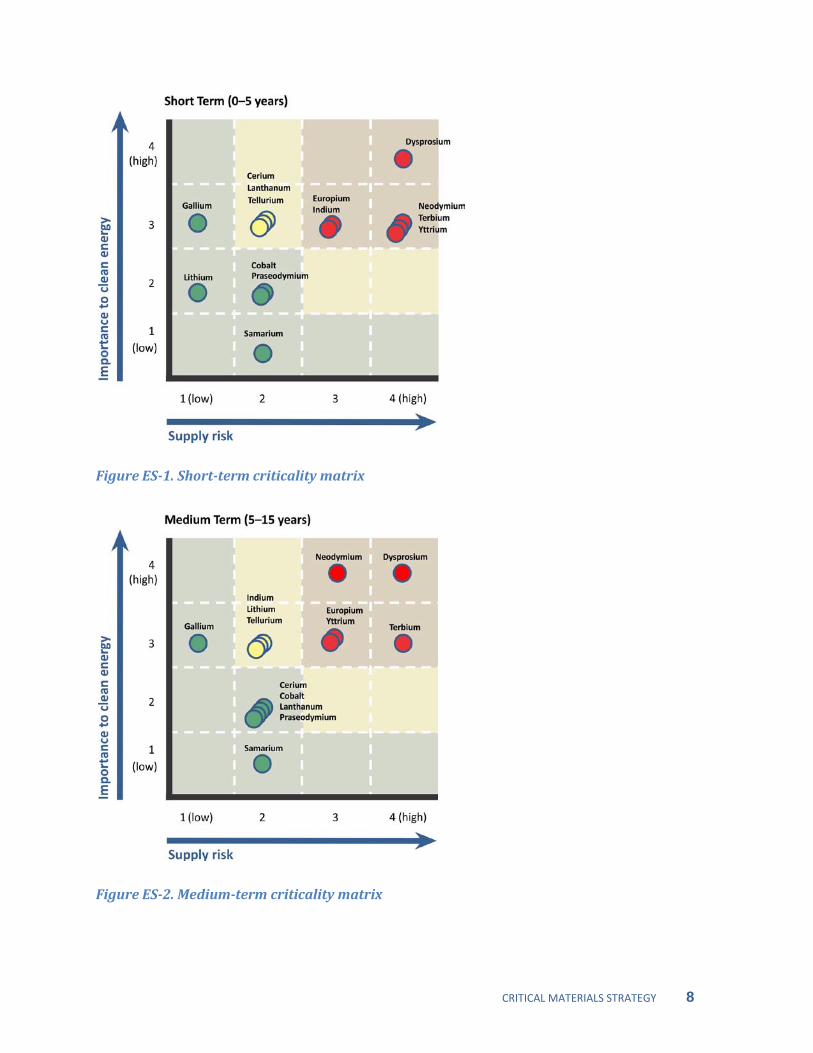
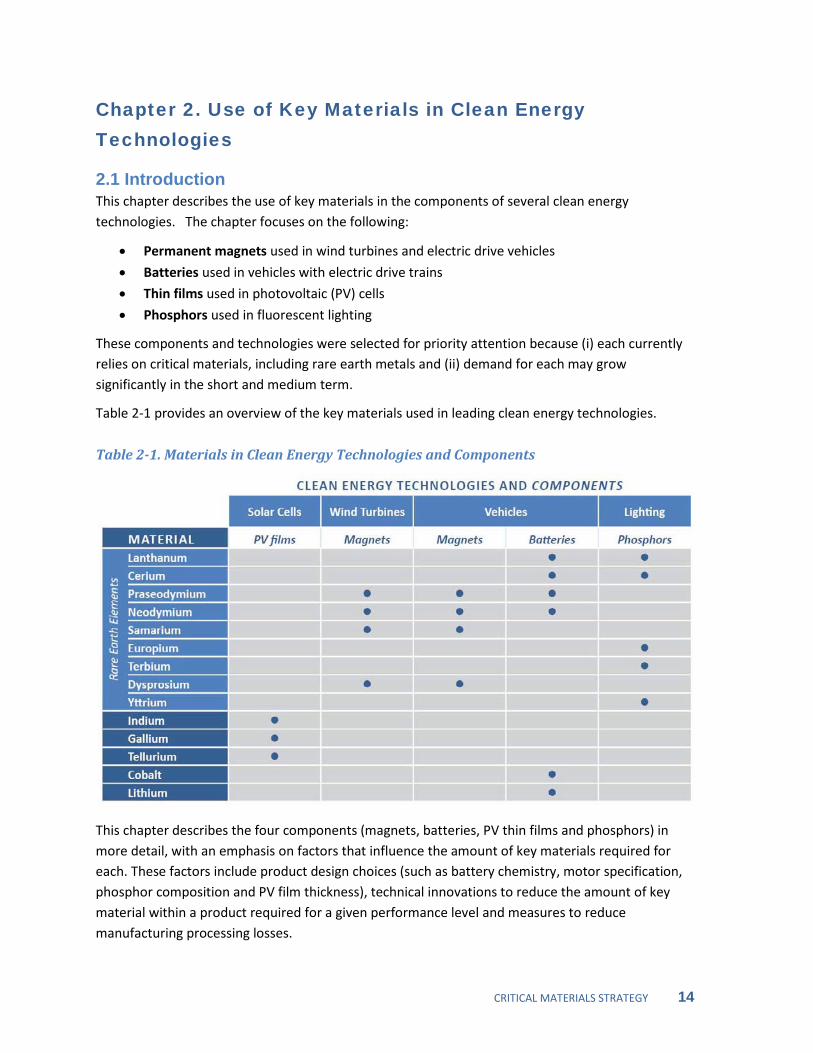
Chapter 8 presents “criticality assessments”— analyses that combine the importance of a material to the clean energy economy and supply risk with respect to that material. The analytical approach is adapted from a methodology developed by the National Academy of Sciences (NAS 2008). The analyses may be useful in priority-setting for research and other purposes. Applying this methodology to the materials listed above, terbium, neodymium, dysprosium, yttrium, europium and indium have greatest short-term “criticality” (Figure ES-1). All of these materials except indium remain critical in the medium term (Figure ES-2).
CRITICAL MATERIALS STRATEGY 8
Figure ES-1. Short-term criticality matrix
Figure ES-2. Medium-term criticality matrix

CRITICAL MATERIALS STRATEGY 9
Chapter 9 discusses program and policy directions. Eight broad categories are considered: (i) research and development, (ii) information gathering, (iii) permitting for domestic production, (iv) financial assistance for domestic production and processing, (v) stockpiling, (vi) recycling, (vii)
education and (viii) diplomacy. These programs and policies address risks, constraints and opportunities across the supply chain, as shown in Figure ES-3. DOE’s authorities and historic capabilities with respect to these categories vary widely. Some (such as research and development) relate to core competencies of DOE. Others (such as permitting for domestic production) concern topics on which DOE has no jurisdiction. With respect to research and development, topics identified for priority attention include rare earth substitutes in magnets, batteries, photovoltaics and lighting; environmentally sound mining and materials processing; and recycling. The chapter ends with a summary of recommendations.
Figure ES-3. Program and policy directions and the critical material supply chain
References NAS (National Academy of the Sciences). 2008. Minerals, Critical Minerals and the U.S. Economy.

CRITICAL MATERIALS STRATEGY 10
Chapter 1. Introduction This report examines the role of rare earth metals and other materials in the clean energy economy. The report focuses in particular on the role of key materials in renewable energy and energy-efficient technologies. Deployment of these technologies is expected to grow substantially in the years ahead. Yet many of these technologies—including wind turbines, electric vehicles, solar cells and energy-efficient lighting—depend on components often manufactured with these materials.
The U.S. Department of Energy (DOE) has worked on topics related to materials for many years. However, before 2010, that work was not coordinated across different DOE offices and programs. Accordingly, DOE has developed this report for the following purposes:
• Assess risks and opportunities
• Inform the public dialogue
• Identify possible program and policy directions
1.1 Scope of the Report This report addresses both the short- (0–5 years) and medium-term (5–15 years) deployment of wind turbines, electric vehicles, solar cells and energy-efficient lighting. These technologies were selected for two reasons. First, they are expected to be deployed substantially within the global clean energy economy over the next 15 years. Second, they use less common materials and could, through their deployment, substantially increase global demand for these materials.
The report focuses on a small number of illustrative scenarios, rather than developing an exhaustive set. Reference and policy-based scenarios are used to develop low and high plausible estimates for materials consumption over the short and medium term. International scenarios and roadmaps are used, with some attention to the U.S. dimension.
The scope of this report is limited. It does not address the material needs of the entire economy, the entire energy sector or even all clean energy technologies. Time and resource limitations precluded a comprehensive scope. Among the topics that merit additional research are the use of rare earth metals in catalytic converters and in petroleum refining. These topics are discussed briefly in Chapter 2.
1.2 Materials Analyzed Fourteen elements and related materials were selected for a criticality assessment within this report (Figure 1-1). Eight of these are rare earth metals, which are valued for their unique magnetic, optical and catalyst properties. The materials are used in clean energy technologies as follows. Lanthanum, cerium, praseodymium, neodymium, cobalt and lithium are used in electric vehicle batteries. Neodymium, praseodymium and dysprosium are used in magnets for electric vehicles and wind turbines. Samarium is also used in magnets. Lanthanum, cerium, europium, terbium and yttrium are used in phosphors for energy-efficient lighting. Indium, gallium and tellurium are used in solar cells. The materials were selected for study based on factors contributing to risk of supply disruption,

CRITICAL MATERIALS STRATEGY 11
including a small global market, lack of supply diversity, market complexities caused by coproduction and geopolitical risks.
While these materials are generally used in low volumes relative to other resources, the anticipated deployment of clean energy technologies will substantially increase worldwide demand. In some cases, clean energy technology demand could compete with a rising demand for these materials from other technology sectors.
Not all of the materials examined in the report are critical. Until a criticality assessment is presented in Chapter 8, the materials of interest examined in the report will be referred to as “key materials.”
Figure 1-1. Key materials within the periodic table of the elements
1.3 Supply Chain Framework Maintaining the availability of materials for clean energy is not simply a mining issue. Manufacturing processes across the full supply chain must also be considered.
The industrial supply chain in Figure 1-2 illustrates the steps by which materials are extracted from mines, processed and transformed into useful components or utilized in end-use applications. The specific industrial supply chain for each material and component varies, but in general it can be described by the generic supply chain. The supply chain provides a useful context in which to explore the technical, geopolitical, economic, environmental and intellectual property factors that

CRITICAL MATERIALS STRATEGY 12
impact the supply of these materials and the technologies that use them. In addition, a supply chain framework can inform where to target potential policy tools.
Figure 1-2. Basic materials supply chain
Elemental materials are extracted from the earth via mining. Next, they are processed via separation and refining to obtain the desired composition or purity. Materials may be extracted either as major products, where ore is directly processed to extract the key materials or they may be coproducts or byproducts of other mining operations. The coproduction and byproduction processes create complex relationships between the availability and extraction costs of different materials, which may cause supply curves and market prices to vary in ways not captured by simple supply and demand relationships.
Processed materials are used to manufacture component parts that are ultimately assembled into end-use technologies. The generic supply chain also shows the potential for recycling and reusing materials from finished applications, though materials can be reclaimed at any stage of the supply chain and reused either upstream or downstream.
1.4 Formulating a Strategy Current global materials markets pose several challenges to the growing clean energy economy. Lead times with respect to new mining operations are long (from 2–10 years). Thus, the supply response to scarcity may be slow, limiting production of technologies that depend on such mining operations or causing sharp price increases. In addition, production of some materials is at present heavily concentrated in one or a small number of countries. (More than 95% of current production capacity for rare earth metals is currently in China.) Concentration of production in any supplier creates risks for global markets and creates geopolitical dynamics with the potential to affect other strategic interests of the United States. Value-added processing and some patent rights are also concentrated in just a few countries, creating similar risks. For some materials, these factors are likely to lead to future material supply-demand mismatches. In many instances, the private sector market will likely respond to correct the imbalance. This report offers a number of policy and program directions to supplement market response where this is warranted.

CRITICAL MATERIALS STRATEGY 13
The approach to proactively address material supply risks and prevent supply chain disruptions, while building a robust clean energy economy, has three elements:
• Achieve globally diverse supplies
• Identify appropriate substitutes
• Improve our capacity for recycling, reuse and more efficient use of critical materials
This is the first in a series of critical materials strategies. DOE expects to update the Strategy regularly to reflect feedback received and changing circumstances and intends to issue an updated Critical Materials Strategy next year.
CRITICAL MATERIALS STRATEGY 14
Chapter 2. Use of Key Materials in Clean Energy Technologies
2.1 Introduction This chapter describes the use of key materials in the components of several clean energy technologies. The chapter focuses on the following:
• Permanent magnets used in wind turbines and electric drive vehicles
• Batteries used in vehicles with electric drive trains
• Thin films used in photovoltaic (PV) cells
• Phosphors used in fluorescent lighting
These components and technologies were selected for priority attention because (i) each currently relies on critical materials, including rare earth metals and (ii) demand for each may grow significantly in the short and medium term.
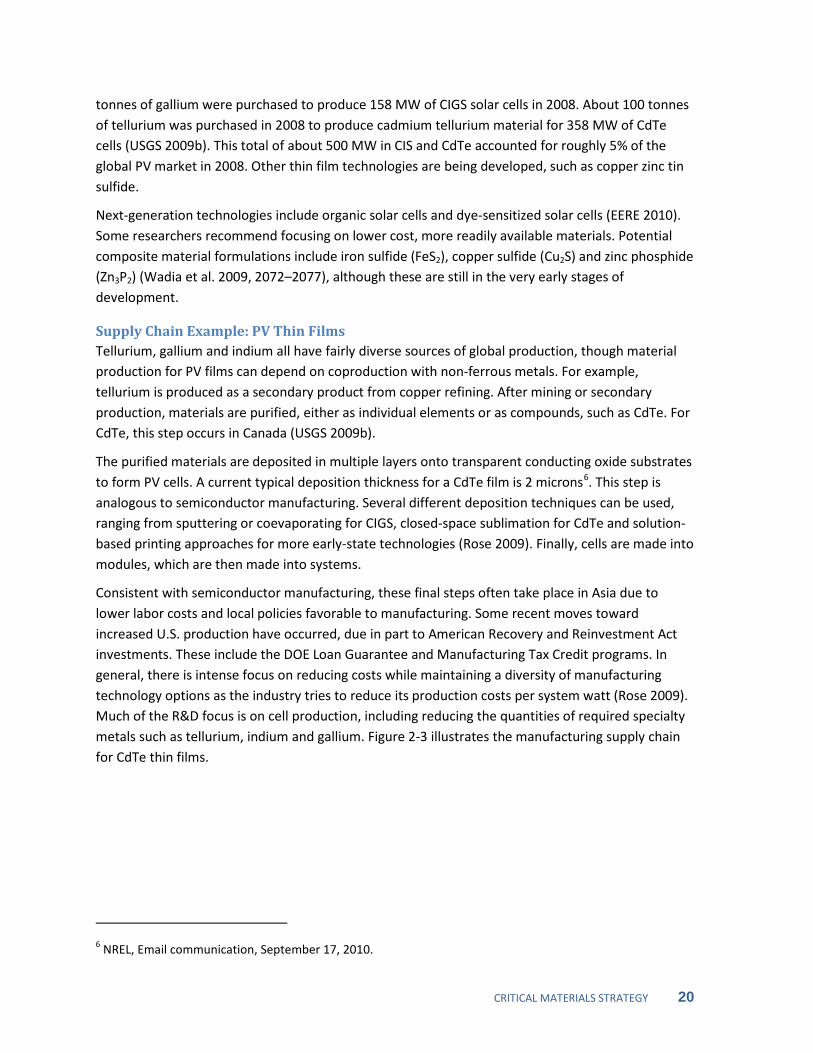
Table 2-1 provides an overview of the key materials used in leading clean energy technologies.
Table 2-1. Materials in Clean Energy Technologies and Components
This chapter describes the four components (magnets, batteries, PV thin films and phosphors) in more detail, with an emphasis on factors that influence the amount of key materials required for each. These factors include product design choices (such as battery chemistry, motor specification, phosphor composition and PV film thickness), technical innovations to reduce the amount of key material within a product required for a given performance level and measures to reduce manufacturing processing losses.

CRITICAL MATERIALS STRATEGY 15
This chapter also provides examples of the supply chain by which key materials are mined, processed and ultimately incorporated into clean energy products by manufacturers. Insights from the supply chain will help determine which materials face supply risks in the future and identify opportunities to mitigate those risks.
2.2 Permanent Magnets Permanent magnets (PMs) produce a stable magnetic field without the need for an external power source and are a key component of lightweight, high-power motors and generators. PM generators are used in wind turbines to convert wind energy into electricity, while PM motors are used in electric vehicles (EVs), hybrid-electric vehicles (HEVs) and plug-in hybrid-electric vehicles (PHEVs) to convert energy stored in the vehicle’s battery into mechanical power for propulsion.
Material Content The use of certain rare earth elements (REEs) in PMs significantly reduces the weight of the motor or generator for a given power rating. Current hybrid-electric drive designs employ motors with neodymium-iron-boron (NdFeB) magnets.1
The rare earth content of NdFeB magnets varies by manufacturer and application. An electric drive vehicle may use up to a kilogram (kg) of Nd, while each wind turbine may contain several hundred kilograms. Rare earth PMs may also incorporate praseodymium (Pr), which can be substituted for or combined with Nd. Dysprosium (Dy) or terbium (Tb) may also be added to the intermetallic alloy to increase the temperature at which the magnet can operate before losing its magnetic field (London 2010). Specific material intensity estimates for vehicle motors and wind turbine are discussed in Chapter 7 and Appendix B. The cumulative demand for Nd and other REEs in these clean energy technologies is a function of both the material content per individual product and the total number of products sold. Therefore, aggressive technology penetration rates envisioned under many worldwide clean energy strategies could significantly increase global demand for Nd, Pr, Dy and Tb.
Large capacity wind turbines (with several megawatts [MW] or more of power generation capacity) increasingly use rare earth PM generators. Although these turbines still represent a relatively small portion of the wind market, their share is likely to grow as purchasers increasingly choose larger turbines for wind projects.
Supply Chain Example: Rare Earth Permanent Magnets The PM supply chain begins with the extraction and separation of Nd and other REEs from ore. Depending on the geographic location of the mine and composition of the ore, REE coproduction may be a byproduct of extraction of another ore, such as iron ore containing a mixture of REEs in varying concentrations. The vast majority of REE mining currently occurs in China.
Once mined or coproduced, REE ore can be separated into a concentrate, processed into a mixed rare earth solution and elementally separated to oxides by solvent extraction. Rare earth oxides are
1 Samarium cobalt (SmCo) rare earth PMs are used for certain niche applications, particularly in the defense sector. They are slightly less powerful by size and weight than NdFeB magnets, although they continue to operate effectively in higher temperatures (Electron Energy Corporation 2010). This high temperature operating capability makes SmCo magnets the appropriate choice for some applications.

CRITICAL MATERIALS STRATEGY 16
ultimately used to produce rare earth metals, alloys and powders, which manufacturers use as the building blocks for components of clean energy technologies.
Intellectual property plays a significant role in the supply chain. Manufacturers employ proprietary variations of elements within the magnets to produce the desired properties and proprietary process technologies for forming magnetic shapes via bonding or sintering. Sintering produces higher performance magnets required for electric drive and larger wind turbine applications, while bonded magnets are sufficient for use in other applications, such as electronics.
Master patents on NdFeB magnets are controlled by two firms: Hitachi Metals (formerly Sumitomo) in Japan and Magnequench, a former U.S. firm that was sold to a Chinese-backed consortium in 1995 (Dent 2009).2
Figure 2-2 illustrates the supply chain for vehicle and wind turbine applications using NdFeB PMs. The reuse and recycling loop in the generic material supply chain (Figure 1-2) is not shown in Figure 2-2 because there is currently only limited recovery of manufacturing waste and no measurable recovery from aftermarket products (Arnold Magnetic Technologies 2010). However, improved designs for recycling coupled with larger streams of materials could eventually allow for the economical recycling and reuse of magnetic materials.
Hitachi has used this intellectual property protection to capture a large portion of the market for high-quality magnetic materials, while the Magnequench sale gave Chinese companies access to the intellectual property and technology necessary to establish production plants and further increase supply chain integration. Licensed production of sintered NdFeB magnets is currently limited to 10 firms in China, Japan and Germany. Relevant patents for sintered NdFeB magnets may expire in 2014 (Arnold Magnetic Technologies 2010).
2 Magnequench merged with Canadian based AMR Technologies in 2005 to form Neo Materials Technologies. It now operates as a Canadian-based company with Chinese operations.

CRITICAL MATERIALS STRATEGY 17
Figure 2-1. Supply chain for rare earth element PM applications
2.3 Batteries Batteries are a key component in vehicle applications—HEVs, PHEVs and EVs all require batteries to store energy for vehicle propulsion. HEVs rely on an internal combustion engine as the primary power source, but use a battery to store excess energy captured during vehicle braking or produced by the engine. The stored energy provides power to an electric motor that can assist in acceleration or provide limited periods of primary propulsion power. PHEV configurations vary, but generally incorporate a higher-capacity battery than HEVs, which can be recharged externally and used as the primary power source for longer durations and at higher speeds than is required for a HEV. In EVs, the battery is the sole power source.
Material Content The electric drive vehicles described above all require rechargeable (also called “secondary”) batteries with the capacity to rapidly store and release electrical energy over multiple cycles. There are a wide variety of battery chemistries available. Current generation HEVs use nickel metal hydride (NiMH) batteries. The most common NiMH chemistries use a cathode material designated as AB5. A is typically rare earth mischmetal containing lanthanum, cerium, neodymium and praseodymium; while B is a combination of nickel, cobalt, manganese and/or aluminum (Kopera 2004). A current-generation hybrid vehicle battery may contain several kg of REE material. Specific material intensity estimates are discussed in Chapter 7 and Appendix B.
PHEVs and EVs require greater storage capacity and higher power ratings than HEVs and consequently are likely to employ lithium-ion batteries (National Research Council 2010). Although battery manufacturers are still working to address cost and safety issues, lithium-ion chemistries offer better energy density, cold-weather performance, abuse tolerance and recharge rates than NiMH batteries (Vehicle Technologies Program 2009). Thus, the demand for lithium and other materials associated with lithium-ion battery chemistries will likely grow substantially with the wide-scale deployment of EVs and PHEVs. Lithium-ion batteries that show promise for electric vehicle applications typically use either graphite as the anode and some form of lithium salt in both the

CRITICAL MATERIALS STRATEGY 18
cathode and electrolyte solution. The lithium content per vehicle battery varies widely depending on manufacturer design choices. Researchers from Argonne National Laboratory have estimated that a battery capable of providing 100 miles of range for an electric vehicle would contain between 3.4 and 12.7 kg of lithium, depending on the specific lithium-ion chemistry used and the battery range (Gains and Nelson 2010).
Supply Chain Example: Lithium-Ion Batteries Lithium for battery cathode and electrolyte materials is produced from lithium carbonate, which is most widely and economically extracted from salt lake brine deposits via a lime soda evaporation process. The process starts with concentrating the lithium chloride by evaporating salty water in shallow pools for 12 to 18 months, which is then treated with sodium carbonate (soda ash) to precipitate out the lithium carbonate. Lithium carbonate has also been produced from spodumene (a silicate of lithium and aluminum) and hectorite clay deposits, but recovery from these sources is more expensive (USGS 2009a). Currently, Chile is the largest producer of this lithium carbonate.
Manufacturers produce battery cells from anode, cathode and electrolyte materials. All Li-ion batteries use some form of lithium in the cathode and electrolyte materials, while anodes are generally graphite based and contain no lithium.3
While some lithium-ion batteries are available in standard forms and sizes, most are designed to meet the requirements of a specific product (Brodd 2005). This design process entails close coordination between battery manufacturers and automakers to develop batteries with suitable performance for electric drive vehicles.
These cells are connected in series inside a battery housing to form a complete battery pack. Despite lithium’s importance for batteries, it represents a relatively small fraction of the cost of both the battery cell and the final battery cost (Deutsche Bank 2009).
Various programs seek to recover and recycle lithium-ion batteries. These include prominently placed recycling drop-off locations in retail establishments for consumer electronics batteries, as well as recent efforts to promote recycling of EV and PHEV batteries as these vehicles enter the market in larger numbers (Hamilton 2009). Current recycling programs focus more on preventing improper disposal of hazardous battery materials and recovering battery materials that are more valuable than lithium. However, if lithium recovery becomes more cost effective, recycling programs and design features provide a mechanism to enable larger scale lithium recycling. Another potential application for lithium batteries that have reached the end of their useful life for vehicle applications is in stationary applications such as grid storage.
The supply chain for the production of lithium for use in lithium-ion batteries, shown in Figure 2-2, is illustrative of the supply chain for many types of batteries. It involves multiple, geographically
3 Lithium titanate batteries use a lithium titanium oxide anode and have been mentioned as a potential candidate for automotive use (Gains 2010), despite being limited by a low cell voltage compared to other Li-ion battery chemistries. Lithium titanate is used later in the strategy as the lithium-ion battery chemistry with the highest lithium content in creating material demand projections.

CRITICAL MATERIALS STRATEGY 19
distributed steps and it overlaps with the production supply chains of other potential critical materials, such as cobalt, which are also used in battery production.
Figure 2-2. Supply chain for lithium-ion batteries
2.4 Polycrystalline Photovoltaic Thin Films Photovoltaic (PV) technologies are the most common solar technologies used to generate electricity. PV technologies include crystalline silicon, thin films, high-efficiency III-V cells with optical concentrators and nanotechnology-based films. In 2008, conventional crystalline silicon-based cells were the dominant PV technology, accounting for 86% of the total global PV market (USGS 2009b). However, thin film technologies constituted a growing share of the remainder of the market.4
Material Content
They are increasingly prominent among PV technologies due to several advantages relative to traditional crystalline silicon “thick films”: they require less functional material; they can be manufactured in continuous rolls or sheets; and they can be deposited on flexible substrates.
Three primary material formulations for PV thin films are on the market: amorphous silicon (a-Si), copper-indium diselenide (CIS) and cadmium telluride (CdTe). While a-Si accounted for about 50% of the thin-film market in 2008, the shares of both CIS and CdTe are increasing. A major subset of CIS thin films are copper-indium gallium diselenide (CIGS) formulations, which are about 10% copper, 28% indium, 10% gallium and 52% selenium. About 2 tonnes5
4 Concentrating PV and nanotechnology-based films remain a negligible share of the market.
of copper, 4 tonnes of indium and 2
5 In this Strategy, we use tonnes rather than metric tons with which the reader might be more familiar. 1 tonne = 1 metric ton (Mt).
CRITICAL MATERIALS STRATEGY 20
tonnes of gallium were purchased to produce 158 MW of CIGS solar cells in 2008. About 100 tonnes of tellurium was purchased in 2008 to produce cadmium tellurium material for 358 MW of CdTe cells (USGS 2009b). This total of about 500 MW in CIS and CdTe accounted for roughly 5% of the global PV market in 2008. Other thin film technologies are being developed, such as copper zinc tin sulfide.
Next-generation technologies include organic solar cells and dye-sensitized solar cells (EERE 2010). Some researchers recommend focusing on lower cost, more readily available materials. Potential composite material formulations include iron sulfide (FeS2), copper sulfide (Cu2S) and zinc phosphide (Zn3P2) (Wadia et al. 2009, 2072–2077), although these are still in the very early stages of development.
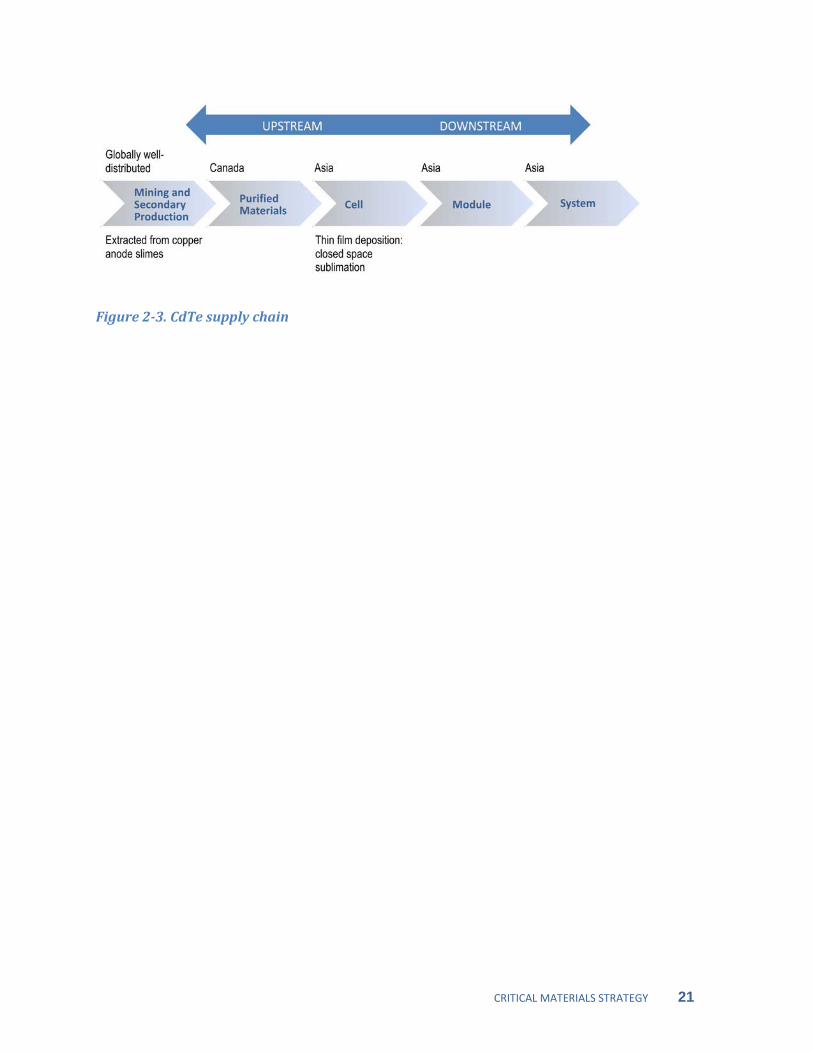
Supply Chain Example: PV Thin Films Tellurium, gallium and indium all have fairly diverse sources of global production, though material production for PV films can depend on coproduction with non-ferrous metals. For example, tellurium is produced as a secondary product from copper refining. After mining or secondary production, materials are purified, either as individual elements or as compounds, such as CdTe. For CdTe, this step occurs in Canada (USGS 2009b).
The purified materials are deposited in multiple layers onto transparent conducting oxide substrates to form PV cells. A current typical deposition thickness for a CdTe film is 2 microns6
Consistent with semiconductor manufacturing, these final steps often take place in Asia due to lower labor costs and local policies favorable to manufacturing. Some recent moves toward increased U.S. production have occurred, due in part to American Recovery and Reinvestment Act investments. These include the DOE Loan Guarantee and Manufacturing Tax Credit programs. In general, there is intense focus on reducing costs while maintaining a diversity of manufacturing technology options as the industry tries to reduce its production costs per system watt (Rose 2009). Much of the R&D focus is on cell production, including reducing the quantities of required specialty metals such as tellurium, indium and gallium. Figure 2-3 illustrates the manufacturing supply chain for CdTe thin films.
. This step is analogous to semiconductor manufacturing. Several different deposition techniques can be used, ranging from sputtering or coevaporating for CIGS, closed-space sublimation for CdTe and solution-based printing approaches for more early-state technologies (Rose 2009). Finally, cells are made into modules, which are then made into systems.
6 NREL, Email communication, September 17, 2010.
CRITICAL MATERIALS STRATEGY 21
Figure 2-3. CdTe supply chain

CRITICAL MATERIALS STRATEGY 22
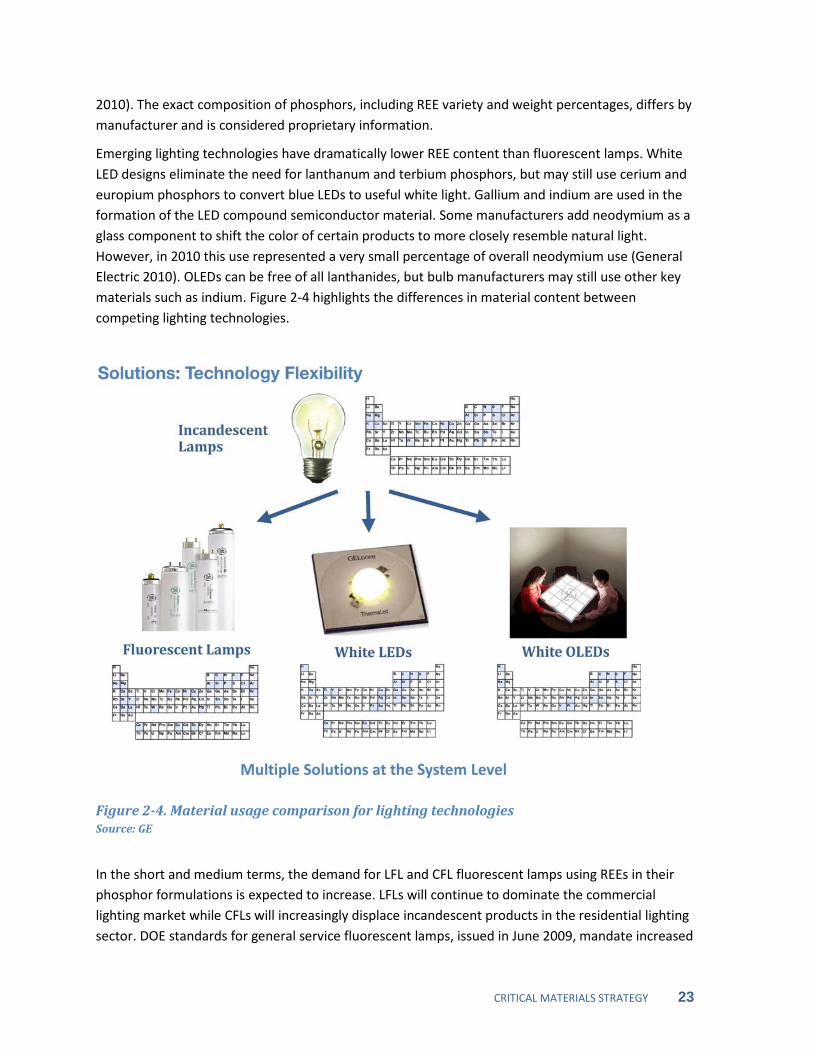
Comparison of Lighting Technologies Incandescent lamps generate visible light by heating a filament in a vacuum or inert gas to produce light. They are simple and inexpensive to manufacture, but relatively inefficient.
Fluorescent lamps generate visible light by using electricity to excite mercury vapor inside a tube, causing it to emit ultraviolet light, which excites a phosphor compound coating the inside of the tube. Fluorescent lamps are more complicated and costly to manufacture than incandescent, but have a more cost-effective life cycle because they are more energy efficient and last longer. Linear fluorescent lamps (LFL) are common in industrial and commercial buildings and newer compact fluorescent lamps (CFL) are designed to fit existing lamp sockets in residential buildings.
Light Emitting Diodes (LEDs) produce visible light using the electroluminescence of a compound semiconductor crystalline material. This process is potentially more energy efficient than either incandescence or fluorescence. When connected to a power source, the flow of current triggers a quantum mechanical process inside the diode, which produces light in specific colors (usually red, green or blue). White light is created by combining the light from these colored LEDs or by coating a blue LED with yellow phosphor (Department of Energy 2008).
Organic LEDs (OLEDs) produce visible light when an electrical charge is applied to extremely thin organic materials layered between two electrodes. The technology is still in the early stages of development, but has the potential to efficiently produce visually appealing white lighting in a thin, flexible form that could compete directly with fluorescent and conventional LED lighting.
2.5 Phosphors and Lighting Improvements in lighting efficiency provide opportunities to significantly reduce energy demand. Lighting accounts for approximately 18% of electricity use in U.S. buildings—second only to space heating (DOE 2009). Lighting technologies can be broadly grouped into four categories: traditional incandescent, fluorescent, light emitting diodes (LEDs) and organic light emitting diodes (OLEDs).7
Material Content
Many of these lighting technologies incorporate key materials, including REEs. This Strategy is primarily concerned with REEs used in fluorescent lighting phosphors.
Though older fluorescent lighting designs are REE-free, the current generation of more efficient, spectrally complete and visually pleasing lamps uses phosphors containing different concentrations of lanthanum, cerium, europium, terbium and yttrium to achieve various lighting effects. Although exact cost breakdowns for light bulbs are proprietary, phosphors are thought to represent a significant portion of the cost of an LFL or CFL. Phosphors accounted for 7% of all REE usage by volume and 32% of the total value in 2008 (Kingsnorth
7 This discussion of lighting technologies does not consider niche lighting technologies such as high-intensity discharge (HID) lamps, which are very efficient but are used almost exclusively outdoors or in very large indoor areas.
CRITICAL MATERIALS STRATEGY 23
2010). The exact composition of phosphors, including REE variety and weight percentages, differs by manufacturer and is considered proprietary information.
Emerging lighting technologies have dramatically lower REE content than fluorescent lamps. White LED designs eliminate the need for lanthanum and terbium phosphors, but may still use cerium and europium phosphors to convert blue LEDs to useful white light. Gallium and indium are used in the formation of the LED compound semiconductor material. Some manufacturers add neodymium as a glass component to shift the color of certain products to more closely resemble natural light. However, in 2010 this use represented a very small percentage of overall neodymium use (General Electric 2010). OLEDs can be free of all lanthanides, but bulb manufacturers may still use other key materials such as indium. Figure 2-4 highlights the differences in material content between competing lighting technologies.
Figure 2-4. Material usage comparison for lighting technologies Source: GE
In the short and medium terms, the demand for LFL and CFL fluorescent lamps using REEs in their phosphor formulations is expected to increase. LFLs will continue to dominate the commercial lighting market while CFLs will increasingly displace incandescent products in the residential lighting sector. DOE standards for general service fluorescent lamps, issued in June 2009, mandate increased

CRITICAL MATERIALS STRATEGY 24
efficiency (lumens per watt) ratings for different classes of fluorescent lighting, effectively phasing out most non-REE LFL light bulbs. Additional regulations require progressively higher efficiency standards for incandescent light bulbs starting in 2012, effectively phasing them out in favor of CFL light bulbs. The National Electrical Manufacturers Association, a lighting industry trade group, estimates that the new rules for general service fluorescent lamps will increase the demand for REE phosphors by 230% over current levels (NEMA 2010), though some of this increase in demand reflects a market shift that is already under way.
In the long term, LED and OLED technologies will likely capture a significant share of the lighting market as their cost and performance make them increasingly competitive with fluorescent technologies. This change could mitigate the demand increase for REE phosphors.
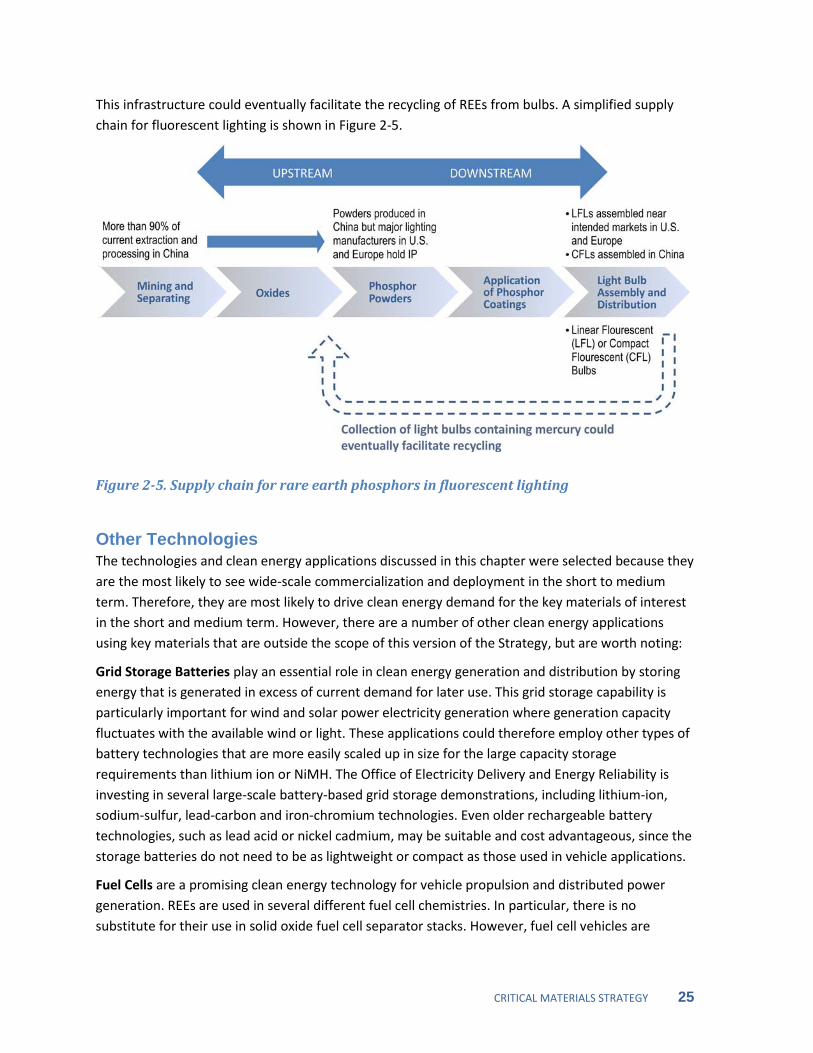
Supply Chain Example: Phosphors in Fluorescent Lighting REEs used in phosphors must be 99.999% pure, necessitating tight control over the manufacturing process.8
China currently consumes 80% of world’s lighting phosphor supply to produce components for major lighting manufacturers, although it subsequently exports the majority of these components for sale worldwide. The location of the lamp manufacturing process (which includes the production of glass tubes, coating with phosphors and assembly of bulb components) is driven by the labor and transportation costs of different types of bulbs, as well as by local government manufacturing incentives.
The presence of impurities of a few parts per million can distort the color characteristics of a given phosphor. In order to achieve these high purities, the purification takes many more separation stages, significantly increasing the cost of the rare earth oxides (REOs) used to produce the phosphors. Suppliers of phosphors used in lighting products generally produce mass quantities of similar phosphor materials for application in television screens, computer monitors and electronic instrumentation (McClear 2008).
CFLs are manufactured almost exclusively in China and distributed by major lighting manufacturers for sale worldwide. LFLs are still primarily assembled in plants in North America and Europe that are closer to the ultimate points of sale. This arrangement exists because it is much cheaper to ship the raw materials than the LFL bulbs, whose volume consists mostly of air inside the fragile lighting tubes.
Regardless of manufacturing and assembly location, major U.S. lighting manufacturers continue to hold the intellectual property rights to formulas for the fluorescent lighting phosphors and invest significantly in research and development (R&D) related to lighting manufacturing. This allows U.S. firms to retain control of the value chain, despite the large role of Chinese firms in the manufacturing process.
Phosphors and component REEs are not currently recovered from fluorescent bulbs, but due to the mercury content, there is a growing infrastructure to recover used LFLs and CFLs for safe disposal.
8 Much higher purity than for the other REE applications described earlier.
CRITICAL MATERIALS STRATEGY 25
This infrastructure could eventually facilitate the recycling of REEs from bulbs. A simplified supply chain for fluorescent lighting is shown in Figure 2-5.
Figure 2-5. Supply chain for rare earth phosphors in fluorescent lighting
Other Technologies The technologies and clean energy applications discussed in this chapter were selected because they are the most likely to see wide-scale commercialization and deployment in the short to medium term. Therefore, they are most likely to drive clean energy demand for the key materials of interest in the short and medium term. However, there are a number of other clean energy applications using key materials that are outside the scope of this version of the Strategy, but are worth noting:
Grid Storage Batteries play an essential role in clean energy generation and distribution by storing energy that is generated in excess of current demand for later use. This grid storage capability is particularly important for wind and solar power electricity generation where generation capacity fluctuates with the available wind or light. These applications could therefore employ other types of battery technologies that are more easily scaled up in size for the large capacity storage requirements than lithium ion or NiMH. The Office of Electricity Delivery and Energy Reliability is investing in several large-scale battery-based grid storage demonstrations, including lithium-ion, sodium-sulfur, lead-carbon and iron-chromium technologies. Even older rechargeable battery technologies, such as lead acid or nickel cadmium, may be suitable and cost advantageous, since the storage batteries do not need to be as lightweight or compact as those used in vehicle applications.
Fuel Cells are a promising clean energy technology for vehicle propulsion and distributed power generation. REEs are used in several different fuel cell chemistries. In particular, there is no substitute for their use in solid oxide fuel cell separator stacks. However, fuel cell vehicles are

CRITICAL MATERIALS STRATEGY 26
unlikely to see large-scale commercialization in the short to medium term, due to both technical challenges in cost-effective fuel cell designs and the lack of a hydrogen refueling infrastructure.
Nuclear Power technologies incorporate some of the key materials considered in this Strategy and are often classified as a clean energy technology. However, the high capital costs and lengthy permitting requirements for new nuclear power plants make it unlikely that nuclear power’s share of key material usage will expand rapidly in the short to medium term.
Electric Bicycles use NdFeB permanent magnet motors and batteries in a manner similar to EVs and PHEVs. The motor and battery size and key material content per bicycle is very small compared to electric drive automobiles, but electric bicycle sales are sold in much greater numbers—particularly in developing countries. Electric bicycles are not included in the clean energy demand projections in Chapter 7 of this Strategy, but they could still represent a significant share of the growth in demand for Nd and other REEs used in PMs.
Magnetic Refrigeration shows great promise for improving the energy efficiency of the refrigeration process using rare earth PMs. Some experts believe this technology could be commercialized and capture a significant share of the refrigeration market in the medium term. However, this technology was not considered in the clean energy material demand projections in Chapter 7 due to uncertainties about the timeline for commercialization, projected demand and material intensity of the commercial products.
Additionally, several other energy-related technologies use significant quantities of REEs:
Fluid Cracking Catalysts (FCCs) are used in the oil refining process to convert heavy oils (gas oils and residual oils) into more valuable gasoline, distillates and lighter products. Rare earth elements are used in FCC catalysts to help control the product selectivity of the catalyst and produce higher yields of more valuable products such as gasoline. Lanthanum is the predominant REE used in FCCs, along with lesser amounts of cerium and neodymium. Cerium is also a key component of FCC additives that are used to help reduce stationary source nitrogen oxide (NOx) and sulfur oxide (SOx) pollutants. According to personal communications with a catalysts supplier, the estimated world demand in 2009 for REOs used in FCC catalysts was approximately 7,550 tonnes/year. DOE has estimated that the U.S. refinery industry consumption of REOs for FCC catalysts is approximately 3,500 to 4,000 tonnes/year9
Automotive catalytic converters use cerium to facilitate the oxidation of carbon monoxide (CO), helping significantly reduce vehicle CO emissions. While the amount of cerium required per vehicle is very small, catalytic converters are used in practically every passenger vehicle and accounted for approximately 9% of total U.S. rare earth use consumption in 2008.
, REEs used in FCCs represent a very small fraction of the overall cost of gasoline and other petroleum products and are not required for refining. However, a disruption in REE supply could have a noticeable impact on refinery yields and require capital investments to re-optimize the fluid cracking process for operation without REEs.
These technologies may be considered for further analysis in future revisions to this report.
9 Calculation assuming feed rates of 0.21 to 0.25 pounds of catalysts per barrel FCC feed and 2% REO content.

CRITICAL MATERIALS STRATEGY 27
References Arnold Magnetic Technologies. 2010. “Response to Department of Energy Request for Information.” June 7.
Brodd, R.J. 2005. Factors Affecting U.S. Production Decisions: Why are there no Volume Lithium-Ion Battery Manufactureres in the United States. Gaitherburg, MD: National Institute of Standards and Technology.
Dent, P.C. 2009. “High Performance Magnet Materials: Risky Supply Chain” Advanced Materials and Processes, August. http://www.electronenergy.com/media/amp16708p27.pdf.
Deutsche Bank. 2009. Electric Cars: Plugged In 2. Frankfurt: Deutsche Bank Securities.
DOE (U.S. Department of Energy). 2009. Buildings Energy Data Book. Washington, DC: DOE. http://buildingsdatabook.eren.doe.gov/Default.aspx.
DOE (U.S. Department of Energy), EERE (Energy Efficiency and Renewable Energy). 2008. “Using Light Emitting Diodes: How LEDs Work.” October 28. http://www1.eere.energy.gov/buildings/ssl/how.html.
EERE (Office of Energy Efficiency and Renewable Energy) Solar Energy Technologies Program. 2010. “DOE $1/W Workshop Photovoltaic Industry Primer.” Washington, DC: U.S. Department of Energy.
Electron Energy Corporation. 2010. “Response to Department of Energy Request for Information.” June 7.
Gains, L., and P. Nelson. 2010. Lithium-Ion Batteries: Examining Material Demand and Recycling Issues. Argonne, IL: Argonne National Laboratory.
Hamilton, T. 2009. “Lithium Battery Recycling Gets a Boost.” Technology Review, August 29.
Kingsnorth, D. 2010. “Rare Earths: Facing new Challenges in the new Decade.” Slideshow presented at the 2010 Society for Mining, Metallurgy, and Exploration Annual Meeting, Phoenix. http://www.smenet.org/rareEarthsProject/SME_2010_Kingsnorth.pdf.
Kopera, J.J. 2004. Inside the Nickel Metal Hydride Battery. Orion, MI: Cobasys. http://www.cobasys.com/pdf/tutorial/InsideNimhBattery/inside_nimh_battery_technology.html.
London, I.M. 2010. “The Delicate Supply Balance and Growing Demand for Rare Earths.” Slideshow presented at Magnetics Economic Policy Photovoltaic Manufacturing Symposium, Washington, DC, July 29.
Vehicle Technologies Program. 2009. “Batteries.” U.S. Department of Energy, Office of Energy Efficiency and Renewable Energy. Accessed July 20, 2010. http://www1.eere.energy.gov/vehiclesandfuels/technologies/energy_storage/batteries.html.
USGS (U.S. Geological Survey). 2009a. 2008 Minerals Yearbook: Lithium. Reston, VA: USGS.
USGS (U.S. Geological Survey). 2009b. 2008 Minerals Yearbook: Selenium and Tellurium. Reston, VA: USGS.

CRITICAL MATERIALS STRATEGY 28
Chapter 3. Historical Supply, Demand and Prices for the Key Materials This chapter presents historical data on supply, demand and prices. Data is provided for fourteen materials, including nine rare earth elements (yttrium, lanthanum, cerium, praseodymium, neodymium, samarium, europium, terbium and dysprosium) as well as indium, gallium, tellurium, cobalt and lithium.
3.1. Supply The supply of a material is a function of resources, reserves and production. “Resources” include identified and undiscovered resources. Within identified resources there is further differentiation between demonstrated and inferred resources. For the short- to medium- term focus of this report, we consider demonstrated resources only. “Reserves” refer to resources that can be extracted economically at the time of determination, but may extend beyond the medium term if new infrastructure is necessary before bringing the mine online.
Production generally occurs in countries with large resources and reserves, but exceptions exist. In some cases, small reserve holders may also produce the material, while countries with no reserves could be a major refinery producer of imported primary or raw material.
Table 3.1 reviews the production characteristics of key materials, the top ranked countries for mining and refining, U.S. production (if applicable) and top reserve holding countries for rare earths.
Text Box 3-1:
Resources: A concentration of naturally occurring materials in such form that economic extraction of a commodity is regarded as feasible, either currently or at some future time.
Reserves: Resources that could be economically extracted or produced at the time of determination. The term reserves need not signify that extraction facilities are in place and operative.
Source: U.S. Geological Survey http://minerals.usgs.gov/minerals/pubs/mcs/2010/mcsapp2010.pdf

CRITICAL MATERIALS STRATEGY 29
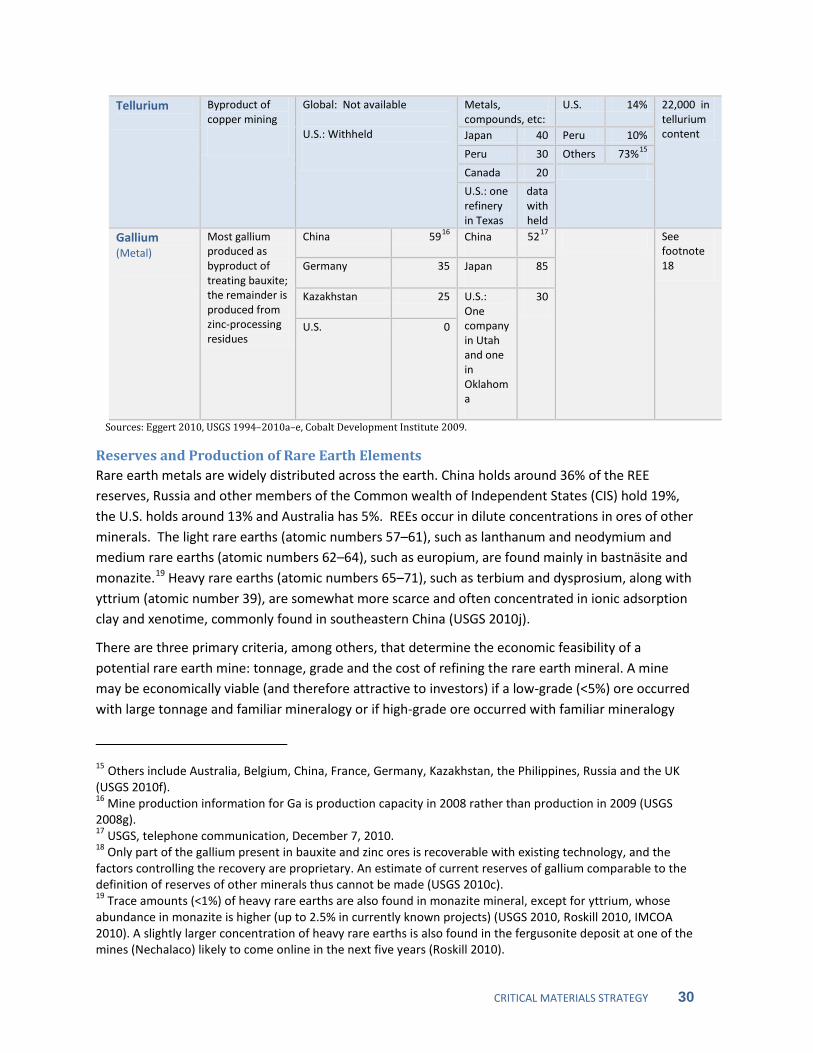
Table 3-1. Production and Reserves Information on Key Materials10
10 Data in this table are from the most recent data available from USGS. 11 Approximately 20,000 additional REO from “unofficial” sources (Kingsnorth and Chegwidden 2010). 12 This 2009 production figure is from Molycorp (2010). 13 Cobalt Development Institute (2009). 14 This set of data on indium based on indium content is from 2008 (USGS 2008d); the breakdown of “Others” is not available.
Production characteristics
2009 top-ranked global primary and refinery producers plus U.S.-related information (in tonnes unless otherwise indicated)
Top-ranked reserve holding countries, in rank order
Total global reserves (in tonnes) Mine production: Refined metal:
Rare earth elements (in rare earth oxide/ REO)
Occur in dilute concentrations in metal ores. Often co-produced with other metals. Concentrations vary widely from ore to ore.
China 125,00011 Not available China 36% 99 million in REO content
Russia 2,470 CIS 19%
India 50 U.S. 13%
United States (processing of stockpiled ore at Mt. Pass, CA led to 2,150t REO12
0
)
Lithium (in lithium carbonate equivalent/LCE)
Most lithium is recovered from subsurface liquid brines or from mining of lithium-carbonate rocks
Chile 38,720 Not available Chile 76% 9.9 million in lithium content
Australia 23,020 Argentina 8%
China 12,033 Australia 6%
United States Withheld
Cobalt
Primary cobalt (15%) Byproduct of nickel mining (50%) Byproduct of copper mining (35%)
Ores, concentrates, or semi-refined materials:
Refined metals & chemicals:
DRC 51% 6.6 million in cobalt content DRC 25,000 China13 23,00
0 Australia 23%
Australia 6,300 Finland 8,900 Cuba 8%
China 6,200 Canada 4,900
Russia 6,200 U.S. 0
U.S. 0
Indium
Byproduct of zinc processing
Global: Not available
Metals, alloys, etc:
China 73%14 Not available
China 300 Others 16%
South Korea
85 U.S. 3
Japan 60
U.S. 0
CRITICAL MATERIALS STRATEGY 30
Sources: Eggert 2010, USGS 1994–2010a–e, Cobalt Development Institute 2009.
Reserves and Production of Rare Earth Elements Rare earth metals are widely distributed across the earth. China holds around 36% of the REE reserves, Russia and other members of the Common wealth of Independent States (CIS) hold 19%, the U.S. holds around 13% and Australia has 5%. REEs occur in dilute concentrations in ores of other minerals. The light rare earths (atomic numbers 57–61), such as lanthanum and neodymium and medium rare earths (atomic numbers 62–64), such as europium, are found mainly in bastnäsite and monazite.19
There are three primary criteria, among others, that determine the economic feasibility of a potential rare earth mine: tonnage, grade and the cost of refining the rare earth mineral. A mine may be economically viable (and therefore attractive to investors) if a low-grade (<5%) ore occurred with large tonnage and familiar mineralogy or if high-grade ore occurred with familiar mineralogy
Heavy rare earths (atomic numbers 65–71), such as terbium and dysprosium, along with yttrium (atomic number 39), are somewhat more scarce and often concentrated in ionic adsorption clay and xenotime, commonly found in southeastern China (USGS 2010j).
15 Others include Australia, Belgium, China, France, Germany, Kazakhstan, the Philippines, Russia and the UK (USGS 2010f). 16 Mine production information for Ga is production capacity in 2008 rather than production in 2009 (USGS 2008g). 17 USGS, telephone communication, December 7, 2010. 18 Only part of the gallium present in bauxite and zinc ores is recoverable with existing technology, and the factors controlling the recovery are proprietary. An estimate of current reserves of gallium comparable to the definition of reserves of other minerals thus cannot be made (USGS 2010c). 19 Trace amounts (<1%) of heavy rare earths are also found in monazite mineral, except for yttrium, whose abundance in monazite is higher (up to 2.5% in currently known projects) (USGS 2010, Roskill 2010, IMCOA 2010). A slightly larger concentration of heavy rare earths is also found in the fergusonite deposit at one of the mines (Nechalaco) likely to come online in the next five years (Roskill 2010).
Tellurium
Byproduct of copper mining
Global: Not available U.S.: Withheld
Metals, compounds, etc:
U.S. 14% 22,000 in tellurium content Japan 40 Peru 10%
Peru 30 Others 73%15
Canada
20
U.S.: one refinery in Texas
data withheld
Gallium (Metal)
Most gallium produced as byproduct of treating bauxite; the remainder is produced from zinc-processing residues
China 5916 China 5217 See footnote18Germany 35 Japan 85
Kazakhstan 25 U.S.: One company in Utah and one in Oklahoma
30
U.S. 0

CRITICAL MATERIALS STRATEGY 31
and moderate reserve tonnage. Globally, the four principal high-yield REE-bearing minerals are bastnäsite, monazite, xenotime and ion adsorption clays. A mineral deposit that does not fall in any of these four categories typically requires more metallurgical testing to establish the mineralogy and processing steps. The rare earth content of each deposit is essential to estimating the deposit’s profitability. It determines how the ore will be processed and how complicated it will be to separate the rare earth elements from each other. 20
Table 3-2. Rare Earths Types and Contents of Major Contributing Source Minerals Supplying REEs to the Global Market (Percentage of Total Rare Earth Oxides)
Of note is that nearly all rare earth deposits contain the radioactive material thorium and the cost of treating and storing thorium is an important factor in evaluating the economics of a mine. In general, each rare earth ore body is unique and requires a site-specific processing system. As a result, production costs vary from deposit to deposit based on ore content and mineralogy.
21
20 USGS, in-person meeting and multiple telephone communication, July–September, 2010. 21 Sum of concentrations may not total 100% due to matrix effect when analyzing various natural materials that may differ in composition from the control standards used in calibration. Chart modified from USGS Minerals Yearbook 2007 Volume I: Rare Earths chapter, Table 2, p. 60.11.
LIGHT MEDIUM HEAVY
TYPE LOCATION(S) La
ntha
num
(La)
Ceriu
m (C
e)
Pras
eody
miu
m (P
r)
Neo
dym
ium
(Nd)
Sam
ariu
m (S
m)
Euro
pium
(Eu)
Gad
olin
ium
(Gd)
Terb
ium
(Tb)
Dys
pros
ium
(Dy)
Hol
miu
m (H
o)
Erbi
um (E
r)
Thul
ium
(Tm
)
Ytte
rbiu
m (Y
b)
Lute
tium
(Lu)
Yttr
ium
(Y)
Currently active:
Bastnäsite Bayan Obo, Inner Mongolia
23.0 50.0 6.2 18.5 0.8 0.2 0.7 0.1 0.1 0.0 0.0 0.0 0.0 0.0 0.0
Xenotime Lahat, Perak, Malaysia
1.2 3.1 0.5 1.6 1.1 0.0 3.5 0.9 8.3 2.0 6.4 1.1 6.8 1.0 61.0
Rare earth laterite
Xunwu, Jiangxi Province, China
43.4 2.4 9.0 31.7 3.9 0.5 3.0 0.0 0.0 0.0 0.0 0.0 0.3 0.1 8.0
Ion adsorption clays
Longnan, Jiangxi Province, China
1.8 0.4 0.7 3.0 2.8 0.1 6.9 1.3 6.7 1.6 4.9 0.7 2.5 0.4 65.0
Loparite Lovozerskaya, Russia
28 57.5 3.8 8.8 0.0 0.1 0.0 0.1 0.1 0.0 0.0 0.0 0.0 0.0 0.0
Various India 23 46 5 20 4 0.0 0.0 0.0 0.0 0.0 0.0 0.0 0.0 0.0 0.0 Various Brazil N.A.

CRITICAL MATERIALS STRATEGY 32
Sources: USGS 2010j, Roskill 2010, IMCOA 2010 and GE 2010.
Much rare earth data is proprietary, yet public sources, including the United States Geological Survey (USGS), routinely publish data on the rare earth deposits.25,26
22 Currently the Mountain Pass site is limited to the reprocessing of rare earth ores from previously mined stocks.
Table 3-2 combines data from
23 Monazite production at this Brazil site is unknown (General Electric 2010). 24 Ore, rather than the normally quoted mineral (Roskill 2010). 25 The paucity of data is also due to a lack of mineralogical studies or mine plan development for some of the rare earth deposits.
Possible to come online in the next 5 years:
Bastnäsite22
Mountain Pass, California, United States
33.2 49.1 4.3 12.0 0.8 0.1 0.2 0.0 0.0 0.0 0.0 0.0 0.0 0.0 0.1
Monazite
Mount Weld, Australia
26.0 51.0 4.0 15.0 1.8 0.4 1.0 0.1 0.2 0.1 0.2 0.0 0.1 0.0 0.0
Eastern coast23 24.0
, Brazil 47.0 4.5 18.5 3.0 0.1 1.0 0.1 0.4 0.0 0.1 0.0 0.0 0.0 1.4
Apatite Nolans bore, Australia
20.0 48.2 5.9 21.5 2.4 0.4 1.0 0.1 0.3 0.0 0.0 0.0 0.0 0.0 0.0
Fergusonite24 Nechalaco,
Canada 16.9 41.4 4.8 18.7 3.5 0.4 2.9 1.8 0.7 0.0 0.0 0.0 0.0 0.0 7.4
Bastnäsite & Parisite
Dong Pao, Vietnam
32.4 50.4 4.0 10.7 0.9 0.0 0.0 0.0 0.0 0.0 0.0 0.0 0.0 0.0 0.007
Alanite & apatite
Hoidas Lake, Canada
19.8 45.6 5.8 21.9 2.9 0.6 1.3 0.1 0.4 0.0 0.0 0.0 0.0 0.0 1.3
Trachyte Dubbo Zirconia, Australia
19.5 36.7 4.0 14.1 2.5 0.1 2.1 0.3 2.0 0.0 0.0 0.0 0.0 0.0 15.8
Not likely to be producing in the next 5 years:
REE thorium minerals
U.S. Rare Earths Lemhi Pass quadrangle, Idaho and Montana
7.0 19.0 3.0 18.0 11.0 4.0 11.0 0.5 4.0 0.5 0.2 0.2 0.5 0.2 20.9
Monazite
Nangang, Guangdong, China
23.0 42.7 4.1 17.0 3.0 0.1 2.0 0.7 0.8 0.1 0.3 0.0 2.4 0.1 2.4
Eastern coast, Brazil
24.0 47.0 4.5 18.5 3.0 0.1 1.0 0.1 0.4 0.0 0.1 0.0 0.0 0.0 1.4
North Capel, Western Australia
23.9 46.0 5.0 17.4 2.5 0.1 1.5 0.0 0.7 0.1 0.2 0.0 0.1 0.0 2.4
North Stradbroke Island, Queensland, Australia
21.5 45.8 5.3 18.6 3.1 0.8 1.8 0.3 0.6 0.1 0.2 0.0 0.1 0.0 2.5
Green Cove Springs, Florida, United States
17.5 43.7 5.0 17.5 3.1 0.8 1.8 0.3 0.6 0.1 0.2 0.0 0.1 0.0 2.5
CRITICAL MATERIALS STRATEGY 33
the USGS and others to summarize rare earth resources by source mineral type around the world. The table is not an exhaustive account of all known rare earth deposits.
The United States started producing rare earths out of Mountain Pass, California, in the mid-1960s and dominated global production of rare earths until 1984. However, China has been the world’s leading rare earth producer since 1996 due to low production costs and valuable coproduction of iron ore at its principal rare earth mine in Inner Mongolia. The CIS, India and Brazil produce small amounts of REEs.27
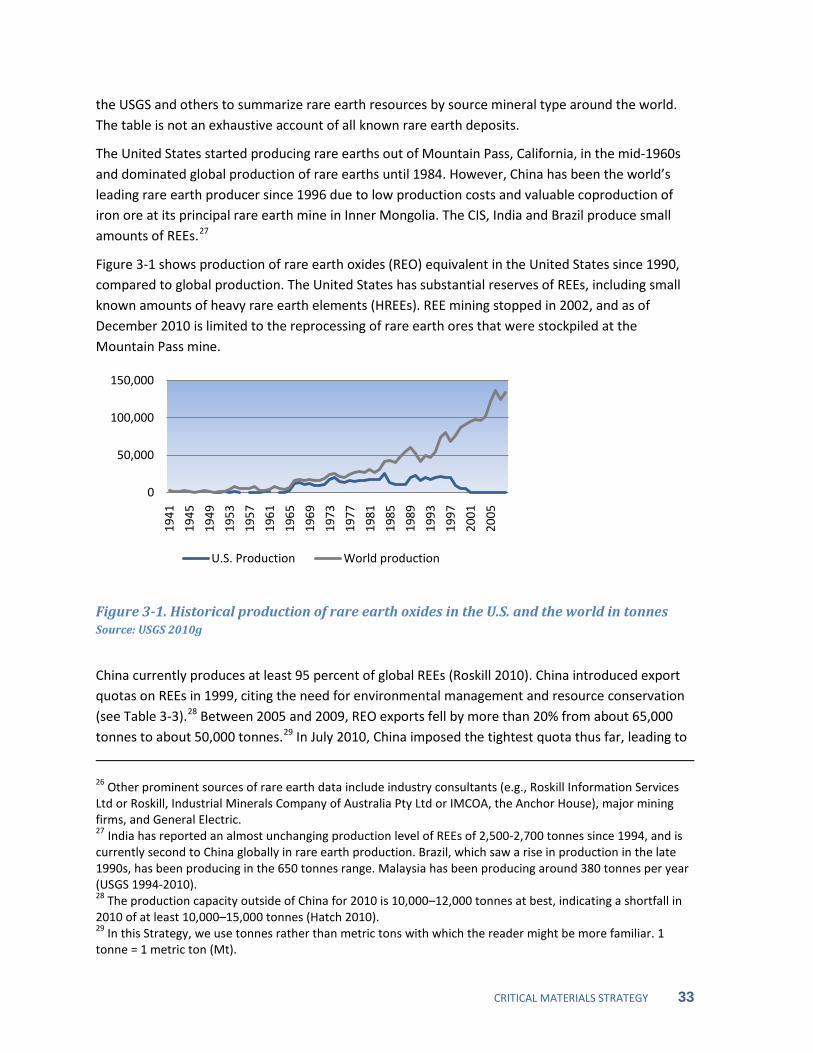
Figure 3-1 shows production of rare earth oxides (REO) equivalent in the United States since 1990, compared to global production. The United States has substantial reserves of REEs, including small known amounts of heavy rare earth elements (HREEs). REE mining stopped in 2002, and as of December 2010 is limited to the reprocessing of rare earth ores that were stockpiled at the Mountain Pass mine.
Figure 3-1. Historical production of rare earth oxides in the U.S. and the world in tonnes Source: USGS 2010g
China currently produces at least 95 percent of global REEs (Roskill 2010). China introduced export quotas on REEs in 1999, citing the need for environmental management and resource conservation (see Table 3-3).28 Between 2005 and 2009, REO exports fell by more than 20% from about 65,000 tonnes to about 50,000 tonnes.29
26 Other prominent sources of rare earth data include industry consultants (e.g., Roskill Information Services Ltd or Roskill, Industrial Minerals Company of Australia Pty Ltd or IMCOA, the Anchor House), major mining firms, and General Electric.
In July 2010, China imposed the tightest quota thus far, leading to
27 India has reported an almost unchanging production level of REEs of 2,500-2,700 tonnes since 1994, and is currently second to China globally in rare earth production. Brazil, which saw a rise in production in the late 1990s, has been producing in the 650 tonnes range. Malaysia has been producing around 380 tonnes per year (USGS 1994-2010). 28 The production capacity outside of China for 2010 is 10,000–12,000 tonnes at best, indicating a shortfall in 2010 of at least 10,000–15,000 tonnes (Hatch 2010). 29 In this Strategy, we use tonnes rather than metric tons with which the reader might be more familiar. 1 tonne = 1 metric ton (Mt).
0
50,000
100,000
150,000
1941
1945
1949
1953
1957
1961
1965
1969
1973
1977
1981
1985
1989
1993
1997
2001
2005
U.S. Production World production

CRITICAL MATERIALS STRATEGY 34
a 40% annual drop of exports.30
Additionally, it is estimated that another 20,000 tonnes are illegally exported from China bringing total production to approximately 145,000 tonnes of REO (China Daily 2009, Kingsnorth 2010).
This latest set of export quotas were non-element specific and applied to all exports of REEs, which in turn led to price spikes for the lower valued light rare earth elements (LREEs) as traders favored exports of the more valuable HREEs. China’s Ministry of Industry and Information Technology may propose additional measures on some REEs in the 12th Five-year Plan for Rare Earth Industry sometime in 2010 (Business China 2010).
Table 3-3. China’s REE Export Quotas and Demand from Rest of the World (ROW): 2005–2010
Export Quotas
(tonnes REO)
Change from
Previous Year
ROW Demand (tonnes)
ROW Supply31
2005
(tonnes)
65,609 - 46,000 3,850
2006 61,821 -6% 50,000 3,850
2007 59,643 -4% 50,000 3,730
2008 56,939 -5% 50,000 3,730
2009 50,145 -12% 25,000 3,730
2010 30,258 -40% 48,000 5,700–7,700 Sources: Kingsnorth 2010, Koven 2010, Hatch 2010.
Reserves and Production of Lithium Currently, economically viable lithium resources are found mainly in South America.32 Globally, it is more economic to extract lithium in continental brines than in hard rocks or spodumene deposits. Among the continental brines, South American brines hold the most favorable lithium chemistry and are currently most economic to mine. However, lithium is found in many countries around the world, including China (continental brine) and the United States (continental brine, oil field brine and geothermal).33 Currently there is also excess production capacity of 46% and additional lithium mines could come on line if greater demand further increased prices.34
30 China issues export licenses for rare earths twice a year.
31 The production from the Commonwealth of Independent States is not available between 2005 and 2009, and that from other countries not available between 2006 and 2009 according USGS data. The 2010 production capacity outside China is estimated based on the 10,000–12,000 tonnes shortfall predicted by Hatch (2010). 32 Chile’s estimated reserve volume is at 7.5 million tonnes (USGS 2010a). 33 USGS 1994-2010a. 34 USGS, external review of earlier draft, November 17, 2010.
CRITICAL MATERIALS STRATEGY 35
In 2009 Chile, Australia and China together accounted for 78% of global lithium production.35 Globally, the biggest suppliers of lithium are Chemetall and SQM (Chilean), Tailson Minerals (Australian), FMC (American) and three mining companies in Sichuan, China (Roskill 2009; Baylis 2009). Chile accounts for 41%, Australia for 24% and China accounts for close to 13% of current global lithium production.36 China consumes most of its domestically produced lithium and is developing capacity to produce high-purity lithium compounds.37
The United States produced lithium minerals from hard rock ores until 1997, when the spodumene mine in North Carolina closed due to its inability to compete with South American brines. The United States currently has only one active lithium brine operation in Nevada.
38
Reserves and Production of Cobalt
Two U.S. companies produce and export a large array of value-added lithium materials produced from domestic and South American lithium carbonates (USGS 2010a).
Currently, most cobalt is produced as a byproduct of nickel and copper mining. The Democratic Republic of the Congo (DRC) produces 40% of global cobalt as a byproduct from copper mining and artisanal mining. DRC holds about half of the world’s identified cobalt
35 The global production does not include U.S. production data, information withheld by the USGS to avoid disclosure of proprietary information (USGS 2010a). 36 These shares are based on global production not including U.S. production (see the previous footnote). 37 China is the only country in the world still converting lithium minerals into compounds from spodumene or hard rocks, including imported lithium from spodumene in Australia (USGS, correspondence, August 24 2010). In fact, its annual domestic production of lithium minerals from hard rock ores has been rising by approximately 15% per year since 2000 (Roskill 2009). 38 USGS, 1994-2010a.
Text Box 3-2:
Coproducts and Byproducts
Unlike industrial materials such as copper and zinc that are produced as major products, the materials addressed here are minor metals (including specialty, precious, and “rare” metals) produced chiefly as coproducts or byproducts.
All REEs appear naturally in different combinations within a single mineral form, making it infeasible to mine for individual REEs. The packet of individual REEs can instead be considered as coproducts.
Other minor metals such as indium, tellurium, gallium, and most cobalt are primarily produced as byproducts of other mining operations. The availability of the byproduct is greatly influenced by the market dynamics of the major product.
Major product Co- or byproduct Nickel, copper Cobalt Copper Tellurium Zinc Indium, gallium Higher profit rare earth elements (Nd)
Lower profit rare earth elements (La, Ce, Sm)

CRITICAL MATERIALS STRATEGY 36
reserves.39 DRC experienced a recent civil war40and mining contracts awarded during the conflict under a transitional government were renegotiated. The country remains politically unstable and is one of the lowest ranked countries on the global Policy Potential Index.41
Cobalt produced as a major product (ores, concentrates and intermediate materials) occurs mostly in Morocco, but also via artisanal mining and recovery from previously stockpiled intermediate materials in DRC.
Nevertheless, the Cobalt Development Institute projects that DRC’s dominance over cobalt production will continue to grow in the near future (Cobalt Development Institute 2010).
42
The leading global producers of refined cobalt are China (39%), Finland (15%) and Canada (8%). China refines cobalt based on the primary cobalt imported from DRC (USGS 2010b). DRC used to be a leading cobalt refiner and will likely increase refinery production again.
43
The United States has not mined cobalt since 1971 and has not refined cobalt since 1985. In recent decades, the United States has been recovering negligible amounts of cobalt from Missouri’s lead ore and from the mining and smelting of platinum group metals (PGMs) in Montana. Imports, secondary sources (i.e., recycled scraps and spent materials) and stock releases have been the United States’ major sources of cobalt.
44
Reserves and Production of Gallium
Several projects are under development to expand cobalt production in the United States; the Idaho Cobalt Project plans to produce cobalt as a primary product in 1 to 2 years and two other projects will produce cobalt as byproducts—the Eagle Project nickel-copper mine in Michigan and the NorthMet Project copper-nickel-PGM mine in Minnesota (USGS 2010b).
Gallium exists in very small concentrations in ores of other metals, mostly bauxite and zinc. Most gallium is produced as a byproduct of treating bauxite to extract aluminum and the remainder is produced from zinc-processing residues. World resources of gallium in bauxite are estimated to exceed 1 billion kilograms, and a considerable quantity could be present in world zinc reserves. However, only a small percentage of this metal in bauxite and zinc ores is economically recoverable globally. An estimate of current reserves of gallium comparable to the definition of reserves of other minerals thus cannot be made (USGS 2010c).
39 Australia holds the next largest reserves or approximately 23% of the worldwide total. The United States possesses an estimated 33,000 tons of cobalt reserves or around 1% global reserves (USGS 2010b). 40 Cobalt production from the DRC occurs in the Copperbelt of Katanga Province, not in the conflict areas of North and South Kivu provinces (USGS correspondence 10/25). 41 The Policy Potential Index (PPI), generated annually by the Canadian Frasier Institute, is based on a survey of investors of mining ventures. It gauges the extent to which countries are putting up social and political barriers to entry. The index takes into account public policy factors such as taxation and regulation affecting exploration investment (McMahon and Cervantes 2010). 42 USGS, telephone communication, October 25 2010. 43 USGS, telephone communication, October 25, 2010. 44 USGS 1994-2010b.
CRITICAL MATERIALS STRATEGY 37
Assuming that the average content of gallium in bauxite is 50 parts per million (ppm), U.S. bauxite deposits, which are mainly sub-economic resources, contain approximately 15 million kilograms of gallium. Some domestic zinc ores also contain as much as 50 ppm gallium and, as such, could be a significant resource (USGS 2010c).45
Reserves and Production of Indium
Global primary production of indium is widely distributed because indium is a byproduct of a number of industrial minerals. Currently economic reserves of indium are concentrated in China (73%), Peru (4%), the United States (3%) and other countries (16%). Indium is recovered almost exclusively as a byproduct of zinc production. Significant quantities of indium are also contained in copper, lead and tin ores, but most deposits are sub-economic. Globally, half of indium refining takes place in China, followed by South Korea (14%) and Japan (10%). China implements export quotas on indium and indium products. The 2009 Chinese indium export quota was 233 tonnes, a 3% decline from the 2008 indium export quota of 240 tonnes. China is anticipated to continue to tighten its indium export quota to meet a growing domestic demand. Indium can be reclaimed from spent indium-tin-oxide (ITO) sputtering targets and cuttings generated during ITO target processing. Technology has been developed to recover indium directly from liquid crystal display (LCD) glass. Indium can also be recovered from tailings when the price is high.46
Reserves and Production of Tellurium
Australia, Belgium, China, Germany, Kazakhstan, the Philippines, Russia and the UK hold around 73 percent of global tellurium reserves. Most tellurium is recovered from processing copper deposits. With increased global concern over tellurium supply, companies are investigating other potential resources, such as gold telluride and lead-zinc ores with higher concentrations of tellurium. These ores are not currently included in the estimates of world tellurium resources (USGS 2010e).
3.2 Demand The two major drivers of demand for mineral commodities are the rate of overall economic growth, (stable or decline) and the state of development for principal material applications (e.g., clean energy technologies). Demand for key materials in clean energy technologies compete for available supply with demand for the same materials in other applications.47
45 Also based on multiple email exchanges and phone communication with USGS, October 4-7, 2010.
46 USGS 1994-2010d. 47 Generally and with respect to the key materials, demand for end-use items for building use (e.g., phosphors for lighting) or construction tend to be more cyclical, whereas those that enter big-ticket consumer items such as cars tend to be more volatile and sensitive to short-term economic movements. Uses that enter portable devices and personal consumer goods (e.g., batteries for portable electronics) tend to experience more stable demand (Humphreys, forthcoming). Regional factors are important also: China’s and India’s rapid economic growth have had and will continue to have a huge impact on global demand for mineral commodities (Eggert 2010).

CRITICAL MATERIALS STRATEGY 38
Several additional pieces of information are helpful for understanding demand-supply mismatches for the United States: domestic demand as a share of global demand, import dependence48
Table 3-4. U.S. Demand Characteristics of Key Materials
, stock releases, substitutes, recycling and greater material use efficiency. Import dependence and supply risks in general should be examined over the entire supply chain. A case in point is that around 40% of global cobalt mine production occurs in DRC whereas only around 2% of global refining of cobalt into metal occurs in DRC (USGS 2010f). This indicates that countries importing refined cobalt can still be indirectly dependent on cobalt from DRC, a politically unstable country.
Principal end uses (in volume) 49
Recycling and stock info
Reported use (tonnes) and U.S. consumption as percentage of global
U.S. import sources (top three only)
U.S. net import dependence (percentage of reported consumption)
Rare earth oxiode (REO)
Metal alloy Electronics
29% 18%
Small amount recovered from spent permanent magnets Producer and processor stock info withheld
15,500 (2008) 12.5% (2008)
Metals, compound, etc.:
100%
Chemical catalysts 14% China 91%
Phosphors 12% France 3%
Catalytic converters
9% Japan 3%
Polishing & ceramics
6%
Magnets 5%
Oil refining catalysts
4%
Lithium (LCE)
Ceramics & glass 31% Recycling insignificant but increasing; Producer stock info up to 1999 but withheld
6,280 (2009) 7% (2009)
Chile 63% >50% Batteries 23% Argentina 35% Greases 10% China 1% Air treatment 5% Continuous casting 4% Other 27%
Cobalt (metal)
Batteries 25% Cobalt from purchased scrap met 24% 2009 reported consumption; Industry year-end stock info available
7,000 (2009) 12 % (2009)
Norway 19% 75%
Super and other alloys
25% Russia 17%
Catalysts 10% China 12%
Magnetic alloys 7%
Carbides 13% Other chemical and ceramic uses
20%
Indium (metal)
Coatings (ITO for LCDs)
80% Recovery from manufacturing
120 (2009)
China 40% 100%
Japan 19%
48 Import dependence by itself need not be considered a risk factor. Rather, the possibility of supply disruptions is due to a combination of heavy import reliance and concentration of supply in a few companies or countries that may be unreliable suppliers. 49 End use shares are from the most recent USGS data available; the shares are global for Li and Co; and domestic for REEs, In, Te, and Ga. The data source for Te is Umicore (2010).

CRITICAL MATERIALS STRATEGY 39
wastes mostly in China, Japan and South Korea; recycling could rise significantly in U. S.; recovery from tailings viable
N.A. Canada 18% Others (alloy and solders; semiconducting compounds for LEDs; solar materials)
20%
Tellurium (metal)
Metallurgy 45% Little or no scrap to extract secondary tellurium Stock info withheld
50 tonnes50
~10% (est. based on Eggert (2010)
China 43% Not reported
Solar cells 25% Belgium 24%
Rubber processing & synthetic fiber
20% Canada 18%
Electronics 10%
Gallium (metal)
Integrated circuits 67% World gallium recycling capacity at 42% of 2009 production capacity51
29 (2008) 25%52
Germany
24% 99%
Optoelectronic devices (cell phones, backlights, flashes)
31% Canada 20%
Other 2% China 16%
Sources: USGS 2009-2010a-e, CDI 2009, Eggert 2010.
Historical Demand for Rare Earth Elements53
Recently, REE consumption has seen large regional growth mainly due to the growth of advanced technology and clean energy technology sectors. In China and globally, REEs have experienced fast growth in advanced technology sectors including luminescent (phosphors), magnetic, catalytic and hydrogen storage technologies.
54
The United States was responsible for around 12% of global rare earths demand (combined demand of REOs and REO equivalent of chlorides, compounds, alloys and metals) in 2009. U.S. demand for rare earths has drastically changed over the last 30 years. To meet domestic demand, the United States increasingly relies on imports of rare earth metals, alloy, compounds, oxides, among other forms of rare earth containing materials. At the same time, the United States has been exporting rare earth metals, alloys and compounds and in 2009, became for the first time a net exporter of
The demand by clean energy technology sectors is largely a result of the ramp-up of clean energy technology manufacturing and use by the United States, other Organization for Economic Co-operation and Development (OECD) nations and China. Magnets dominated REE usage by weight in 2008, with catalysts claiming the second-highest usage and metal alloys accounting for the third highest (Kingsnorth and Chegwidden 2010). REE consumption has grown most rapidly in China. China’s 2005 REO demand exceeded half of global demand for the first time and more than tripled in absolute terms between 2000 and 2008 (Chen 2010).
50 Based on information provided by USGS on September 14, 2010. 51 Canada, UK, US and Taiwan are involved in gallium recycling (USGS, correspondence, December 7, 2010). 52 Estimated share of U.S. gallium consumption out of global total is based on the 2008 global production number instead as global demand data for gallium is harder to determine and it is reasonable to assume that global Ga supply is at a similar level as global Ga demand; data source is USGS (correspondence 10/19). 53 Demand here refers to demand by manufacturers of materials for production rather than demand by households for final products containing the material. 54 China’s total annual rare earth consumption in these sectors has grown from a mere 1% in 1987 to 60% in 2008 (Chen 2010).

CRITICAL MATERIALS STRATEGY 40
REO equivalents.55
Figure 3-2 shows U.S. demand for all REO equivalents since 1970, along with its historical demand for three other key materials.
Figure 3-2. U.S. historical demand for REO equivalents, Li, Co and Ga Source: USGS 2010g
Historical Demand for Lithium Global lithium consumption is driven mainly by the growth of rechargeable lithium batteries and the strong economic growth of the emerging economies. The production of rechargeable lithium batteries grew by 25% per year between 2000 and 2007. Lithium used for battery production now accounts for more than 20% of total lithium consumption, compared to 6% in 2000 (Roskill 2009). Despite the 2009 economic downturn which led to lower demand, worldwide exploration for lithium proceeded, driven by strong economic growth in emerging markets. The major industrial uses for lithium—ceramics, glass, batteries and lubricating greases—have also benefited from robust economic growth in emerging markets.56
Figure 3-2 shows U.S. historical demand for lithium since 1970. From 2003–2007, lithium demand increased by about 8% but growth slowed to just 4% in 2008 due to the economic downturn. The United States has been mostly dependent upon lithium imports since the late 1990s, with its current
55 USGS 1994-2010. 56 Global end-use markets are estimated as follows: ceramics and glass, 31%; batteries, 23%; lubricating greases, 10%; air treatment, 5%; continuous casting, 4%; primary aluminum production, 3%; and other uses, 24% (USGS 2010a).
05000
1000015000200002500030000350004000045000
1970
1972
1974
1976
1978
1980
1982
1984
1986
1988
1990
1992
1994
1996
1998
2000
2002
2004
2006
2008
U.S. Historical Demand of REO equivalents, Co, Li and Ga (tonnes) 1970-2008
Cobalt Lithium Gallium (1000 t) REO equivalents

CRITICAL MATERIALS STRATEGY 41
imports coming chiefly from Chile and Argentina.57 The United States also consumes recycled lithium, though not at a significant level.58
Historical Demand for Cobalt
Cobalt demand is driven by general economic conditions and traditional demands from industries such as the superalloy sector and rechargeable battery manufacturing for small consumer device applications. The superalloy sector includes manufacturers of turbine engine parts for jet aircraft and land-based energy-generating turbines (USGS 2010b). Similar to other materials discussed in this chapter, cobalt consumption has seen a rapid rise in China (Cobalt Development Institute 2010).
The USGS estimates that in 2009, 49% of the cobalt consumed in the United States was used in superalloys, mainly in aircraft gas turbine engines; 9% in cemented carbides for wear-resistant applications and cutting; 15% in various other metallic applications; and 27% in a variety of chemical applications. Figure 3-2 on the previous page presents U.S. demand for cobalt since 1970.
The United States is currently about 75% import dependent upon cobalt coming from Norway, Russia and China. Recycled cobalt from purchased scrap helped the United States meet 24% of its domestic consumption in 2009 (USGS 2010b).
Historical Demand for Gallium Gallium demand is growing in several applications including light-emitting diodes (LEDs) used for liquid crystal displays in televisions and notebook computers and solar cells. In addition, its material intensity in solar cells has been declining thanks to efficiency improvements. Electronic components have represented about 98% of U.S. gallium consumption since 2003. In 2009, about 67% of the gallium consumed was used in integrated circuits (ICs). Optoelectronic devices, which include laser diodes, LEDs, photodetectors and solar cells, represented 31% of gallium demand.59
The United States represents about 25% of the global annual consumption of gallium. Since 1982, the United States has been dependent chiefly on imports for meeting its annual gallium demand.
The remaining 2% was used in research and development, specialty alloys and other applications. The global economic downturn hurt LED markets, although emerging LED market segments, such as for LCDs in televisions and notebook computers, still showed growth. At the same time, record-making solar cell efficiencies are reducing the need for gallium, among other materials, in making thin film solar cells (USGS 2010c).
60 The United States currently imports gallium from Germany (24%), Canada (20%), China (16%) and the Ukraine (12%).61
57 The United States has been re-exporting around half of its lithium imports since 2003 (USGS1994–2010c).
Figure 3-2 shows U.S. historical demand trends for gallium since 1970.
58 USGS 1994-2010a. 59 Optoelectronic devices were used in aerospace, consumer goods, industrial equipment, medical equipment and telecommunications. ICs were used in defense applications, high-performance computers and telecommunications (USGS 2010c). 60 Gallium stocks have met an average of 8% of annual demand in the United States since 1982 (USGS 1994–2010c). 61 The United States stopped exporting gallium in 1984 (USGS 1994-2010c).

CRITICAL MATERIALS STRATEGY 42
Substantial quantities of new scrap are being reprocessed, although data on the amount and usage are not available.
Gallium is used in a promising new category of photovoltaic (PV) solar cells based on an alloy of copper, indium, gallium and selenium. To date, this type of solar cell accounts for a very small share of the solar market (USGS 2010c).
Historical Demand for Indium Global demand for indium exploded about a decade ago due to its use in flat-panel displays, television sets, computer monitors and smart phones. Thin films of indium-tin-oxide (ITO) form an integral part of all three aforementioned items. Manufacturers of ITO thin films responded to high indium prices by recycling indium previously discarded as manufacturing waste. However, the amount of indium in each flat-panel product has largely remained the same.
Indium also enters the promising new category of PV solar cells referred to at the beginning of this page, along with copper and selenium. Again, this type of solar cell still accounts for a very small share of the solar market (USGS 2010d).
Figure 3-3. Historical demand for indium Source: USGS 2010g
The United States has been 100% dependent on imports for indium since 1972, with current indium imports coming from China, Japan and Canada.62
62 The United States had minimal stocks of indium from 1993 to 1998 and exported an average of 19% of its annual imports between 1999 and 2002 (USGS 1994-2010d).
In terms of secondary sources, indium is recycled from manufacturing wastes in China, Japan and the Republic of Korea—the countries in which most ITO production occurs. According to USGS, recovering indium from the tailings of zinc mining is possible when the price is high (USGS 2010d). Figure 3-3 presents the U.S. historical demand for indium since 1970.
02000400060008000
100001200014000
1970
1972
1974
1976
1978
1980
1982
1984
1986
1988
1990
1992
1994
1996
1998
2000
2002
2004
2006
2008
Historical Demand of In (100 tonnes) 1970-2008

CRITICAL MATERIALS STRATEGY 43
Historical Demand for Tellurium Tellurium is used in the production of high-performance solar cells. Cadmium telluride is one of the most promising thin-film photovoltaic compounds for power generation, achieving some of the highest power conversion ratios. Despite a drop in the overall demand for solar cells in 2009 due to the economic downturn, the demand for cadmium telluride solar cells continued to rise.
Information about U.S. tellurium demand and imports is difficult to obtain without disclosing proprietary data. However, it is known that the United States’ principal tellurium import sources are China, Belgium and Canada. Several materials, including selenium, can replace tellurium in most of its uses, but usually with losses in production efficiency or product characteristics. There is little or no scrap from which to extract secondary tellurium because the uses of tellurium are nearly all dissipative in nature. A small amount of tellurium is recoverable from scrapped selenium-tellurium photoreceptors employed in older photocopiers in Europe (USGS 2010e), but this has decreased over time.
3.3 Prices Supply risks, at least in the short-to-medium term, are less associated with the prospect of increasing prices because in most cases the cost of these elements is a small part of the final product manufacturing cost. However, in the last 6–12 months the price of many rare earth elements has increased by approximately 300–700%, which in some cases has had a more significant impact on the price of the final product (Lynas Corp. 2010).63
Main Factors driving the prices of key materials
The 1980s and 1990s were a time of over-supply of minerals due to decreased demand for commodities following the two oil shocks of the 1970s. Supplies of many minerals rose in the 1980s when major mines opened, particularly in Latin America and Southeast Asia and in the 1990s when large volumes of metals entered global markets after the collapse of the Soviet Union. The lengthy period of over-supply hindered the price of any mineral from rising above its short-term marginal cost for a sustained period (Humphreys, forthcoming).
In contrast to the 1980s and 1990s, price concerns are more salient today as the market has moved from one where there was oversupply of minerals to one where there is more concern about undersupply. The decline in the value of the U.S. dollar has contributed to higher metal prices when they are presented in terms of U.S. dollars. As most mineral markets are priced in dollars, the declining value of the dollar leads to higher prices for many metals. A sustained demand boom for many commodities, mainly driven by Asia’s rapid industrialization, has followed the recovery from the 2001 economic recession. The rapid rise in demand, particularly from China and the decline in the value of the U.S. dollar have in many cases driven the prices to a historical high though not necessarily led to a sustained high price level.
63 For example, in August 2010 W.R. Grace established a rare earth surcharge that increased the price of its fluid cracking catalysts and additives due to rapidly increasing rare earth prices (W.R. Grace 2010).
CRITICAL MATERIALS STRATEGY 44
Despite the rising demand and the historical high prices reached by many commodities, mine capacity expansions and new mine production capacity have not kept pace. Some factors behind delayed development are region specific, though a major cause has been the generally rising costs of metal production and production capacity expansion.64
Overall, the price of minerals is driven by multiple physical, financial and political factors. When deciphering price data and trends, it is helpful to know whether there is a market surplus or deficit and the extent of the imbalance. Physical parameters (e.g., stock changes, closures of old mines and the start-up of new ones) are in turn influenced by general economic conditions and financial forecasts (e.g., inflation and exchange rates) that inform investor sentiments. Unanticipated shocks— such as monopolistic or oligopolistic pricing (e.g., export quotas), geopolitics and natural disasters— also play a role in affecting physical and financial parameters.
The economic crisis in 2009, which made it more difficult for projects to get financing, caused further delays.
To understand the price behavior and volatility of key materials, it is also important to examine the ways in which these commodities are bought and sold, in conjunction with whether they are produced as a co- or byproduct of other specialty metals (e.g., REEs) or a by-product of a major metal. Both aspects influence the price behavior and volatility of a mineral. The influences of these factors can be gleaned from a comparison between the historical price trends of commodities produced as a byproduct of metals traded on major exchanges and commodities mainly transacted through bi-lateral contracts.
Negotiated pricing and metal exchanges Most rare, precious, minor and specialty metals and their alloys are traded through bilateral contracts based on negotiated pricing between parties. The fragmented nature of some of these markets and the remoteness of some producers has resulted in traders playing a dominant role. Regionally, traders account for a large part of the specialty metal supply coming out of regions such as China, the former Soviet Union and Africa. The nature of the process limits price disclosure in these markets and the prices of specialty metals quoted by traders and consultants vary widely in their reliability (Humphreys, forthcoming). Though not considered a minor mineral, lithium prices have been available mainly through trade journals.
Several of the key materials considered in this Strategy are produced as by-products of nickel, copper or zinc refining. These three major metals are some of the most economically important, non-ferrous metals. They are typically traded and priced on metal exchanges such as the London Metal Exchange (LME) and the New York Mercantile Exchange (Nymex). As of 2008, it was possible to trade all three of these primary metals on the LME. The Nymex offers contracts in copper. Trading via metal exchanges indicates a larger volume of transactions compared to negotiated trading. The large scale of trades through the LME or the Nymex is also due in part to the opportunity for
64 Examples cited in Humphreys (forthcoming 2011) include the power shortage concerns in Southern Africa and Chile where mining is important; water, which is required in large quantities by mining and is becoming scarcer and more expensive in some parts of the world; a move toward smaller and higher cost deposits and resources; and increasing political barriers to entry.

CRITICAL MATERIALS STRATEGY 45
hedging and speculating. As a result, price data on metals transacted through metal exchanges are large in volume and available in most areas of the world.
Table 3-5 summarizes the purchase options and price information sources for the key minerals considered in this Strategy. Among these materials, cobalt, indium and tellurium are byproducts of metals (i.e., nickel, copper and zinc) that trade on metal exchanges. By contrast, rare earth oxides and rare earth metals are typically traded through long- or short-term bilateral contracts.
Table 3-5. Purchase Option and Source of Price Information for Key Materials of Concern
Minerals/Metals Purchase option Source of price info
Rare earth elements
Negotiated purchase, not traded on metal exchanges and therefore no spot or future market; however, illegally-traded REEs are sold through less formal channels and may possibly be sold on the spot markets
Trade journals, based on information from producers, consumers and traders
Cobalt (most), gallium65
Negotiated purchase, not traded on metal exchanges and therefore no spot or future market (except for indium and small amount of cobalt)
, tellurium, indium, lithium
Trade journals, based on information from producers, consumers and traders
Cobalt (small share)
Cobalt became tradable on LME in February, 2010. Producers registered with LME for trading certain brands of cobalt so far maintain a combined warehoused amount of 115 tonnes, which is small compared with the 60,000 tonnes global cobalt market; spot market
Information available globally from the exchange
Nickel (Ni), copper (Cu), zinc (Zn)
LME, copper is also traded on COMEX (part of NYMEX)
Information available globally from the exchange; trade journals
Sources: Humphreys, forthcoming; USGS.66
Joint production and prices
Byproduct or coproduct material availability is influenced by the commercial attractiveness of the associated major product (see Text Box 3-2). For example, if the price of the major product falls, less mining of ore containing the major product will occur and, as a result, there will be less byproduct available to recover. Or, if the price of the byproduct rises, such a price rise alone may have little or no impact on the amount of major product ore that is mined and thus the amount of the byproduct may remain unchanged, despite the higher price.
Commodities that do not trade on metal exchanges or do not have a market on which to be sold to a buyer of last resort (e.g., rare earths and lithium) face greater pressure to respond to market conditions by cutting output when a producer cannot find a buyer or storage space. In such markets, volume change is the common mechanism used rather than price adjustments or price swings (Humphreys, forthcoming).
65 In China, gallium is also traded through informal metals exchanges where transparent pricing and a spot market are present. 66 USGS, external review of earlier draft, November 17, 2010.

CRITICAL MATERIALS STRATEGY 46
Historical price data The following are historical price trend data and accompanying information for the materials examined in this report (except for tellurium due to unavailable data). For each price trend, a description of the factors and reasons behind major price shifts is given. Generally, each minor metal exhibits somewhat different price trends due to peculiarities in each market (e.g., indium dominated by ITO demand in electronics and flat-panel displays, cobalt prices in 2008-2009 reflecting supply disruptions in Africa and Canada, etc.). This is in sharp contrast to price behavior of major metals (such as Ni and Cu) which is more heavily influenced by overall gross domestic product growth and macroeconomic conditions. The fortunes of the minor metals are more closely tied to a small number of end-use sectors and often a small number of producers. As a result, minor metal markets are more fragile than the major metal markets (Eggert 2010).
Figure 3-4 illustrates the historical average prices of individual rare earth oxides between 2001 and 2010. This period covers the 2001 recession, which had lingering effects until 2003, and the 2008–2009 recession. Two things to note are that the heavier rare earths (e.g., dysprosium, terbium and europium) are relatively more expensive, and that prices have risen fairly steadily since 2003 due to China’s rising domestic demand and escalating export controls. The price jumps from 2009–2010 can perhaps be attributed to a reduction in China’s rare earth export quota. The export quota which is for total rare earth exports, resulted in higher prices for REO exports. This led to an unexpected fall in China’s export of LREEs which are generally lower priced. As a result of the greater scarcity of light rare earths, the price of LREEs rose much more than the HREEs. Rare earth oxide and rare earth metal prices track closely, with the prices for metals always higher (though relatively more so for some rare earth elements than others) (British Geological Survey 2010).
Figure 3-4. REO (Purity 99% min) prices from 2001–2010 Source: Lynas Corp 2010a
0
100
200
300
400
500
600
700
Jun-
01
Jun-
02
Jun-
03
Jun-
04
Jun-
05
Jun-
06
Jun-
07
Jun-
08
Jun-
09
Nov
-10
$/kg
REO
Lanthanum
Cerium
Neodymium
Praseodymium
Samarium
Dysprosium
Europium
Terbium
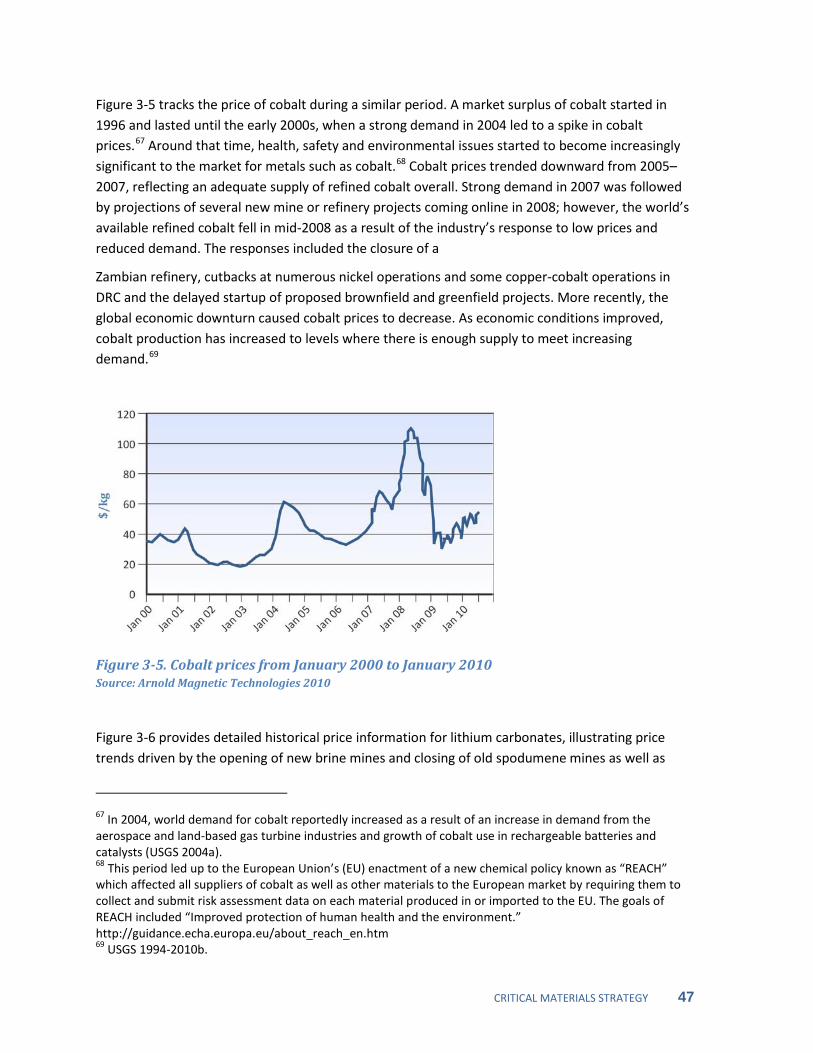
CRITICAL MATERIALS STRATEGY 47
Figure 3-5 tracks the price of cobalt during a similar period. A market surplus of cobalt started in 1996 and lasted until the early 2000s, when a strong demand in 2004 led to a spike in cobalt prices.67 Around that time, health, safety and environmental issues started to become increasingly significant to the market for metals such as cobalt.68
Zambian refinery, cutbacks at numerous nickel operations and some copper-cobalt operations in DRC and the delayed startup of proposed brownfield and greenfield projects. More recently, the global economic downturn caused cobalt prices to decrease. As economic conditions improved, cobalt production has increased to levels where there is enough supply to meet increasing demand.
Cobalt prices trended downward from 2005–2007, reflecting an adequate supply of refined cobalt overall. Strong demand in 2007 was followed by projections of several new mine or refinery projects coming online in 2008; however, the world’s available refined cobalt fell in mid-2008 as a result of the industry’s response to low prices and reduced demand. The responses included the closure of a
69
Figure 3-5. Cobalt prices from January 2000 to January 2010 Source: Arnold Magnetic Technologies 2010
Figure 3-6 provides detailed historical price information for lithium carbonates, illustrating price trends driven by the opening of new brine mines and closing of old spodumene mines as well as
67 In 2004, world demand for cobalt reportedly increased as a result of an increase in demand from the aerospace and land-based gas turbine industries and growth of cobalt use in rechargeable batteries and catalysts (USGS 2004a). 68 This period led up to the European Union’s (EU) enactment of a new chemical policy known as “REACH” which affected all suppliers of cobalt as well as other materials to the European market by requiring them to collect and submit risk assessment data on each material produced in or imported to the EU. The goals of REACH included “Improved protection of human health and the environment.” http://guidance.echa.europa.eu/about_reach_en.htm 69 USGS 1994-2010b.
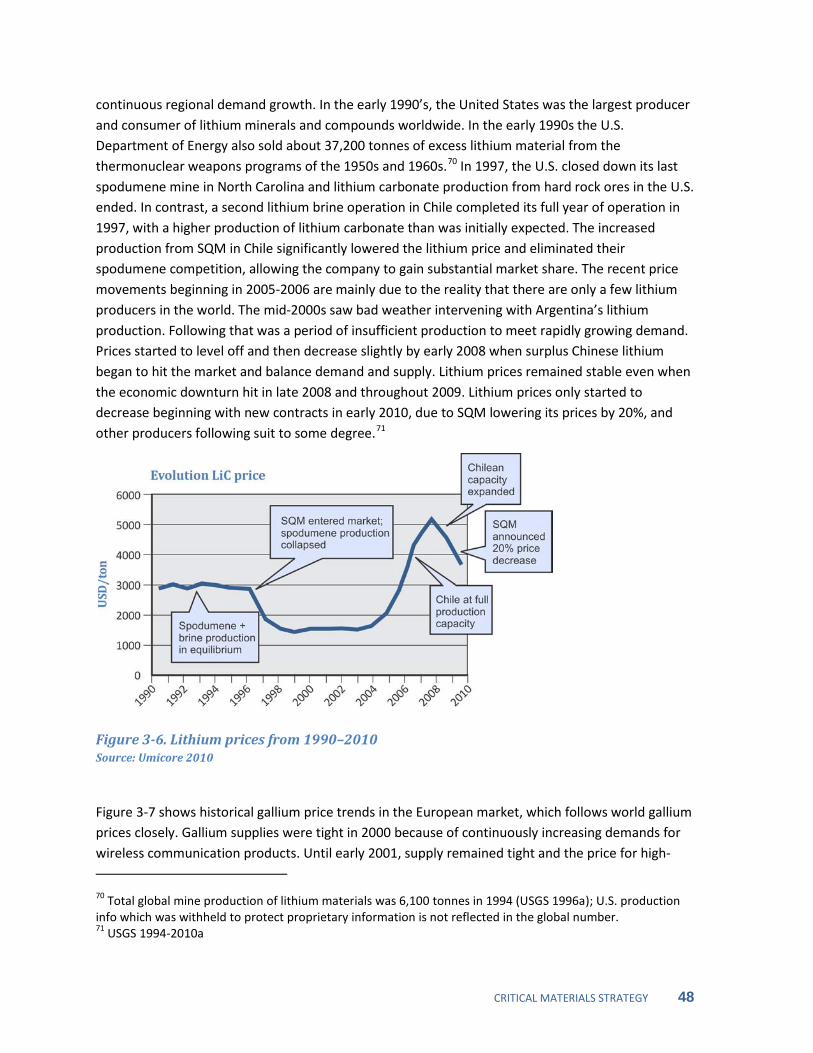
CRITICAL MATERIALS STRATEGY 48
continuous regional demand growth. In the early 1990’s, the United States was the largest producer and consumer of lithium minerals and compounds worldwide. In the early 1990s the U.S. Department of Energy also sold about 37,200 tonnes of excess lithium material from the thermonuclear weapons programs of the 1950s and 1960s.70 In 1997, the U.S. closed down its last spodumene mine in North Carolina and lithium carbonate production from hard rock ores in the U.S. ended. In contrast, a second lithium brine operation in Chile completed its full year of operation in 1997, with a higher production of lithium carbonate than was initially expected. The increased production from SQM in Chile significantly lowered the lithium price and eliminated their spodumene competition, allowing the company to gain substantial market share. The recent price movements beginning in 2005-2006 are mainly due to the reality that there are only a few lithium producers in the world. The mid-2000s saw bad weather intervening with Argentina’s lithium production. Following that was a period of insufficient production to meet rapidly growing demand. Prices started to level off and then decrease slightly by early 2008 when surplus Chinese lithium began to hit the market and balance demand and supply. Lithium prices remained stable even when the economic downturn hit in late 2008 and throughout 2009. Lithium prices only started to decrease beginning with new contracts in early 2010, due to SQM lowering its prices by 20%, and other producers following suit to some degree.71
Figure 3-6. Lithium prices from 1990–2010 Source: Umicore 2010
Figure 3-7 shows historical gallium price trends in the European market, which follows world gallium prices closely. Gallium supplies were tight in 2000 because of continuously increasing demands for wireless communication products. Until early 2001, supply remained tight and the price for high- 70 Total global mine production of lithium materials was 6,100 tonnes in 1994 (USGS 1996a); U.S. production info which was withheld to protect proprietary information is not reflected in the global number. 71 USGS 1994-2010a
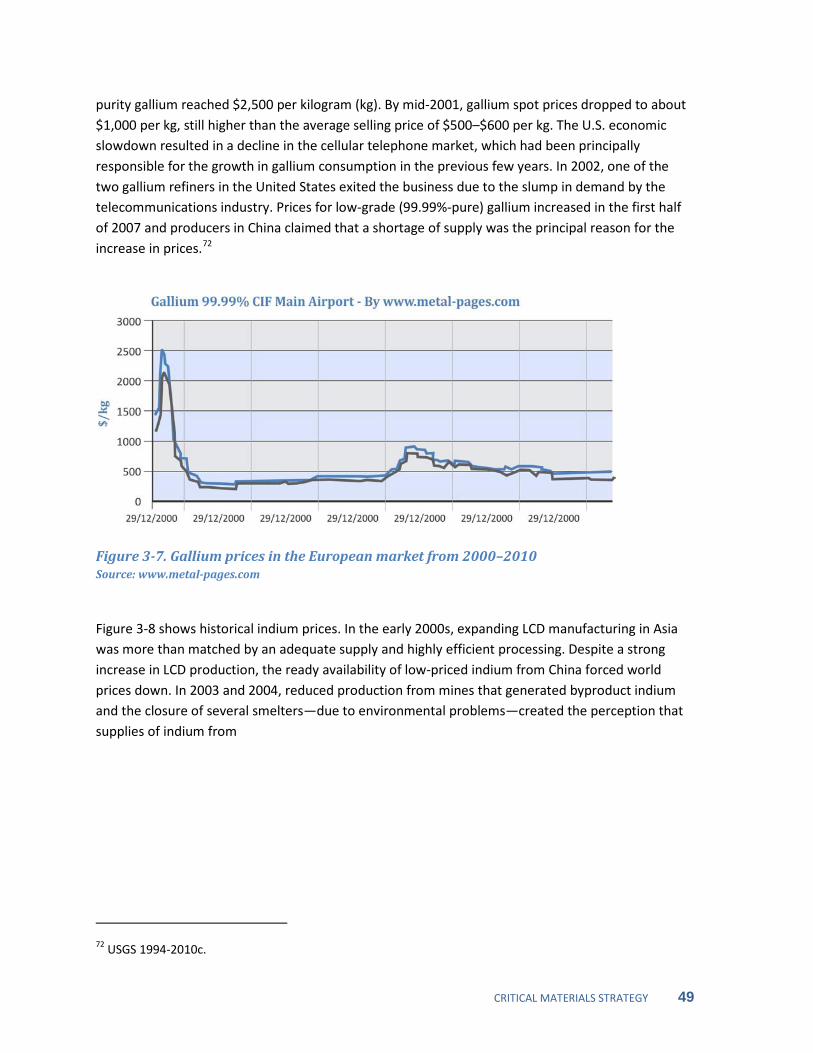
CRITICAL MATERIALS STRATEGY 49
purity gallium reached $2,500 per kilogram (kg). By mid-2001, gallium spot prices dropped to about $1,000 per kg, still higher than the average selling price of $500–$600 per kg. The U.S. economic slowdown resulted in a decline in the cellular telephone market, which had been principally responsible for the growth in gallium consumption in the previous few years. In 2002, one of the two gallium refiners in the United States exited the business due to the slump in demand by the telecommunications industry. Prices for low-grade (99.99%-pure) gallium increased in the first half of 2007 and producers in China claimed that a shortage of supply was the principal reason for the increase in prices.72
Figure 3-7. Gallium prices in the European market from 2000–2010 Source: www.metal-pages.com
Figure 3-8 shows historical indium prices. In the early 2000s, expanding LCD manufacturing in Asia was more than matched by an adequate supply and highly efficient processing. Despite a strong increase in LCD production, the ready availability of low-priced indium from China forced world prices down. In 2003 and 2004, reduced production from mines that generated byproduct indium and the closure of several smelters—due to environmental problems—created the perception that supplies of indium from
72 USGS 1994-2010c.

CRITICAL MATERIALS STRATEGY 50
Figure 3-8. Indium prices from 2000–2010 (99.99% pure metal in $/kg) Source: metal-pages.com
China would decrease and drove world indium prices to historic highs. The indium price continued its remarkable rise into the fall of 2005, driven by continued strong sales of flat-panel displays and other LCD products that increased global consumption of ITO. Global secondary indium production increased significantly during 2005–2007 and accounted for a greater share of indium production than primary production by 2007. Global ITO demand continued to rise, leading to some price spikes caused by supply deficits and the indium supply’s heavy dependence on the strength of the zinc market (USGS 1994–2010d).
3.4 Conclusions This chapter addressed the historical supply, demand and price data for materials important to clean energy technologies. These materials have already seen a rise in demand driven by one or more uses, and the United States is heavily import-dependent for most of them. These materials are also predominantly co-produced with other metals, resulting in additional supply risks. Although there are secondary sources for some of these materials from recovered scrap and stock releases, such sources still meet a relatively small share of U.S. and/or global demand (except for indium). Among the materials of interest, other than the rare earths, the United States appears to have some level of diversity in terms of import sources. However, the complex supply chain could still lead to an indirect reliance on these less stable sources. Information about future supply and demand, as well as an assessment of the potential mismatch between supply and demand for each material, is presented in Chapter 7.
References Arnold Magnetic Technologies. 2010. “Response to DOE Request for Information.” June 5, 2010.
Baylis, R. 2009. “From Zhejiang to Zabuye: China’s Mountainous Path to A Self-sufficient, Integrated, Lithium Industry,” Presented at the LSM Conference, Santiago, January.

CRITICAL MATERIALS STRATEGY 51
British Geological Survey. 2010. Rare Earth Elements. Nottingham, UK: Natural Environment Research Council. http://www.bgs.ac.uk/downloads/start.cfm?id=1638
Chen, Z. 2010. “The development and policies of China rare earth industry.” Presented to the 6th International Conference on Rare Earth Development and Application, August 2–6, Beijing. http://www.cs-re.org.cn/en/modules.php?name=News&file=article&sid=35.
“China May Issue 12th Five-year Plan for Rare Earth Industry in September.” 2010. Business China. July 26. http://en.21cbh.com/HTML/2010-7-26/China-Rare%20earth.html.
Cobalt Development Institute. 2009. Cobalt Supply and Demand 2009. Cobalt Facts.
http://www.thecdi.com/cdi/images/documents/facts/cobalt_facts-supply_demand-09.pdf
Cobalt Development Institute. 2010. “Response to DOE Request for Information.” June 7.
Eggert, P. G. 2010. “Critical Minerals and Emerging Technologies.” Issues in Science and Technology, Summer.
General Electric, 2010. Submission to U.S. Department of Energy in Response to Request for Information on Rare Earth Elements and Other Technology Metals.
Hatch, G. 2010. “Effect of China's REE Export Cuts.” The Gold Report. http://www.theaureport.com/pub/na/6821.
Humphreys, D. Forthcoming 2011. “Pricing and Trading in Metals and Minerals,” In SME Mining Engineering Handbook. Littleton, CO: Society of Mining, Metallurgy, and Exploration.
IMCOA. 2010. Rare Earth Market Analysis. “Submission by the company Molycorp as part of Molycorp’s response to DOE Request for Information.” May.
Kingsnorth, D. 2010. “Rare Earths: Facing New Challenges in the New Decade.” Presented at the annual meeting for the Society for Mining, Metallurgy, and Exploration, Phoenix, February 27–March 4.
Kingsnorth, D. and J. Chegwidden. 2010. “Rare Earths: Facing the Uncertainties of Supply.” Presented at the 6th International Rare Earth Conference, Hong Kong, November.
Koven, P. 2010. “China Imposes Export Quotas on Rare Earth Elements.” Financial Post, July 12.
Lynas Corp. 2010. What are their prices? Under What Are Rare Earths? http://www.lynascorp.com/page.asp?category_id=1&page_id=25
Lynas Corp. 2010a Annual Report 2009.
http://www.lynascorp.com/content/upload/files/Reports/Annual_Report_2009_778195.pdf
MBendi Information Services. 2010. “World Nickel and Cobalt Mining - Mining and production.” http://www.mbendi.com/indy/ming/nkcb/p0010.htm.
McMahon, Fred and Miguel Cervantes. 2010. 2009/2010: 2010 Mid-Year Update. Frazier Institute. Van Couver, BC. http://www.fraserinstitute.org/uploadedFiles/fraser-ca/Content/research-news/research/publications/miningsurvey-2010update.pdf
CRITICAL MATERIALS STRATEGY 52
Molycorp. 2010. “ Rare Earth Minerals:The Indispensable Resource for Clean Energy Technologies.” Presented at the 2nd Annual Strategic Materials Conference, DMTC, Cleveland, OH. February 1-2, 2010.
Roskill. 2009. “The Economics of Lithium,” summary only. http://www.roskill.com/reports/minor-and-light-metals/lithium.
Roskill. 2010. “Rare Earths: An Evaluation of Current and Future Supply.” Presentation by Judith Chegwidden to the 2010 Rare Earth Summit, Beijing, August 4-5.
Simbol Mining. 2010. “Response to DOE Request for Information.” June 7.
Umicore USA. 2010. “Response to DOE Request for Information.” June 6.
USGS (U.S. Geological Survey). 1994–2010. Mineral Commodity Summaries: Rare earths. Reston, VA: USGS.
USGS (U.S. Geological Survey). 1994–2010a. Mineral Commodity Summaries: Lithium. Reston, VA: USGS.
USGS (U.S. Geological Survey). 1994–2010b. Mineral Commodity Summaries: Cobalt. Reston, VA: USGS.
USGS (U.S. Geological Survey). 1994–2010c. Mineral Commodity Summaries: Gallium. Reston, VA: USGS.
USGS (U.S. Geological Survey). 1994–2010d. Mineral Commodity Summaries: Indium. Reston, VA: USGS.
USGS (U.S. Geological Survey). 1994–2010e. Mineral Commodity Summaries: Tellurium. Reston, VA: USGS.
USGS (U.S. Geological Survey). 2004f. USGS Minerals Yearbook 2004 Volume I: Cobalt chapter. Reston, VA: USGS.
USGS (U.S. Geological Survey). 2008f. USGS Minerals Yearbook Volume I: Cobalt chapter. Reston, VA: USGS.
USGS (U.S. Geological Survey). 2008g. USGS Minerals Yearbook Volume I: Gallium chapter. Reston, VA: USGS.
USGS (U.S. Geological Survey). 2010f. USGS Minerals Yearbook Volume I: Cobalt chapter. Reston, VA: USGS.
USGS (U.S. Geological Survey). 2010g. Historical statistics for mineral and material commodities in the United States. Reston, VA: USGS.
USGS (U.S. Geological Survey). 2010h. 2010 Mineral Commodity Summary: Bauxite and Alumina. Reston, VA: USGS.
USGS (U.S. Geological Survey). 2010i. “Cobalt Slides,” presented to the U.S. Department of Energy, May, 2010.
CRITICAL MATERIALS STRATEGY 53
USGS (U.S. Geological Survey). 2010j. Table of Rare Earth Elemental Breakdown by Select Sites, information provided by USGS to the Department of Energy, September, 2010.
W.R. Grace & Co. 2010. "Grace Announces Rare Earth Surcharge for FCC Catalysts and Additives.” August 25. http://www.grace.com/Media/NewsItem.aspx?id=1463179.
China Daily. 2009. “China Mulls Plans to Curb Rare Earth Smuggling.” September 14. http://www.chinadaily.com.cn/bizchina/2009-09/14/content_8690293.htm.

CRITICAL MATERIALS STRATEGY 54
Chapter 4. Current DOE Programs Several U.S. Department of Energy (DOE) data and information programs, research and development (R&D) programs and financial instruments address rare earths and other key materials. Current programs focus on the component and end-use technology stages of the supply chain and address both the economic and the innovation dimensions of the clean energy sector.
4.1 Data and Information Data and information can inform economic policies and R&D priorities both inside and outside DOE. The Energy Information Administration (EIA), an independent agency within the DOE, collects, analyzes and disseminates independent and impartial energy information. EIA is the nation’s premier source of energy information. The EIA has been studying the supply of rare earth materials, the consumption of those materials in clean energy technologies and impacts of rare earth use on technology cost and performance. EIA plans to develop improvements to existing surveys to monitor the deployment of technologies that use the materials.
4.2 Research and Development DOE R&D programs supporting scientific and technological innovation range from basic research to large-scale technology deployment. DOE supports programs from low-risk, evolutionary projects to high-risk, high-payoff experiments. These programs span the entire energy innovation pipeline but are closely connected (Figure 4-1). DOE also supports R&D addressing specific materials and alternatives across the supply chain. In Fiscal Year (FY) 2010, the Office of Science, the Office of Energy Efficiency and Renewable Energy (EERE) and the Advanced Research Projects Agency-Energy (ARPA-E) together provided approximately $15 million for research on rare earth materials and possible substitutes for magnets. An additional $35 million was spent by ARPA-E on next generation battery technologies that don’t require rare earths.
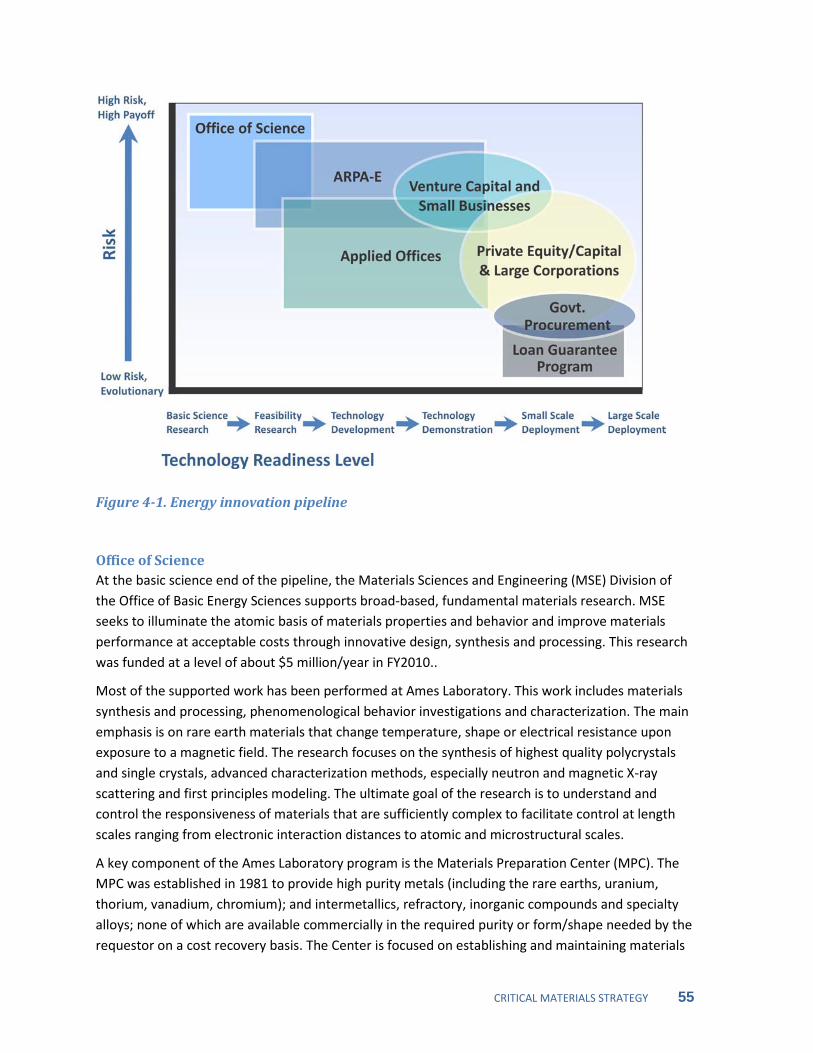
CRITICAL MATERIALS STRATEGY 55
Figure 4-1. Energy innovation pipeline
Office of Science At the basic science end of the pipeline, the Materials Sciences and Engineering (MSE) Division of the Office of Basic Energy Sciences supports broad-based, fundamental materials research. MSE seeks to illuminate the atomic basis of materials properties and behavior and improve materials performance at acceptable costs through innovative design, synthesis and processing. This research was funded at a level of about $5 million/year in FY2010..
Most of the supported work has been performed at Ames Laboratory. This work includes materials synthesis and processing, phenomenological behavior investigations and characterization. The main emphasis is on rare earth materials that change temperature, shape or electrical resistance upon exposure to a magnetic field. The research focuses on the synthesis of highest quality polycrystals and single crystals, advanced characterization methods, especially neutron and magnetic X-ray scattering and first principles modeling. The ultimate goal of the research is to understand and control the responsiveness of materials that are sufficiently complex to facilitate control at length scales ranging from electronic interaction distances to atomic and microstructural scales.
A key component of the Ames Laboratory program is the Materials Preparation Center (MPC). The MPC was established in 1981 to provide high purity metals (including the rare earths, uranium, thorium, vanadium, chromium); and intermetallics, refractory, inorganic compounds and specialty alloys; none of which are available commercially in the required purity or form/shape needed by the requestor on a cost recovery basis. The Center is focused on establishing and maintaining materials
CRITICAL MATERIALS STRATEGY 56
synthesis and processing capabilities crucial for the discovery and development of a wide variety of use-inspired, energy-relevant materials in both single crystalline and polycrystalline forms, spanning a range of sizes with well-controlled microstructures.
The Office of Science also supports the development and validation of models to theoretically identify promising structures and compositions in order to synthesize rare earth materials with optimum properties. This Materials by Design approach also is informing the search for compounds that are suitable rare earth substitutes.
Advanced Research Projects Agency-Energy Moving along the pipeline to applied research via feasibility research, technology development and demonstration, ARPA-E supports two initial projects totaling $6.6 million specifically targeted to developing substitutes for rare earth magnets. The goal of this $4.4 million project is to develop materials to allow the United States to fabricate the next generation of permanent magnets (PMs) with magnetic energy density (maximum energy product) up to two times higher than the current value of the strongest commercially available neodymium-iron-boron (Nd-Fe-B) magnets. If successful, this project will lead to cheaper, more energy-efficient, more power-dense magnets for deployment in a wide range of clean energy technologies.
In another ARPA-E project, General Electric Global Research (GE) is developing next-generation permanent magnets with a lower content of critical rare earth materials. For the $2.2 million project, GE is developing bulk nanostructured magnetic materials with a dramatic increase in performance relative to state-of-the-art magnets. These new magnets will increase the efficiency and power density of electric machines while decreasing dependence on rare earth minerals. If successful, this project will lead to technologies for scaled manufacturing of low-cost, reduced rare-earth-content, high-energy-density PMs.
Addressing the challenge of rare-earth and critical-materials-containing batteries, particularly in the emerging hybrid and electric vehicle transportation sectors, the Batteries for Electric Energy Storage in Transportation (BEEST) program invested $35 million in first-of-kind demonstration of new batteries and storage chemistries, structures and technologies. Disruptive technology approaches such as magnesium-ion and rechargeable metal-air batteries from earth-abundant resources are being investigated in this high-technology-risk/high-impact program. If successfully demonstrated through the BEEST program, these technologies will point the way towards batteries for transportation that will exceed the capabilities of the best state-of-the-art lithium-ion technologies.
Office of Energy Efficiency and Renewable Energy The Office of Energy Efficiency and Renewable Energy (EERE)is supporting an applied magnet research project valued at $2 million (FY 2010) at Ames Laboratory. This project is focused on fabricating high-performance, cost-effective PMs that can be used for traction motors with an internal PM rotor design. Improving the alloy design and processing of PMs is essential to meeting performance and cost goals for advanced automotive electric drive motors. Technical requirements that the fully developed PM materials must meet for vehicle applications drive the project, such as adequate magnetic flux and coercivity for operation at elevated temperatures (180°C–200°C).
CRITICAL MATERIALS STRATEGY 57
Requirements for material mechanical properties also impact manufacturing and assembly costs and may significantly influence the total motor cost. The Ames Laboratory project is first developing anisotropic magnets based on the high-temperature, rare-earth-based alloy previously designed for isotropic bonded magnets. As this alloy is rare-earth-based, it has the potential to address short-term needs but not long-term market concerns. The project is also developing high-performance magnet materials that do not contain rare earth constituents.
In addition to the magnet material research, EERE’s Vehicle Technologies Program supports two projects valued at a total of $1.4 million (FY2010) at Oak Ridge National Laboratory investigating alternative motor designs that do not use rare earth PMs. Engineers are designing switched reluctance motors without PMs that can be manufactured with reduced fabrication costs and torque and speed characteristics similar to permanent magnet machines. A second project is developing a flux coupling motor with performance comparable to a PM machine. The objective is to produce cheaper traction drives and reduce system costs through lower current-rated components in the inverter and reduced transmission costs. In addition, in 2009, the Vehicle Technologies Program awarded $9.5 million to Toxco, to expand an existing battery recycling facility in Ohio and become the first U.S. facility to recycle lithium-ion vehicle batteries.
For wind power applications, reducing magnet size by developing higher flux density magnets is more important than consistent properties at elevated temperatures. EERE’s Wind and Water Technologies Program is supporting QM Power, Inc., with $398,005 to develop a higher flux density PM generator. There are also much larger investments within EERE in battery, PV and lighting R&D that have key materials use implications.
4.3 Financial Instruments DOE administers several programs that provide financial support for clean energy deployment. These include programs that provide loan guarantees and tax credits. None of these programs authorize DOE to provide financial support for mineral extraction or materials processing. However, several of these programs authorize DOE to support domestic manufacturing of component technologies (such as permanent magnets) that use critical materials.
Loan Guarantee Program The Loan Guarantee Program (LGP) was established under Title XVII of the Energy Policy Act (EPAct) of 2005. It supports the production of clean energy components and end-use technologies. Section 1703 of EPAct 2005 authorizes loan guarantees supporting “new or significantly improved technologies to avoid, reduce or sequester air pollutants or anthropogenic emissions of greenhouse gases.” The American Recovery and Reinvestment Act of 2009 (ARRA) added section 1705, which establishes additional loan guarantee authority to support “renewable energy systems, including incremental hydropower, that generate electricity or thermal energy, and facilities that manufacture related components.”
The LGP lacks legal authority to provide loan guarantees for mineral extraction or processing because such projects do not meet the statutory requirements of either Section 1703 or 1705.
CRITICAL MATERIALS STRATEGY 58
The LGP is authorized to provide loan guarantees to support domestic manufacturing of component technologies that use critical materials if those technologies meet the statutory tests. Projects supported by the program have the potential to affect market demand for key materials. For example, the LGP has recently issued loan guarantees to Solyndra ($535 million), Kahuku Wind Power ($117 million) and Beacon (Flywheel) ($43 million). Solyndra manufactures CIGS PV cells. Kahuku Wind and Beacon each use rare earth PMs.
Advanced Technology Vehicles Manufacturing Incentive Program The Advanced Technology Vehicles Manufacturing (ATVM) Loan Program provides loans to automobile and automobile part manufacturers to re-equip, expand or establish manufacturing facilities in the United States to produce advanced technology vehicles or qualified components, and for the associated engineering integration costs. Vehicles with efficiency standards that will contribute to a clean energy economy are included in the definition of advanced technology vehicles. The ATVM lacks authority to directly support extraction and production of key materials. However, the ATVM issued loans to companies for projects that may affect the market demand of nickel metal hydride (NiMH) or Lithium ion batteries and NdFeB permanent magnet motors. These companies include Ford Motor Company ($5.9 billion), Nissan North America ($1.6 billion), Tesla Motors ($465 million) and Fisker Automotive ($529 million).
Tax Credits The ARRA authorizes the Secretary of the Treasury, in consultation with the Secretary of Energy, to award tax credits for qualified investments in new, expanded or re-equipped domestic manufacturing facilities for clean energy technologies. The goal of the Advanced Energy Manufacturing Tax Credit—codified in Section 48c of the Internal Revenue Code—is to expand the domestic manufacturing industry for clean energy. Tax credits have been issued to manufacturers in a number of relevant energy technology areas, including solar thin film, LED lighting, wind turbine components and electric vehicles.
CRITICAL MATERIALS STRATEGY 59
Chapter 5. Other U.S. Government Programs There is significant ongoing work in other federal agencies that supports and complements the U.S. Department of Energy (DOE) engagement on critical materials. Important contributions include collection and publication of data, analyses of demand, development of trade policies and support of research. In addition, there is a growing opportunity to coordinate and integrate relevant work through the White House Office of Science and Technology Policy (OSTP).
5.1 Office of Science and Technology Policy Interagency collaboration on materials research and related policy is led by the OSTP. Since early 2010, OSTP has hosted an Interagency Working Group on Rare Earth Elements. This working group has coordinated interagency analysis and policy development relating to the evolving rare earth situation. In late 2010, a charter was signed for a Subcommittee on Critical and Strategic Mineral Supply Chains, under the Committee on Environment, Natural Resources and Sustainability (CENRS). The purpose of the new Subcommittee is to advise and assist the CENRS on policies, procedures and plans relating to risk mitigation in the procurement and downstream processing of critical and strategic minerals. Functions of the Subcommittee include identifying critical and strategic minerals and identifying cross-agency research and development opportunities.
5.2 U.S. Geological Survey The U.S. Geological Survey (USGS) collects, analyzes and disseminates information on the domestic and international supply of and demand for minerals and materials essential to the U.S. economy and national security. USGS also provides assessments of undiscovered mineral resources in the United States and around the world. Researchers and decision makers use this information to understand the factors underlying an adequate and dependable supply of minerals and materials. This information also illuminates costs and risks related to the environment, energy and economics. The USGS National Minerals Information Center publishes reports in the annual Mineral Commodity Summaries and Minerals Yearbook for the group of rare earths, platinum-group metals, lithium, tellurium, indium and other key materials.
The public and private sectors rely on USGS minerals information and assessments to better understand the use of materials and the ultimate disposition of materials in the economy. USGS minerals information also informs the efficient use of national resources. In addition, USGS minerals information is used to forecast future supply of and demand for minerals. Domestic and international minerals information is used to analyze policies, formulate plans to deal with shortages and interruptions in mineral supplies and develop strategies to maintain a competitive position in the global economy.
5.3 U.S. Department of Defense
Studies and Analysis Recognizing the evolution of the market for rare earth elements (REEs), in the summer of 2009 the Office of Industrial Policy/AT&L, Department of Defense (DoD) self-initiated a review of the U.S. supply chain. The study is based on available forecasts and data from multiple sources and as a
CRITICAL MATERIALS STRATEGY 60
result, most of the data are available only at the aggregate level of all REE. The study reviews the U.S. supply chain for both commercial and defense demand of REE. The study also assesses gaps in the supply chain and their potential implications for the Department.
The rationale for this effort included the U.S. dependence on a sole supplier that is not domestic, the importance of REE in certain defense applications and forecasts for a surge in demand for commercial end uses that could strain global supplies. Recent events in the global market for REE have reinforced the Department's concern regarding reliable and secure supplies of REE.
National Defense Stockpile Program In the United States, stockpiling is largely the province of DoD, which maintains a National Defense Stockpile (NDS) managed by Defense Logistics Agency (DLA). The NDS Program was established in 1939 to preclude dependence on foreign sources in times of national emergency. NDS holdings grew to 90 commodities in 85 locations by 1994, when Congress first authorized the sale of excess NDS inventory. Since then, the NDS has liquidated approximately $7 billion in commodities and reduced its holdings to 25 managed commodities at 17 locations. However, the current NDS system focuses solely on the physical stockpiling of raw materials rather than the entire defense supply chain. It also requires separate authorizing legislation for each material.
At the direction of Congress in 2006, DoD initiated a review of the NDS led by the Office of the Secretary of Defense (OSD). The results of that review, presented in an April 2009 report to Congress, included a plan for establishing a comprehensive Strategic Materials Security Management System (SMSMS) that would identify, on an ongoing basis, those strategic and critical materials required for national security (OSD 2009).
The Strategic Military Stockpile Program (SMSP) concept would include limited physical stockpiles used in conjunction with friendly nation agreements and long-term supply chain partnerships to provide assurances for military equipment manufacturers regarding material price and availability. The OSD report also recommended holding physical reserves of 13 materials (including cobalt) while continuing to monitor and study 40 other materials (including gallium, indium, tellurium and yttrium).
5.4 Other Agencies and Departments A number of other agencies and departments have important roles and interests in the global materials supply chain and related innovation system. Mine permitting is handled by the U.S. Department of the Interior and the U.S. Environmental Protection Agency (EPA). Global trade analysis and policy is under the U.S. Department of Commerce, the U.S. Department of State and the U.S. Trade Representative. The U.S. Department of State embassy officials report on relevant policies of host governments, as well as on private sector efforts and local markets. The National Institute of Standards and Technology (NIST) sets engineering standards for the manufacturing sector. In addition to DOE, the National Science Foundation, the National Oceanic and Atmospheric Administration, NIST and the EPA support relevant research.

CRITICAL MATERIALS STRATEGY 61
References OSD (Office of the Secretary of Defense). 2009. Reconfiguration of the National Defense Stockpile Report to Congress. Washington, DC: U.S. Department of Defense.

CRITICAL MATERIALS STRATEGY 62
Chapter 6. Materials Strategies from Other Nations Raw materials policies vary greatly between nations, due to differences in natural resources, systems of governance and industrial make-up. Different methods of addressing materials requirements provide meaningful lessons and may help inform DOE’s approach to this issue. The raw materials policies of Japan, the European Union (EU), the Netherlands, China, South Korea, Australia and Canada represent a broad range of national interests, resource characteristics and policy goals. Table 6-1 outlines each nation’s policy goals, business policy, research policy and materials of interest.
Table 6-1. Policy Goals, Business Policies, Research and Development Policies and Materials of Interest for Each Nation
Nation Goal Business Policy R&D Policy Materials of Interest
Japan Secure a stable supply of raw materials for Japanese industries
• Funding for international mineral exploration
• Loan guarantees for high-risk mineral projects
• Stockpiling • Information gathering
• Substitution research funded through METI and MEXT
• Exploration, excavation, refining and safety research funded through JOGMEC
Ni, Mn, Co, W, Mo, V**
European Union
Limit the impact of potential material supply shortages on the European economy
• Mineral trade policy for open international markets*
• Information gathering* • Land permit streamlining* • Increased recycling
regulations*
• Increased material efficiency in applications
• Identification of material substitutes
• Improve end-of-life product collection and recycling processes
Sb, Be, Co, Ga, Ge, In, Mg, Nb, REEs, Ta, W, Fluorspar and Graphite
Netherlands Reduce material consumption to prevent global shortages by employing “managed austerity”
• Government-industry collaboration on material policy through the M2i Institute
• Substitutes of abundant or renewable materials
• Processes for recycling depleting materials
• Study consumption patterns as a result of policy
Ag, As, Au, Be, Bi, Cd, Co, Ga, Ge, Hg, In, Li, Mo, Nb, Nd, Ni, Pb, Pd, PGMs, REEs, Re, Ru, Sb, Sc, Se, Sn, Sr, Ta, Te, Ti, V, W, Y, Zn, Zr

CRITICAL MATERIALS STRATEGY 63
Table 6-1. Policy Goals, Business Policies, Research and Development Policies and Materials of Interest for Each Nation
Nation Goal Business Policy R&D Policy Materials of Interest
China Maintain a stable supply of raw materials for domestic use through industry consolidation, mitigating overproduction and reducing illegal trade
• Taxes and quotas on REE exports
• Prohibition of foreign companies in REE mining
• Industry consolidation • Unified pricing
mechanisms* • Production quotas • Moratorium on new
mining permits until mid-2011
• Rare earth separation techniques and exploration of new rare earth functional materials
• Rare earth metallurgy; optical, electrical, and magnetic properties of rare earths; basic chemical sciences of rare earths
Sb, Sn, W, Fe, Hg, Al, Zn, V, Mo, REEs
South Korea Ensure a reliable supply of materials critical to Korean mainstay industries
• Financial support for Korean firms at overseas mines
• Free Trade Agreements and MOUs with resource-rich nations
• Stockpiling
• Recycling end-use products
• Designing for recyclability
• Substitute materials • Production efficiency
As, Ti, Co, In, Mo, Mn, Ta, Ga, V, W, Li and REEs
Australia Maintain investment in the mining industry while fairly taxing the depletion of national resources
• Low tax on the value of extracted resources
• High tax on mine profits • Tax rebates for mineral
exploration • Fast turnaround for land
permit applications
• Promote sustainable development practices in mining
Ta, No, V, Li and REEs
Canada Promote sustainable development and use of mineral and metal resources, protect the environment and public health and ensure an attractive investment climate
• Promote a recycling industry and incorporate recycling as part of product design
• Require accountability in environmental performance and mineral stewardship
• Use life-cycle-based approach to mineral management and use
• Provide comprehensive geosciences information infrastructure
• Promote technological innovation in mining processes
• Develop value-added mineral and metal products
Al, Ag, Au, Fe, Ni, Cu, Pb, Mo
*proposed policy **current reserves

CRITICAL MATERIALS STRATEGY 64
6.1 Japan Japan’s materials policy is based on the nation’s limited domestic resources and the importance of many rare metals to the manufacturing of electronics and automobiles. The policy’s goals, as outlined in the 2009 “Strategy for Ensuring Stable Supplies of Rare Metals,” include (i) maintaining a stable supply of metals for Japanese industries by securing overseas sources of critical materials; (ii) recycling rare scrap metals; (iii) developing alternative materials; and (iv) stockpiling some rare metals (METI 2009). Japan’s raw materials policy is guided by the Ministry of Economy, Trade and Industry (METI) and implemented by the Japan Oil, Gas and Metals National Corporation (JOGMEC) and the Japan Bank of International Cooperation (JBIC), with support from other ministries and government institutions. In 2007, the budget for Japanese mineral resource policy was roughly $70 million (Kawamoto 2008).
JOGMEC is an independent administrative institution owned by the Japanese government that enacts government policy but independently controls its own budget and management. JOGMEC promotes a stable supply of metal resources through five activity areas:
• Providing partial funding for overseas field surveys through the Joint Basic Exploration Scheme
• Providing loan guarantees and other financial assistance to high-risk mine development projects
• Maintaining stockpiles of seven metals—nickel, chromium, manganese, cobalt, tungsten, molybdenum and vanadium—while closely monitoring the availability of Indium, rare earth elements, platinum, gallium, niobium, tantalum and strontium
• Gathering and disseminating information on mineral availability and policies in various nations
• Funding and engaging in scientific research on new types of exploration, mining and recycling (JOGMEC 2007).
According to a 2008 METI strategy statement in response to geopolitical developments in global mineral supply, the Japanese government will also provide diplomatic assistance to Japanese companies engaging in mining projects abroad by giving official development assistance to mining and transportation infrastructure projects (METI 2008).
Japanese firms are actively securing the raw materials needed for their operations. Toyota Motor Corporation established a rare earth task force to monitor its supply chain and, through its trading company Toyota Tsusho, invested in a rare earth mining joint venture in Vietnam in 2008 to export rare earths to Japan (AP 2010). Likewise, Japanese trading house Sumitomo Corporation established a joint venture in Kazakhstan with the goal of producing 3,000 tons of rare earths per year (Japan Looks Past 2010).
METI, the Ministry of Education, Culture, Sports, Science and Technology (MEXT) and the government-affiliated New Energy and Industrial Technology Development Organization (NEDO) also directly fund research projects on substitutes for and efficient use of rare metals. Recent research projects have focused on reducing the material used in rare metals technologies and

CRITICAL MATERIALS STRATEGY 65
substituting rare metals with more abundant ones. In October 2010, NEDO and Hokkaido University announced the development of a motor for hybrid and electric vehicles that does not use rare earth elements, instead utilizing magnets from less expensive and more common ferrite materials (Japan Looks Past 2010, Tabuchi 2010).
6.2 European Union European Union nations rely heavily on imported rare metals and products containing rare metals. In response to recent demand increases caused by emerging technologies (e.g., tantalum use in cell phones), the European Commission established the Raw Materials Initiative to limit the impact that material supply shortages may have on the European economy.
The Raw Materials Initiative contains three policy pillars:
Maintain access to raw materials in world markets on the same conditions as international competitors—enforce World Trade Organization trade policy and the provision of development aid in resource-rich nations to support good governance, a sound investment environment and environmentally safe practices.
Establish EU framework conditions that foster a sustainable domestic supply of raw materials—maintain congruent data on mineral availability and mining regulations among member states; streamline the land permitting process for mining; support research on extraction and processing; and initiate university education programs for mining science.
Increase resource efficiency and recycling to reduce consumption of raw materials (Commission of the European Communities 2008)—fund research in reduced-material product designs, recycling and material substitutes; improve end-of-life product collection in all member states; and enforce export restrictions for recyclable waste.
The European Commission recently released a study assessing materials for criticality, as defined by the value each material adds to the European economy and the material’s potential for an international supply shortage. Fourteen of the 41 materials studied were identified as exhibiting a high supply risk and high economic importance: antimony, beryllium, cobalt, fluorspar, gallium, germanium, graphite, indium, magnesium, niobium, platinum group metals, rare earth metals, tantalum and tungsten (European Commission, Enterprise, and Industry 2010).
The European Commission plans to solicit research proposals for deep sea mining, material substitutes and recycling and recovery of critical materials. Total research funding will be at least $34.5 million.
6.3 Netherlands The Netherlands, a member of the EU, is developing its own rare metals strategy based on its concern that the rapid depletion of raw materials is partially due to over-consumption, and thus “managed austerity” should be part of the remedy. According to a report published by M2i – a public-private partnership between the Dutch government, universities and industry—the fruitful exploration for, and extraction of, rare metals will not continue to fulfill all of this century’s needs. Instead, governments must prepare for material scarcity by promoting the substitution of plentiful

CRITICAL MATERIALS STRATEGY 66
or renewable materials for rare metals, more efficient use of depleting metals and efficient and productive recycling (M2i 2009). The rare metals strategy will be developed in collaboration between government, universities, industry and research organizations.
The Netherlands will use research and development funding to develop and implement these strategies. The Netherlands Organization for Scientific Research (NWO) established a research theme titled “Materials: Solutions for Scarcity”, which includes the development of substitute materials (both mineral and bio-based) for depleting resources, processes for recycling metals in post-consumer products and social science research in policy effects on consumption patterns. As an initial budget, the organization has allocated $10 million over the next four years for the research theme.
6.4 China As a major producer and rapidly increasing consumer of raw materials, China’s policy goals are to maintain a stable supply of materials for the Chinese economy and reduce illegal mining, overproduction and smuggling of its domestic resources. These goals specifically concern REEs, of which China is the world’s leading producer.
In the past decade, China has moved toward supporting domestic markets for REEs. In 2007, the Ministry of Commerce declared most rare earth elements and products to be strategic commodities and the State Council placed new restrictions on foreign investment in the REE sector. These developments prohibited outright foreign investment in REE mining—requiring that foreign investors form joint ventures with domestic firms in the processing of rare earth ores—and officially encouraged foreign investment in the more value-added manufacturing of rare earth magnets, metal alloys and powders. China further restricted foreign access by abolishing export tax rebates in 2005 and introducing a new REE export tax in 2006. Export tax rates have since been raised and now range from 15%–25% for different elements. Between 2004 and 2009, the overall REE export quota was reduced by more than 20% from about 65,000 tons to about 50,000 tons rare earth oxides (REOs). In July 2010, China further reduced its export quota to 30,258 tons REO, a 40%decrease from 2009.
While attempts to exert more control over the rare earth industry have recently gained momentum, there remain a number of challenges. Illegal mining and smuggling, for instance, are major issues for Chinese mining policy. In 2010, the Ministry of Land and Resources, responsible for issuing mining licenses, decided to stop issuing new licenses until mid-2011 (Muyuan 2010). However, illegal mining of REEs continues. Moreover, the enforcement of environmental and other mining regulations varies by province, which can lead to severe environmental degradation associated with rare earth mines. Poor environmental protection compliance across the industry often results in thorium residues being disposed into unlined tailing facilities and insufficiently treated water reaching nearby rivers.
To further protect domestic resources Chinese officials are planning to create sizable stockpiles as well. In February 2010, the regional government of Inner Mongolia authorized a “strategic reserve” of REEs to be established in the autonomous region (Yan and Yijun 2010). In October 2010, it was

CRITICAL MATERIALS STRATEGY 67
reported that Bautou Steel‘s plan to acquire and set aside up to 300,000 tons of rare earths within five years was approved by the Chinese government (China May Launch Rare 2010).
China has supported rare earths R&D efforts since the 1950s and currently sponsors two key national research programs and four state laboratories. Researchers focus on REE separation techniques; the exploration of new REE functional materials; and optical, electrical and magnetic properties of REEs. Other programs focus on REE basic chemical sciences including solid state chemistry, bioinorganic chemistry, chemical biology and separation chemistry. The Baotou Research Institute, established in 1963, focuses specifically on rare earth metallurgy, environmental protection, new materials and applications in traditional industries. The Chinese Society of Rare Earths publishes two academic journals dedicated to rare earths: the Journal of Rare Earth and the China Rare Earth Information (CREI) Journal.
6.5 Republic of Korea Like Japan, the Republic of Korea (South Korea) focuses its materials strategy on minerals deemed critical to the competitiveness of its commercial industries in consumer electronics, information technology, automobile manufacturing and clean energy. A policy plan, “Plans for Stable Procurement of Rare Metals,” is being drafted by the Ministry of Knowledge Economy and seeks to spend $15 million by 2016 in order to secure 1,200 metric tons of rare earth elements in addition to developing domestic mines for other rare metals (AP 2010). South Korea has identified 56 elements of interest, including 11 that it defines as “strategic critical,” based on rarity, unfavorable geological distribution and price instability. South Korea is seeking to decrease its heavy dependence on imported raw material inputs through the following four-pronged approach:
• Government-backed investment in the exploration of foreign sources of rare metals
• Increased stockpiles with the flexibility to meet the country’s needs
• Reduced consumption through the development of substitutes
• Increased recycling and reuse of materials from end-use products (Bae 2010)
• South Korea’s base metals stockpile program—modeled after Japan’s—has announced plans to expand its holdings to 15 metals, including cobalt and titanium (OSD 2009).
South Korean firms are also beginning to implement this strategy with the help of the government. The state-owned Korea Resources Corporation (Kores) plans to spend $285.2 million in 2010 to develop overseas mines of lithium, nickel, uranium, copper and manganese in Africa and Latin America (Ha-won 2010). In March 2010, Kores partnered with Korean steelmaker Posco to take a controlling stake in China’s Yongxin Rare Earth Metal Co., enabling Posco to bypass China’s export quotas of rare earth oxides by achieving direct access and gaining the ability to export rare earths back to South Korea legally (Yang 2010).
South Korea plans to focus its R&D efforts on 40 core technologies through the Korea Institute of Industrial Technology, a government-funded research center (Han 2010). Recycling rare metals from end-use products and designing for recyclability at the production stage are particularly important. Scrap piles of used products (called “urban mines”) can be used to recover rare metals and, based
CRITICAL MATERIALS STRATEGY 68
on the standardization of recycling systems, can be placed at the beginning of the supply chain as additional resource inputs.
6.6 Australia Mining accounts for 7% of Australia’s national economy (USGS 2008). Australia’s national mining policy is managed by the Department of Resources, Energy, and Tourism. Policy goals involve balancing a stable investment environment that promotes mining industries, fair regulation and taxation of national resources with sustainable extraction and use of finite earth materials. Major issues in mining policy include taxes, permitting, information gathering and the stockpiling of mineral reserves.
Australia imposes taxes on its mining sector principally under state and territory jurisdictions, although the Australian federal government has suggested it may establish a profit tax on certain mineral commodities at a rate of 30%–40% (Smith 2010). In order to promote exploration and stabilize investments, Australia allows mining companies to deduct expenses or claim rebates for exploration costs and to roll over losses or profits between years. Australia is consistently ranked the country with the fastest permitting time by the international mining consultant firm Behre Dolbear (Behre Dolbear 2010).
6.7 Canada Canada is the world’s largest exporter of minerals and metals, with natural resource mining accounting for 4% of its gross domestic product. National mining policy is managed by Natural Resources Canada, but primary responsibility for mining oversight falls under provincial jurisdiction. At the federal level, the government uses a mix of policies in finance and taxation, regulatory efficiency and investment and export promotion to maintain a globally competitive industry (Natural Resources Canada 1996). Canada also maintains a relatively flexible and favorable regulatory regime that seeks to avoid duplication, minimize uncertainty and delays and harmonize federal and provincial rules. While Canada has extensive mining and environmental regulations, it still ranks ninth out of 25 nations in terms of permitting time by Behre Dolbear (Behre Dolbear 2010). Canada stores copper, gold, lead, molybdenum, nickel, silver and zinc in quantities from 0.5%–4% of national annual production levels.
References AP (Associated Press). 2010. “Nations Wary of Dependence on China’s Rare Earths.” Associated Press, October 4.
Bae, J. 2010. “Strategies and Perspectives for Securing Rare Metals in Korea.” Discussion white paper.
Behre Dolbear. 2010. 2010 Ranking Of Countries for Mining Investment. s.l.: Behre Dolbear.
“China May Launch Rare Earth Strategic Reserve Mechanism Next Year – Source.” 2010. Business China, October 27. Accessed November 3. http://en.21cbh.com/HTML/2010-10-27/xNMDAwMDIwMzIxNA.html

CRITICAL MATERIALS STRATEGY 69
Commission of the European Communities. 2008. The Raw Materials Initiative—Meeting our Critical Needs for Growth and Jobs in Europe. Brussels: Commission of the European Communities.
European Commission, Enterprise and Industry. 2010. Critical raw materials for the EU. s.l.: Fraunhofer ISI.
Han, J. 2010. “Rare Metal Research Center Opens.” Korea Times, January 28.
Ha-won, J. 2010. “Kores Sees Golden Opportunity to Increase Mine Holdings.” Seoul Joongang Daily, June 4.
“Japan Looks Past China for Metals.” 2010. Asahi Shimbun, October 1.
JOGMEC (Japan Oil, Gas and Metals National Corporation). 2007. “JOGMEC's Activities.” Accessed June 21, 2010. http://www.jogmec.go.jp/english/activities/index.html.
Kawamoto, H. 2008. “Japan's Policies to be adopted on Rare Metal Resources.” Science & Technology Trends, April 2008.
METI (Ministry of Economy, Trade, and Industry). 2008. “Guidelines for Securing Natural Resources.” Accessed July 10, 2010. http://www.meti.go.jp/english/press/data/nBackIssue20080328_05.html.
METI (Ministry of Economy, Trade, and and Industry). 2009. “Announcement of ‘Strategy for Ensuring Stable Supplies of Rare Metals’.” Accessed July 10, 2010. http://www.meti.go.jp/english/press/data/20090728_01.html.
Muyuan, C. 2010. “Applications for Rare Earth Mining Suspended.” China Daily, March 16.
M2i (Materials Innovation Institute). 2009. Material Scarcity. Delft, The Netherlands: M2i.
Natural Resources Canada. 1996. The Minerals and Metals Policy of the Government of Canada: Partnerships for Sustainable Development. Ottawa, Canada: Government of Canada.
OSD (United States Office of the Secretary of Defense). 2009. Reconfiguration of the National Defense Stockpile Report to Congress. Washington, DC: U.S. Department of Defense.
Smith, P. 2010. “Australia plans 40% tax on mining sector.” Financial Times, May 2.
Tabuchi, H. 2010. “Japan Recycles Minerals from Used Electronics,” New York Times, October 4, 2010.
USGS (United States Geological Survey). 2008. 2008 Minerals Yearbook: Australia. Reston, VA: U.S. Department of the Interior.
Yan, Z. and Y. Yijun. 2010. “Rare Earth Reserve Approved.” China Daily, February 11.
Yang, H. 2010. “Posco Acquires Chinese Rare Earth Firm.” China Daily, June 11.

CRITICAL MATERIALS STRATEGY 70
Chapter 7. Supply and Demand Projections In this chapter, we explore the extent to which more widespread deployment of clean energy technologies could lead to imbalances of supply and demand for rare earth elements (REEs) and other key materials. To assess these risks, we compare the projected levels of demand for each key material with projected levels of supply.
7.1 General Methodology for Estimating Future Demand for Key Materials Future demand for key materials will come from both clean energy and non-clean energy sources. This section discusses the general methodology for estimating future demand for key materials in both categories.
The first step in projecting demand for key materials is to estimate expected demand in non-clean-energy technologies. These include mobile communication devices, polishing powders and flat screen televisions (discussed in more detail later in Chapter 3 and Appendix A). Time and resource constraints precluded projections for each of the many non-clean energy technologies that use REEs and other key materials. Instead, this analysis assumes that demand for key materials in non-clean energy technologies increases at the rate of growth for the global economy projected in the International Energy Agency’s World Energy Outlook 2009. 73
The next step in projecting demand for key materials is to estimate expected annual demand in clean energy technologies. This analysis focused on four main components of rare earth elements and other key materials among clean energy technologies. Those four components are:
Accordingly, that demand is projected to increase from its 2010 level at a compound annual growth rate of 3.3% during the period from 2010–2015, and at a compound annual growth rate of 3% from 2015–2025. To estimate non-clean energy demand in 2010 for each material, an estimate of current clean energy demand (Trajectory B as described below) is subtracted from total material demand in 2010.
• Permanent magnets (used in wind turbines and electric vehicles)74
• Advanced batteries (used in electric vehicles)
• Thin-film semiconductors (used in photovoltaic (PV) power systems)
• Phosphors (used in high-efficiency lighting systems)
Estimates of future demand for key materials in clean energy applications were calculated as the product of three factors:
1. Deployment: total units of the generic clean energy technology in a given year 2. Market Share: the percentage of installations captured by a specific clean energy
technology
73 Some historical data and basic growth projections exist for non-clean energy applications; however, future demand will be governed by complex market dynamics, including the extent to which increased clean energy demand prompts innovations that reduce material requirements for all applications. 74 Vehicles with electric drive-trains include hybrid gasoline-electric and diesel-electric vehicles, plug-in hybrid electric vehicles and all-electric vehicles.
CRITICAL MATERIALS STRATEGY 71
3. Material intensity: demand for the material in each unit of the clean energy component
Looking out over the period from 2010–2025, the rate of future technology deployment for wind turbines, advanced vehicles, photovoltaic power systems and high-efficiency lighting is highly uncertain. Also uncertain are the particular components that will succeed and support technology deployment. To assess the risk of future material supply-demand imbalances, a High Penetration case and a Low Penetration case were developed. The High Penetration case combines a high level of global deployment for the generic technology with a high market share captured by the specific clean energy technology. The Low Penetration case combines a low level of global deployment for the generic technology with a low market share captured by the specific clean energy technology.
There is also significant uncertainty about the amount of material needed for each clean energy application, the material intensity, looking forward to 2025. To account for this uncertainty, a Low Materials Intensity case was constructed reflecting a low, but feasible estimate of material required per unit of technology deployed. A High Materials Intensity case was similarly constructed describing a high but feasible estimate of material required.
High and low values for material intensity and market share represent best estimates of these parameters in the short and medium term. Global deployment rates, on the other hand, are not intended to be predictive. For magnets, batteries and photovoltaics, global deployment is based on International Energy Agency (IEA) estimates of technology deployment under different assumptions about national policies and clean energy objectives. For phosphors, global deployment is based on linear growth of historical demand.
For each material, the high and low assumptions for rates of technology deployment, market share and material intensity were combined and added to the non-clean energy demand to develop four distinct demand trajectories. Two trajectories, labeled Trajectory A and Trajectory B, reflect the slower rate of penetration for each application and represent combinations of the Low Penetration case with the high and low assumptions respectively for material intensity. Similarly, two trajectories, called Trajectory C and Trajectory D, represent combinations of the High Penetration case with the respective low and high material intensity assumptions. In the figures comparing future supply and demand for each material that appear later in this chapter, Trajectories A and B are shown in blue and Trajectories C and D are shown in green. Also in those figures, high material intensity cases (Trajectories B and D) are shown as solid lines and low material intensity cases (Trajectories A and C) are shown as dashed lines. The characteristics describing Trajectories A, B, C and D are in Table 7-1.

CRITICAL MATERIALS STRATEGY 72
Table 7-1. Assumptions to Estimate Future Trajectories of Material Demand
Trajectory of Demand
MARKET PENETRATION Material intensity of the Clean Energy Component
Global Deployment Level of the Generic Technology
Market Share of Specific Clean Energy Technology
Trajectory A Low Low Low Trajectory B Low Low High Trajectory C High High Low Trajectory D High High High
None of the four trajectories analyzed in this report is intended to imply a prediction of future demand for clean energy technologies or key materials used in making them. That demand will depend on a number of factors, including technological progress, policy consistency and macroeconomic conditions. Instead, the trajectories are intended to illustrate a range of future possibilities and explore the impact of different assumptions concerning technology deployment rates, market shares and material intensity on future requirements for rare earth elements and other key materials. Trajectories A and D will represent the lower and upper extremes, respectively, for probable material demand.
In the following sections, these four trajectories are calculated for each key material in clean energy technologies. For key materials that are used in several clean energy technologies, the trajectories of future demand are presented as an aggregate for all relevant technologies. The contribution of each application is noted in the discussion of the figure. For example, Trajectory A demand for neodymium represents the sum of non-clean energy demand plus the Trajectory A requirements for magnets used in wind turbines plus the Trajectory A requirements for magnets used in vehicles with electric drive-trains.
7.2 Short- and Medium-Term Supplies of Key Materials The Earth’s crust contains sufficient rare earth elements and other key materials to meet projected demand in the decades ahead. However, short- to medium-term growth demand for these materials in clean energy technology and other applications may strain the ability of supply chains to provide global markets with a smooth flow of materials at stable prices. The first step in the supply chain—mines—often requires a number of years to be brought on line. This section describes potential production increases of rare earth elements and other elements in the next five years and longer. The figures in sections 7.3–7.6 show 2010 production with a solid red line and total production by 2015 with a dashed red line.
Short- and Medium-Term Supplies of Rare Earth Elements Around the world, there are many promising mineral deposits that could be developed to meet future growth in demand for rare earths. These deposits are found on at least six continents, including significant resources in Asia, Australia, North America and Africa. Whether a deposit can be mined economically will depend on a number of factors, including rare earth prices, regulatory requirements and improvements in extraction and separation technologies.

CRITICAL MATERIALS STRATEGY 73
Potential production from new mines coming on line before 2015 is shown in Table 7.2. The Mount Weld mine (Australia) is currently slated to come on line in 2011. (Ores from the Mount Weld mine will be sent to Malaysia for separation and refining.) The Mountain Pass mine (California) is projected to come on line in late 2012, after setting up new refining and manufacturing facilities at the site. Projected annual production from these two mines is also shown in the figures in sections 7.3–7.6. Additional mines with the potential to come on line before 2015 include Hoidas Lake (Canada), Dubbo Zirconia (Australia), Dong Pao (Vietnam), Nolans Bore (Australia) and Nechalacho (Canada). Figure 7-1 shows the deposits in Table 7-2, as well as a global distribution of 14 additional promising deposits that could be candidates for development in the medium term (Watts 2010).
Table 7-2. Current and Projected Future Rare Earth Supply by Element75
Rare Earth Supply by Element: Production Sources and Volume (tonnes/yr)
Estimated 2010 Production
Assumed Additional Production by 2015 Total Additional Production by 2015
Estimated 2015 Production
Mountain Pass (USA)
Mt. Weld (Australia)
Nolans Bore (Australia)
Nechalaco (Canada)
Dong Pao (Vietnam)
Hoidas Lake (Canada)
Dubbo Zirconia (Australia)
Lanthanum 33,887 6,640 3,840 2,000 845 1,620 594 585 16,124 50,011
Cerium 49,935 9,820 6,855 4,820 2,070 2,520 1,368 1,101 28,554 78,489
Praseodymium 6,292 860 810 590 240 200 174 120 2,994 9,286
Neodymium 21,307 2,400 2,790 2,150 935 535 657 423 9,890 31,197
Samarium 2,666 160 360 240 175 45 87 75 1,142 3,808
Europium 592 20 90 40 20 18 3 191 783
Gadolinium 2,257 40 150 100 145 39 63 537 2,794
Terbium 252 15 10 90 3 9 127 379
Dysprosium 1,377 30 30 35 12 60 167 1,544
Yttrium 8,750 20 60 370 35 39 474 998 9,748
TOTAL 127,315 19,960 15,000 9,980 4,925 4,955 2,991 2,913 60,724 188,039
Source: Industrial Minerals via Watts (2010)
75 Data sources: estimated 2010 production based on personal communication with Kingsnorth, Roskill (2010) for assumed additional production by 2015 with downward adjustments to Mt. Weld and Nolans Bore to reflect expected supply by 2015, elemental breakdowns based on USGS (2010).
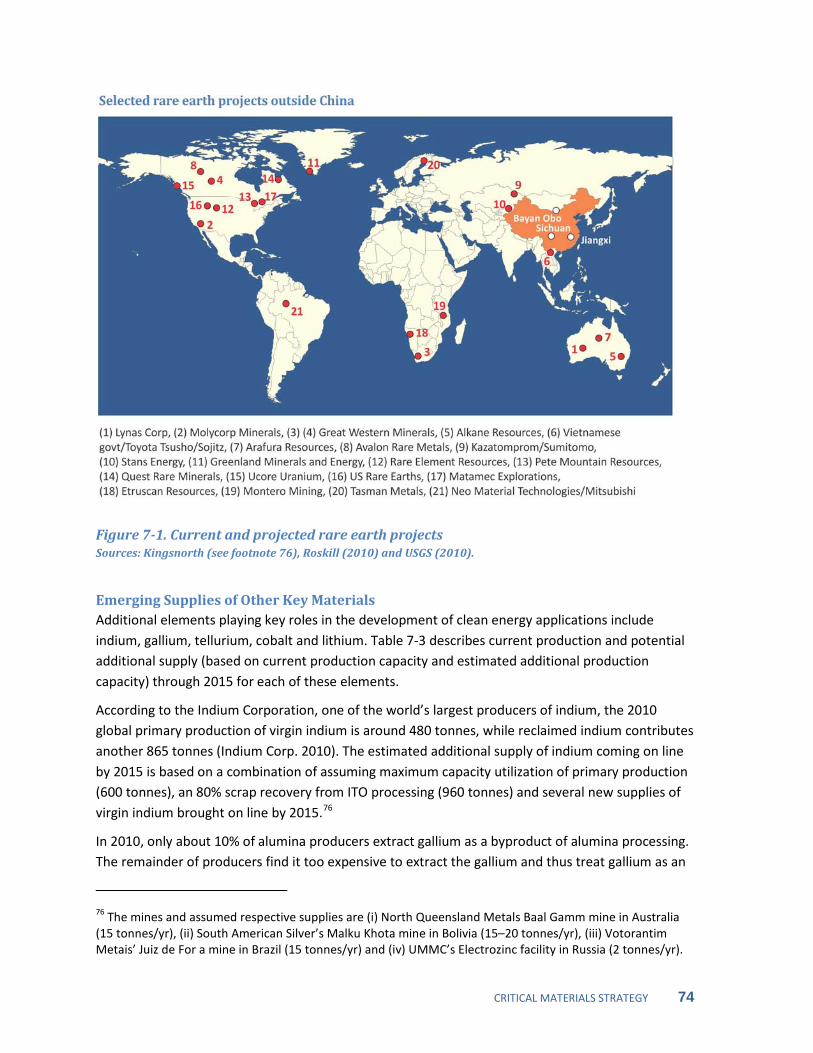
CRITICAL MATERIALS STRATEGY 74
Figure 7-1. Current and projected rare earth projects Sources: Kingsnorth (see footnote 76), Roskill (2010) and USGS (2010).
Emerging Supplies of Other Key Materials Additional elements playing key roles in the development of clean energy applications include indium, gallium, tellurium, cobalt and lithium. Table 7-3 describes current production and potential additional supply (based on current production capacity and estimated additional production capacity) through 2015 for each of these elements.
According to the Indium Corporation, one of the world’s largest producers of indium, the 2010 global primary production of virgin indium is around 480 tonnes, while reclaimed indium contributes another 865 tonnes (Indium Corp. 2010). The estimated additional supply of indium coming on line by 2015 is based on a combination of assuming maximum capacity utilization of primary production (600 tonnes), an 80% scrap recovery from ITO processing (960 tonnes) and several new supplies of virgin indium brought on line by 2015.76
In 2010, only about 10% of alumina producers extract gallium as a byproduct of alumina processing. The remainder of producers find it too expensive to extract the gallium and thus treat gallium as an
76 The mines and assumed respective supplies are (i) North Queensland Metals Baal Gamm mine in Australia (15 tonnes/yr), (ii) South American Silver’s Malku Khota mine in Bolivia (15–20 tonnes/yr), (iii) Votorantim Metais’ Juiz de For a mine in Brazil (15 tonnes/yr) and (iv) UMMC’s Electrozinc facility in Russia (2 tonnes/yr).

CRITICAL MATERIALS STRATEGY 75
impurity in the aluminum refining process. The Indium Corporation estimated that in terms of global supply of gallium in 2010, about 125 tonnes of global primary production of gallium was supplemented by an additional 82 tonnes of globally reclaimed gallium (Indium Corp. 2010).
Table 7-3. Current and Future Supply of Additional Elements Assessed
Supply of Other Elements Assessed: Production Sources and Volume (tonnes)
Estimated 2010 Production
Potential Sources of Additional Production between 2010 and 2015 Estimated
2015 Supply Additional amount
Sources
Indium 1,345 267 Recovery (co-produced) from additional zinc production mainly and recycling
1,612
Gallium 207 11877Recovery (co-produced) from additional alumina and bauxite production
78
325
Tellurium 500 720 Recovery (co-produced) from copper anode Slimes
1,220
Cobalt 75,900 197,830 Mines 273,730
Lithium (carbonate equivalent)
134,600 115,400 Mines79 250,000
Sources: USGS 2008a-e and Evans 2010.
The estimated 2010 global tellurium production is based on the 2008 global primary production of tellurium reported by USGS due to the fact that the 2010 estimate was not yet available and the 2009 global primary production number reflects conditions when the recent economic recession had the most impact. Additional tellurium supply is based on the assumption that approximately 60% of the 1,200 tonnes/yr copper anode slimes based potential tellurium supply indicated by the USGS in the 2008 Tellurium Yearbook will come online by 2015. Global tellurium production could grow by about a factor of four from increased levels of extraction from copper anode slimes by 2020, but may grow more slowly if copper refiners move away from the electrolytic process as the quality of copper ore declines. Additional supplies of tellurium also may be produced from tellurium mining projects and from efforts to recover tellurium from gold concentrates. However, no specific assumptions were made about these potential additional supplies due to insufficient information.
77 For indium, the additional amount is only the difference between the 2010 production and the maximum current production capacity for mining and refining the material. No new capacity is projected by 2015. 78 Also based on multiple correspondences with USGS, October 4-7, 2010. 79 USGS, external review of earlier draft, November 17, 2010.

CRITICAL MATERIALS STRATEGY 76
The estimated 2010 global primary cobalt production is based on the 2008 global primary production of cobalt reported by USGS, as using the production number from 2009, the last year of available data, would reflect conditions during the recent recession. There is a long list of potential additional sources of cobalt production. These include nickel and copper deposits in Canada, Western Australia, Democratic Republic of Congo (DRC), Zambia and Madagascar. In aggregate, these projects represent the potential to add up to 197,830 metric tons of cobalt per year to world supplies (USGS 2008d). Because of concerns about DRC’s political and social stability, separate production values for Congo and non-Congo mines appear in the figures in sections 7.3–7.6.
For lithium, the 2010 production number is estimated lithium carbonate equivalent (LCE) production available in 2010. In the near- to mid-term future, additional low-cost evaporative lithium resources may be developed from the high desert brines in Argentina and Chile, as well as from the geothermal brines in the Western United States.80
7.3 Trajectories of Future Demand for Rare Earth Elements in Magnet Technologies
Due to the uncertain nature of the lithium claims by emerging companies, this report takes into account only the expansion plans of the current lithium producers for the additional estimated supply by 2015.
The use of rare earth permanent magnets (PMs) in vehicles and wind turbines is described in Chapter 2. These magnets incorporate several key materials, most notably neodymium and dysprosium.81
In 2010, neodymium-iron-boron (NdFeB) magnets dominate the market for high-efficiency traction motors in hybrid electric vehicles (HEVs). It is assumed that this trend continues and that NdFeB magnets are also used in all future plug-in hybrid electric vehicles (PHEVs) and electric vehicles (EVs). The market share for turbines with REE PMs is currently small, but projected to increase significantly over time as large capacity turbines using these motors enter the market in greater numbers.
The assumptions for deployment, market share and material intensity used to create trajectories of future demand for key materials in magnet technologies are presented in Table 7-4.
Future deployments of onshore and offshore wind turbines were based on the International Energy Agency’s World Energy Outlook (IEA WEO 2009). Low deployment is based on the “2009 Reference Case”, as it represents a “baseline vision” of how energy markets are likely to evolve, taking into account only the array of policies and measures currently in place (but not necessarily fully-implemented) by mid-2009 (IEA 2009). High deployment of wind turbines is based on the “450 Scenario” in IEA WEO 2009, which identifies a set of technology deployment rates and technology assumptions that are capable of stabilizing atmospheric greenhouse gas concentrations at 450 parts per million by volume (ppmv) of CO2-equivalent by 2030.
80 Currently and for the foreseeable future, Bolivia’s lithium is only an uneconomic resource. It is unknown if Boliva will ever be able to turn its lithium resource into an economic reserve (USGS, pers. comm.). 81 The substitution of praseodymium for neodymium is not considered in the demand trajectories due to a lack of available data on the extent to which it occurs.

CRITICAL MATERIALS STRATEGY 77
Table 7-4. Assumptions for Key Materials in Magnet Technologies
Technology Assumption Low Penetration
High Penetration
Deployment in 2025
Wind Onshore Wind Turbine Additional Capacity (GW)
23.6 48.6
Wind Offshore Wind Turbines Additional Capacity (GW)
4.9 17.0
Vehicles Sales of Hybrid Electric Vehicles (HEVs) (millions)
4.2 19.1
Vehicles Sales of Plug-in Hybrid Electric Vehicles (PHEVs) (millions)
0.002 13.2
Vehicles Sales of All Electric Vehicles (AEVs) (millions) 0.001 4.6
Market Share
Wind Onshore Wind Turbines using RE Magnets 10% 25% Wind Offshore Wind Turbines using RE Magnets 10% 75%
Vehicles HEVs, PHEVs, and AEVs using RE Magnet Motors
100% 100%
Technology Assumption Low Intensity
High Intensity
Materials Intensity
Wind Average Weight of Magnets per MW (kgs) 400 600 Vehicles Average Weight of Magnets per vehicle (kgs) 1.0 2.0 Wind and Vehicles
% Weight of Magnets that is Neodymium 31% 31%
Wind and Vehicles
% Weight of Magnets that is Dysprosium 5.5% 5.5%
Future deployment cases for vehicles with electric drive-trains (HEVs, PHEVs and EVs) were based on the International Energy Agency’s 2010 Energy Technology Perspectives (IEA ETP 2010) with its detailed breakdown of annual deployment among various types of vehicles. The low deployment case is based on the “2010 Baseline Case,” which like the IEA WEO “2009 Reference Case,” assumes that governments introduce no new energy and climate policies after 2009. The high deployment case for light-duty vehicles with electric drive-trains is based on the IEA ETP 2010 “Blue Map Scenario.” The IEA developed the “Blue Map Scenario” to illustrate a least-cost technology deployment scenario designed to reduce global, energy-related CO2 emissions by 50% from 2005 levels in 2050 (IEA 2010).
The development of the market share and material intensity assumptions is presented in detail in Appendix B.
Figure 7-2 contains projections of global requirements for neodymium oxide (Nd2O3) in all technologies, including wind turbines and vehicles with electric drive-trains, during the period 2010–2025, as well as the 2010 and 2015 supply estimates. These amounts are given in terms of neodymium oxide, because this is the commercial feedstock from which the neodymium metal is refined and NdFeB magnets are fabricated. Also included in Figure 7-2 are supply estimates for 2010, 2010 plus two individual mines that are close to ramping up operations and an estimate for 2015 supply.

CRITICAL MATERIALS STRATEGY 78
Figure 7-2 shows that the basic availability of neodymium oxide is adequate in the short term. Under high penetration scenarios (Trajectories C and D), clean energy represents a growing proportion of total neodymium oxide demand. Global demand for wind turbines and electric drive-train vehicles forms a significant percentage (40%) of total neodymium demand in 2025 under Trajectory C. Neodymium demand in vehicles contributes roughly five times higher demand than demand in wind turbines. Demand exceeds supply in 2015 only under Trajectory D. Projected non-clean energy demand alone will exceed projected 2015 supply before 2025. Deployment rate, not material intensity, is the biggest driver of demand, suggesting that R&D breakthroughs are needed to reduce neodymium content in magnets and batteries or development of substitutes.
Figure 7-2. Future demand and supply for neodymium oxide
Figure 7-3 illustrates the ranges of projections of global requirements for dysprosium oxide (Dy2O3) in magnet for wind turbines and vehicles, as well as non-clean energy use during the period 2010–2025. These amounts are given in terms of dysprosium oxide because this is the commercial feedstock from which dysprosium metal is refined and NdFeB-AH magnets are fabricated. Also included in Figure 7-3 are supply estimates for 2010, 2010 plus additional individual mines and an estimate for 2015 supply.

CRITICAL MATERIALS STRATEGY 79
Figure 7-3. Future demand and supply for dysprosium oxide
Figure 7-3 shows that the basic availability of dysprosium oxide is tight in the short term. Electric drive-train vehicles represent roughly four times the demand for dysprosium oxide than wind turbines in 2025 under Trajectory C. Anticipated new mines will provide relatively little new supply, an additional 12% supply, by 2015. Global demand exceeds projected 2015 supply under all four trajectories in the beginning of the medium term. Global clean energy demand as a percentage of total demand for dysprosium increases dramatically from 16% in 2010 to 62% in 2025 under Trajectory C. The developing supply-demand imbalance in the medium term under all trajectories highlights the importance of R&D on alternative approaches to heat management (a main function of the dysprosium content) in magnets or substitutes for NdFeB magnets in general in clean energy technologies. Non-clean energy demand alone will lead to a supply-demand mismatch by the middle of the medium term under the assumed trajectory, highlighting the need for corresponding material intensity improvements or substitutes in non-clean energy technologies. Ceramic high-temperature superconductors may be a competitive substitute for NdFeB permanent magnets in wind turbines and this could lessen the demand for neodymium and dysprosium.
7.4 Trajectories of Future Demand for Rare Earth Elements in Battery Technologies The use of nickel metal hydride (NiMH) and lithium-ion (Li-ion) batteries in vehicles with electric drive-trains is discussed in Chapter 2. These batteries incorporate a variety of key materials (e.g., lanthanum, cerium, neodymium, praseodymium, cobalt and lithium). For the purposes of this analysis, it is assumed that all future HEVs will use nickel metal hydride batteries, while PHEVs and EVs will rely on lithium-ion batteries. PHEVs are assumed to use a battery large enough to provide 40 miles of “electric-only” propulsion. EVs are assumed to use a battery large enough to provide 100 miles of propulsion on a single charge.

CRITICAL MATERIALS STRATEGY 80
The assumptions for vehicle deployment, market share of the battery types and material intensity of the batteries used to create trajectories of future demand for key materials in battery technologies are presented in Table 7-5.
Table 7-5. Assumptions for Key Materials in Battery Technologies
Technology Assumption Low Penetration High Penetration
Deployment in 2025
Vehicles Sales of Hybrid Electric Vehicles (HEVs) (millions)
4.2 19.1
Vehicles Sales of Plug-in Hybrid Electric Vehicles (PHEVs) (millions)
0.002 13.2
Vehicles Sales of All Electric Vehicles (AEVs) (millions)
0.001 4.6
Market Share
Vehicles % PHEV-40s with Li-ion batteries 100% 100% Vehicles % AEV-100s with Li-ion batteries 100% 100% Vehicles % HEVs with NiMH batteries 100% 100%
Technology Assumption Low Intensity High Intensity
Materials Intensity
Vehicles Average Weight of Lanthanum per NiMH battery (kg)
0.49 0.73
Vehicles Average Weight of Cerium per NiMH battery (kg)
0.69 1.03
Vehicles Average Weight of Neodymium per NiMH battery (kg)
0.20 0.31
Vehicles Average Weight of Cobalt per NiMH battery (kg)
0.44 0.66
Vehicles Average Weight of Cobalt per PHEV-40 Li-ion battery (kg)
0.00 3.77
Vehicles Average Weight of Cobalt per EV-100 Li-ion battery (kg)
0.00 9.41
Vehicles Average Weight of Lithium per PHEV-40 Li-ion battery (kg)
1.35 5.07
Vehicles Average Weight of Lithium per EV-100 Li-ion battery (kg)
3.38 12.68
The International Energy Agency’s Energy Technology Perspectives (IEA ETP 2010) “2010 Baseline Case” was selected as the basis for the Low Penetration case for light-duty vehicles with electric drive-trains. This “2010 Baseline Case” follows the outlines of the IEA WEO “2009 Reference Case,” illustrates the total number of light-duty vehicles manufactured and sold each year and provides a detailed breakdown of annual deployment among various types of vehicles with electric drive-trains (IEA 2010). Like the IEA WEO “2009 Reference Case,” the IEA ETP “2010 Baseline Case” assumes that governments introduce no new energy and climate policies after 2009.
The High Penetration case for light-duty vehicles with electric drive-trains is based on the IEA ETP 2010 “Blue Map Scenario.” The IEA developed the “Blue Map Scenario” to illustrate a least-cost technology deployment scenario designed to reduce global, energy-related CO2 emissions by 50%

CRITICAL MATERIALS STRATEGY 81
from 2005 levels in 2050 (IEA 2010). It contains projections of the total number of light-duty vehicles sold in each year and a breakdown of these vehicles by type of drive-train.
The development of the market share and material intensity assumptions is presented in detail in Appendix B.
Figures 7-4 through 7-7 illustrate the supply-demand picture in the future for cobalt, lithium, lanthanum and cerium. Figure 7-5 displays all trajectories, however, A and B overlap as vehicle deployment is so low in these cases. Figures 7-6 and 7-7 display supply and demand in terms of oxide because this is the commercial feedstock. Figures 7-6 and 7-7 also include future demand for lighting technologies, though this demand is far less than demand within vehicle batteries (less than 1,250 tonnes in 2025 under Trajectory D for both materials).
Figure 7-4. Future demand and supply for cobalt
Figure 7-4 shows that the basic availability of cobalt appears more than adequate in the short to medium term, even where global clean energy demand increases dramatically under Trajectory D. Non-clean energy technologies represent the vast majority of cobalt global demand in all but Trajectory D. Additional supply capacity by 2015 appears to be more than sufficient to meet demand, even without mines from the Congo.
Figure 7-5 shows that the basic availability of lithium carbonate appears to be adequate in the short term. Global clean energy demand as a percentage of total demand increases dramatically from near zero to 49% in 2025 under Trajectory C. This increase is attributable to the rapid deployment of electric vehicles; 13 million plug-in hybrids and 4.6 million all-electric vehicles are sold in 2025 under Trajectory C. Global demand exceeds expected 2015 supply before 2025, but with the high levels of resources available, existing producers appear to be able to increase capacity beyond 2015 to meet global demand. To meet global lithium carbonate demand in 2025 under Trajectory C, an additional 100,000 tonnes per year of supply is needed over 2015 supply. Supply would need to more than
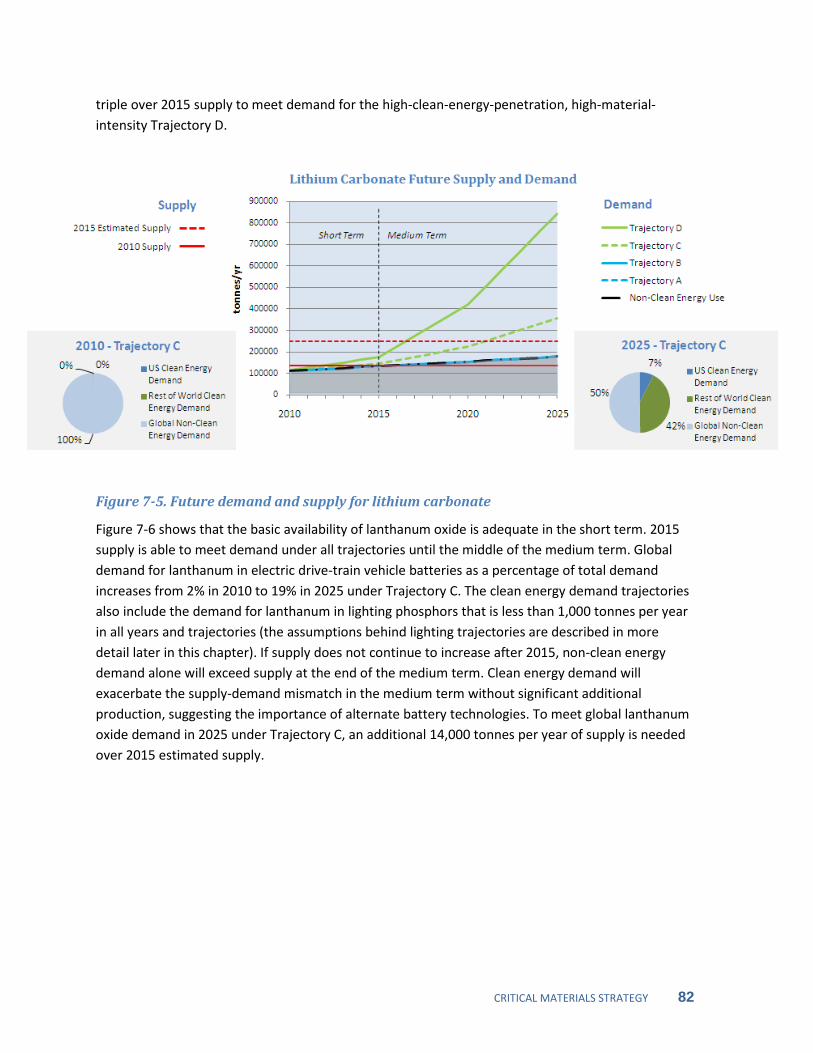
CRITICAL MATERIALS STRATEGY 82
triple over 2015 supply to meet demand for the high-clean-energy-penetration, high-material-intensity Trajectory D.
Figure 7-5. Future demand and supply for lithium carbonate
Figure 7-6 shows that the basic availability of lanthanum oxide is adequate in the short term. 2015 supply is able to meet demand under all trajectories until the middle of the medium term. Global demand for lanthanum in electric drive-train vehicle batteries as a percentage of total demand increases from 2% in 2010 to 19% in 2025 under Trajectory C. The clean energy demand trajectories also include the demand for lanthanum in lighting phosphors that is less than 1,000 tonnes per year in all years and trajectories (the assumptions behind lighting trajectories are described in more detail later in this chapter). If supply does not continue to increase after 2015, non-clean energy demand alone will exceed supply at the end of the medium term. Clean energy demand will exacerbate the supply-demand mismatch in the medium term without significant additional production, suggesting the importance of alternate battery technologies. To meet global lanthanum oxide demand in 2025 under Trajectory C, an additional 14,000 tonnes per year of supply is needed over 2015 estimated supply.
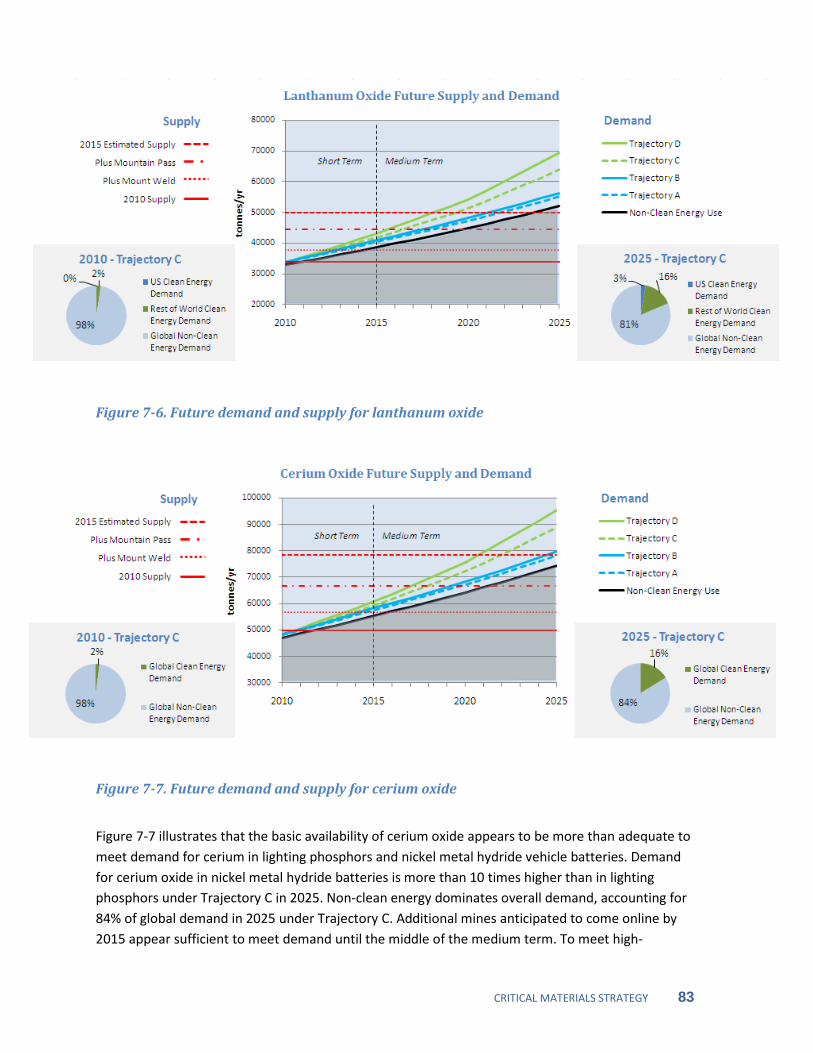
CRITICAL MATERIALS STRATEGY 83
Figure 7-6. Future demand and supply for lanthanum oxide
Figure 7-7. Future demand and supply for cerium oxide
Figure 7-7 illustrates that the basic availability of cerium oxide appears to be more than adequate to meet demand for cerium in lighting phosphors and nickel metal hydride vehicle batteries. Demand for cerium oxide in nickel metal hydride batteries is more than 10 times higher than in lighting phosphors under Trajectory C in 2025. Non-clean energy dominates overall demand, accounting for 84% of global demand in 2025 under Trajectory C. Additional mines anticipated to come online by 2015 appear sufficient to meet demand until the middle of the medium term. To meet high-
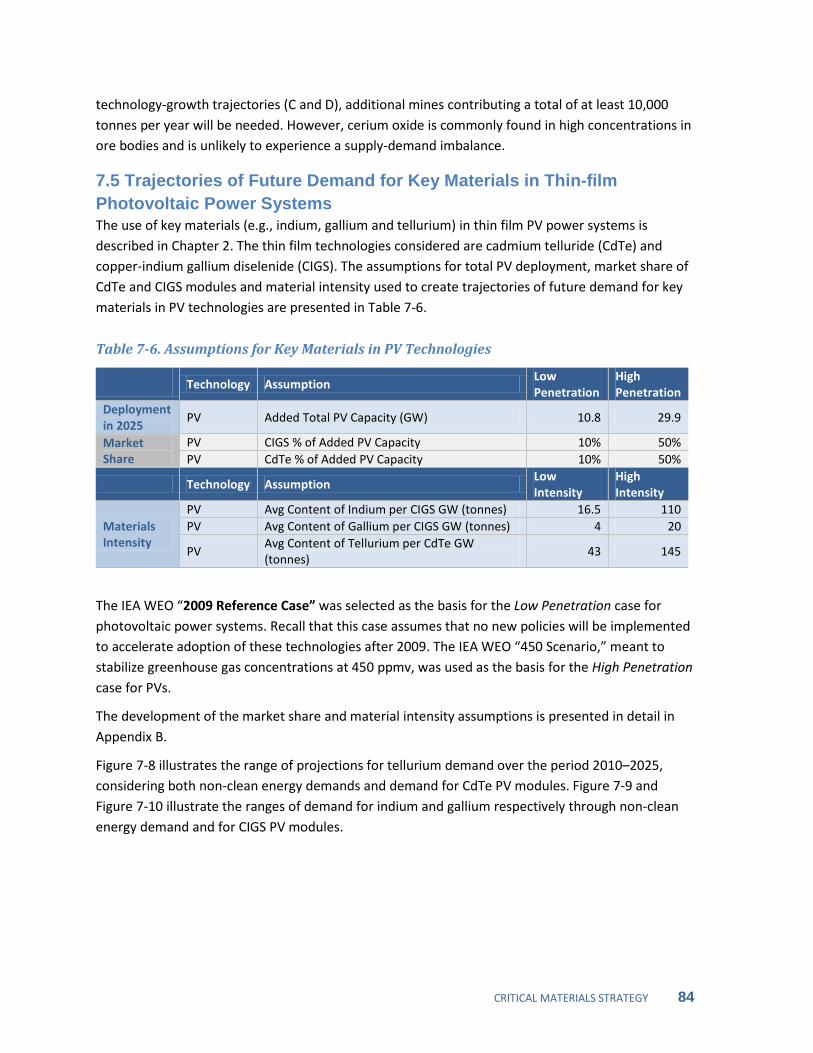
CRITICAL MATERIALS STRATEGY 84
technology-growth trajectories (C and D), additional mines contributing a total of at least 10,000 tonnes per year will be needed. However, cerium oxide is commonly found in high concentrations in ore bodies and is unlikely to experience a supply-demand imbalance.
7.5 Trajectories of Future Demand for Key Materials in Thin-film Photovoltaic Power Systems The use of key materials (e.g., indium, gallium and tellurium) in thin film PV power systems is described in Chapter 2. The thin film technologies considered are cadmium telluride (CdTe) and copper-indium gallium diselenide (CIGS). The assumptions for total PV deployment, market share of CdTe and CIGS modules and material intensity used to create trajectories of future demand for key materials in PV technologies are presented in Table 7-6.
Table 7-6. Assumptions for Key Materials in PV Technologies
Technology Assumption Low Penetration
High Penetration
Deployment in 2025
PV Added Total PV Capacity (GW) 10.8 29.9
Market Share
PV CIGS % of Added PV Capacity 10% 50% PV CdTe % of Added PV Capacity 10% 50%
Technology Assumption Low Intensity
High Intensity
Materials Intensity
PV Avg Content of Indium per CIGS GW (tonnes) 16.5 110 PV Avg Content of Gallium per CIGS GW (tonnes) 4 20
PV Avg Content of Tellurium per CdTe GW (tonnes)
43 145
The IEA WEO “2009 Reference Case” was selected as the basis for the Low Penetration case for photovoltaic power systems. Recall that this case assumes that no new policies will be implemented to accelerate adoption of these technologies after 2009. The IEA WEO “450 Scenario,” meant to stabilize greenhouse gas concentrations at 450 ppmv, was used as the basis for the High Penetration case for PVs.
The development of the market share and material intensity assumptions is presented in detail in Appendix B.
Figure 7-8 illustrates the range of projections for tellurium demand over the period 2010–2025, considering both non-clean energy demands and demand for CdTe PV modules. Figure 7-9 and Figure 7-10 illustrate the ranges of demand for indium and gallium respectively through non-clean energy demand and for CIGS PV modules.

CRITICAL MATERIALS STRATEGY 85
Figure 7-8. Future demand and supply for tellurium
Figure 7-8 shows that the basic availability of tellurium appears more than adequate because expected increased recovery from copper anode slime dramatically increases supply in the short term. If anticipated new supplies become available, it appears that supply will be sufficient to meet projected demand past 2020 in Trajectories A–C. Reducing material intensity provides significant payoff for reducing overall material demand. If CdTe PV approaches the low material intensity of 43 tonnes per GW, only a minimal increase in supply in the medium term is necessary to accommodate high PV penetration. Non-clean energy demand as a percentage of total demand shrinks significantly over time under Trajectory C, but will still account for a large share of global demand in 2025. U.S. clean energy demand for tellurium is about a sixth of global clean energy demand in 2025, under Trajectory C. To meet global tellurium demand under Trajectory D, supply in 2025 must double estimated 2015 supply.
Figure 7-9 shows that the basic availability of indium appears somewhat tight by 2015, particularly for the trajectories with high material intensity. Without market adjustment, supply will need to increase by more than 25% over the 2015 estimate to meet just non-clean energy demand in 2025. Non-clean energy demand dominates indium consumption in Trajectories A–C. Clean energy demand adds to this demand, at 11% of total demand in 2025 under Trajectory C. Reducing the material intensity of indium in CIGS photovoltaic cells provides significant reductions of overall material demand. Without expanded production after 2015, reductions in non-clean energy demand will also be important to prevent shortages and price spikes.

CRITICAL MATERIALS STRATEGY 86
Figure 7-9. Future demand and supply for indium
Figure 7-10 shows that the basic availability of gallium appears more than adequate. Estimated 2015 supply is sufficient to meet projected demand beyond 2020 in all but Trajectory D. Continuing industry trends of reducing material intensity provides significant payoff for reducing overall material demand. While the share of clean energy demand relative to non-clean energy demand increases from 5% in 2010 to 16% in 2025, non-clean energy demand still dominates across Trajectories A–C. U.S. clean energy demand contributes about one-sixth of global clean energy demand in 2025 under Trajectory C. High penetration of CIGS PV without advances in material intensity, global supply of gallium would need to increase by roughly 85% between 2015 and 2025 to meet global demand.
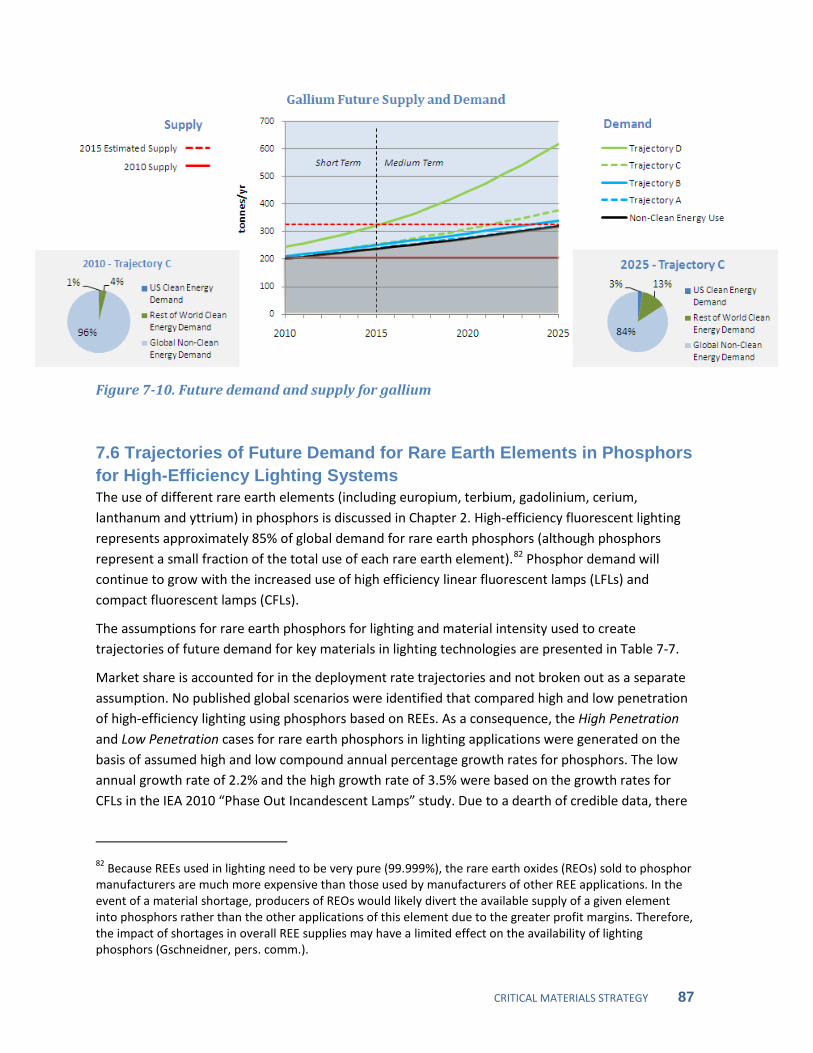
CRITICAL MATERIALS STRATEGY 87
Figure 7-10. Future demand and supply for gallium
7.6 Trajectories of Future Demand for Rare Earth Elements in Phosphors for High-Efficiency Lighting Systems The use of different rare earth elements (including europium, terbium, gadolinium, cerium, lanthanum and yttrium) in phosphors is discussed in Chapter 2. High-efficiency fluorescent lighting represents approximately 85% of global demand for rare earth phosphors (although phosphors represent a small fraction of the total use of each rare earth element).82
The assumptions for rare earth phosphors for lighting and material intensity used to create trajectories of future demand for key materials in lighting technologies are presented in Table 7-7.
Phosphor demand will continue to grow with the increased use of high efficiency linear fluorescent lamps (LFLs) and compact fluorescent lamps (CFLs).
Market share is accounted for in the deployment rate trajectories and not broken out as a separate assumption. No published global scenarios were identified that compared high and low penetration of high-efficiency lighting using phosphors based on REEs. As a consequence, the High Penetration and Low Penetration cases for rare earth phosphors in lighting applications were generated on the basis of assumed high and low compound annual percentage growth rates for phosphors. The low annual growth rate of 2.2% and the high growth rate of 3.5% were based on the growth rates for CFLs in the IEA 2010 “Phase Out Incandescent Lamps” study. Due to a dearth of credible data, there
82 Because REEs used in lighting need to be very pure (99.999%), the rare earth oxides (REOs) sold to phosphor manufacturers are much more expensive than those used by manufacturers of other REE applications. In the event of a material shortage, producers of REOs would likely divert the available supply of a given element into phosphors rather than the other applications of this element due to the greater profit margins. Therefore, the impact of shortages in overall REE supplies may have a limited effect on the availability of lighting phosphors (Gschneidner, pers. comm.).

CRITICAL MATERIALS STRATEGY 88
was only one set of assumptions used for material intensity of each element in this analysis. The development of material intensity assumptions is presented in detail in Appendix B.
Table 7-7. Assumptions for Key Materials in Lighting Technologies
Technology Assumption Low Penetration
High Penetration
Deployment in 2025
Lighting Rare Earth Phosphors for Lighting (tonnes)
9307 (Based on
2.2% annual growth
rate)
11,250 (Based on
3.5% annual growth
rate) Market Share
Included in deployment assumptions
Technology Assumption Low Intensity
High Intensity
Materials Intensity
Lighting % Weight of lighting phosphors that is Lanthanum
8.50% 8.50%
Lighting % Weight of lighting phosphors that is Cerium 11.00% 11.00%
Lighting % Weight of lighting phosphors that is Europium
4.90% 4.90%
Lighting % Weight of lighting phosphors that is Terbium
4.60% 4.60%
Lighting % Weight of lighting phosphors that is Yttrium
69.20% 69.20%
Figures 7-11 to 7-13 illustrate estimated supply and the range of demands projected in this study for REEs used as phosphors in high-efficiency lighting technologies (except lanthanum and cerium, which were discussed earlier). These three figures contain only Trajectories B and D because only one set of material intensity values for phosphors was available. U.S. and global clean energy shares of total demand are based on Trajectory D (equivalent to Trajectory C for these materials).
Figure 7-11 shows that the basic availability of europium oxide is more than adequate in the short term and likely adequate in the medium term. Unlike most key materials, clean energy demand for europium oxide in phosphors dominates the overall demand and accounts for approximately two-thirds of global demand throughout the short and medium term. The addition of supplies from Mount Weld increases global supply by 15% and represents a significant portion of the increased production in 2015. Only demand under Trajectory D is projected to exceed 2015 supply by the end of the medium term. Trajectories assume limited substitution of light emitting diodes (LEDs) and organic light emitting diodes (OLEDs) for fluorescents, which could substantially mitigate demand in the 2020–2025 timeframe.
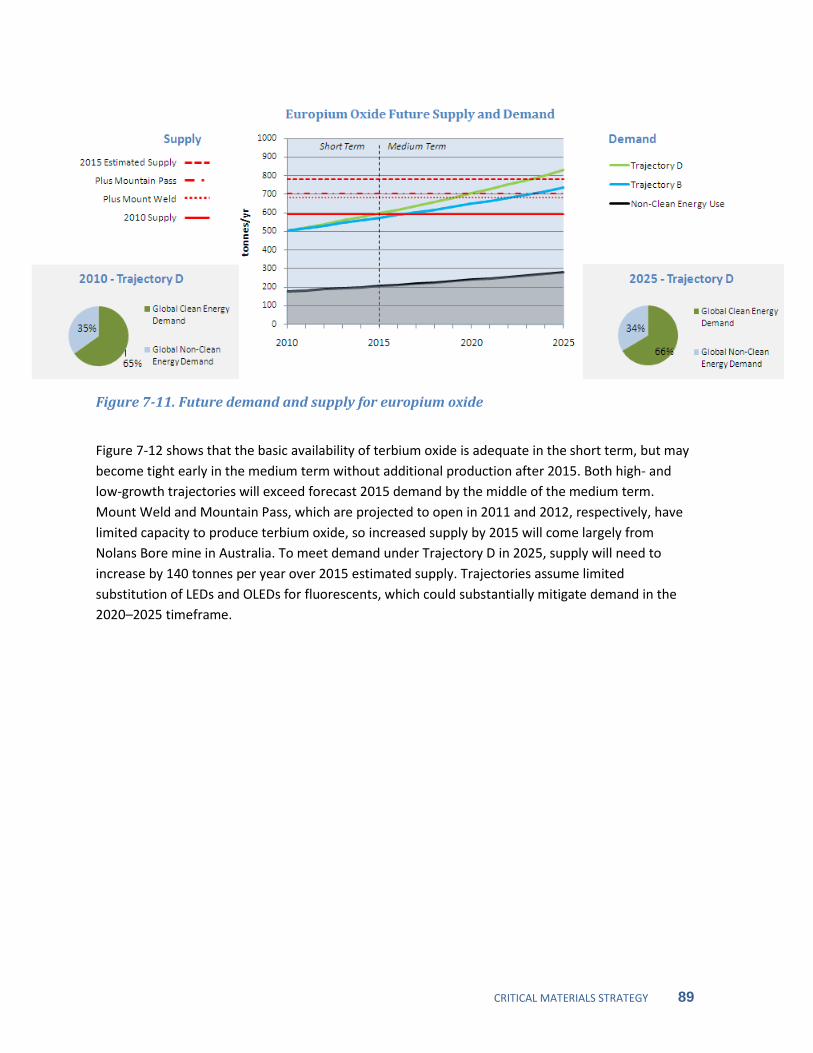
CRITICAL MATERIALS STRATEGY 89
Figure 7-11. Future demand and supply for europium oxide
Figure 7-12 shows that the basic availability of terbium oxide is adequate in the short term, but may become tight early in the medium term without additional production after 2015. Both high- and low-growth trajectories will exceed forecast 2015 demand by the middle of the medium term. Mount Weld and Mountain Pass, which are projected to open in 2011 and 2012, respectively, have limited capacity to produce terbium oxide, so increased supply by 2015 will come largely from Nolans Bore mine in Australia. To meet demand under Trajectory D in 2025, supply will need to increase by 140 tonnes per year over 2015 estimated supply. Trajectories assume limited substitution of LEDs and OLEDs for fluorescents, which could substantially mitigate demand in the 2020–2025 timeframe.
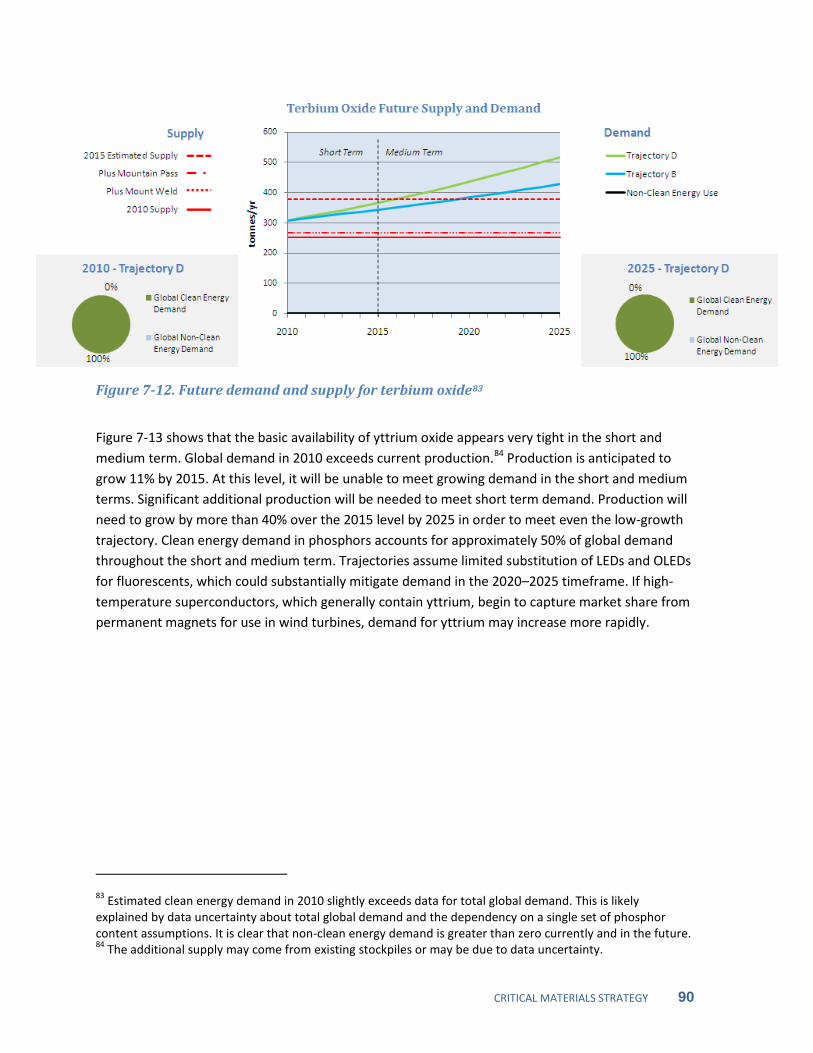
CRITICAL MATERIALS STRATEGY 90
Figure 7-12. Future demand and supply for terbium oxide83
Figure 7-13 shows that the basic availability of yttrium oxide appears very tight in the short and medium term. Global demand in 2010 exceeds current production.
84
Production is anticipated to grow 11% by 2015. At this level, it will be unable to meet growing demand in the short and medium terms. Significant additional production will be needed to meet short term demand. Production will need to grow by more than 40% over the 2015 level by 2025 in order to meet even the low-growth trajectory. Clean energy demand in phosphors accounts for approximately 50% of global demand throughout the short and medium term. Trajectories assume limited substitution of LEDs and OLEDs for fluorescents, which could substantially mitigate demand in the 2020–2025 timeframe. If high-temperature superconductors, which generally contain yttrium, begin to capture market share from permanent magnets for use in wind turbines, demand for yttrium may increase more rapidly.
83 Estimated clean energy demand in 2010 slightly exceeds data for total global demand. This is likely explained by data uncertainty about total global demand and the dependency on a single set of phosphor content assumptions. It is clear that non-clean energy demand is greater than zero currently and in the future. 84 The additional supply may come from existing stockpiles or may be due to data uncertainty.
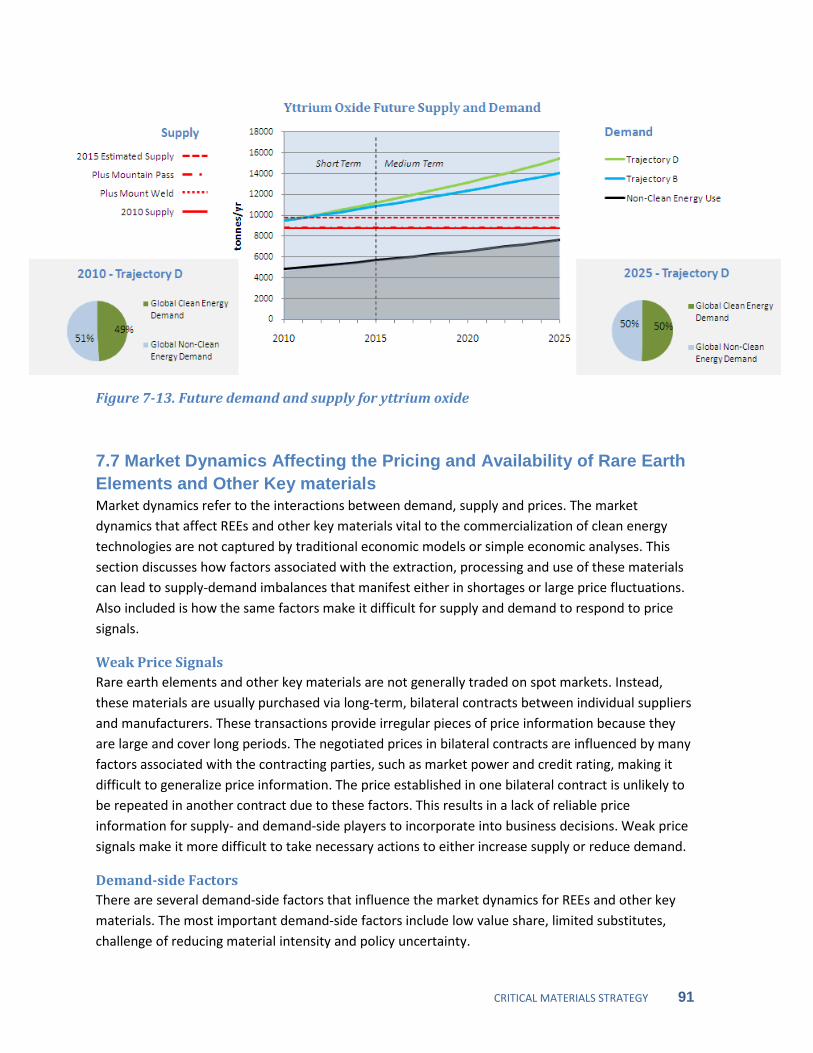
CRITICAL MATERIALS STRATEGY 91
Figure 7-13. Future demand and supply for yttrium oxide
7.7 Market Dynamics Affecting the Pricing and Availability of Rare Earth Elements and Other Key materials Market dynamics refer to the interactions between demand, supply and prices. The market dynamics that affect REEs and other key materials vital to the commercialization of clean energy technologies are not captured by traditional economic models or simple economic analyses. This section discusses how factors associated with the extraction, processing and use of these materials can lead to supply-demand imbalances that manifest either in shortages or large price fluctuations. Also included is how the same factors make it difficult for supply and demand to respond to price signals.
Weak Price Signals Rare earth elements and other key materials are not generally traded on spot markets. Instead, these materials are usually purchased via long-term, bilateral contracts between individual suppliers and manufacturers. These transactions provide irregular pieces of price information because they are large and cover long periods. The negotiated prices in bilateral contracts are influenced by many factors associated with the contracting parties, such as market power and credit rating, making it difficult to generalize price information. The price established in one bilateral contract is unlikely to be repeated in another contract due to these factors. This results in a lack of reliable price information for supply- and demand-side players to incorporate into business decisions. Weak price signals make it more difficult to take necessary actions to either increase supply or reduce demand.
Demand-side Factors There are several demand-side factors that influence the market dynamics for REEs and other key materials. The most important demand-side factors include low value share, limited substitutes, challenge of reducing material intensity and policy uncertainty.
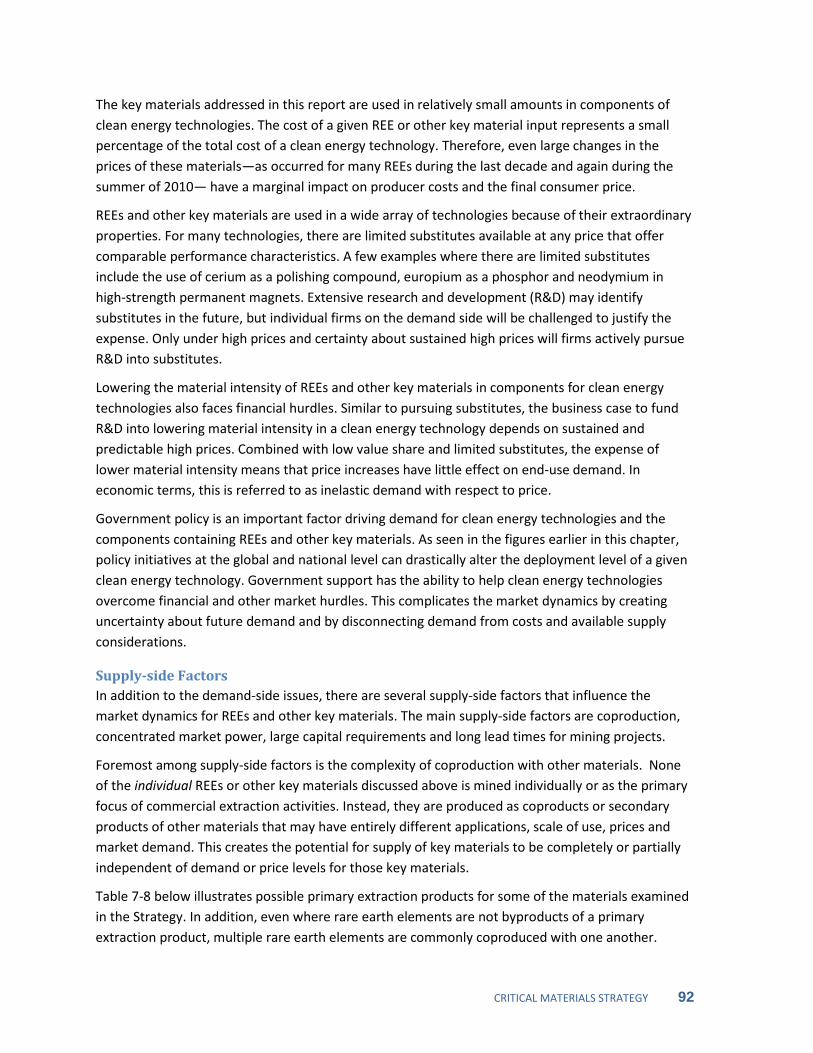
CRITICAL MATERIALS STRATEGY 92
The key materials addressed in this report are used in relatively small amounts in components of clean energy technologies. The cost of a given REE or other key material input represents a small percentage of the total cost of a clean energy technology. Therefore, even large changes in the prices of these materials—as occurred for many REEs during the last decade and again during the summer of 2010— have a marginal impact on producer costs and the final consumer price.
REEs and other key materials are used in a wide array of technologies because of their extraordinary properties. For many technologies, there are limited substitutes available at any price that offer comparable performance characteristics. A few examples where there are limited substitutes include the use of cerium as a polishing compound, europium as a phosphor and neodymium in high-strength permanent magnets. Extensive research and development (R&D) may identify substitutes in the future, but individual firms on the demand side will be challenged to justify the expense. Only under high prices and certainty about sustained high prices will firms actively pursue R&D into substitutes.
Lowering the material intensity of REEs and other key materials in components for clean energy technologies also faces financial hurdles. Similar to pursuing substitutes, the business case to fund R&D into lowering material intensity in a clean energy technology depends on sustained and predictable high prices. Combined with low value share and limited substitutes, the expense of lower material intensity means that price increases have little effect on end-use demand. In economic terms, this is referred to as inelastic demand with respect to price.
Government policy is an important factor driving demand for clean energy technologies and the components containing REEs and other key materials. As seen in the figures earlier in this chapter, policy initiatives at the global and national level can drastically alter the deployment level of a given clean energy technology. Government support has the ability to help clean energy technologies overcome financial and other market hurdles. This complicates the market dynamics by creating uncertainty about future demand and by disconnecting demand from costs and available supply considerations.
Supply-side Factors In addition to the demand-side issues, there are several supply-side factors that influence the market dynamics for REEs and other key materials. The main supply-side factors are coproduction, concentrated market power, large capital requirements and long lead times for mining projects.
Foremost among supply-side factors is the complexity of coproduction with other materials. None of the individual REEs or other key materials discussed above is mined individually or as the primary focus of commercial extraction activities. Instead, they are produced as coproducts or secondary products of other materials that may have entirely different applications, scale of use, prices and market demand. This creates the potential for supply of key materials to be completely or partially independent of demand or price levels for those key materials.
Table 7-8 below illustrates possible primary extraction products for some of the materials examined in the Strategy. In addition, even where rare earth elements are not byproducts of a primary extraction product, multiple rare earth elements are commonly coproduced with one another.
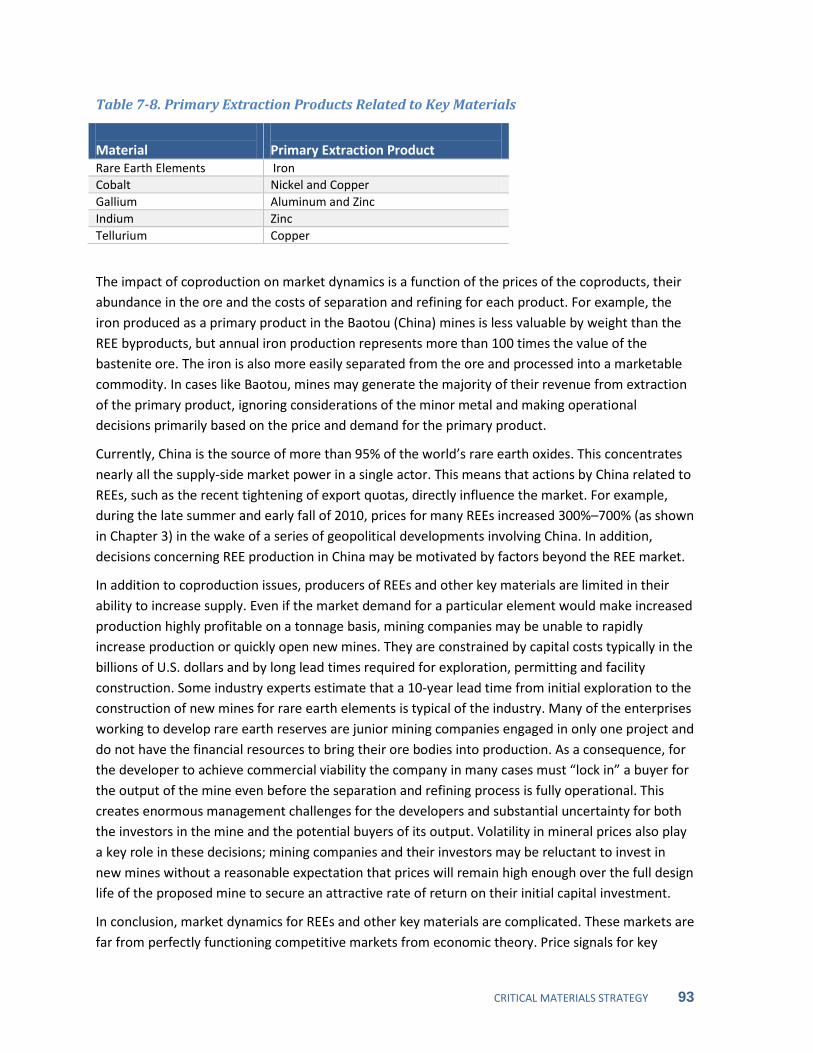
CRITICAL MATERIALS STRATEGY 93
Table 7-8. Primary Extraction Products Related to Key Materials
Material
Primary Extraction Product
Rare Earth Elements Iron Cobalt Nickel and Copper Gallium Aluminum and Zinc Indium Zinc Tellurium Copper
The impact of coproduction on market dynamics is a function of the prices of the coproducts, their abundance in the ore and the costs of separation and refining for each product. For example, the iron produced as a primary product in the Baotou (China) mines is less valuable by weight than the REE byproducts, but annual iron production represents more than 100 times the value of the bastenite ore. The iron is also more easily separated from the ore and processed into a marketable commodity. In cases like Baotou, mines may generate the majority of their revenue from extraction of the primary product, ignoring considerations of the minor metal and making operational decisions primarily based on the price and demand for the primary product.
Currently, China is the source of more than 95% of the world’s rare earth oxides. This concentrates nearly all the supply-side market power in a single actor. This means that actions by China related to REEs, such as the recent tightening of export quotas, directly influence the market. For example, during the late summer and early fall of 2010, prices for many REEs increased 300%–700% (as shown in Chapter 3) in the wake of a series of geopolitical developments involving China. In addition, decisions concerning REE production in China may be motivated by factors beyond the REE market.
In addition to coproduction issues, producers of REEs and other key materials are limited in their ability to increase supply. Even if the market demand for a particular element would make increased production highly profitable on a tonnage basis, mining companies may be unable to rapidly increase production or quickly open new mines. They are constrained by capital costs typically in the billions of U.S. dollars and by long lead times required for exploration, permitting and facility construction. Some industry experts estimate that a 10-year lead time from initial exploration to the construction of new mines for rare earth elements is typical of the industry. Many of the enterprises working to develop rare earth reserves are junior mining companies engaged in only one project and do not have the financial resources to bring their ore bodies into production. As a consequence, for the developer to achieve commercial viability the company in many cases must “lock in” a buyer for the output of the mine even before the separation and refining process is fully operational. This creates enormous management challenges for the developers and substantial uncertainty for both the investors in the mine and the potential buyers of its output. Volatility in mineral prices also play a key role in these decisions; mining companies and their investors may be reluctant to invest in new mines without a reasonable expectation that prices will remain high enough over the full design life of the proposed mine to secure an attractive rate of return on their initial capital investment.
In conclusion, market dynamics for REEs and other key materials are complicated. These markets are far from perfectly functioning competitive markets from economic theory. Price signals for key

CRITICAL MATERIALS STRATEGY 94
materials tend to be muted by the lack of price transparency. Even if price signals were clear, the ability of supply and demand to respond to price changes is quite limited. The result is that shortages and significant price fluctuations are likely in the future, though very difficult to predict. Due to the complexities, no attempt was made in this study to forecast key material prices.
7.8 Conclusion Four clean energy technologies have been the principal focus of this analysis:
• Permanent magnets made from alloys of REEs used in wind turbines and advanced vehicles with electric drive-trains
• Advanced batteries that incorporate REEs in their electrodes or are based on lithium-ion chemistries used in advanced vehicles with electric drive-trains
• Photovoltaic power systems using thin-film semiconductors
• Rare earth phosphors used in high-efficiency fluorescent lighting systems
Efforts to accelerate the commercialization and deployment of these four clean energy technologies face considerable risks of supply-demand imbalances that could lead to increased price volatility and supply chain disruption. The character and severity of these risks varies among the REEs and other key materials evaluated in this study. A number of options are available to the Department of Energy to reduce or mitigate these risks. These options will be discussed and evaluated in the following chapters of this study.
References IEA (International Energy Agency). 2009. World Energy Outlook 2009.
IEA (International Energy Agency). 2010a. Energy Technology Perspectives 2010.
IEA (International Energy Agency). 2010b. Phasing Out Incandescent Lamps.
Indium Corp. 2010. “Indium, Gallium & Germanium Supply & Price Outlook.” Presented by Gregory Evans to the TREM 2010 Conference, Washington, DC, April.
Roskill. 2010. “Rare Earths: An Evaluation of Current and Future Supply.” presentation by Judith Chegwidden to the 2010 Rare Earth Summit, Beijing, August 4–5.
USGS (U.S. Geological Survey). 2008a. USGS Minerals Yearbook 2008: Indium. Reston, VA: USGS.
USGS (U.S. Geological Survey). 2008b. USGS Minerals Yearbook 2008: Bauxite and Alumina. Reston, VA: USGS.
USGS (U.S. Geological Survey). 2008c. USGS Minerals Yearbook 2008: Tellurium. Reston, VA: USGS.
USGS (U.S. Geological Survey). 2008d. USGS Minerals Yearbook 2008: Cobalt. Reston, VA: USGS.
USGS (U.S. Geological Survey). 2008e. USGS Minerals Yearbook 2008: Lithium. Reston, VA: USGS.
USGS (U.S. Geological Survey). 2010. Table of Rare Earth Elemental Breakdown by Select Sites, information provided by USGS to the Department of Energy, September, 2010.

CRITICAL MATERIALS STRATEGY 95
Watts. 2010. “Shock & Ore: The Scramble for Rare Earth Self-sufficiency,” Industrial Minerals. June. http://www.tasmanmetals.com/i/pdf/IndustrialMineralsArticle-June2010.pdf
CRITICAL MATERIALS STRATEGY 96
Chapter 8. Criticality Assessment Short- and medium-term criticality assessments of the various key materials (identified in Chapter 1) address two dimensions: importance to clean energy and supply risk. The basic premise is that rapidly increasing demand for key materials could hamper the clean energy agenda by outpacing new mining projects and causing supply/demand mismatches. Detailed element-by-element assessments are presented in Appendix A.
8.1 Assessment Methodology The National Academy of Sciences (NAS) “Minerals, Critical Minerals, and the U.S. Economy” study (NAS 2008) developed a conceptual methodology to assess the criticality of individual minerals along two dimensions: “Impact of Supply Disruption” and “Supply Risk.” These two dimensions are rated on a scale from one to four and presented on a matrix to visually communicate the relative criticality of individual minerals. According to this scheme, the upper right-hand corner of the matrix attains highest criticality.
The NAS methodology has been adapted in several ways for this Strategy. First, because the purpose of this Strategy is to address materials in clean energy, the “Impact of Supply Disruption” has been reoriented to become “Importance to Clean Energy.” Second, there have been some adjustments to the attributes used to characterize “Supply Risk.” Third, assessments have been completed for both short- and medium-term criticality, as these two time horizons have different supply and demand profiles and also different policy options.
Analogous to the NAS methodology, the two-dimensional criticality ratings are plotted on a matrix to enable comparison across materials for both short and medium term. The matrices inform a comparison among materials that can feed into prioritized research and development (R&D) investment and policy action. Each matrix has three regions: critical (red), near-critical (yellow) and non-critical (green).
Short- and medium-term scores for “Impact of Supply Disruption” and “Supply Risk” are based on a weighted average of two attributes. For each attribute, key materials were assigned qualitative factor scores of 1 (least critical) to 4 (most critical). The attributes are described in more detail below.
Importance to Clean Energy Importance to clean energy encompasses two attributes for each material over the short and medium term. The weighting factor for each attribute is shown in parentheses.
Clean Energy Demand (75%): captures the importance of the material in magnets, batteries, photovoltaic (PV) films and phosphors used in clean energy technologies.
Substitutability Limitations (25%): addresses constraints on practically substituting for the material and technology within clean energy technologies. Substitution could occur at any level of the supply chain. This may include using different raw materials, components or even end-use technologies. This includes substitution by element, such as mischmetal for lanthanum in batteries, and also

CRITICAL MATERIALS STRATEGY 97
component technology-based substitutions, such as induction motors for permanent magnet motors.
Supply Risk The overall supply risk for each material is based on five categories of risk for the short and medium term. For each category, key materials were assigned qualitative factor scores of 1 (least critical) to 4 (most critical). The categories are described in more detail below.
Basic Availability (40%): the extent to which global supply will be able to meet demand. Short-term basic availability examines mine and other production relative to demand. Medium-term basic availability examines the potential for other mines to begin producing the material relative to anticipated increases in demand. The qualitative score is informed by the projections in Chapter 7, but may also take into account other factors such as global reserves, mines projected to start up after 2015 and additional supplies from recycling.
Competing Technology Demand (10%): captures whether non-energy sector demand is expected to grow rapidly, thus constraining the supply of the material available for the energy sector.
Political, Regulatory and Social Factors (20%): risk associated with political, social and regulatory factors within major producer countries. This includes the risk that political instability in a country will threaten mining and processing projects; that countries will impose export quotas or other restrictions; or that social pressures, permitting and regulatory processes will delay the start up of new mines.
Co-dependence on other Markets (10%): covers instances where a mineral is coproduct or byproduct of with other minerals found in the same ore deposit. Co-dependence can be an advantage or a disadvantage, depending on which mineral is driving production levels overall. In general, coproducts with lower revenue streams (i.e. production rate X price) will have higher scores since they are less likely to drive production than coproducts with higher revenue
Producer Diversity (20%): captures market risks due to the lack of diversity in producing countries or companies (e.g., monopoly or oligopoly).
8.2 Identification of Critical Materials Assessment scores for each key material were developed using the best available information and are shown in detail in Appendix A. The overall scores for importance to clean energy and supply risk are plotted in Figures 8-1 (short term) and 8-2 (medium term). Figure 8-3 shows the movement of scores from the short to medium term. Each of these plots can be thought of as a criticality matrix. Note that, in general, the criticality of some materials changes over time, due in some cases to anticipated market response and the emergence of viable substitutes on the one hand or a dramatic ramp up in demand for the material on the other. It is important to keep in mind that these are qualitative assessments, informed by some quantitative analyses. There is much uncertainty in the attributes examined, particularly in the medium term. While the collection of assessments is valuable to inform policy action and R&D investment, it will be important to revisit the analyses moving forward as more data are available and as material supply and demand changes.

CRITICAL MATERIALS STRATEGY 98
Figure 8-1. Short-term (0–5 years) criticality matrix
Figure 8-2. Medium-term (5–15 years) criticality matrix

CRITICAL MATERIALS STRATEGY 99
Figure 8-3. Comparison of short- and medium-term criticality
The criticality matrices in Figures 8-1 and 8-2 suggest three broad categories of criticality. Materials in the upper quadrant of the chart (with scores of three or higher on both axes) are characterized as critical. Materials with a score of three or higher on one axis but a two on the other axis are characterized as near-critical. While they are not currently judged to be critical, small changes in one or more risk category could put them at criticality. All other materials are judged not to be critical. However, all of the assessments are based on the best available information, so even materials judged not critical could be at risk due to significant unforeseen circumstances. The distribution of materials by criticality categories in the short and medium term is shown in Table 8-1.
According to the analysis, indium and rare earth elements dysprosium, terbium, europium, neodymium and yttrium are critical in the short term. The uses for the critical rare earth elements are spread across magnets, batteries and phosphors and indium is used in PV films. Thus, each of the clean energy technologies examined in the Strategy has at least one critical material in the short term. Tellurium, cerium and lanthanum are near-critical, and gallium, lithium, cobalt, praseodymium and samarium are not critical. Between the short and the medium term, importance to clean energy and supply risk shift for some materials. For example, the supply risk for neodymium decreases, while the importance to clean energy increases. The supply risk for dysprosium and yttrium both decrease. On the other hand, both the importance to clean energy and the supply risk for lithium increase to make lithium near critical in the medium term.

CRITICAL MATERIALS STRATEGY 100
Table 8-1. Distribution of Materials by Criticality Category
Short Term Medium Term
Critical Critical Dysprosium Europium
Indium Terbium
Neodymium Yttrium
Dysprosium Europium Terbium
Neodymium Yttrium
Near-Critical Near-Critical Cerium
Lanthanum Tellurium
Indium Lithium
Tellurium Not Critical Not Critical
Cobalt Gallium Lithium
Praseodymium Samarium
Cerium Cobalt
Gallium Lanthanum
Praseodymium Samarium
Lithium is the only key material that shifts into a higher criticality category from the short to medium term. This change is due to the rapid increases in market penetration projected for vehicles using lithium-ion batteries, which increases lithium’s importance to clean energy. This market penetration would significantly increase demand even as lithium production capacity increases, thus increasing supply risk slightly.
All other key materials either remain in the same category or become less critical in the short to medium term. For the materials that shift to a lower category, this change generally reflects a combination of expanded supply and increased alternatives for substitution at different levels of the supply chain. Market dynamics, described in Chapter 7, will play a large role in these positive criticality changes. However, that same discussion also highlighted the market complexities and distortions that remain for many key materials, suggesting an important role for government. The next chapter lays out the U.S. Department of Energy’s strategy for using targeted research and development, combined with other policy options, to address material criticality.
References NAS (National Academy of Sciences). 2008. Minerals, Critical Minerals and the U.S. Economy.
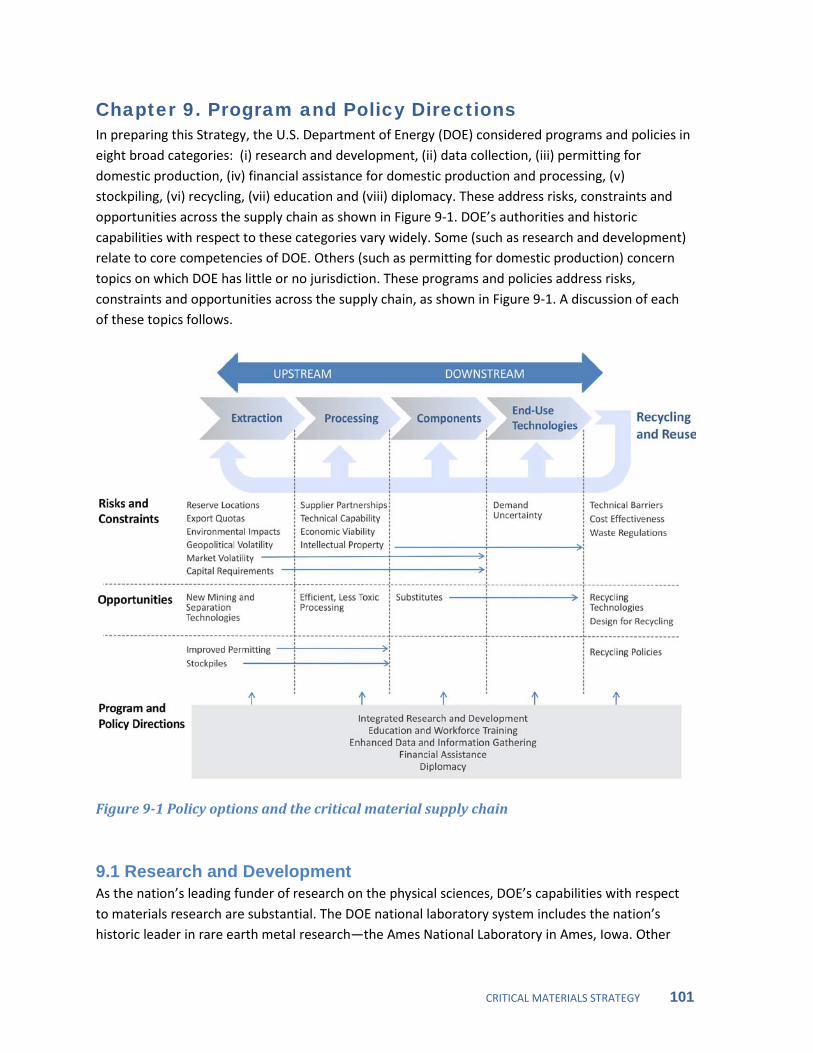
CRITICAL MATERIALS STRATEGY 101
Chapter 9. Program and Policy Directions In preparing this Strategy, the U.S. Department of Energy (DOE) considered programs and policies in eight broad categories: (i) research and development, (ii) data collection, (iii) permitting for domestic production, (iv) financial assistance for domestic production and processing, (v) stockpiling, (vi) recycling, (vii) education and (viii) diplomacy. These address risks, constraints and opportunities across the supply chain as shown in Figure 9-1. DOE’s authorities and historic capabilities with respect to these categories vary widely. Some (such as research and development) relate to core competencies of DOE. Others (such as permitting for domestic production) concern topics on which DOE has little or no jurisdiction. These programs and policies address risks, constraints and opportunities across the supply chain, as shown in Figure 9-1. A discussion of each of these topics follows.
Figure 9-1 Policy options and the critical material supply chain
9.1 Research and Development As the nation’s leading funder of research on the physical sciences, DOE’s capabilities with respect to materials research are substantial. The DOE national laboratory system includes the nation’s historic leader in rare earth metal research—the Ames National Laboratory in Ames, Iowa. Other

CRITICAL MATERIALS STRATEGY 102
DOE national labs also conduct materials research. DOE programs supporting materials research include the Office of Energy Efficiency and Renewable Energy (EERE), Office of Science and Advanced Research Projects Agency-Energy (ARPA-E).
During November and December 2010, DOE convened three technical workshops on rare earth metals and other critical materials. A U.S.-Japan workshop was held November 18th and 19th at Lawrence Livermore National Laboratory; a U.S.-European Union workshop was held December 3rd at Massachusetts Institute of Technology; and ARPA-E held a workshop in Washington, D.C., December 6th.
In early 2011, DOE will evaluate the results of these workshops and develop the Department’s first integrated research plan with respect to critical materials. This research will build on existing work at DOE and elsewhere. In addition to addressing potential synergies across DOE, the research plan will also consider opportunities to collaborate with other agencies and departments, including the Department of Defense (DoD), National Science Foundation, Department of the Interior and Environmental Protection Agency.
Objectives for DOE’s research will include (i) reducing the materials intensity of clean energy technologies and (ii) cutting costs and improving environmental performance across the full supply chain. Sustained and integrated R&D may provide breakthroughs in substitute materials – or substitute technologies—that significantly reduce materials intensity, thus decreasing import dependence and exposure to supply interruption. Additionally, R&D into recycling, design for recycling and more efficient use will help maximize available supply. Accomplishing these goals may involve R&D in fundamental materials development, manufacturing process improvements, systems design and integration advances and recycling process improvements.
Based on input to date, the Department expects that its integrated plan will give priority to the following topics:
Magnets, Motors and Generators Rare earth permanent magnets play a vital role in a number of clean-energy technologies that convert electricity to and from kinetic energy, such as vehicle motors and wind turbines. However, there are opportunities to reduce the amount of rare earth metals used in magnetic systems while maintaining equivalent performance. There may also be opportunities to move away from the use of permanent magnets, although this will require either additional innovation or design trade-offs in weight and other parameters.
High-priority research areas include the following:
• Materials
• Nano-structured permanent magnets, including core-shell structures and composites
• Improved high-temperature performance of NeFeB magnets
• Enhanced magnetic coercivity for rare-earth, alnico and other magnets
• Fundamentals of anisotropy and new anisotropic mechanisms
• High-flux soft magnets;

CRITICAL MATERIALS STRATEGY 103
• Molecular design of magnets
• Manufacturing
• Adapting advanced casting methods to enhance magnetic performance of alloys
• Improved process control to minimize waste
• Systems
• Optimized thermal management to reduce need for high-temperature-tolerance
• Optimized motor and turbine geometries to reduce friction and other operational losses
The Office of Science, EERE and ARPA-E are currently investing in magnet R&D. In addition, EERE and ARPA-E have been exploring collaboration with the Defense Advanced Research Projects Agency (DARPA) on this topic.
Batteries, Photovoltaics and Lighting DOE currently supports robust research programs in batteries, photovoltaics (PV) and lighting—three important areas of the clean energy economy. Materials considerations will continue to be integrated into these research programs. The high-priority research areas include the following:
• Batteries
• Continued R&D supporting advanced technologies that utilize abundant elements, such as iron and zinc
• Photovoltaics
• Improved deposition processes to reduce cadmium telluride (CdTe) and/or copper-indium gallium diselenide (CIGS) active layer thickness and minimize deposition waste
• Materials research on polycrystalline PV alternatives
• Lighting
• Alternative phosphor materials, including the use of quantum dots that minimize or eliminate the use of cadmium or rare earth elements—the most difficult materials issues in lighting are likely to revolve around the supply of terbium (used for green phosphors) and europium (used for red and blue phosphors)
• Organic LEDs, with improvements to luminous efficacy, cost and color rendering
Environmentally Sound Mining Research on low cost, environmentally sound mining, in collaboration with other agencies such as the Department of Interior and Environmental Protection Agency, could facilitate cleaner production at home and abroad. High-priority research areas include the following:
Non-traditional water source use (e.g., treated waste water, saline aquifer)
Long-term interactions between groundwater and mine excavations.
Alternatives to tailing impoundments
Optimized blasting and efficient crushing for lower energy consumption
CRITICAL MATERIALS STRATEGY 104
Materials Processing Innovations in the processing of ore into metals or other compounds are important for both the rare earth element and lithium supply chains. Processes with improved oxide or carbonate recovery, reduced energy consumption, reduced use of toxic agents and recycled or fully captured waste streams are most desired.
For rare earths, research could take advantage of such innovations as molecular design of solvent extraction reagents, advanced ion exchange, high-performance organic modifiers and advanced liquid membranes leveraging substantial U.S. knowledge base for heavy element chemistry. This heavy element chemistry scientific expertise has been developed for actinide chemistry in support of environmental management programs of DOE. Improved processes for extracting rare earths from mining tailings would also be beneficial. Valuable process enhancements for lithium include the energy-optimized conversion of ore to water-soluble lithium sulfates.
Recycling Research and Development The materials examined in this Strategy are often not recycled, in part because they are used in small quantities in many technologies, both on a total and a per-unit basis. Additionally, per kilogram market prices are generally low relative to precious metals, so recycling is often not cost effective. However, as the use of these materials increases in vehicles and other common technologies, recycling could make more economic sense. Recycled content could become valuable as a secondary source on the market, which can ease periods of tight supply. Relevant research includes the following:
• Technology, component and material design for disassembly and recycling
• Collection, logistics and reverse supply chain optimization
• Recycling process development
• Recycling and reconditioning rare-earth materials from spent fluorescent lamps (with particular attention to safe and economical disposal of mercury)
• Recycling and reconditioning rare-earth materials from manufacturing yield loss
• Methods for efficient demagnetization of rotating-machine components
• Metallic flux processes for recovering rare earths
9.2 Data Collection In developing this Strategy, DOE encountered a number of data gaps. Limited information is available, for example, with respect to the following:
• Annual production and consumption of individual rare earth metals
• Prices at which some rare earth metals trade
• Materials intensity of different energy technologies
• Potential for substitutes in different energy technologies, where critical materials are used
Good data contributes to sound policy- and decision-making. Reliable information is the basis for understanding the market situation, crafting goals and devising strategies to meet those goals. Data gaps make it challenging to assess material criticality, characterize markets and assess available

CRITICAL MATERIALS STRATEGY 105
technologies. Gaps in publicly available information also reduce the market’s ability to self-correct while complicating private sector planning. Finally, the data gaps will limit the future ability of DOE and its interagency partners to assess the effectiveness of policies pursued today.
For material supply data, the U.S. Geological Survey (USGS) is the U.S. government’s leading expert. Indeed USGS publicly available data on material supply, demand and pricing were invaluable in preparing this Strategy. Future analyses of critical materials will also depend on USGS data and information.
The Energy Information Administration (EIA), an independent agency within DOE, is the nation’s premier source of publicly-available energy information. EIA collects, analyzes and disseminates independent and impartial energy information. Enhancements to EIA’s existing data collection could significantly contribute to understanding of market dynamics with respect to critical materials. With appropriate resources, survey forms could be modified to collect key material content of various clean energy technologies.
Other parts of the Department of Energy, including the Office of Energy Efficiency and Renewable Energy and Office of Policy and International Affairs, also have expertise and maintain relationships that could be helpful in gathering relevant information to inform DOE planning.
In the months ahead, DOE will engage a broad range of stakeholders to better understand current trends, constraints and opportunities with respect to critical materials. DOE may hold additional technical workshops and/or issue additional Requests for Information related to these topics. DOE is considering developing periodic demand scenarios across clean energy technologies for individual rare earth elements as well as for lithium, cobalt, gallium, tellurium, cobalt and perhaps other key materials. The objective of these activities would include creating a more comprehensive understanding of the global market, providing more certainty to the private sector and facilitating investments. In all cases, DOE’s plans with respect to additional data collection are subject to the availability of appropriated funds.
9.3 Permitting for Domestic Production The Department of Energy does not regulate mining or mineral production. As a result, issues with respect to expedited permitting for domestic production of critical materials are mostly outside the scope of this Strategy.
However, the Department has a strong interest in ensuring diverse sources of supply for the critical materials necessary for clean energy technologies. Production within the United States is vitally important in that regard, for at least two reasons. First, the United States’ considerable reserves of some critical materials could add significantly to total global production and to greater diversity in the global supply of these materials. Second, U.S. technology and best practices developed during mine operations can help promote safe and responsible mining in other countries, further contributing to supply diversity and the sustainable development of resources.
DOE will work with interagency colleagues where possible and appropriate to improve permitting of mines for critical materials in the United States while ensuring that worker safety, environmental protection and other important values are fully protected. In that regard, the Department notes

CRITICAL MATERIALS STRATEGY 106
obtaining the permits necessary to open a mine takes on average 7–10 years in the United States. Federal, state and local agencies all play a role. 85
Options to simplify permitting may include improved coordination between state and federal agencies as well as among federal agencies during all stages of permitting.
These permits serve important public purposes, including protecting employee health and safety, protecting air and water quality, ensuring proper handling and disposal of radioactive substances and providing for remediation of soil and groundwater contamination. However this 7 to 10 year period is reportedly the longest among the top 25 mining countries (Behre Dolbear 2010). In Australia, by contrast, approvals take on average 1 to 2 years (Matthews 2010).
86
9.4 Financial Assistance for Domestic Production and Processing
In addition, government engagement with the private sector on best practices will better educate miners and prospectors before the permitting process begins. This can further accelerate mine development. Since the permitting process is often cited as one of the principal barriers to new mining ventures in the United States, a more coordinated and predictable regulatory process could encourage investment in new mines and eventually contribute to diversifying the global supply chain.
DOE lacks authority to provide financial support for the domestic production or processing of critical materials. Such authority is not provided under DOE’s Loan Guarantee program (Title 17 of the Energy Policy Act of 2005, as amended) or Advanced Technology Vehicle Manufacturing Program (section 136 of the Energy Independence and Security Act of 2007), nor is such authority provided under tax credit programs administered by Secretary of Treasury in consultation with DOE (including the Advanced Energy Manufacturing Tax Credit under Internal Revenue Code section 48c).
Loan Guarantee Program The Department of Energy is authorized to issue loan guarantees for several purposes. Under current law, DOE may issue loan guarantees for new or significantly improved technologies that reduce air pollutants including greenhouse gases (Section 1703 of Energy Policy Act of 2005); for renewable energy systems, including the manufacture of renewable energy system components (American Recovery and Reinvestment Act of 2009, amending Section 1705 of the
85 EPA, for example, has delegated federal regulatory authorities to states under the Clean Air Act, Clean Water Act and Resource Conservation and Recovery Act. A mine or processing plant may be required to obtain a series of permits under these acts before such a facility can begin operations. The securing of such permits requires the submittal of complex environmental modeling results which must show that a facility can meet its regulatory standards during operations. Further, if a mine or processing plant triggers a "major federal action" as defined under the National Environmental Protection Act, the facility may also be required to prepare an Environmental Impact Statement (EIS). Such an EIS can take up to two to five years to complete. 86 The Council for Environmental Quality is leading an interagency group for providing rapid response capability to fix coordination problems between federal agencies on renewable and transmission permit applications. A similar approach could apply to the mining permit process as well.

CRITICAL MATERIALS STRATEGY 107
Energy Policy Act of 2005); and for the manufacture of advanced technology vehicles in the United States (Section 136 of the Energy Independence and Security Act of 2007). 87
Each of these authorities may be available to support the use of rare earth metals or other critical materials for the primary purpose outlined in the statute. For example, DOE could issue loan guarantees for the domestic manufacture of magnets using rare earth metals, if those magnets will be part of renewable energy systems. DOE also has authority to issue loan guarantees for new or significantly improved technologies that reduce air pollution including greenhouse gases. This could apply, for example, to the processing of mineral ores including rare earth metals. However, DOE lacks authority to provide loan guarantees more generally for the mining or processing of rare earth metals or other critical materials.
The United States has a strong national interest in enhancing capacity for domestic production and maunfacturing of critical materials, which will help diversify the supply chain for certain materials. .
Price Supports One barrier to establishing and sustaining domestic production capacity for critical materials may be the ability of countries with considerable market share to cut prices, potentially driving mines in other countries out of business. If there is a national interest in the United States developing the capacity to produce rare earth metals and other critical materials domestically, it may be worth analyzing whether some type of price support system is appropriate. More data collection and analysis would be required to define the parameters of such a program, determine its potential costs and consider conditions under which it might be in the national interest.
9.5 Stockpiles Several countries have developed or are considering stockpiles for key materials, as described in Chapter 6. In addition, the DoD has moved to include many of the materials considered in this Strategy in a new Strategic Military Stockpile Program (SMSP), as described in Chapter 5. The SMSP will help meet the DoD’s legal requirement to provide special monitoring and attention for all strategic materials and ensure that those materials further deemed as critical to national security are also sourced domestically (Defense Strategic Materials Protection Board 2008).88
87 DOE also has limited authorities under the Defense Production Act (DPA) that could affect the production of critical materials. Under Title I of the DPA, DOE can exercise priority rights over private parties in procurement for projects that maximize domestic energy supplies, including those that maintain or further domestic energy exploration, production and refining. Title III of the DPA authorizes the President to provide incentives including loan guarantees for the development, modernization or expansion of domestic defensive productive capacity and supply. Recent Title III projects have included the development of a U.S.-owned domestic source for prismatic lithium-ion cells and batteries for spacecraft use.
88 The DoD defines a “strategic material” as one 1) which is essential for important defense systems, 2) which is unique in the function it performs and 3) for which there are no viable alternatives. A “critical material” is a strategic material for which 1) the Department of Defense dominates the market for the material, 2) the Department’s full and active involvement and support are necessary to sustain and shape the strategic direction of the market and 3) there is significant and unacceptable risk of supply disruption due to vulnerable U.S. or qualified non-U.S. suppliers.
CRITICAL MATERIALS STRATEGY 108
In theory, stockpiles could protect the United States from interruptions in supply from foreign producers. The existence of a stockpile, whether or not used, could have geopolitical significance, diminishing the leverage of monopoly suppliers in crisis situations. If coupled with purchase and price guarantees, stockpiles might also promote investment in new domestic mines by providing protection from commodity price swings.
However, stockpile authorities must purchase material that would otherwise be sold on the open market. This could be expensive and itself have market impacts, increasing the price of purchased commodities. Additions to stockpiles could induce shortages or price spikes if not done carefully.
Based on preliminary analysis, this Strategy does not recommend stockpiling critical materials for potential use in commercial clean energy technologies at this time. The demand projections for material use in clean energy technologies presented earlier in the Strategy highlight the difficulties in accurately forecasting material requirements due to uncertainties in market conditions, choice of component technologies among manufacturers and competing demands. From a practical standpoint, these factors would make it difficult to develop a national industrial stockpile with sufficient material stocks and flexibility. Even if material requirements could be calculated with a reasonable degree of certainty, the U.S. Government would incur significant upfront costs and downside risk to develop a stockpile sufficient to meet domestic material demand. Maintaining a national stockpile would also put the government at risk of distorting market price signals for key materials by competing with the private sector for materials on the open market. However, given the demonstrated interest of other nations, such as China, in stockpiling, this issue merits further study.
In addition, although stockpiling materials for clean energy technologies is not currently recommended, the DOE should work in close coordination with the DoD to understand and inform the development of the SMSP. This coordination would help identify areas where strategic materials requirements for military and other national security applications overlap with material requirements for clean energy technologies, to ensure that any actions by the SMSP do not adversely impact the development and deployment of clean energy technologies.
In the short term, DOE can encourage industry to increase private stocks and inventories, to the extent practicable and possible, in order to maintain resiliency in case of future supply disruptions. Private sector stocks of critical materials can then be traded between market participants to help balance supply and demand. Spreading stocks among participants will help buffer the market and provide necessary market adjustments. Such an approach would have to be applied carefully in order to avoid inducing or exacerbating shortages.
9.6 Recycling Policy Recycling can reduce the risk that supplies of critical materials fail to keep pace with demand. Recycling may be especially important for critical materials with limited substitutes. If done correctly, recycling can also reduce environmental impacts from disposal of end-of-life products and equipment (LaMonica 2010). Historically, few companies have recycled the materials examined in this Strategy because there was little economic incentive to do so. First, recoverable quantities were

CRITICAL MATERIALS STRATEGY 109
often too small and raw material prices too low, for recycling to be economically attractive. For example, there is currently little economic incentive for businesses to recover lithium from lithium-ion batteries in consumer electronics because the quantities found in each battery are small and the price of lithium is low compared to most other metals (Hamilton 2009). However, the economic equation may change for the larger lithium-ion batteries likely to be used in electric vehicles. Second, expensive and/or energy-intensive processes have often been required to recycle and separate materials to desired purity levels (Ames Laboratory 2010). Third, in many cases, there is not an efficient mechanism for the collection of end-of-life products and equipment (Umicore 2010).
Policies directed toward the recovery of end-of-life products and equipment can encourage a higher rate of recovery. Supporting research and development into more efficient and cost-effective recycling processes can also make recycling more attractive. In addition, government assistance can support the development of recycling infrastructure, particularly where there may be a growing need, such as for electric vehicle batteries. DOE will work with interagency colleagues to analyze these and other options.
9.7 Education and Workforce Training As the domestic industry in rare earth metals and other critical materials grows, a trained workforce will be increasingly important. Today, employment opportunities in these areas are limited, in part because of the small size of the sector. Yet the sector is less likely to grow without trained workers. Investment in education and training, alongside investment in productive capacity, can help support the country’s manufacturing base. A robust education and training system can help spur innovation. Cooperation among government, industry and research institutions can be important drivers of clean energy innovation.
In the years ahead, materials sciences will receive increasing attention in DOE’s internships, fellowships and scholarships. It is hoped that universities and corporate research labs will also encourage students to engage in research on rare earth elements and other key materials—. Postdoctoral fellowships can help train the next generation of materials scientists and engineers in these important areas. Expertise that would be valuable includes mineral and mining engineering, mineral economics, materials recycling technology and manufacturing engineering (NRC 2008). Finally, DOE will work with interagency partners such as DoD and the National Science Foundation to highlight the need for expertise in material sciences and help create opportunities in the public and private sectors. The strength of the U.S. industry in this sector depends on sufficient human capital to support mining and processing operations, as well as promote the innovations needed across the supply chain.
9.8 Diplomacy Many other countries are considering questions similar to those explored in this Strategy. Cooperation with those countries can provide useful information and help improve transparency in markets for critical materials. It can also help to optimize resources for research and accelerate research and development on key topics. For these reasons and more, DOE will work closely with counterparts in other governments in the years ahead.
CRITICAL MATERIALS STRATEGY 110
More broadly, addressing these issues will require sustained U.S. diplomatic engagement. Working closely with the State Department and other agencies, DOE will engage other countries through dialogues and collaborative institutions. A primary objective will be to maintain frequent and open communication with important stakeholders. Building on ongoing discussions with partners such as the European Union and Japan, DOE will engage significant producers and consumers of critical materials. DOE will participate in multilateral fora, such as the International Energy Agency, to advance our goals with respect to critical materials as well. On issues of trade promotion and compliance, DOE will support the U.S. Trade Representative in its efforts to uphold the rules-based global trading system and ensure open and fair global markets for producers and consumers of critical materials. As other nations pursue aggressive strategies to secure valuable resources, DOE can encourage others to avoid market manipulation and ensure a level playing field for all users.
As a dominant market player in a number of critical materials, China will be an important interlocutor. It is in the interest of both China and the United States to promote globally diverse, sustainable and economical supplies of clean energy materials for future use by both countries. Building on its existing energy diplomacy, DOE intends to work with China and other countries on these issues in the years ahead.
9. 9 Conclusions and Next Steps As the analysis in this report demonstrates, widespread global deployment of clean energy technologies will likely change the future pattern of material consumption in those technologies. This change may include a substantial increase in the demand for some critical materials with limited basic availability and limited diversity of supply over the short and medium term. Left unaddressed, this reality will severely hamper the United States’ ability to transition to a clean energy economy.
This Strategy presents three main goals for the critical materials market to begin addressing these challenges:
• Achieve globally diverse supplies
• Identify appropriate substitutes
• Improve recycling, reuse and more efficient use of critical materials
Achieving these goals will help mitigate supply risks and place the U.S. clean energy economy on a reliable and sustainable pathway. As a next step, DOE will work with U.S. Government partners to develop integrated programs and policies to achieve these goals. Possible policies include financial assistance for domestic processing and manufacturing, simplified permitting for domestic production, recycling and diplomacy.
Building on its deep technical expertise and the results of three workshops held on these topics in November and December 2010, DOE will develop its first integrated research plan with respect to critical materials. Priority attention will be devoted to magnets, batteries, PV films and phosphors. Innovations in environmentally sound extraction and materials processing will also be explored. DOE will also contribute to market transparency through enhanced data collection.
CRITICAL MATERIALS STRATEGY 111
Investments in research, education and training with respect to critical materials can help strengthen the U.S. economy, creating jobs in many sectors. Innovations in magnets, recycling and material processing, will likely have applications beyond the energy sector. Environmentally sound mineral extraction and materials processing can contribute to local acceptance of these activities, as well as reduce costs over the long term.
Taken collectively, these programs and policies represent a robust first response to the challenges identified in this report. They provide meaningful benefits at each stage of the critical materials supply chain and help advance U.S. efforts toward diverse supply, substitution and improved recycling and efficient use. Of course, these efforts are just the beginning of a long-term approach to an important issue that will require sustained attention and coordinated action in the years ahead.
References Ames Laboratory. 2010. “Responses to DOE Request for Information.” June 7.
Behre Dolbea. 2010. 2010 Ranking of Countries for Mining Investment.
Hamilton, T. “Lithium Battery Recycling Gets a Boost.” Technology Review. Accessed August 12. http://www.technologyreview.com/energy/23215/
LaMonica, M. “E-Waste Showdown Unearths Deeper Questions.” Green Tech, Jan. 16. http://news.cnet.com/8301-11128_3-10435193-54.html.
Matthews, R. G. “Permits Drag on U.S. Mining Projects.” Wall Street Journal, February 8, 2010.
NRC. 2008. “Minerals, Critical Minerals the U.S. Economy.” The National Academies Press.
Umicore. 2010. “Responses to DOE Request for Information.” June 7.

CRITICAL MATERIALS STRATEGY 112
Appendix A. Criticality Assessments by Element This appendix provides the detailed assessments of criticality for each of the key materials. The methodology used to develop the criticality scores was explained in Section 8.1. For each material, the scores for “importance to clean energy” and “supply risk” are based on weighted averages of a number of individual factor scores. The descriptions of each factor were also presented in Section 8.1. Table A-1 summarizes the assessment scores for each key material in both the short and medium terms.
Table A-1. Short and Medium Term Criticality Scores for Key Materials
Weight: 0.75 0.25 Weight: 0.4 0.1 0.2 0.1 0.2
Atomic #
Importance to Clean Energy
(Rounded Score)
Clean Energy Demand
Substitutabilty Limitations
Supply Risk (Rounded
Score)Basic
Availability
Competing Technology
Demand
Political, Regulatory, and Social
Factors
Co-dependence
with other markets
Producer Diversity
Short Termlithium 3 2 2 2 1 1 1 1 1 1
cobalt 27 2 2 2 2 1 2 3 2 2gallium 31 3 3 2 1 1 2 1 3 1yttrium 39 3 3 4 4 4 2 4 2 4indium 49 3 3 2 3 4 3 1 3 1
tellurium 52 3 3 2 2 3 2 1 3 1lanthanum 57 3 3 3 2 2 2 3 2 3
cerium 58 3 3 2 2 1 2 3 2 3praseodymium 59 2 2 1 2 2 1 3 3 3
neodymium 60 3 3 3 4 4 2 4 2 4samarium 62 1 1 1 2 2 1 3 3 3europium 63 3 3 4 3 3 2 4 3 4
terbium 65 3 3 3 4 4 2 4 4 4dysprosium 66 4 4 3 4 4 2 4 3 4
Importance to Clean Energy
(Rounded Score)
Clean Energy Demand
Substitutabilty Limitations
Supply Risk (Rounded
Score)Basic
Availability
Competing Technology
Demand
Political, Regulatory, and Social
Factors
Co-dependence
with other markets
Producer Diversity
Medium Termlithium 3 3 3 2 2 2 2 1 1 1
cobalt 27 2 2 2 2 1 2 2 2 2gallium 31 3 3 2 1 1 3 1 3 1yttrium 39 3 3 4 3 3 2 3 2 3indium 49 3 3 2 2 3 4 1 3 1
tellurium 52 3 3 2 2 3 2 1 3 1lanthanum 57 2 2 3 2 2 2 3 2 2
cerium 58 2 2 2 2 1 3 3 2 2praseodymium 59 2 2 1 2 2 2 3 3 2
neodymium 60 4 4 3 3 3 2 4 2 3samarium 62 1 1 1 2 2 2 3 3 2europium 63 3 3 4 3 3 2 3 3 3
terbium 65 3 3 3 4 4 2 4 4 3dysprosium 66 4 4 3 4 4 2 4 3 4

CRITICAL MATERIALS STRATEGY 113
The sections below provide the detailed assessments for each element. They are informed by the information in Chapter 3 and analysis in Chapter 7, but also take into account other available information impacting material criticality.
ELEMENT: LITHIUM (LI) ATOMIC NUMBER: 3 Light metallic element with unique electrochemical reactivity properties. Applications include use in ceramics and glass formulations, batteries, lubricating greases, air treatment facilities, continuous casting of metals and primary aluminum production.
Importance to Clean Energy: Short Term: 2; Medium Term: 3 The primary clean energy use of lithium is in batteries for electric-drive vehicles. Demand for these batteries- is expected to increase dramatically in the medium term.
CLEAN ENERGY DEMAND Short Term: 2 Medium Term: 3
• The Li demand for batteries is expected to increase significantly with the deployment of plug-in hybrid electric and all-electric vehicles. In the high material content case, it increases by an order of magnitude.
• Batteries could also be important to the successful integration of renewable electricity technologies in the context of Smart Grid development.
• In the medium term, Li-ion batteries may gain significant market share in hybrid-electric vehicles, which currently use nickel-metal hydride batteries.
SUBSTITUTABILITY LIMITATIONS Short Term: 2 Medium Term: 2
• Li-ion technology is seen as the most viable option for electric and plug-in hybrid vehicles, but improvements in Li-ion chemistries may significantly enhance the energy density and reduce the specific consumption of Li.
• Zinc-air batteries, sodium-sulfur batteries, fuel cells and super- or ultra-capacitors could substitute for Li-ion batteries in stationary configurations.
• Substitutes for Li are available for most ceramic, glass and lubricant applications. Supply Risk: Short Term: 1; Medium Term: 2 Supply is somewhat constrained by the limits of existing production facilities; a number of options for additional production exist in the medium term. There is no serious indication of long-term physical constraints on supply.
BASIC AVAILABILITY Short Term: 1 Medium Term: 2
• Produced most economically through saline brine evaporitic processes, but could be produced from hard rock and spodumene deposits in many other countries.
• Global production in 2008 was less than 0.5% of global reserves, which are estimated at 10 million tonnes.
• Low prices impede increased lithium production, but production has responded to increased demand for lithium used in battery applications.
• Recycling has been limited due to dispersion in end-use devices and the high cost of collection, separation and repurification. Successful commercialization of large-scale Li-ion batteries would dramatically improve prospects for recycling.
COMPETING TECHNOLOGY DEMAND Short Term: 1 Medium Term: 2
• Demand in primary aluminum production, ceramics and glass is likely to increase during the next decade, but at a slower rate than Li use for batteries.
• Use of Li-ion batteries for “smart-phones,” tablet computers and other hand-held devices could grow rapidly if unit cost reductions increase use.
POLITICAL, REGULATORY AND SOCIAL FACTORS Short Term: 1 Medium Term: 1
• No significant political, regulatory or social factors in the countries producing Li today. • Chile is currently the world’s largest producer. • New resources have been discovered in Bolivia, the largest in the world. Political and social
factors may inhibit development of Bolivian resources. Bolivian production should not be required to meet forecast demand in the short and medium term.
CO-DEPENDENCE ON OTHER MARKETS Short Term: 1 Medium Term: 1
• No significant co-dependence issues are likely to affect future lithium production.

CRITICAL MATERIALS STRATEGY 114
PRODUCER DIVERSITY Short Term: 1 Medium Term: 1
• Chile, Australia, China and Argentina and the U.S. are all leading mine producers.. • Six countries with major reserves.
References USGS (U.S. Geological Survey). 2010. 2008 Minerals Yearbook: Lithium. USGS (U.S. Geological Survey). 2010. Mineral Commodity Summary: Lithium.
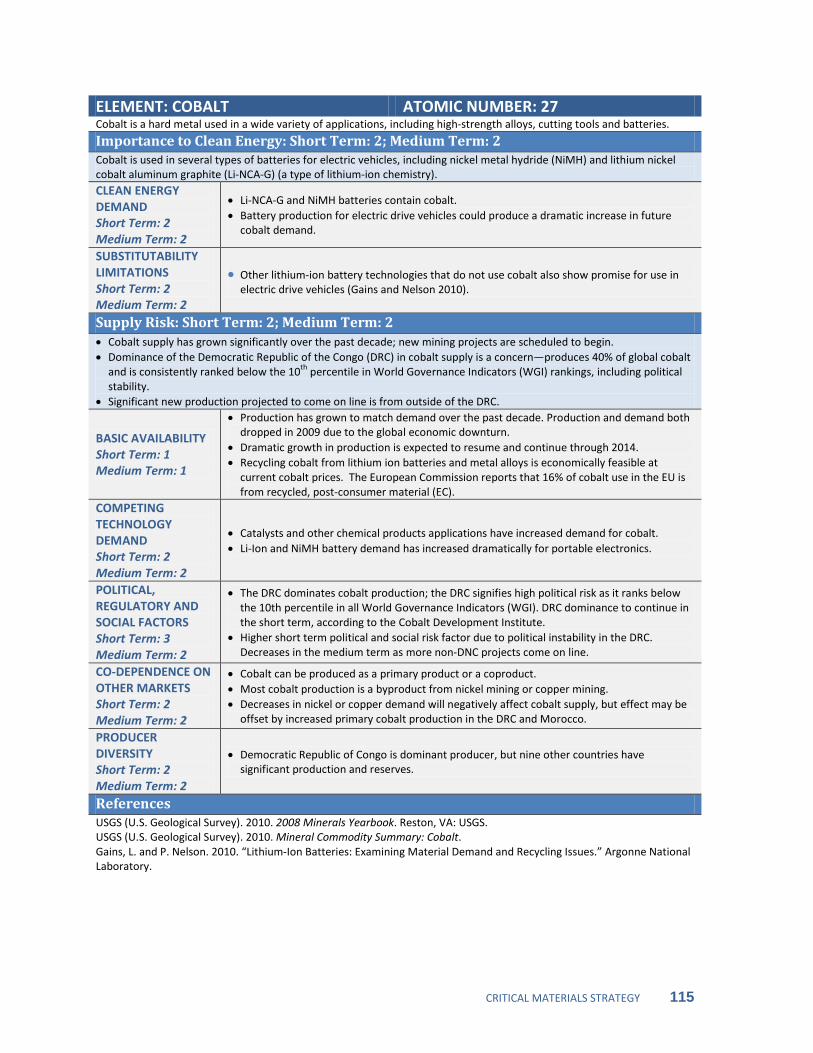
CRITICAL MATERIALS STRATEGY 115
ELEMENT: COBALT ATOMIC NUMBER: 27 Cobalt is a hard metal used in a wide variety of applications, including high-strength alloys, cutting tools and batteries.
Importance to Clean Energy: Short Term: 2; Medium Term: 2 Cobalt is used in several types of batteries for electric vehicles, including nickel metal hydride (NiMH) and lithium nickel cobalt aluminum graphite (Li-NCA-G) (a type of lithium-ion chemistry). CLEAN ENERGY DEMAND Short Term: 2 Medium Term: 2
• Li-NCA-G and NiMH batteries contain cobalt. • Battery production for electric drive vehicles could produce a dramatic increase in future
cobalt demand.
SUBSTITUTABILITY LIMITATIONS Short Term: 2 Medium Term: 2
• Other lithium-ion battery technologies that do not use cobalt also show promise for use in electric drive vehicles (Gains and Nelson 2010).
Supply Risk: Short Term: 2; Medium Term: 2 • Cobalt supply has grown significantly over the past decade; new mining projects are scheduled to begin. • Dominance of the Democratic Republic of the Congo (DRC) in cobalt supply is a concern—produces 40% of global cobalt
and is consistently ranked below the 10th percentile in World Governance Indicators (WGI) rankings, including political stability.
• Significant new production projected to come on line is from outside of the DRC.
BASIC AVAILABILITY Short Term: 1 Medium Term: 1
• Production has grown to match demand over the past decade. Production and demand both dropped in 2009 due to the global economic downturn.
• Dramatic growth in production is expected to resume and continue through 2014. • Recycling cobalt from lithium ion batteries and metal alloys is economically feasible at
current cobalt prices. The European Commission reports that 16% of cobalt use in the EU is from recycled, post-consumer material (EC).
COMPETING TECHNOLOGY DEMAND Short Term: 2 Medium Term: 2
• Catalysts and other chemical products applications have increased demand for cobalt. • Li-Ion and NiMH battery demand has increased dramatically for portable electronics.
POLITICAL, REGULATORY AND SOCIAL FACTORS Short Term: 3 Medium Term: 2
• The DRC dominates cobalt production; the DRC signifies high political risk as it ranks below the 10th percentile in all World Governance Indicators (WGI). DRC dominance to continue in the short term, according to the Cobalt Development Institute.
• Higher short term political and social risk factor due to political instability in the DRC. Decreases in the medium term as more non-DNC projects come on line.
CO-DEPENDENCE ON OTHER MARKETS Short Term: 2 Medium Term: 2
• Cobalt can be produced as a primary product or a coproduct. • Most cobalt production is a byproduct from nickel mining or copper mining. • Decreases in nickel or copper demand will negatively affect cobalt supply, but effect may be
offset by increased primary cobalt production in the DRC and Morocco.
PRODUCER DIVERSITY Short Term: 2 Medium Term: 2
• Democratic Republic of Congo is dominant producer, but nine other countries have significant production and reserves.
References USGS (U.S. Geological Survey). 2010. 2008 Minerals Yearbook. Reston, VA: USGS. USGS (U.S. Geological Survey). 2010. Mineral Commodity Summary: Cobalt. Gains, L. and P. Nelson. 2010. “Lithium-Ion Batteries: Examining Material Demand and Recycling Issues.” Argonne National Laboratory.
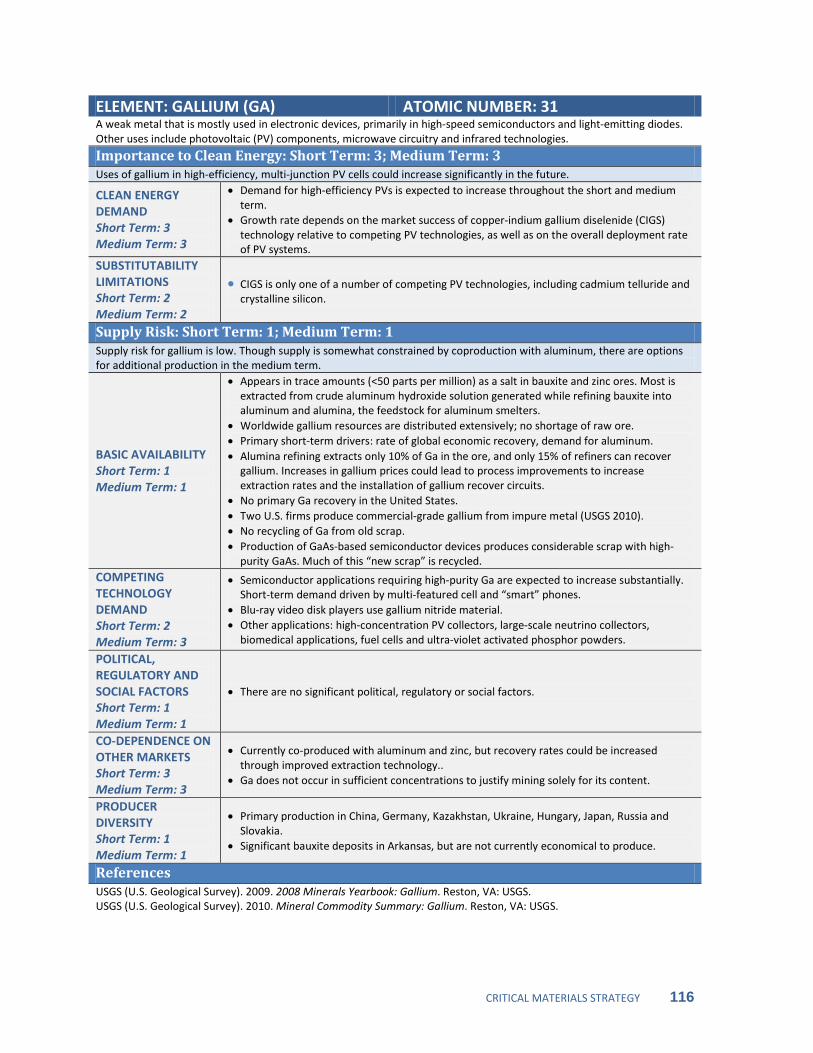
CRITICAL MATERIALS STRATEGY 116
ELEMENT: GALLIUM (GA) ATOMIC NUMBER: 31 A weak metal that is mostly used in electronic devices, primarily in high-speed semiconductors and light-emitting diodes. Other uses include photovoltaic (PV) components, microwave circuitry and infrared technologies.
Importance to Clean Energy: Short Term: 3; Medium Term: 3 Uses of gallium in high-efficiency, multi-junction PV cells could increase significantly in the future.
CLEAN ENERGY DEMAND Short Term: 3 Medium Term: 3
• Demand for high-efficiency PVs is expected to increase throughout the short and medium term.
• Growth rate depends on the market success of copper-indium gallium diselenide (CIGS) technology relative to competing PV technologies, as well as on the overall deployment rate of PV systems.
SUBSTITUTABILITY LIMITATIONS Short Term: 2 Medium Term: 2
• CIGS is only one of a number of competing PV technologies, including cadmium telluride and crystalline silicon.
Supply Risk: Short Term: 1; Medium Term: 1 Supply risk for gallium is low. Though supply is somewhat constrained by coproduction with aluminum, there are options for additional production in the medium term.
BASIC AVAILABILITY Short Term: 1 Medium Term: 1
• Appears in trace amounts (<50 parts per million) as a salt in bauxite and zinc ores. Most is extracted from crude aluminum hydroxide solution generated while refining bauxite into aluminum and alumina, the feedstock for aluminum smelters.
• Worldwide gallium resources are distributed extensively; no shortage of raw ore. • Primary short-term drivers: rate of global economic recovery, demand for aluminum. • Alumina refining extracts only 10% of Ga in the ore, and only 15% of refiners can recover
gallium. Increases in gallium prices could lead to process improvements to increase extraction rates and the installation of gallium recover circuits.
• No primary Ga recovery in the United States. • Two U.S. firms produce commercial-grade gallium from impure metal (USGS 2010). • No recycling of Ga from old scrap. • Production of GaAs-based semiconductor devices produces considerable scrap with high-
purity GaAs. Much of this “new scrap” is recycled. COMPETING TECHNOLOGY DEMAND Short Term: 2 Medium Term: 3
• Semiconductor applications requiring high-purity Ga are expected to increase substantially. Short-term demand driven by multi-featured cell and “smart” phones.
• Blu-ray video disk players use gallium nitride material. • Other applications: high-concentration PV collectors, large-scale neutrino collectors,
biomedical applications, fuel cells and ultra-violet activated phosphor powders.
POLITICAL, REGULATORY AND SOCIAL FACTORS Short Term: 1 Medium Term: 1
• There are no significant political, regulatory or social factors.
CO-DEPENDENCE ON OTHER MARKETS Short Term: 3 Medium Term: 3
• Currently co-produced with aluminum and zinc, but recovery rates could be increased through improved extraction technology..
• Ga does not occur in sufficient concentrations to justify mining solely for its content.
PRODUCER DIVERSITY Short Term: 1 Medium Term: 1
• Primary production in China, Germany, Kazakhstan, Ukraine, Hungary, Japan, Russia and Slovakia.
• Significant bauxite deposits in Arkansas, but are not currently economical to produce.
References USGS (U.S. Geological Survey). 2009. 2008 Minerals Yearbook: Gallium. Reston, VA: USGS. USGS (U.S. Geological Survey). 2010. Mineral Commodity Summary: Gallium. Reston, VA: USGS.
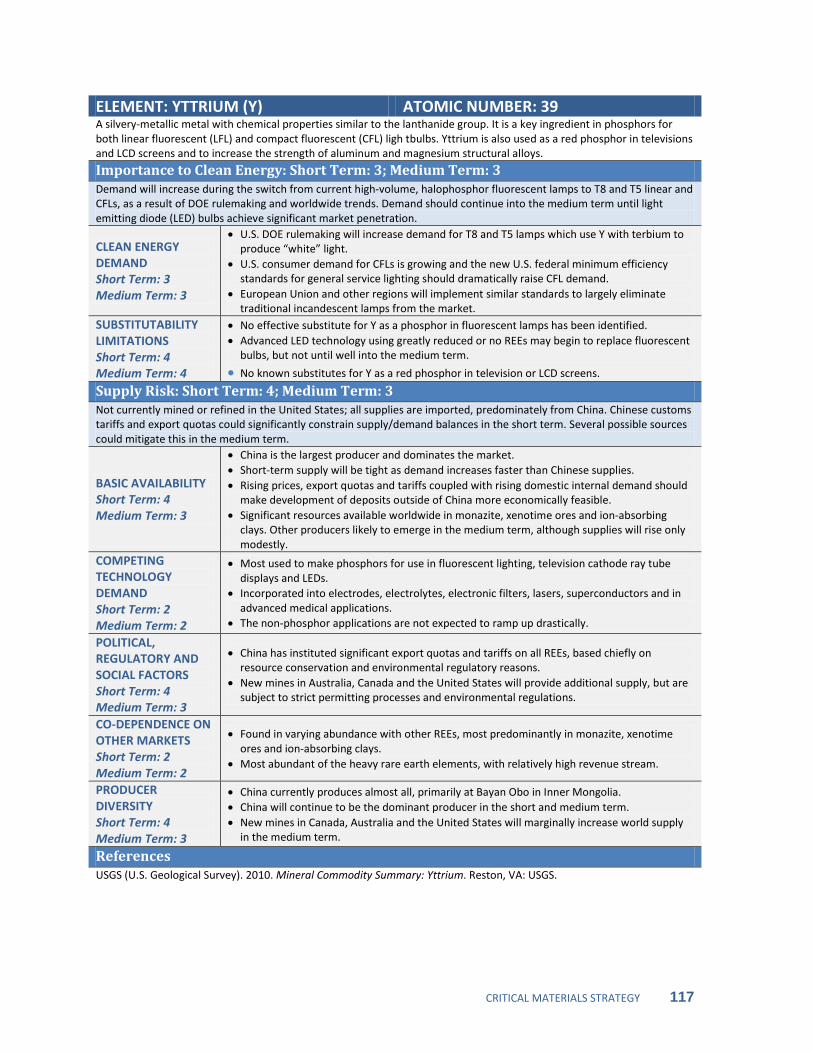
CRITICAL MATERIALS STRATEGY 117
ELEMENT: YTTRIUM (Y) ATOMIC NUMBER: 39 A silvery-metallic metal with chemical properties similar to the lanthanide group. It is a key ingredient in phosphors for both linear fluorescent (LFL) and compact fluorescent (CFL) ligh tbulbs. Yttrium is also used as a red phosphor in televisions and LCD screens and to increase the strength of aluminum and magnesium structural alloys.
Importance to Clean Energy: Short Term: 3; Medium Term: 3 Demand will increase during the switch from current high-volume, halophosphor fluorescent lamps to T8 and T5 linear and CFLs, as a result of DOE rulemaking and worldwide trends. Demand should continue into the medium term until light emitting diode (LED) bulbs achieve significant market penetration.
CLEAN ENERGY DEMAND Short Term: 3 Medium Term: 3
• U.S. DOE rulemaking will increase demand for T8 and T5 lamps which use Y with terbium to produce “white” light.
• U.S. consumer demand for CFLs is growing and the new U.S. federal minimum efficiency standards for general service lighting should dramatically raise CFL demand.
• European Union and other regions will implement similar standards to largely eliminate traditional incandescent lamps from the market.
SUBSTITUTABILITY LIMITATIONS Short Term: 4 Medium Term: 4
• No effective substitute for Y as a phosphor in fluorescent lamps has been identified. • Advanced LED technology using greatly reduced or no REEs may begin to replace fluorescent
bulbs, but not until well into the medium term.
• No known substitutes for Y as a red phosphor in television or LCD screens. Supply Risk: Short Term: 4; Medium Term: 3 Not currently mined or refined in the United States; all supplies are imported, predominately from China. Chinese customs tariffs and export quotas could significantly constrain supply/demand balances in the short term. Several possible sources could mitigate this in the medium term.
BASIC AVAILABILITY Short Term: 4 Medium Term: 3
• China is the largest producer and dominates the market. • Short-term supply will be tight as demand increases faster than Chinese supplies. • Rising prices, export quotas and tariffs coupled with rising domestic internal demand should
make development of deposits outside of China more economically feasible. • Significant resources available worldwide in monazite, xenotime ores and ion-absorbing
clays. Other producers likely to emerge in the medium term, although supplies will rise only modestly.
COMPETING TECHNOLOGY DEMAND Short Term: 2 Medium Term: 2
• Most used to make phosphors for use in fluorescent lighting, television cathode ray tube displays and LEDs.
• Incorporated into electrodes, electrolytes, electronic filters, lasers, superconductors and in advanced medical applications.
• The non-phosphor applications are not expected to ramp up drastically.
POLITICAL, REGULATORY AND SOCIAL FACTORS Short Term: 4 Medium Term: 3
• China has instituted significant export quotas and tariffs on all REEs, based chiefly on resource conservation and environmental regulatory reasons.
• New mines in Australia, Canada and the United States will provide additional supply, but are subject to strict permitting processes and environmental regulations.
CO-DEPENDENCE ON OTHER MARKETS Short Term: 2 Medium Term: 2
• Found in varying abundance with other REEs, most predominantly in monazite, xenotime ores and ion-absorbing clays.
• Most abundant of the heavy rare earth elements, with relatively high revenue stream.
PRODUCER DIVERSITY Short Term: 4 Medium Term: 3
• China currently produces almost all, primarily at Bayan Obo in Inner Mongolia. • China will continue to be the dominant producer in the short and medium term. • New mines in Canada, Australia and the United States will marginally increase world supply
in the medium term.
References USGS (U.S. Geological Survey). 2010. Mineral Commodity Summary: Yttrium. Reston, VA: USGS.
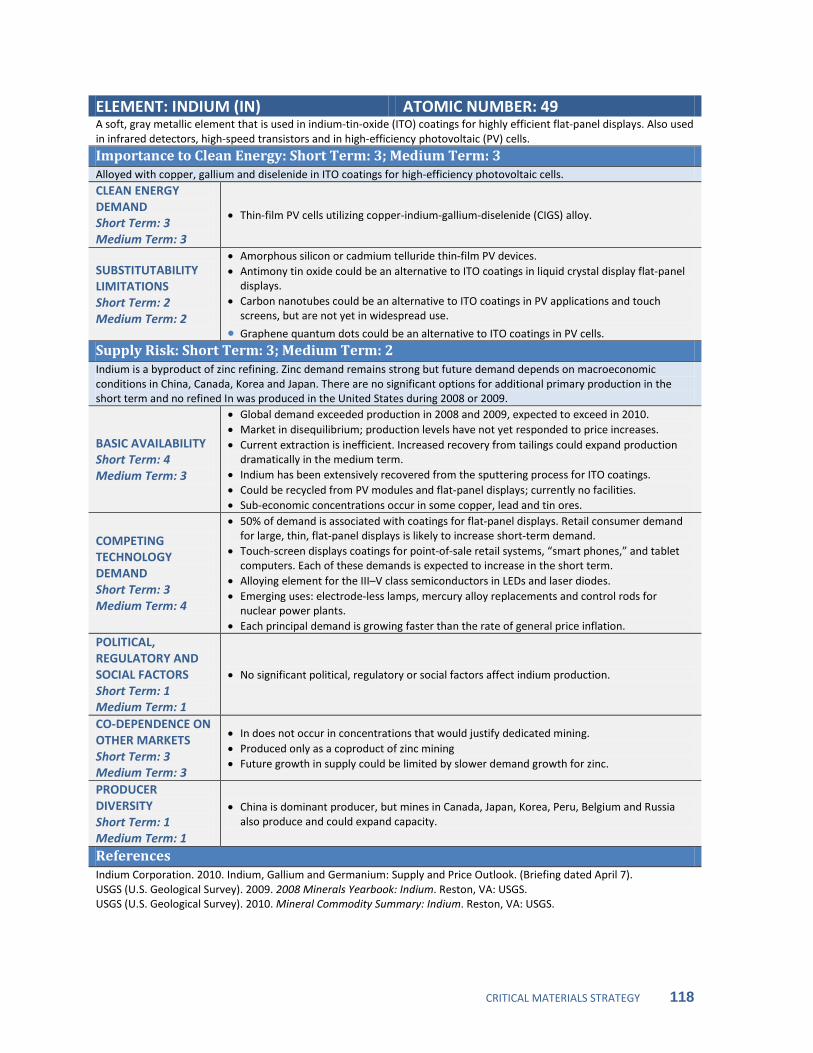
CRITICAL MATERIALS STRATEGY 118
ELEMENT: INDIUM (IN) ATOMIC NUMBER: 49 A soft, gray metallic element that is used in indium-tin-oxide (ITO) coatings for highly efficient flat-panel displays. Also used in infrared detectors, high-speed transistors and in high-efficiency photovoltaic (PV) cells.
Importance to Clean Energy: Short Term: 3; Medium Term: 3 Alloyed with copper, gallium and diselenide in ITO coatings for high-efficiency photovoltaic cells. CLEAN ENERGY DEMAND Short Term: 3 Medium Term: 3
• Thin-film PV cells utilizing copper-indium-gallium-diselenide (CIGS) alloy.
SUBSTITUTABILITY LIMITATIONS Short Term: 2 Medium Term: 2
• Amorphous silicon or cadmium telluride thin-film PV devices. • Antimony tin oxide could be an alternative to ITO coatings in liquid crystal display flat-panel
displays. • Carbon nanotubes could be an alternative to ITO coatings in PV applications and touch
screens, but are not yet in widespread use.
• Graphene quantum dots could be an alternative to ITO coatings in PV cells. Supply Risk: Short Term: 3; Medium Term: 2 Indium is a byproduct of zinc refining. Zinc demand remains strong but future demand depends on macroeconomic conditions in China, Canada, Korea and Japan. There are no significant options for additional primary production in the short term and no refined In was produced in the United States during 2008 or 2009.
BASIC AVAILABILITY Short Term: 4 Medium Term: 3
• Global demand exceeded production in 2008 and 2009, expected to exceed in 2010. • Market in disequilibrium; production levels have not yet responded to price increases. • Current extraction is inefficient. Increased recovery from tailings could expand production
dramatically in the medium term. • Indium has been extensively recovered from the sputtering process for ITO coatings. • Could be recycled from PV modules and flat-panel displays; currently no facilities. • Sub-economic concentrations occur in some copper, lead and tin ores.
COMPETING TECHNOLOGY DEMAND Short Term: 3 Medium Term: 4
• 50% of demand is associated with coatings for flat-panel displays. Retail consumer demand for large, thin, flat-panel displays is likely to increase short-term demand.
• Touch-screen displays coatings for point-of-sale retail systems, “smart phones,” and tablet computers. Each of these demands is expected to increase in the short term.
• Alloying element for the III–V class semiconductors in LEDs and laser diodes. • Emerging uses: electrode-less lamps, mercury alloy replacements and control rods for
nuclear power plants. • Each principal demand is growing faster than the rate of general price inflation.
POLITICAL, REGULATORY AND SOCIAL FACTORS Short Term: 1 Medium Term: 1
• No significant political, regulatory or social factors affect indium production.
CO-DEPENDENCE ON OTHER MARKETS Short Term: 3 Medium Term: 3
• In does not occur in concentrations that would justify dedicated mining. • Produced only as a coproduct of zinc mining • Future growth in supply could be limited by slower demand growth for zinc.
PRODUCER DIVERSITY Short Term: 1 Medium Term: 1
• China is dominant producer, but mines in Canada, Japan, Korea, Peru, Belgium and Russia also produce and could expand capacity.
References Indium Corporation. 2010. Indium, Gallium and Germanium: Supply and Price Outlook. (Briefing dated April 7). USGS (U.S. Geological Survey). 2009. 2008 Minerals Yearbook: Indium. Reston, VA: USGS. USGS (U.S. Geological Survey). 2010. Mineral Commodity Summary: Indium. Reston, VA: USGS.

CRITICAL MATERIALS STRATEGY 119
ELEMENT: TELLURIUM (TE) ATOMIC NUMBER: 52 A brittle, silvery-white metallic element used in photovoltaic (PV) film, steel alloys, rubber processing, synthetic fibers and electronics.
Importance to Clean Energy: Short Term: 3; Medium Term: 3 PV films are currently a significant part of global Te demand, mainly due to the rapid expansion of a single company, First Solar. Other PV technologies are available.
CLEAN ENERGY DEMAND Short Term: 3 Medium Term: 3
• Used in cadmium telluride (CdTe) PV thin films. As of 2008, CdTe was about 8% of the 7 gigawatt (GW) global PV market (DOE 2010) and expanding.
• Current demand for PVs accounts for about 17 % of the overall global Te demand. • As the PV market expands, CdTe will likely compete with other PV technologies. • PV industry trend towards reducing material intensity for thin film active layers.
SUBSTITUTABILITY LIMITATIONS Short Term: 2 Medium Term: 2
• CdTe is one of a number of PV thin film technologies, including copper indium diselenide (CIS), amorphous silicon and copper zinc tin sulfide (CZTS). Note that CIS also uses indium.
• Future demand depends on market success of CdTe versus competing PV technologies, as well as the overall deployment rate of PV.
Supply Risk: Short Term: 2; Medium Term: 2 Te is only produced as a secondary product of copper and to a lesser extent, other nonferrous metals. Though there is only one firm in the United States producing commercial-grade tellurium, production is well distributed globally.
BASIC AVAILABILITY Short Term: 3 Medium Term: 3
• Currently dependent on production of copper. • Production has not increased with production of CdTe PV films and increases in electronic
applications, contributing to a constrained supply. This is expected to ease slightly as more Te is extracted from existing anode slimes.
• Historically, Te has been recycled from copier drums. Reduced use of these drums has reduced available scrap, meaning currently there is little to no recycling of Te.
COMPETING TECHNOLOGY DEMAND Short Term: 2 Medium Term: 2
• There is some flexibility in the overall demand picture, with the bulk of current Te use currently coming in relatively low-value steel alloys that have alternate formulations.
• Recent reductions in use in steel alloys have not quite counterbalanced increases in demand for PV, thermal imaging, thermoelectric applications and other electronics.
POLITICAL, REGULATORY AND SOCIAL FACTORS Short Term: 1 Medium Term: 1
• There are no significant political, regulatory or social factors.
CO-DEPENDENCE ON OTHER MARKETS Short Term: 3 Medium Term: 3
• Co-produced from the anode slimes from electrolytic refining of copper; does not occur in concentrations high enough to justify mining solely for its content.
• The price of Te is not high enough to drive increases in copper production, though primary copper production continues to increase globally.
• Additional production and recovery methods could mitigate coproduction risk. PRODUCER DIVERSITY Short Term: 1 Medium Term: 1
• High level of producer diversity; available from the United States, Canada, Japan, Peru, Australia, Belgium, China, Germany, Kazakhstan, the Philippines and Russia.
References DOE (U.S. Department of Energy). 2010. 2008 Solar Technologies Market Report. USGS (U.S. Geological Survey). 2009. 2008 Minerals Yearbook: Selenium and Tellurium. Reston, VA: USGS. USGS (U.S. Geological Survey). 2010a. Mineral Commodity Summary. Reston, VA: USGS. USGS (U.S. Geological Survey). 2010b. 2008 Minerals Yearbook: Copper. Reston, VA: USGS.
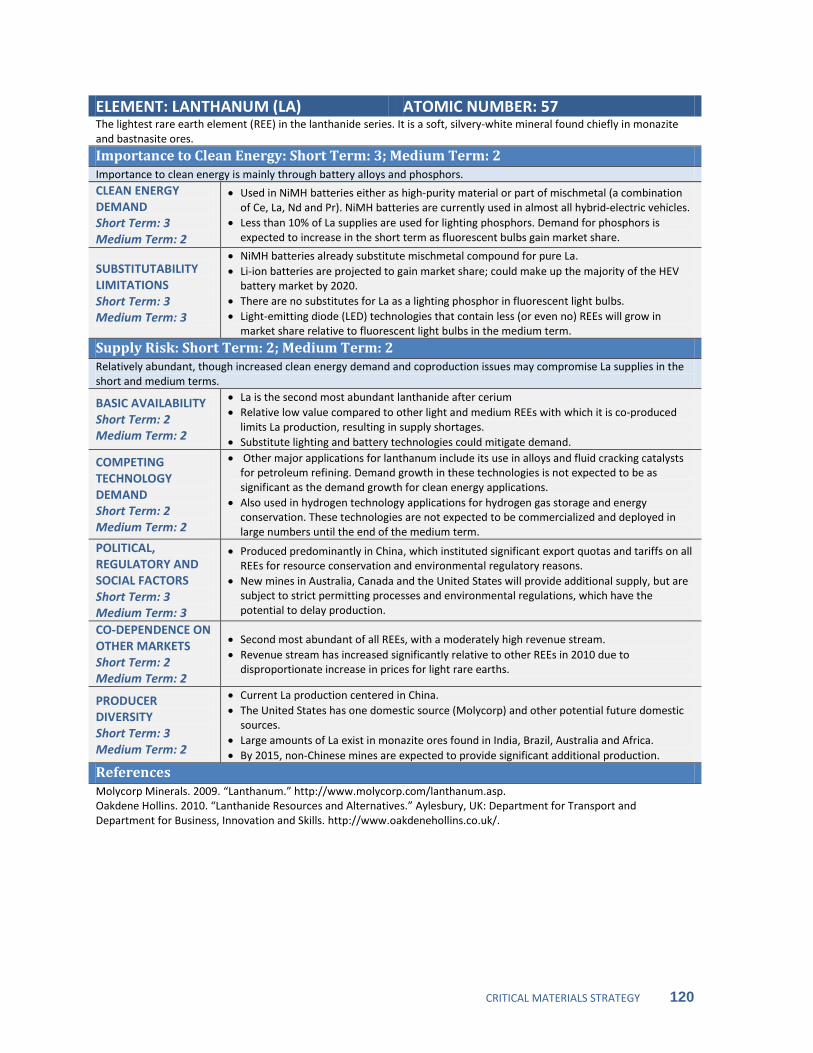
CRITICAL MATERIALS STRATEGY 120
ELEMENT: LANTHANUM (LA) ATOMIC NUMBER: 57 The lightest rare earth element (REE) in the lanthanide series. It is a soft, silvery-white mineral found chiefly in monazite and bastnasite ores.
Importance to Clean Energy: Short Term: 3; Medium Term: 2 Importance to clean energy is mainly through battery alloys and phosphors. CLEAN ENERGY DEMAND Short Term: 3 Medium Term: 2
• Used in NiMH batteries either as high-purity material or part of mischmetal (a combination of Ce, La, Nd and Pr). NiMH batteries are currently used in almost all hybrid-electric vehicles.
• Less than 10% of La supplies are used for lighting phosphors. Demand for phosphors is expected to increase in the short term as fluorescent bulbs gain market share.
SUBSTITUTABILITY LIMITATIONS Short Term: 3 Medium Term: 3
• NiMH batteries already substitute mischmetal compound for pure La. • Li-ion batteries are projected to gain market share; could make up the majority of the HEV
battery market by 2020. • There are no substitutes for La as a lighting phosphor in fluorescent light bulbs. • Light-emitting diode (LED) technologies that contain less (or even no) REEs will grow in
market share relative to fluorescent light bulbs in the medium term.
Supply Risk: Short Term: 2; Medium Term: 2 Relatively abundant, though increased clean energy demand and coproduction issues may compromise La supplies in the short and medium terms.
BASIC AVAILABILITY Short Term: 2 Medium Term: 2
• La is the second most abundant lanthanide after cerium • Relative low value compared to other light and medium REEs with which it is co-produced
limits La production, resulting in supply shortages. • Substitute lighting and battery technologies could mitigate demand.
COMPETING TECHNOLOGY DEMAND Short Term: 2 Medium Term: 2
• Other major applications for lanthanum include its use in alloys and fluid cracking catalysts for petroleum refining. Demand growth in these technologies is not expected to be as significant as the demand growth for clean energy applications.
• Also used in hydrogen technology applications for hydrogen gas storage and energy conservation. These technologies are not expected to be commercialized and deployed in large numbers until the end of the medium term.
POLITICAL, REGULATORY AND SOCIAL FACTORS Short Term: 3 Medium Term: 3
• Produced predominantly in China, which instituted significant export quotas and tariffs on all REEs for resource conservation and environmental regulatory reasons.
• New mines in Australia, Canada and the United States will provide additional supply, but are subject to strict permitting processes and environmental regulations, which have the potential to delay production.
CO-DEPENDENCE ON OTHER MARKETS Short Term: 2 Medium Term: 2
• Second most abundant of all REEs, with a moderately high revenue stream. • Revenue stream has increased significantly relative to other REEs in 2010 due to
disproportionate increase in prices for light rare earths.
PRODUCER DIVERSITY Short Term: 3 Medium Term: 2
• Current La production centered in China. • The United States has one domestic source (Molycorp) and other potential future domestic
sources. • Large amounts of La exist in monazite ores found in India, Brazil, Australia and Africa. • By 2015, non-Chinese mines are expected to provide significant additional production.
References Molycorp Minerals. 2009. “Lanthanum.” http://www.molycorp.com/lanthanum.asp. Oakdene Hollins. 2010. “Lanthanide Resources and Alternatives.” Aylesbury, UK: Department for Transport and Department for Business, Innovation and Skills. http://www.oakdenehollins.co.uk/.
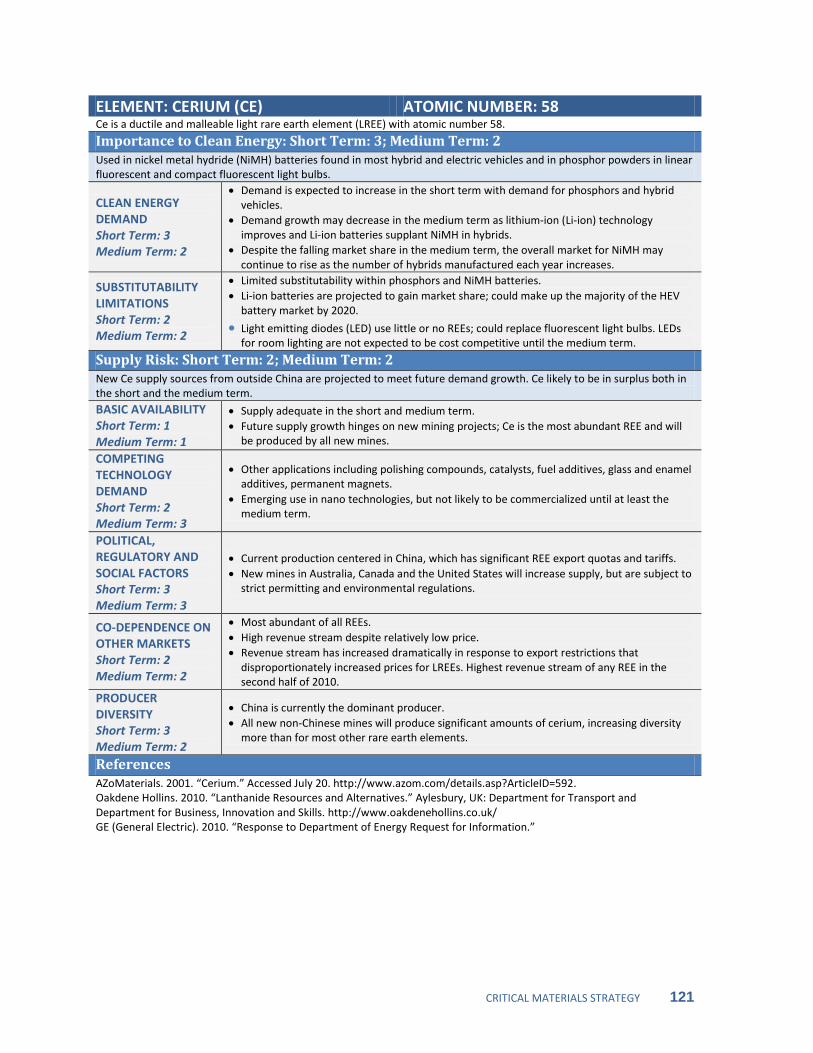
CRITICAL MATERIALS STRATEGY 121
ELEMENT: CERIUM (CE) ATOMIC NUMBER: 58 Ce is a ductile and malleable light rare earth element (LREE) with atomic number 58.
Importance to Clean Energy: Short Term: 3; Medium Term: 2 Used in nickel metal hydride (NiMH) batteries found in most hybrid and electric vehicles and in phosphor powders in linear fluorescent and compact fluorescent light bulbs.
CLEAN ENERGY DEMAND Short Term: 3 Medium Term: 2
• Demand is expected to increase in the short term with demand for phosphors and hybrid vehicles.
• Demand growth may decrease in the medium term as lithium-ion (Li-ion) technology improves and Li-ion batteries supplant NiMH in hybrids.
• Despite the falling market share in the medium term, the overall market for NiMH may continue to rise as the number of hybrids manufactured each year increases.
SUBSTITUTABILITY LIMITATIONS Short Term: 2 Medium Term: 2
• Limited substitutability within phosphors and NiMH batteries. • Li-ion batteries are projected to gain market share; could make up the majority of the HEV
battery market by 2020.
• Light emitting diodes (LED) use little or no REEs; could replace fluorescent light bulbs. LEDs for room lighting are not expected to be cost competitive until the medium term.
Supply Risk: Short Term: 2; Medium Term: 2 New Ce supply sources from outside China are projected to meet future demand growth. Ce likely to be in surplus both in the short and the medium term. BASIC AVAILABILITY Short Term: 1 Medium Term: 1
• Supply adequate in the short and medium term. • Future supply growth hinges on new mining projects; Ce is the most abundant REE and will
be produced by all new mines.
COMPETING TECHNOLOGY DEMAND Short Term: 2 Medium Term: 3
• Other applications including polishing compounds, catalysts, fuel additives, glass and enamel additives, permanent magnets.
• Emerging use in nano technologies, but not likely to be commercialized until at least the medium term.
POLITICAL, REGULATORY AND SOCIAL FACTORS Short Term: 3 Medium Term: 3
• Current production centered in China, which has significant REE export quotas and tariffs. • New mines in Australia, Canada and the United States will increase supply, but are subject to
strict permitting and environmental regulations.
CO-DEPENDENCE ON OTHER MARKETS Short Term: 2 Medium Term: 2
• Most abundant of all REEs. • High revenue stream despite relatively low price. • Revenue stream has increased dramatically in response to export restrictions that
disproportionately increased prices for LREEs. Highest revenue stream of any REE in the second half of 2010.
PRODUCER DIVERSITY Short Term: 3 Medium Term: 2
• China is currently the dominant producer. • All new non-Chinese mines will produce significant amounts of cerium, increasing diversity
more than for most other rare earth elements.
References AZoMaterials. 2001. “Cerium.” Accessed July 20. http://www.azom.com/details.asp?ArticleID=592. Oakdene Hollins. 2010. “Lanthanide Resources and Alternatives.” Aylesbury, UK: Department for Transport and Department for Business, Innovation and Skills. http://www.oakdenehollins.co.uk/ GE (General Electric). 2010. “Response to Department of Energy Request for Information.”

CRITICAL MATERIALS STRATEGY 122
ELEMENT: PRASEODYMIUM (PR) ATOMIC NUMBER: 59 A light rare earth element (LREE) used in a variety of technologies, including clean energy. It is a soft, silvery, malleable and ductile metal. Pr is paramagnetic at any temperature above 1 K.
Importance to Clean Energy: Short Term: 2; Medium Term: 2 Can partially substitute for neodymium in neodymium-iron-boron magnets for electric vehicle motors and wind turbine generators. Pr and several other LREEs are also used in mischmetal for nickel metal hydride batteries.
CLEAN ENERGY DEMAND Short Term: 2 Medium Term: 2
• Praseodymium is used as a minor constituent of neodymium magnets and mischmetal in nickel metal hydride batteries.
• Substituted for neodymium (Nd) in NdFeB permanent magnets at a ratio of 1 Pr for 4 Nd. This ratio matches the natural abundance of the elements, reducing the Nd requirement while increasing the limited market for Pr (Ames Laboratory 2010).
• May help augment the field strength of NdFeB magnets when it is reduced by the addition of dysprosium (to increase temperature performance) (Hykaway 2010).
SUBSTITUTABILITY LIMITATIONS Short Term: 1 Medium Term: 1
• Generally used as a substitute for other REEs in clean energy applications, not as a primary material.
Supply Risk: Short Term: 2; Medium Term: 2 Although it is the least abundant of the light REEs, Pr supply should meet demand in the short and medium term. BASIC AVAILABILITY Short Term: 2 Medium Term: 2
• Least abundant LREE in bastnasite and monazite, but supply projected to meet demand in the short and medium term.
• New mines will significantly increase supply by 2015 (see table 7-2).
COMPETING TECHNOLOGY DEMAND Short Term: 1 Medium Term: 2
• Used in lighter flints, glass polishing, lasers, magnets and batteries. • Emerging applications include magnetic refrigeration, high-temperature superconductivity
and hydrogen storage. • Demand for Pr in clean energy applications is expected to increase more significantly than in
non-clean energy applications.
POLITICAL, REGULATORY AND SOCIAL FACTORS Short Term: 3 Medium Term: 3
• Produced predominantly in China, which instituted significant export quotas and tariffs on REEs for resource conservation and environmental regulatory reasons.
• New mines in Australia, Canada and the United States will provide additional supply, but are subject to strict permitting processes and environmental regulations.
CO-DEPENDENCE ON OTHER MARKETS Short Term: 3 Medium Term: 3
• Less abundant than other LREEs in bastnazite or monazite. • Moderate revenue stream is lower than other LREEs but comparable with HREEs. • Revenue stream has increased less than other LREEs in response to recent export
restrictions.
PRODUCER DIVERSITY Short Term: 3 Medium Term: 2
• Additional short-term sources may include Molycorp, Mount Weld and Nolans. • New mines projected to increase supply by almost 50% in the short term (see figure 7-2). • Additional medium-term production capacities and producer diversity is expected.
References Ames Laboratory. 2010. “The Ames Laboratory Response to U.S. Department of Energy’s Request for Information.” Hykaway, J. 2010. The Rare Earths: Pick Your Spots Carefully. Byron Capital Markets.
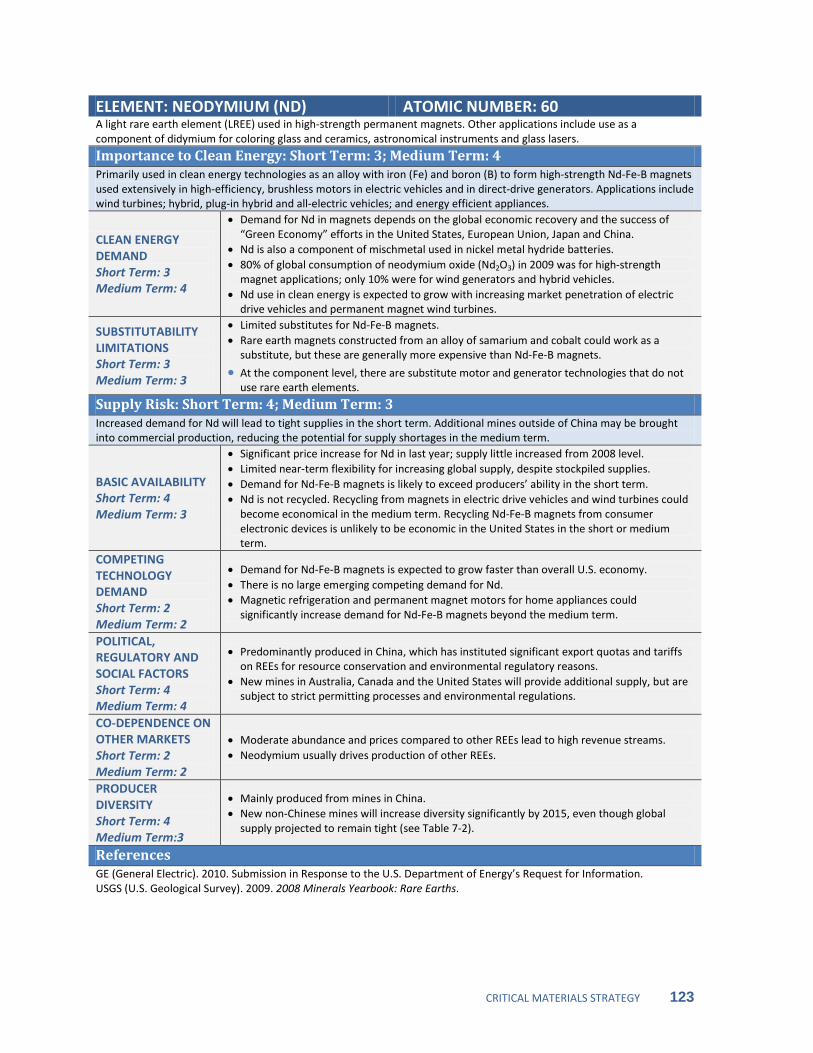
CRITICAL MATERIALS STRATEGY 123
ELEMENT: NEODYMIUM (ND) ATOMIC NUMBER: 60 A light rare earth element (LREE) used in high-strength permanent magnets. Other applications include use as a component of didymium for coloring glass and ceramics, astronomical instruments and glass lasers.
Importance to Clean Energy: Short Term: 3; Medium Term: 4 Primarily used in clean energy technologies as an alloy with iron (Fe) and boron (B) to form high-strength Nd-Fe-B magnets used extensively in high-efficiency, brushless motors in electric vehicles and in direct-drive generators. Applications include wind turbines; hybrid, plug-in hybrid and all-electric vehicles; and energy efficient appliances.
CLEAN ENERGY DEMAND Short Term: 3 Medium Term: 4
• Demand for Nd in magnets depends on the global economic recovery and the success of “Green Economy” efforts in the United States, European Union, Japan and China.
• Nd is also a component of mischmetal used in nickel metal hydride batteries. • 80% of global consumption of neodymium oxide (Nd2O3) in 2009 was for high-strength
magnet applications; only 10% were for wind generators and hybrid vehicles. • Nd use in clean energy is expected to grow with increasing market penetration of electric
drive vehicles and permanent magnet wind turbines.
SUBSTITUTABILITY LIMITATIONS Short Term: 3 Medium Term: 3
• Limited substitutes for Nd-Fe-B magnets. • Rare earth magnets constructed from an alloy of samarium and cobalt could work as a
substitute, but these are generally more expensive than Nd-Fe-B magnets.
• At the component level, there are substitute motor and generator technologies that do not use rare earth elements.
Supply Risk: Short Term: 4; Medium Term: 3 Increased demand for Nd will lead to tight supplies in the short term. Additional mines outside of China may be brought into commercial production, reducing the potential for supply shortages in the medium term.
BASIC AVAILABILITY Short Term: 4 Medium Term: 3
• Significant price increase for Nd in last year; supply little increased from 2008 level. • Limited near-term flexibility for increasing global supply, despite stockpiled supplies. • Demand for Nd-Fe-B magnets is likely to exceed producers’ ability in the short term. • Nd is not recycled. Recycling from magnets in electric drive vehicles and wind turbines could
become economical in the medium term. Recycling Nd-Fe-B magnets from consumer electronic devices is unlikely to be economic in the United States in the short or medium term.
COMPETING TECHNOLOGY DEMAND Short Term: 2 Medium Term: 2
• Demand for Nd-Fe-B magnets is expected to grow faster than overall U.S. economy. • There is no large emerging competing demand for Nd. • Magnetic refrigeration and permanent magnet motors for home appliances could
significantly increase demand for Nd-Fe-B magnets beyond the medium term.
POLITICAL, REGULATORY AND SOCIAL FACTORS Short Term: 4 Medium Term: 4
• Predominantly produced in China, which has instituted significant export quotas and tariffs on REEs for resource conservation and environmental regulatory reasons.
• New mines in Australia, Canada and the United States will provide additional supply, but are subject to strict permitting processes and environmental regulations.
CO-DEPENDENCE ON OTHER MARKETS Short Term: 2 Medium Term: 2
• Moderate abundance and prices compared to other REEs lead to high revenue streams. • Neodymium usually drives production of other REEs.
PRODUCER DIVERSITY Short Term: 4 Medium Term:3
• Mainly produced from mines in China. • New non-Chinese mines will increase diversity significantly by 2015, even though global
supply projected to remain tight (see Table 7-2).
References GE (General Electric). 2010. Submission in Response to the U.S. Department of Energy’s Request for Information. USGS (U.S. Geological Survey). 2009. 2008 Minerals Yearbook: Rare Earths.

CRITICAL MATERIALS STRATEGY 124
ELEMENT: SAMARIUM (SM) ATOMIC NUMBER: 62 A light rare earth element (LREE) used in a number of applications, including magnets, military equipment, catalysts and nuclear reactors. It is a lustrous silver-white metal found along with other REEs in monazite, bastnasite and samarskite geological deposits.
Importance to Clean Energy: Short Term: 1; Medium Term: 1 Samarium cobalt (SmCo) permanent magnets are slightly less powerful by size and weight than non-Sm containing neodymium-iron-boron (NdFeB) magnets, though SmCo permanent magnets have higher temperature ratings that make them appropriate for certain motor and generator applications (Electron Energy Corporation 2010). SmCo permanent magnets are not currently used extensively in clean energy applications. CLEAN ENERGY DEMAND Short Term: 1 Medium Term: 1
• SmCo magnets are not likely to be used extensively in clean energy applications in the short or medium term.
SUBSTITUTABILITY LIMITATIONS Short Term: 1 Medium Term: 1
• Due to the limited use of samarium in clean energy applications, substitutability is not an issue.
Supply Risk: Short Term: 2; Medium Term: 2 Samarium is projected to be in excess supply both in the short and medium term. BASIC AVAILABILITY Short Term: 2 Medium Term: 2
• 2010 production is projected to be approximately twice current demand (Kingsnorth 2010). • This trend is forecast to continue, with new mines opening by 2015 projected to increase
production capacity by about 30% (see Table 7.2).
COMPETING TECHNOLOGY DEMAND Short Term: 1 Medium Term: 2
• Used to manufacture components for industrial, commercial and military uses. • SmCo magnets are used in precision-guided weapons due to their ability to operate at high
temperatures. • Samarium oxide is used as a neutron absorber in nuclear power plants.
POLITICAL, REGULATORY AND SOCIAL FACTORS Short Term: 3 Medium Term: 3
• Produced predominantly in China, which instituted significant export quotas and tariffs on REEs based on resource conservation and environmental regulations.
• New mines in Australia, Canada and the United States will provide additional supply, but are subject to strict permitting processes and environmental regulations, which have the potential to delay production.
CO-DEPENDENCE ON OTHER MARKETS Short Term: 3 Medium Term: 3
• Moderately abundant compared to other REEs. • Limited demand and correspondingly low relative prices mean that other more valuable REEs
are more likely to drive production decisions.
PRODUCER DIVERSITY Short Term: 3 Medium Term: 2
• Samarium is found in significant quantities in non-Chinese mines likely to begin production in the short to medium term. Samarium production from non-Chinese sources is likely to account for over 25% of global supply by 2015 (see Table 7-2).
References Kingsnorth, D. 2010. Interview. October 10. Electron Energy Corporation. 2010. “Response to Department of Energy Request for Information.” June 7.

CRITICAL MATERIALS STRATEGY 125
ELEMENT: EUROPIUM (EU) ATOMIC NUMBER: 63 A heavy rare earth element (HREE) with the atomic number 63, Eu is a ductile metal with the same relative hardness of lead. Combining Eu phosphor compounds with terbium phosphor compounds produces the white light of helical fluorescent light bulbs and is a primary component in the production of T8 and T5 fluorescent tubes.
Importance to Clean Energy: Short Term: 3; Medium Term: 3 Demand will increase during the anticipated switch from high-volume halophosphor fluorescent lamps to T8 and T5 linear and compact fluorescent tubes as a result of DOE rulemaking and worldwide trends. Increased demand is expected until light emitting diode (LED) bulbs (which use much less REEs) achieve significant market penetration.
CLEAN ENERGY DEMAND Short Term: 3 Medium Term: 3
• Beginning in July 2012, U.S. DOE rulemaking on general service fluorescent lamps will increase demand for linear fluorescent lamps (LFLs), which use Eu phosphors.
• U.S. consumer demand for compact fluorescent lights (CFLs) is growing. On January 1, 2012, new U.S. federal minimum efficiency standards for general service lighting will dramatically raise demand for CFLs and consequently demand for Eu.
• Similar standards will be implemented in the European Union and other regions and will largely eliminate traditional incandescent lamps from the market.
SUBSTITUTABILITY LIMITATIONS Short Term: 4 Medium Term: 4
• No proven substitute for Eu in fluorescent lamps has been identified. • No known substitutes for Eu as a red phosphor in television or LCD screens.
• Advanced LED technology using greatly reduced or no REEs may begin to replace fluorescent bulbs, but not until well into the medium term.
Supply Risk: Short Term: 3; Medium Term: 3 As with most REEs, and especially with the “heavy” elements like Eu, the majority of current supply comes from China. Industry expert predicts a supply shortage as early as 2011. Several possible sources could mitigate constriction in the medium term.
BASIC AVAILABILITY Short Term: 3 Medium Term: 3
• Eu is one of the scarcest REEs. • Demand for Eu is expected to exceed supply in the 2014 and 2015 timeframe (Oakdene
Hollins 2010). • In the medium term, new mines projected to significantly increase supply (see Table 7-2)
.although demand will continue to grow with increased use of LFLs and CFLs. COMPETING TECHNOLOGY DEMAND Short Term: 2 Medium Term: 2
• As an activator for yttrium-based phosphors in television and LCD screens. • Expanded use in nuclear reactors, due to great affinity to absorb neutrons. • Eu is also used to dope glasses and plastics for laser production, to investigate bio-molecular
reactions during drug screening trials and as a counterfeiting indicator on Euro banknotes. • No competing use is expected to increase demand as rapidly as lighting.
POLITICAL, REGULATORY AND SOCIAL FACTORS Short Term: 4 Medium Term: 3
• Predominantly produced in China, which instituted significant export quotas and tariffs on REEs based on resource conservation and environmental regulations.
• New mines in Australia, Canada and the United States will provide additional supply, but are subject to strict permitting processes and environmental regulations.
CO-DEPENDENCE ON OTHER MARKETS Short Term: 3 Medium Term: 3
• Eu supply from China occurs as a byproduct of the yttrium-rich, ion-adsorption clay ores in the south China region and in bastnasite ores from Mongolia. Both yttrium and Eu are in high demand; co-dependence should diminish the supply risk of each.
PRODUCER DIVERSITY Short Term: 4 Medium Term: 3
• Although China currently produces almost all Eu, non-Chinese mines coming on line by 2015 are expected to significantly increase the diversity of supply (see Table 7-2).
References Oakdene Hollins. 2010. “Lanthanide Resources and Alternatives.” Aylesbury, UK: Department for Transport and Department for Business, Innovation and Skills. http://www.oakdenehollins.co.uk/.
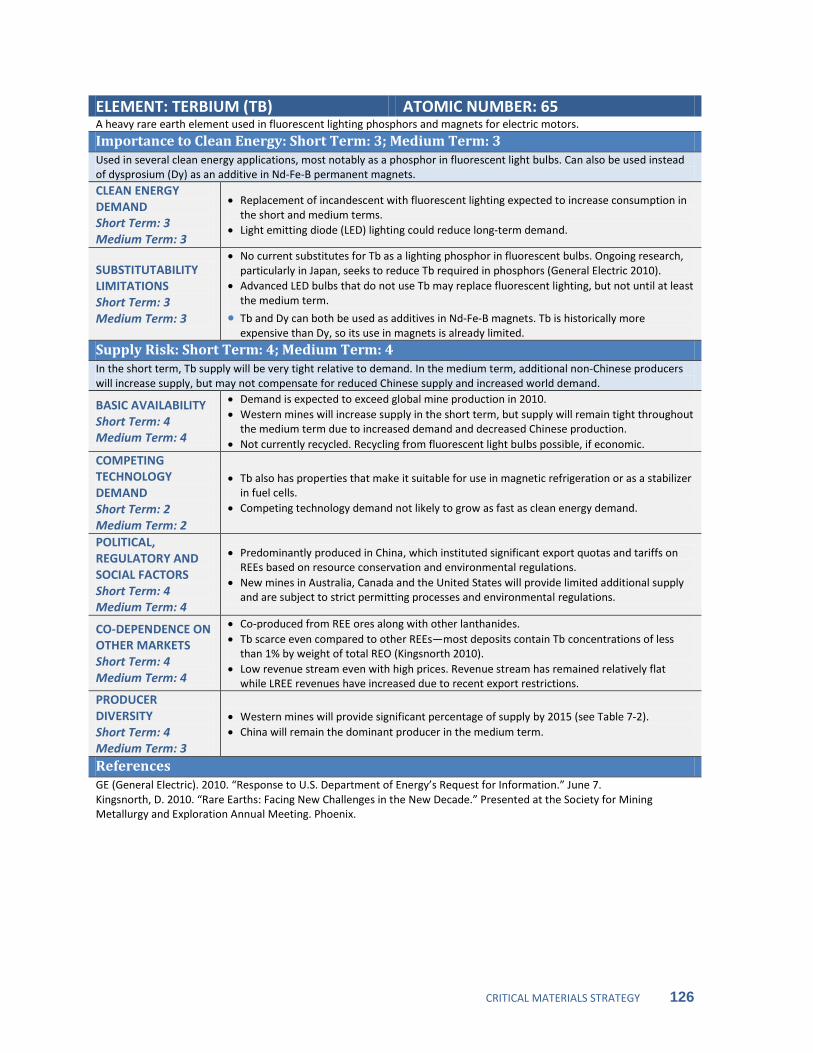
CRITICAL MATERIALS STRATEGY 126
ELEMENT: TERBIUM (TB) ATOMIC NUMBER: 65 A heavy rare earth element used in fluorescent lighting phosphors and magnets for electric motors.
Importance to Clean Energy: Short Term: 3; Medium Term: 3 Used in several clean energy applications, most notably as a phosphor in fluorescent light bulbs. Can also be used instead of dysprosium (Dy) as an additive in Nd-Fe-B permanent magnets. CLEAN ENERGY DEMAND Short Term: 3 Medium Term: 3
• Replacement of incandescent with fluorescent lighting expected to increase consumption in the short and medium terms.
• Light emitting diode (LED) lighting could reduce long-term demand.
SUBSTITUTABILITY LIMITATIONS Short Term: 3 Medium Term: 3
• No current substitutes for Tb as a lighting phosphor in fluorescent bulbs. Ongoing research, particularly in Japan, seeks to reduce Tb required in phosphors (General Electric 2010).
• Advanced LED bulbs that do not use Tb may replace fluorescent lighting, but not until at least the medium term.
• Tb and Dy can both be used as additives in Nd-Fe-B magnets. Tb is historically more expensive than Dy, so its use in magnets is already limited.
Supply Risk: Short Term: 4; Medium Term: 4 In the short term, Tb supply will be very tight relative to demand. In the medium term, additional non-Chinese producers will increase supply, but may not compensate for reduced Chinese supply and increased world demand.
BASIC AVAILABILITY Short Term: 4 Medium Term: 4
• Demand is expected to exceed global mine production in 2010. • Western mines will increase supply in the short term, but supply will remain tight throughout
the medium term due to increased demand and decreased Chinese production. • Not currently recycled. Recycling from fluorescent light bulbs possible, if economic.
COMPETING TECHNOLOGY DEMAND Short Term: 2 Medium Term: 2
• Tb also has properties that make it suitable for use in magnetic refrigeration or as a stabilizer in fuel cells.
• Competing technology demand not likely to grow as fast as clean energy demand.
POLITICAL, REGULATORY AND SOCIAL FACTORS Short Term: 4 Medium Term: 4
• Predominantly produced in China, which instituted significant export quotas and tariffs on REEs based on resource conservation and environmental regulations.
• New mines in Australia, Canada and the United States will provide limited additional supply and are subject to strict permitting processes and environmental regulations.
CO-DEPENDENCE ON OTHER MARKETS Short Term: 4 Medium Term: 4
• Co-produced from REE ores along with other lanthanides. • Tb scarce even compared to other REEs—most deposits contain Tb concentrations of less
than 1% by weight of total REO (Kingsnorth 2010). • Low revenue stream even with high prices. Revenue stream has remained relatively flat
while LREE revenues have increased due to recent export restrictions. PRODUCER DIVERSITY Short Term: 4 Medium Term: 3
• Western mines will provide significant percentage of supply by 2015 (see Table 7-2). • China will remain the dominant producer in the medium term.
References GE (General Electric). 2010. “Response to U.S. Department of Energy’s Request for Information.” June 7. Kingsnorth, D. 2010. “Rare Earths: Facing New Challenges in the New Decade.” Presented at the Society for Mining Metallurgy and Exploration Annual Meeting. Phoenix.

CRITICAL MATERIALS STRATEGY 127
ELEMENT: DYSPROSIUM (DY) ATOMIC NUMBER: 66 Dy is a heavy rare earth element. It is a soft metal with a silver luster and extremely high magnetic strength. Primary uses included ceramics, high-intensity lighting and as an additive to rare earth permanent magnets.
Importance to Clean Energy: Short Term: 4; Medium Term: 4 Dysprosium’s primary clean energy use is as an additive to neodymium-iron-boron (NdFeB) magnets. The addition of either Dy or terbium (at approximately 5% of the magnet’s weight) helps raise the increase the “Curie temperature” at which the magnet can operate before losing its magnetic field. CLEAN ENERGY DEMAND Short Term: 4 Medium Term: 4
• Although used in relatively small quantities in magnets, it is crucial for magnets capable of high-temperature operations (particularly in vehicle drives).
• Demand for Dy will increase significantly with the growing market for electric drive vehicles in both the short and medium term.
SUBSTITUTABILITY LIMITATIONS Short Term: 3 Medium Term: 3
• The only known substitute in permanent magnets is terbium, which is even rarer and historically more expensive.
• At the component level, there are substitute motor and generator technologies that do not use rare earth elements.
Supply Risk: Short Term: 4; Medium Term: 4 More than 90% of the global supply of Dy comes from China. Dependence on Chinese exports is expected to lead to a critical shortage of the element between 2012 and 2014. New mines are scheduled to come online in the medium term that could mitigate this constriction. BASIC AVAILABILITY Short Term: 4 Medium Term: 4
• Demand projected to increase significantly with minimal increased supply (Oakdene Hollins 2010).
• By 2015, global production capacity is expected to increase by less than 15% (see Figure 7-2).
COMPETING TECHNOLOGY DEMAND Short Term: 2 Medium Term: 2
• Emerging technologies exist but unlikely to significantly increase demand pressure compared to current applications.
• Expanded uses could include magneto-mechanical sensors, actuators and acoustic and ultrasonic transducers, e.g. flat-panel speakers. Dy has been considered for use in diesel engine fuel injectors.
POLITICAL, REGULATORY AND SOCIAL FACTORS Short Term: 4 Medium Term: 4
• China has instituted significant export quotas and tariffs on all REEs based on resource conservation and environmental regulatory reasons.
• New mines in Australia, Canada and the United States will provide little additional supply and are subject to strict permitting processes and environmental regulations, which have the potential to delay production.
CO-DEPENDENCE ON OTHER MARKETS Short Term: 3 Medium Term: 3
• Moderate revenue stream due to low abundance and historically high prices. • Revenue stream has remained flat compared to LREEs, whose prices have increased
dramatically due to recent export restrictions. • Most abundant of the HREEs in many Chinese ores, but found in low concentrations
elsewhere. PRODUCER DIVERSITY Short Term: 4 Medium Term: 4
• Found in relatively small amounts in new Western mines scheduled to begin production in the short and medium term. Mountain Pass will produce minimal amounts of dysprosium, and other new mines scheduled to begin production by 2015 will increase production by less than 15% over current levels (see Figure 7-2).
References GE (General Electric). 2010. “Response to U.S. Department of Energy’s Request for Information.” June 7. Kingsnorth, D. 2010. “Rare Earths: Facing New Challenges in the New Decade.” Presented at the Society for Mining Metallurgy and Exploration Annual Meeting. Phoenix. Oakdene Hollins. 2010. “Lanthanide Resources and Alternatives.” Aylesbury, UK: Department for Transport and Department for Business, Innovation and Skills. http://www.oakdenehollins.co.uk/.
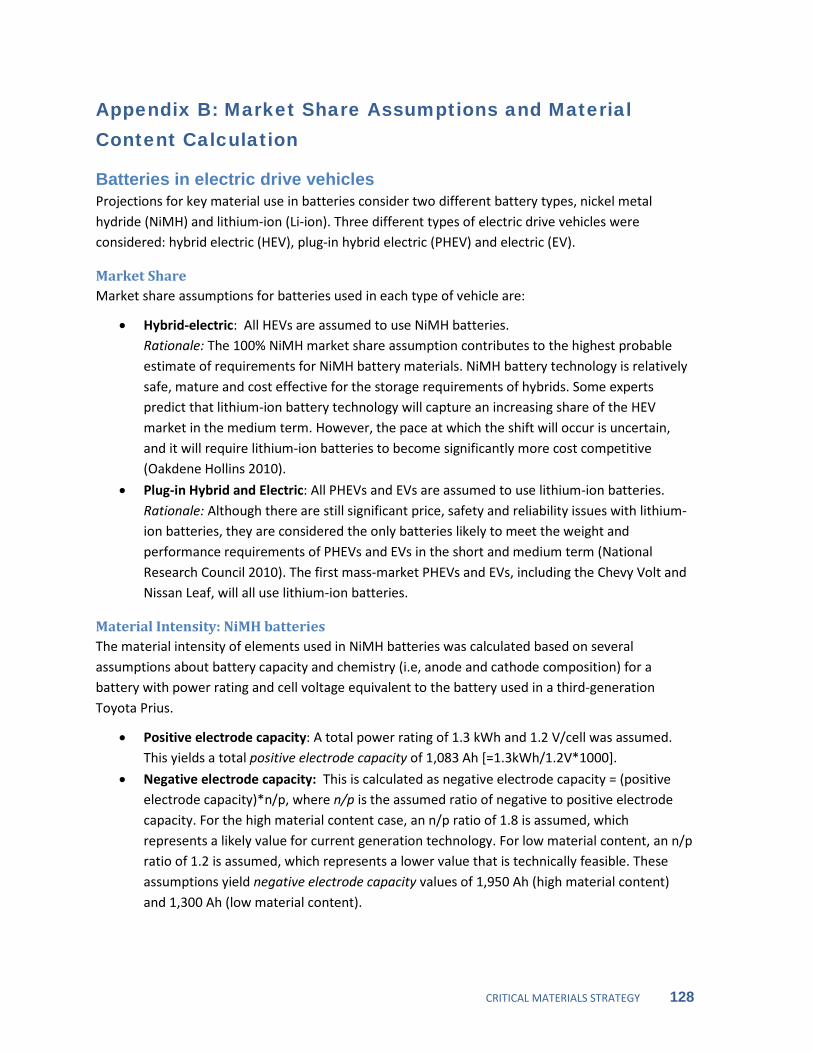
CRITICAL MATERIALS STRATEGY 128
Appendix B: Market Share Assumptions and Material Content Calculation
Batteries in electric drive vehicles Projections for key material use in batteries consider two different battery types, nickel metal hydride (NiMH) and lithium-ion (Li-ion). Three different types of electric drive vehicles were considered: hybrid electric (HEV), plug-in hybrid electric (PHEV) and electric (EV).
Market Share Market share assumptions for batteries used in each type of vehicle are:
• Hybrid-electric: All HEVs are assumed to use NiMH batteries. Rationale: The 100% NiMH market share assumption contributes to the highest probable estimate of requirements for NiMH battery materials. NiMH battery technology is relatively safe, mature and cost effective for the storage requirements of hybrids. Some experts predict that lithium-ion battery technology will capture an increasing share of the HEV market in the medium term. However, the pace at which the shift will occur is uncertain, and it will require lithium-ion batteries to become significantly more cost competitive (Oakdene Hollins 2010).
• Plug-in Hybrid and Electric: All PHEVs and EVs are assumed to use lithium-ion batteries. Rationale: Although there are still significant price, safety and reliability issues with lithium-ion batteries, they are considered the only batteries likely to meet the weight and performance requirements of PHEVs and EVs in the short and medium term (National Research Council 2010). The first mass-market PHEVs and EVs, including the Chevy Volt and Nissan Leaf, will all use lithium-ion batteries.
Material Intensity: NiMH batteries The material intensity of elements used in NiMH batteries was calculated based on several assumptions about battery capacity and chemistry (i.e, anode and cathode composition) for a battery with power rating and cell voltage equivalent to the battery used in a third-generation Toyota Prius.
• Positive electrode capacity: A total power rating of 1.3 kWh and 1.2 V/cell was assumed. This yields a total positive electrode capacity of 1,083 Ah [=1.3kWh/1.2V*1000].
• Negative electrode capacity: This is calculated as negative electrode capacity = (positive electrode capacity)*n/p, where n/p is the assumed ratio of negative to positive electrode capacity. For the high material content case, an n/p ratio of 1.8 is assumed, which represents a likely value for current generation technology. For low material content, an n/p ratio of 1.2 is assumed, which represents a lower value that is technically feasible. These assumptions yield negative electrode capacity values of 1,950 Ah (high material content) and 1,300 Ah (low material content).

CRITICAL MATERIALS STRATEGY 129
• Weight of negative electrode alloy: This is calculated based on an assumption of 300 Ah/kg of alloy. This yields a high negative electrode alloy weight of 6.5 kg alloy and a low negative electrode alloy weight of 4.3 kg.
• Negative electrode alloy composition: The battery alloy is assumed to be AB5 employing a widely used composition of mischmetal: La5.7Ce8.0Pr0.8Nd2.3Ni59.2Co12.2Mn6.8Al5.2 with a total molar weight of 70.6 g. Based on this formula, the high and low weight content of individual elements is given in Table B-1. NiMH material intensity for batteries used by other manufacturers would likely vary with battery performance specifications and the composition of the battery allow.
Estimates for positive electrode capacity were from DOE EERE (2009). Estimates for the n/p ratio and weight ratio of negative electrode alloy were provided by DOE EERE (2010). Alloy composition is based on Linden’s Handbook of Batteries (Reddy 2011).
Table B-1. Material Intensity Calculations for NiMH Batteries
Element Molar % in AB5
Weight % in AB5
kg per battery high
kg per battery low
La 5.7% 11.2% 0.73 0.49
Ce 8.0% 15.9% 1.03 0.69
Pr 0.8% 1.6% 0.10 0.07
Nd 2.3% 4.7% 0.31 0.20
Ni 59.2% 49.2% 3.20 2.13
Co 12.2% 10.2% 0.66 0.44
Mn 6.8% 5.3% 0.34 0.23
Al 5.2% 2.0% 0.13 0.09
Total 6.5 4.33
Material Content: Lithium-Ion Batteries Material content assumptions for lithium-ion batteries in electric and plug-in hybrid electric vehicles are taken from calculations by Gains and Nelson (2009). The authors identified four lithium-ion battery chemistries with potential for automotive applications. For each of the four chemistries, they estimated total lithium content for vehicles with ranges of 4, 20, 40 and 100 miles. Cobalt content for each combination of battery chemistry and vehicle range was calculated for this Strategy using the authors’ results for lithium content and the molecular formula of the battery cathode material.

CRITICAL MATERIALS STRATEGY 130
Battery sizes for PHEVs and EVs are based on ranges suggested by Gains and Nelson (2009). PHEVs are assumed to have a 40-mile range, and EVs a 100-mile range. To determine high and low material content, the highest and lowest values of lithium and cobalt were selected from among the four different battery chemistries.
The battery chemistries and material content values selected are shown in Table B-2.
Table B-2. Material Content Calculations for Lithium-ion Batteries
Application Material High/Low
Material content (kg)
Battery Chemistry Designation Cathode Anode
PHEV 40 Lithium
Low 1.35 LMO-G LiMn2O4 Graphite High 5.07 LMO-TiO LiMn2O4 Li4Ti5O12
Cobalt Low 0 LMO (both) LiMn2O4 Either High 3.77 NCA-G LiNi0.8Co0.15Al0.05O2 Graphite
EV 100 Lithium
Low 3.38 LMO-G LiMn2O4 Graphite High 12.68 LMO-TiO LiMn2O4 Li4Ti5O12
Cobalt Low 0 LMO (both) LiMn2O4 Either High 9.41 NCA-G LiNi0.8Co0.15Al0.05O2 Graphite
Permanent Magnets in Wind Turbines and Electric Drive Vehicles
Market Share Market share assumptions for wind turbines and electric drive vehicles employing neodymium-iron-boron (NdFeB) permanent magnet (PM) motors are:
• Wind turbines: The low market share assumption is that 10% of both onshore and offshore wind turbines will use NdFeB PM generators. The high market share assumption is that 25% of onshore wind turbines and 75% of offshore wind turbines will use NdFeB PM generators. Rationale: There is no publicly available data on current market share, but anecdotal discussions with industry experts indicates that only a small percentage of the wind turbines currently use rare earth permanent magnets. Therefore, the low market share represents a continuation of current market share trends. The high market share assumption is based on the preference for NdFeB permanent magnet generators in larger wind turbines (in the 2-3+ MW range) and the trend towards the use of larger turbines in new wind projects, particularly for offshore applications.
• Electric Drive Vehicles: All electric drive vehicles (HEVs, PHEVs and EVs) are assumed to use NdFeB PM motors. Rationale: Due to their superior power to weight ratio, NdFeB PM motors are used in current model HEVs, as well as the Chevy Volt PHEV and Nissan Leaf EV. These PM motors are expected to dominate the electric drive vehicle market well into the medium term, although new motors without rare earth materials are being developed (Aston 2010).
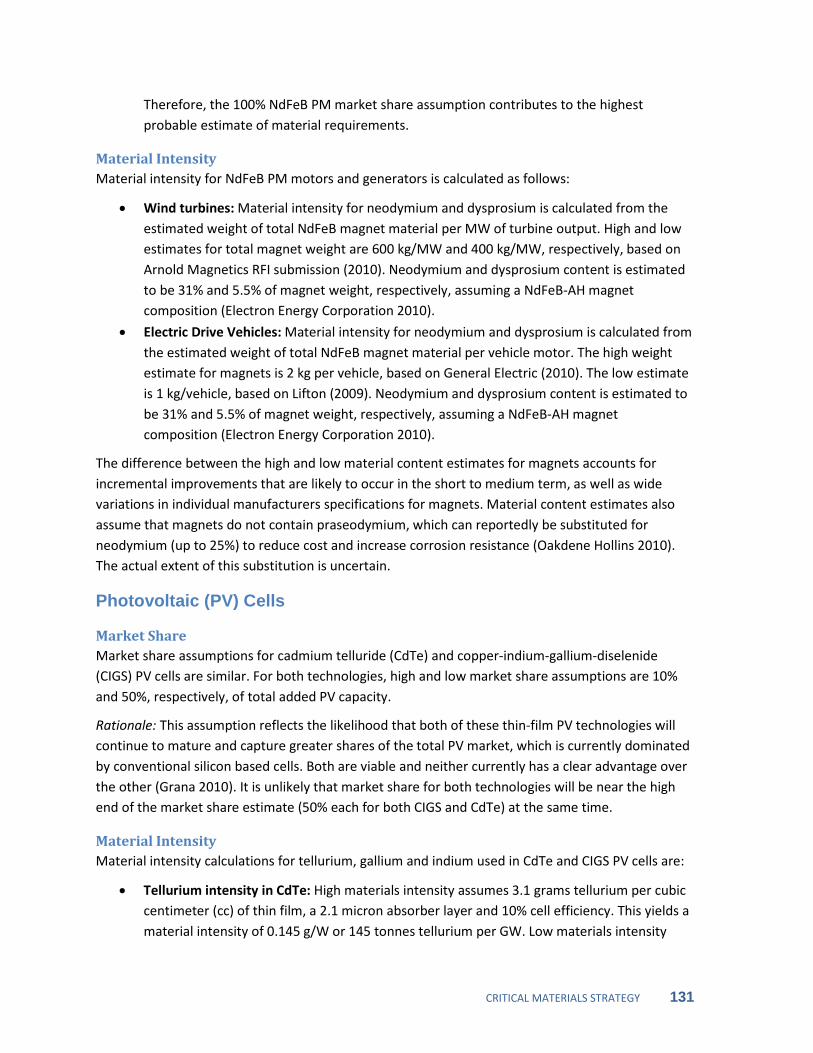
CRITICAL MATERIALS STRATEGY 131
Therefore, the 100% NdFeB PM market share assumption contributes to the highest probable estimate of material requirements.
Material Intensity Material intensity for NdFeB PM motors and generators is calculated as follows:
• Wind turbines: Material intensity for neodymium and dysprosium is calculated from the estimated weight of total NdFeB magnet material per MW of turbine output. High and low estimates for total magnet weight are 600 kg/MW and 400 kg/MW, respectively, based on Arnold Magnetics RFI submission (2010). Neodymium and dysprosium content is estimated to be 31% and 5.5% of magnet weight, respectively, assuming a NdFeB-AH magnet composition (Electron Energy Corporation 2010).
• Electric Drive Vehicles: Material intensity for neodymium and dysprosium is calculated from the estimated weight of total NdFeB magnet material per vehicle motor. The high weight estimate for magnets is 2 kg per vehicle, based on General Electric (2010). The low estimate is 1 kg/vehicle, based on Lifton (2009). Neodymium and dysprosium content is estimated to be 31% and 5.5% of magnet weight, respectively, assuming a NdFeB-AH magnet composition (Electron Energy Corporation 2010).
The difference between the high and low material content estimates for magnets accounts for incremental improvements that are likely to occur in the short to medium term, as well as wide variations in individual manufacturers specifications for magnets. Material content estimates also assume that magnets do not contain praseodymium, which can reportedly be substituted for neodymium (up to 25%) to reduce cost and increase corrosion resistance (Oakdene Hollins 2010). The actual extent of this substitution is uncertain.
Photovoltaic (PV) Cells
Market Share Market share assumptions for cadmium telluride (CdTe) and copper-indium-gallium-diselenide (CIGS) PV cells are similar. For both technologies, high and low market share assumptions are 10% and 50%, respectively, of total added PV capacity.
Rationale: This assumption reflects the likelihood that both of these thin-film PV technologies will continue to mature and capture greater shares of the total PV market, which is currently dominated by conventional silicon based cells. Both are viable and neither currently has a clear advantage over the other (Grana 2010). It is unlikely that market share for both technologies will be near the high end of the market share estimate (50% each for both CIGS and CdTe) at the same time.
Material Intensity Material intensity calculations for tellurium, gallium and indium used in CdTe and CIGS PV cells are:
• Tellurium intensity in CdTe: High materials intensity assumes 3.1 grams tellurium per cubic centimeter (cc) of thin film, a 2.1 micron absorber layer and 10% cell efficiency. This yields a material intensity of 0.145 g/W or 145 tonnes tellurium per GW. Low materials intensity
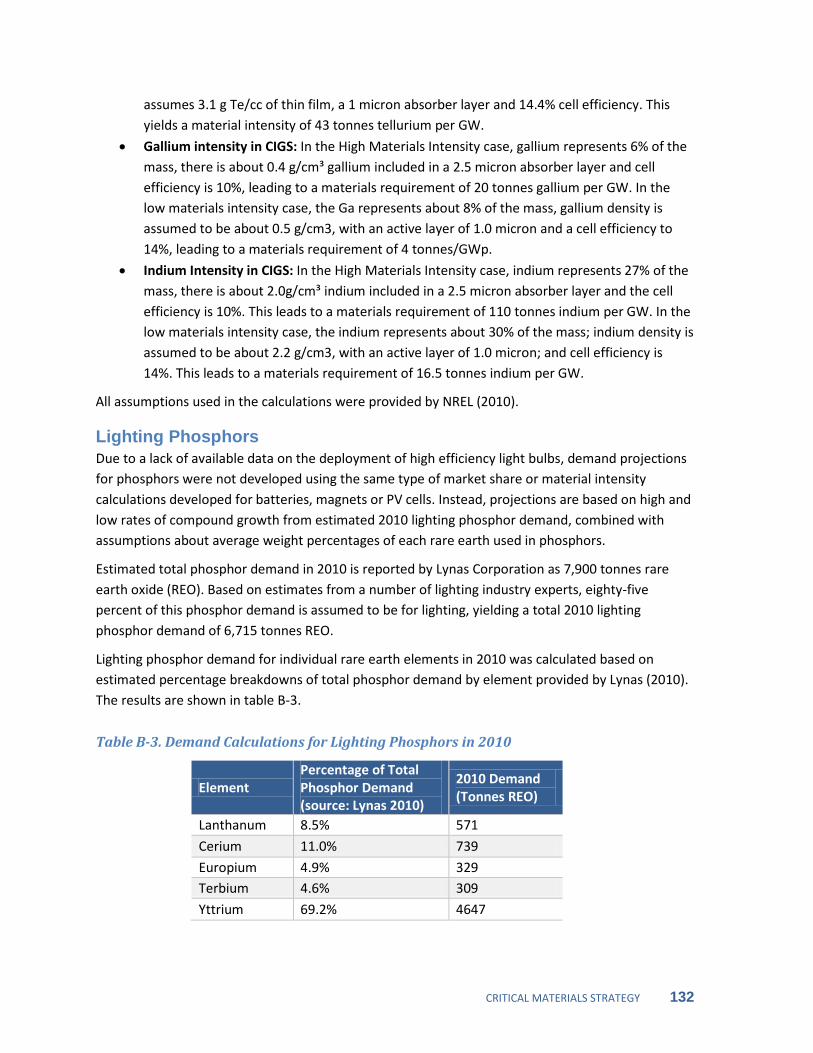
CRITICAL MATERIALS STRATEGY 132
assumes 3.1 g Te/cc of thin film, a 1 micron absorber layer and 14.4% cell efficiency. This yields a material intensity of 43 tonnes tellurium per GW.
• Gallium intensity in CIGS: In the High Materials Intensity case, gallium represents 6% of the mass, there is about 0.4 g/cm³ gallium included in a 2.5 micron absorber layer and cell efficiency is 10%, leading to a materials requirement of 20 tonnes gallium per GW. In the low materials intensity case, the Ga represents about 8% of the mass, gallium density is assumed to be about 0.5 g/cm3, with an active layer of 1.0 micron and a cell efficiency to 14%, leading to a materials requirement of 4 tonnes/GWp.
• Indium Intensity in CIGS: In the High Materials Intensity case, indium represents 27% of the mass, there is about 2.0g/cm³ indium included in a 2.5 micron absorber layer and the cell efficiency is 10%. This leads to a materials requirement of 110 tonnes indium per GW. In the low materials intensity case, the indium represents about 30% of the mass; indium density is assumed to be about 2.2 g/cm3, with an active layer of 1.0 micron; and cell efficiency is 14%. This leads to a materials requirement of 16.5 tonnes indium per GW.
All assumptions used in the calculations were provided by NREL (2010).
Lighting Phosphors Due to a lack of available data on the deployment of high efficiency light bulbs, demand projections for phosphors were not developed using the same type of market share or material intensity calculations developed for batteries, magnets or PV cells. Instead, projections are based on high and low rates of compound growth from estimated 2010 lighting phosphor demand, combined with assumptions about average weight percentages of each rare earth used in phosphors.
Estimated total phosphor demand in 2010 is reported by Lynas Corporation as 7,900 tonnes rare earth oxide (REO). Based on estimates from a number of lighting industry experts, eighty-five percent of this phosphor demand is assumed to be for lighting, yielding a total 2010 lighting phosphor demand of 6,715 tonnes REO.
Lighting phosphor demand for individual rare earth elements in 2010 was calculated based on estimated percentage breakdowns of total phosphor demand by element provided by Lynas (2010). The results are shown in table B-3.
Table B-3. Demand Calculations for Lighting Phosphors in 2010
Element Percentage of Total Phosphor Demand (source: Lynas 2010)
2010 Demand (Tonnes REO)
Lanthanum 8.5% 571
Cerium 11.0% 739
Europium 4.9% 329 Terbium 4.6% 309
Yttrium 69.2% 4647

CRITICAL MATERIALS STRATEGY 133
High and low estimates of annual lighting phosphor demand by element are calculated from the 2010 demand values by assuming a low annual growth rate of 2.2% and high growth rate of 3.5%. Growth rate assumptions are based on the growth rates for compact fluorescent lamps (CFLs) in the IEA (2010) “Phase Out of Incandescent Lamps” information paper.
References Aston, A. 2010. “China's Rare-Earth Monopoly: The rest of the world is trying to find alternatives to these crucial materials.” Technology Review, October 15. http://www.technologyreview.com/energy/26538/?ref=rss.
DOE (U.S. Department of Energy) EERE (Energy Efficiency and Renewable Energy) .2009. “2010 Toyota Prius-6063 Hybrid BOT Battery Test Results.” U.S. Department of Energy. July 15. http://avt.inel.gov/pdf/hev/batterygenIIIprius6063.pdf.
DOE (U.S. Department of Energy) EERE (Energy Efficiency and Renewable Energy). 2010. “Expert judgment by vehicle battery specialist.”
Electron Energy Corporation. 2010. “Response to U.S. Department of Energy Request for Information.” June 5.
Gains, L. and P. Nelson. 2009. “Lithium-Ion Batteries: Possible Material Demand Issues.” Argonne National Laboratory. http://www.transportation.anl.gov/pdfs/B/584.PDF.
General Electric Corporation. 2010. “Response to U.S. Department of Energy Request for Information.” June 7.
Grana, P. 2010. “The Efficiency Race: How do CdTe and CIGS Stack Up?” Renewableenergyworld.com. http://www.renewableenergyworld.com/rea/blog/post/2010/11/the-efficiency-race-how-to-cdte-and-cigs-stack-up.
International Energy Agency (IEA). 2010. Information Paper: Phase Out of Incandescent Lamps. http://www.iea.org/papers/2010/phase_out.pdf.
Lifton, J. 2009. “The Rare Earth Crisis of 2009.” The Jack Lifton Report. October 15. In Oakdene Hollins 2010.
Lynas Corporation. 2010. “Response to U.S. Department of Energy Request for Information.” June 7.
National Research Council. 2010. “Transitions to Alternative Transportation Technologies – Plug-in Hybrid Electric Vehicles.” http://www.nap.edu/catalog.php?record_id=12826.
NREL (National Renewable Energy Laboratory). 2010. Email communication, September 17, 2010.
Oakdene Hollins. 2010. “Response to U.S. Department of Energy Request for Information.” May 26.
Reddy, Thomas R. ed. 2011. Linden’s Handbook of Batteries. New York: McGraw Hill.
Toyota. 2009. “Toyota Prius Emergency Response Manual, Hybrid 2010 Model 3rd Generation.” https://techinfo.toyota.com/techInfoPortal/staticcontent/en/techinfo/html/prelogin/docs/3rdprius.pdf
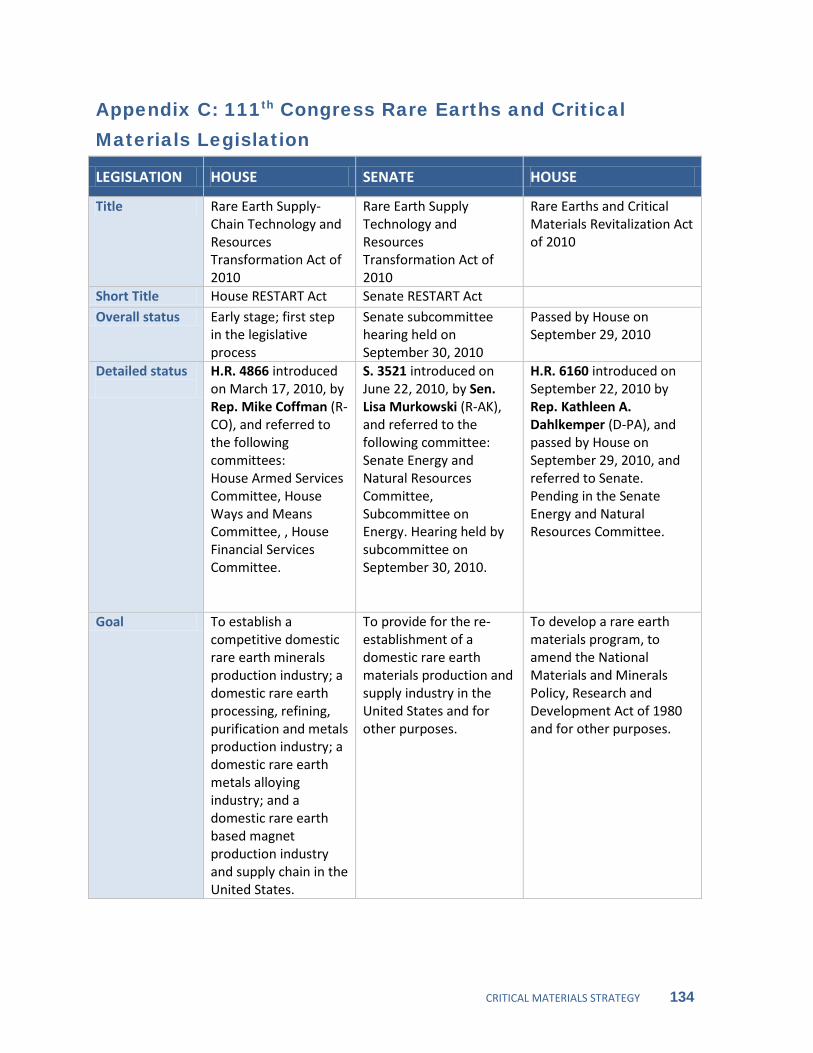
CRITICAL MATERIALS STRATEGY 134
Appendix C: 111th Congress Rare Earths and Critical Materials Legislation
LEGISLATION HOUSE SENATE HOUSE
Title Rare Earth Supply-Chain Technology and Resources Transformation Act of 2010
Rare Earth Supply Technology and Resources Transformation Act of 2010
Rare Earths and Critical Materials Revitalization Act of 2010
Short Title House RESTART Act Senate RESTART Act Overall status Early stage; first step
in the legislative process
Senate subcommittee hearing held on September 30, 2010
Passed by House on September 29, 2010
Detailed status
H.R. 4866 introduced on March 17, 2010, by Rep. Mike Coffman (R-CO), and referred to the following committees: House Armed Services Committee, House Ways and Means Committee, , House Financial Services Committee.
S. 3521 introduced on June 22, 2010, by Sen. Lisa Murkowski (R-AK), and referred to the following committee: Senate Energy and Natural Resources Committee, Subcommittee on Energy. Hearing held by subcommittee on September 30, 2010.
H.R. 6160 introduced on September 22, 2010 by Rep. Kathleen A. Dahlkemper (D-PA), and passed by House on September 29, 2010, and referred to Senate. Pending in the Senate Energy and Natural Resources Committee.
Goal To establish a competitive domestic rare earth minerals production industry; a domestic rare earth processing, refining, purification and metals production industry; a domestic rare earth metals alloying industry; and a domestic rare earth based magnet production industry and supply chain in the United States.
To provide for the re-establishment of a domestic rare earth materials production and supply industry in the United States and for other purposes.
To develop a rare earth materials program, to amend the National Materials and Minerals Policy, Research and Development Act of 1980 and for other purposes.
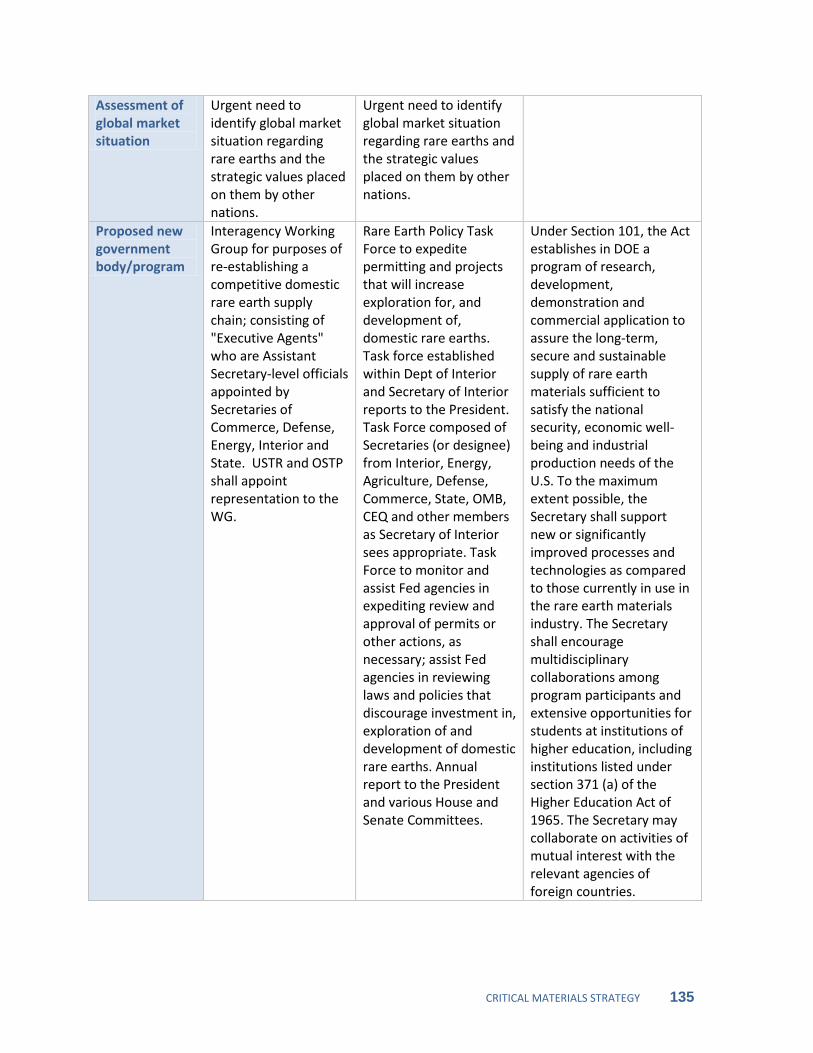
CRITICAL MATERIALS STRATEGY 135
Assessment of global market situation
Urgent need to identify global market situation regarding rare earths and the strategic values placed on them by other nations.
Urgent need to identify global market situation regarding rare earths and the strategic values placed on them by other nations.
Proposed new government body/program
Interagency Working Group for purposes of re-establishing a competitive domestic rare earth supply chain; consisting of "Executive Agents" who are Assistant Secretary-level officials appointed by Secretaries of Commerce, Defense, Energy, Interior and State. USTR and OSTP shall appoint representation to the WG.
Rare Earth Policy Task Force to expedite permitting and projects that will increase exploration for, and development of, domestic rare earths. Task force established within Dept of Interior and Secretary of Interior reports to the President. Task Force composed of Secretaries (or designee) from Interior, Energy, Agriculture, Defense, Commerce, State, OMB, CEQ and other members as Secretary of Interior sees appropriate. Task Force to monitor and assist Fed agencies in expediting review and approval of permits or other actions, as necessary; assist Fed agencies in reviewing laws and policies that discourage investment in, exploration of and development of domestic rare earths. Annual report to the President and various House and Senate Committees.
Under Section 101, the Act establishes in DOE a program of research, development, demonstration and commercial application to assure the long-term, secure and sustainable supply of rare earth materials sufficient to satisfy the national security, economic well-being and industrial production needs of the U.S. To the maximum extent possible, the Secretary shall support new or significantly improved processes and technologies as compared to those currently in use in the rare earth materials industry. The Secretary shall encourage multidisciplinary collaborations among program participants and extensive opportunities for students at institutions of higher education, including institutions listed under section 371 (a) of the Higher Education Act of 1965. The Secretary may collaborate on activities of mutual interest with the relevant agencies of foreign countries.
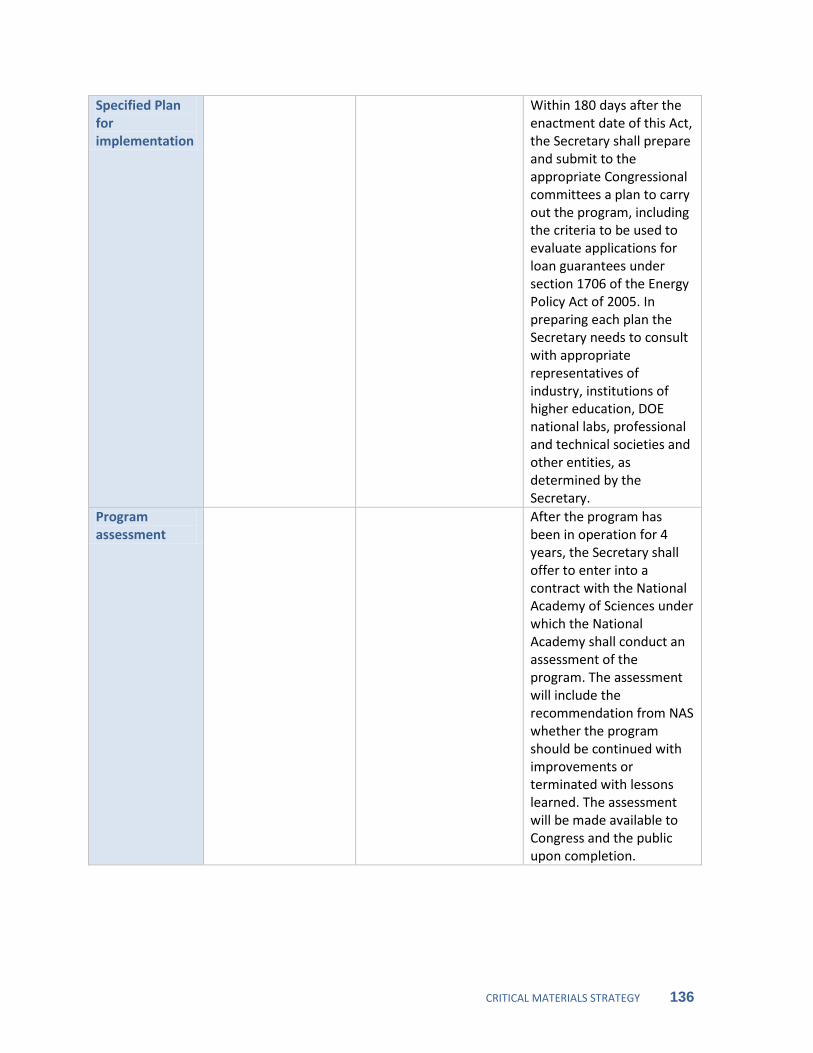
CRITICAL MATERIALS STRATEGY 136
Specified Plan for implementation
Within 180 days after the enactment date of this Act, the Secretary shall prepare and submit to the appropriate Congressional committees a plan to carry out the program, including the criteria to be used to evaluate applications for loan guarantees under section 1706 of the Energy Policy Act of 2005. In preparing each plan the Secretary needs to consult with appropriate representatives of industry, institutions of higher education, DOE national labs, professional and technical societies and other entities, as determined by the Secretary.
Program assessment
After the program has been in operation for 4 years, the Secretary shall offer to enter into a contract with the National Academy of Sciences under which the National Academy shall conduct an assessment of the program. The assessment will include the recommendation from NAS whether the program should be continued with improvements or terminated with lessons learned. The assessment will be made available to Congress and the public upon completion.

CRITICAL MATERIALS STRATEGY 137
Establish baseline for supply chain vulnerability
Secretaries of Commerce, Defense, Energy, Interior and State will undertake an assessment, coordinating with USTR and OSTP.
Secretaries of Interior and Energy will jointly, in consultation with Secretaries of Defense, Commerce, State and USTR, undertake an assessment, determining which rare earth elements are critical to clean energy techs and national and economic security of the U.S.
National Stockpile
Secretary of Defense shall commence procurement of rare earth materials designed as "critical" within one-year after enactment of this Act. Annual report and update on addition and subtraction.
Secretaries of Interior and Energy will jointly, in consultation with Secretaries of Defense, Commerce, State and USTR conduct an assessment as to whether rare earth elements determined critical need to be stockpiled or not and recommend criteria used in determining the commencement and termination of stockpiling.
Fair Market Conditions
USTR to initiate a review of international trade practices and initiate an action before the WTO, or issue a report to Congress after the review if action before WTO deemed not necessary.

CRITICAL MATERIALS STRATEGY 138
Loan Guarantees
Commerce, Interior and State to issue a report to industry describing government loan guarantees to reestablish a domestic rare earth supply chain. Secretary of Defense to issue guidance related to obtaining LGs under 50 U.S.C. 98 and any other available mechanisms. Secretary of Energy to issue guidance under the American Recovery and Reinvestment Act of 2009, Energy Efficiency and Renewable Energy sponsored programs and any other available mechanisms for obtaining LGs.
Secretary of Energy to issue report to the industry describing available mechanisms for LGs for establishing a domestic rare earth supply chain. Secretary of Energy to issue guidance for the rare earth industry on obtaining LGs under title XVII of the Energy Policy Act of 2005 and the American Recovery and Reinvestment Act of 2009.
Within 180 days after the enactment date of this Act, the Secretary shall prepare and submit to the appropriate Congressional committees a plan to carry out the program, including the criteria to be used to evaluate applications for loan guarantees under section 1706 of the Energy Policy Act of 2005. Title XVII of the Energy Policy Act of 2005 is amended by adding at the end the new section "Sec. 1706. Temporary Program for Rare Earth Materials Revitalization." The Secretary is authorized, to the extent provided in a subsequent appropriations act, to make guarantees for the commercial application of new or significantly improved technologies for projects that process rare earth materials, manufacture technologies that apply rare earth materials and other projects as determined by the Secretary. The authority to enter into guarantees under this section expires on September 30, 2015.
Defense Production Act
A prioritization of DPA projects to re-introduce a domestic rare earth supply chain. Secretary of Defense to issue a report describing past, current and future DPA projects for this purpose.
Secretary of Defense to submit to Congress a report describing past, current and future projects under the DPA of 1950 to support the domestic rare earth supply chain. If no such projects, need justifications for lack of such projects.

CRITICAL MATERIALS STRATEGY 139
R&D Commerce, Defense, Energy and Interior will use base budget funding to fund academic institutions, government labs, corporate R&D, non-profit R&D and industry associations.
The proposed DOE program shall support activities to: (1) Better characterize and quantify virgin stocks of rare earth materials using theoretical geochemical research; (2) explore, discover and recover rare earth materials using advanced science and technology; (3) improve methods for the extraction, processing, use, recovery and recycling of rare earth materials; (4) improve the understanding of the performance, processing and adaptability in engineering designs of rare earth materials; (5) identify and test alternative materials that can be substituted for rare earth materials in particular applications; (6) engineer and test applications that use recycled and alternative rare earth materials, and minimize rare earth materials content; (7) collect and disseminate info on rare earth materials; (8) facilitate info sharing and collaboration among program participants and stakeholders; (9) collaborate with foreign countries on R&D activities of mutual interest.
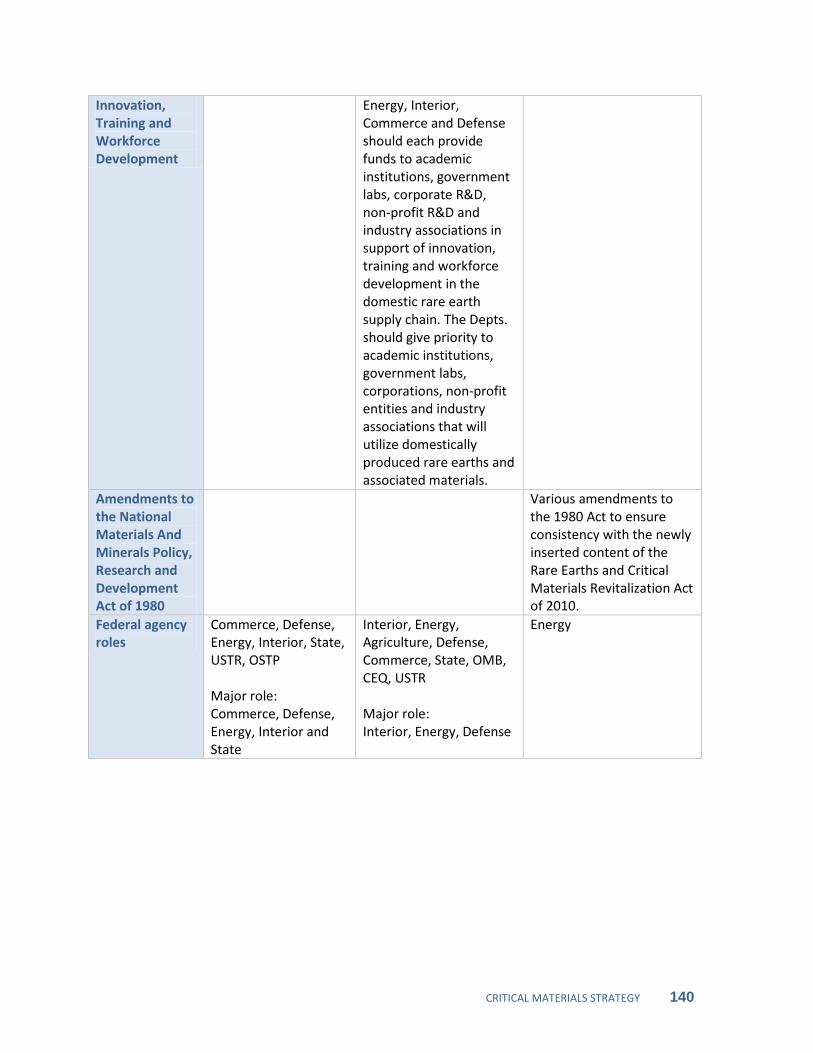
CRITICAL MATERIALS STRATEGY 140
Innovation, Training and Workforce Development
Energy, Interior, Commerce and Defense should each provide funds to academic institutions, government labs, corporate R&D, non-profit R&D and industry associations in support of innovation, training and workforce development in the domestic rare earth supply chain. The Depts. should give priority to academic institutions, government labs, corporations, non-profit entities and industry associations that will utilize domestically produced rare earths and associated materials.
Amendments to the National Materials And Minerals Policy, Research and Development Act of 1980
Various amendments to the 1980 Act to ensure consistency with the newly inserted content of the Rare Earths and Critical Materials Revitalization Act of 2010.
Federal agency roles
Commerce, Defense, Energy, Interior, State, USTR, OSTP Major role: Commerce, Defense, Energy, Interior and State
Interior, Energy, Agriculture, Defense, Commerce, State, OMB, CEQ, USTR Major role: Interior, Energy, Defense
Energy

CRITICAL MATERIALS STRATEGY 141
Appendix D: TREM Conference 2010 Address – Assistant Secretary David Sandalow

CRITICAL MATERIALS STRATEGY 142

CRITICAL MATERIALS STRATEGY 143

CRITICAL MATERIALS STRATEGY 144
CRITICAL MATERIALS STRATEGY 145
CRITICAL MATERIALS STRATEGY 146

CRITICAL MATERIALS STRATEGY 147

CRITICAL MATERIALS STRATEGY 148
Appendix E: U.S.–Japan Roundtable on Rare Earth Elements Research and Development for Clean Energy Technologies Agenda
CRITICAL MATERIALS STRATEGY 149
CRITICAL MATERIALS STRATEGY 150
CRITICAL MATERIALS STRATEGY 151

CRITICAL MATERIALS STRATEGY 152

CRITICAL MATERIALS STRATEGY 153
Appendix F: Trans-Atlantic Workshop on Rare Earth Elements and Other Critical Materials for a Clean Energy Future

CRITICAL MATERIALS STRATEGY 154
CRITICAL MATERIALS STRATEGY 155

CRITICAL MATERIALS STRATEGY 156
CRITICAL MATERIALS STRATEGY 157

CRITICAL MATERIALS STRATEGY 158

CRITICAL MATERIALS STRATEGY 159
CRITICAL MATERIALS STRATEGY 160

CRITICAL MATERIALS STRATEGY 161
Appendix G: ARPA-E Workshop Agenda

CRITICAL MATERIALS STRATEGY 162

CRITICAL MATERIALS STRATEGY 163
CRITICAL MATERIALS STRATEGY 164
CRITICAL MATERIALS STRATEGY 165

CRITICAL MATERIALS STRATEGY 166

CRITICAL MATERIALS STRATEGY 167
CRITICAL MATERIALS STRATEGY 168
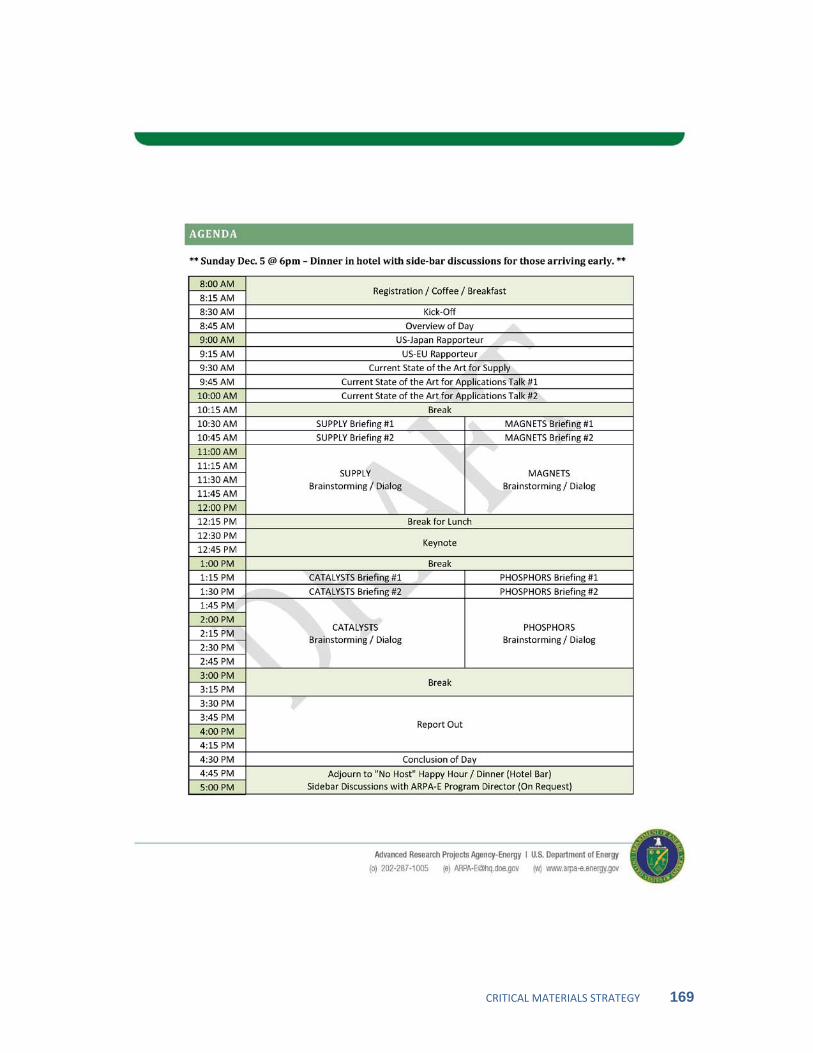
CRITICAL MATERIALS STRATEGY 169

CRITICAL MATERIALS STRATEGY 170

CRITICAL MATERIALS STRATEGY 171