US ANIMAL HEALTH MARKET INSIGHTS 2019 Mid-Year Update
39
US ANIMAL HEALTH MARKET INSIGHTS 2019 Mid-Year Update Presented by Animalytix LLC & Axxiom Consulting AUGUST 26, 2019
Transcript of US ANIMAL HEALTH MARKET INSIGHTS 2019 Mid-Year Update
US ANIMAL HEALTH MARKET INSIGHTS2019 Mid-Year Update
Presented by Animalytix LLC & Axxiom Consulting
AUGUST 26, 2019

2019 Animal Health Industry Overview Presented by:
–Animalytix LLC–Axxiom Consulting–KC Animal Health Corridor–And special thanks to Vetnosis

Review of the Global MarketCourtesy of Vetnosis

Delivering commercial insight to the global animal health industrywww.vetnosis.com
Vetnosis Animal Health Industry Review 2018
August 2019
Vetnosis Limited Contact DetailsEdinburgh Quay O: +44 (0) 131 357 0345133 Fountainbridge W: vetnosis.comEdinburgh EH3 9BA United Kingdom E: [email protected]

Vetnosis Animal Health Industry Review 2018 August 2019
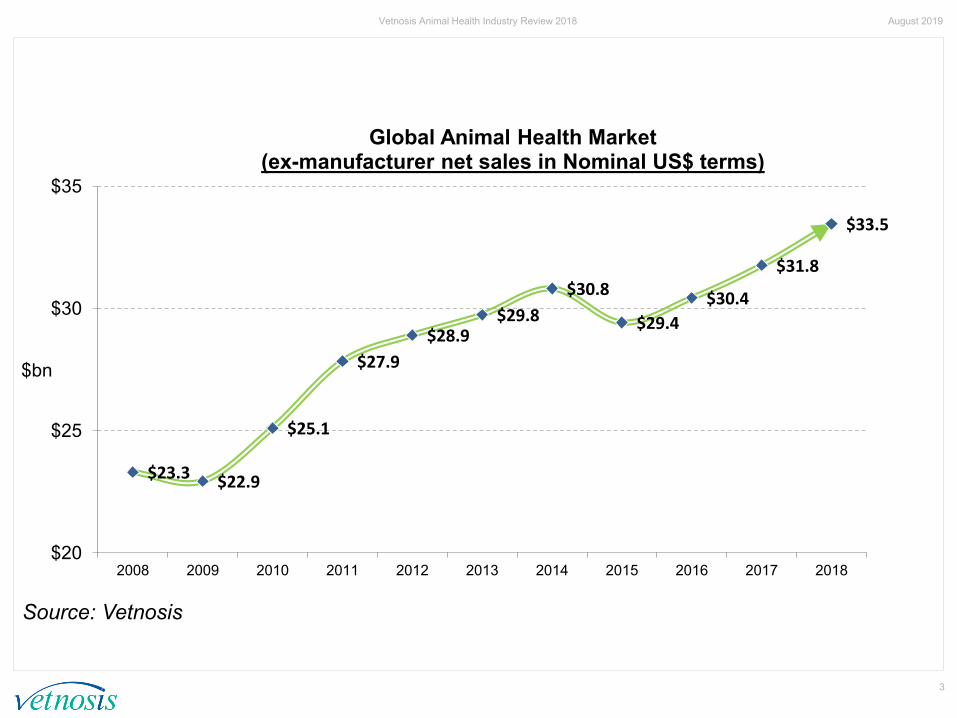
2018 Animal Health IndustryUS$ 33.5 billion
Nominal growth +5.3%
Source: Vetnosis
Vetnosis Animal Health Industry Review 2018 August 2019
3
$23.3 $22.9
$25.1
$27.9$28.9
$29.8$30.8
$29.4$30.4
$31.8
$33.5
$20
$25
$30
$35
2008 2009 2010 2011 2012 2013 2014 2015 2016 2017 2018
$bn
Source: Vetnosis
Global Animal Health Market(ex-manufacturer net sales in Nominal US$ terms)
Vetnosis Animal Health Industry Review 2018 August 2019
4
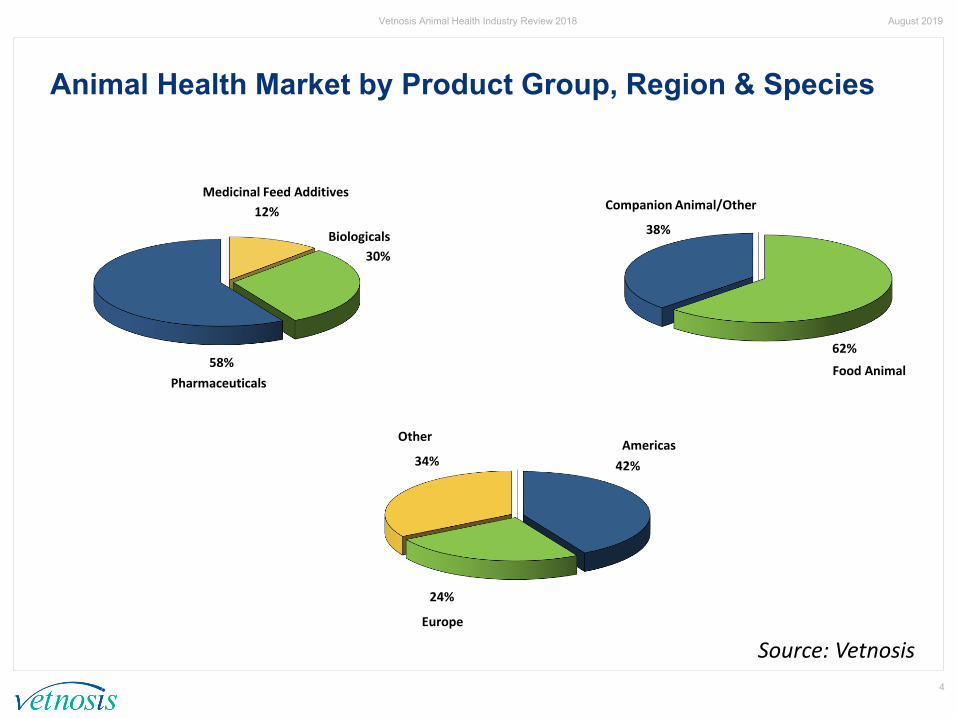
Animal Health Market by Product Group, Region & Species
Medicinal Feed Additives12%
Biologicals30%
58%Pharmaceuticals
Food Animal62%
Companion Animal/Other
38%
Americas42%
Europe
24%
Other
34%
Source: Vetnosis

Review of US Sales By Segment

Some Key Points on the Data Set Used for the 2018 Market Projections …
Copyright © Axxiom Consulting 2019. All rights reserved.
o Data reflects estimated 2018 annual sales for the US market only; adjusted to ex-factory levels and inclusive of free goods programs but not of any rebates (none for consumer, producer, veterinarian, retailer)
o Direct / agency sales estimates made for all segments for products marketed for Phibro, Huvepharma, Boehringer Ingelheim, Zoetis and others; sales for IDEXX & HESKA were excluded from these estimates
o An estimate for generic off-shore manufacturing of pet anti-parasitics was included at the ex-factory level
o Sales of $250m+ of human labeled pharma products were allocated across the applicable therapeutic categories; sales for compounders and scripts for human drugs at human pharmacies were excluded
o While Animalytix tracked sales of ~ $300m in SA & EQ nutraceuticals, an estimate of $ 1.0 billion is used for the total market*
o* Excludes large animal nutraceuticals
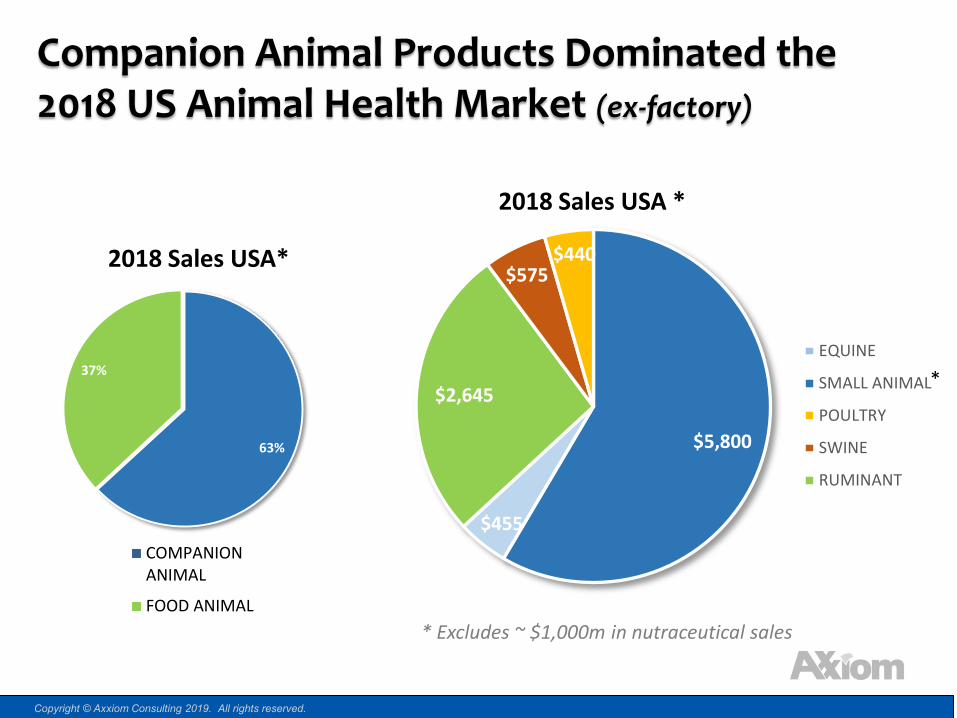
$5,800
$455
$2,645
$575 $440
2018 Sales USA
Companion Animal Products Dominated the 2018 US Animal Health Market (ex-factory)
57%
43%
2014 Sales (est)
COMPANIONANIMAL
FOOD ANIMAL
$432
$4,927
$418
$707
$2,712
2015 SALES ($M)
EQUINE
SMALL ANIMAL
POULTRY
SWINE
RUMINANT
2018 Sales USA*
*
* Excludes ~ $1,000m in nutraceutical sales
Copyright © Axxiom Consulting 2019. All rights reserved.
2018 Sales USA *
63%
37%

US Sales in Bios, MFAs & Pharma Topped $9.9b; Total Market Approached $11b w/ Nutraceuticals
Nutraceutical sales estimated at $1,000m; includes significant retail sales volumes
Copyright © Axxiom Consulting 2019. All rights reserved.
$-
$1,000,000,000
$2,000,000,000
$3,000,000,000
$4,000,000,000
$5,000,000,000
$6,000,000,000
$7,000,000,000
SA (Pets) Ruminants Swine Equine Poultry Other
2018 Species Sales by Therapeutic Category
Biologicals MFAs Pharmaceuticals*

$3.6
$1.9
$1.7
$1.7
$1.0
$0.8
$0.6 $0.3
Sales by Therapeutic Category ($ mil)
Parasiticide
Specialty Pharma
Vaccines
Anti-Infective
Nutraceuticals
Other
Enhancers
NSAID / Pain
For the US Market, Parasiticides, Anti-Infectives & Vaccines Contributed~ 63% of Total 2018 Sales
Copyright © Axxiom Consulting 2019. All rights reserved.
* $250m+ in human pharma sales included in anti-infectives, spec pharma & NSAID / PAIN (vet dispensing only)** New category added for equipment, supplies & products other then drugs, bios or supplements *** Nutraceutical sales includes significant retail sales volumes
31%
17%15%
14%
9%
7%
5% 2%
Sales by Therapeutic Category
Parasiticides
Specialty Pharma
Vaccines
Anti-Infectives
Nutraceuticals
Supplies / Equip
Prod Enhancers
NSAID / Pain
*
*
*
***
**

Review of Manufacturers & Leading Brands
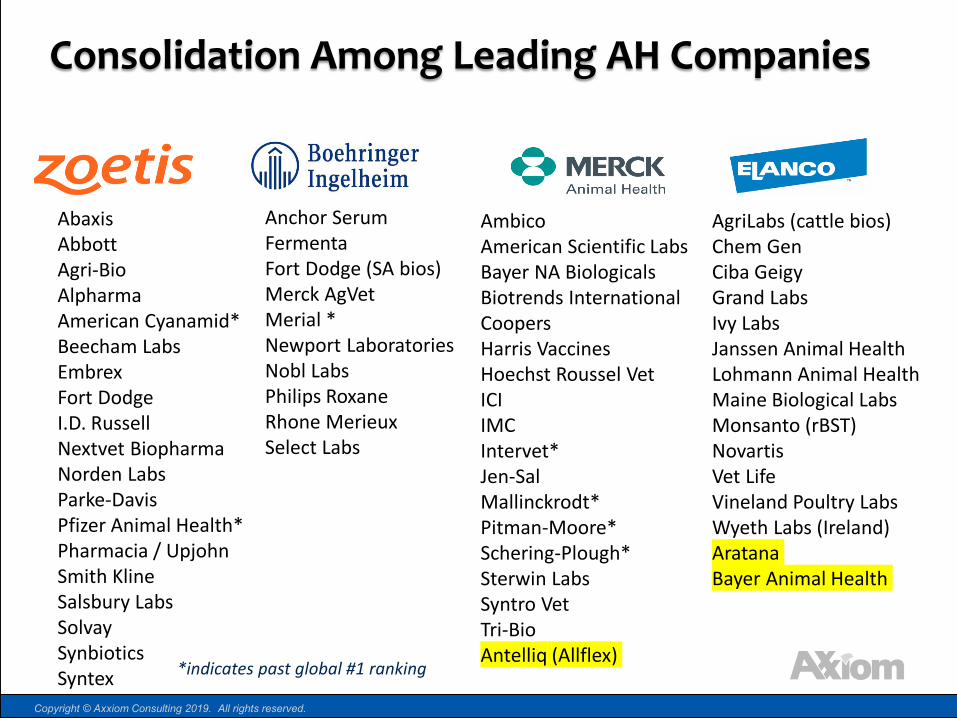
AbaxisAbbottAgri-BioAlpharmaAmerican Cyanamid*Beecham LabsEmbrexFort DodgeI.D. RussellNextvet BiopharmaNorden LabsParke-DavisPfizer Animal Health*Pharmacia / UpjohnSmith KlineSalsbury LabsSolvay SynbioticsSyntex
AmbicoAmerican Scientific LabsBayer NA BiologicalsBiotrends InternationalCoopers Harris VaccinesHoechst Roussel VetICIIMCIntervet*Jen-SalMallinckrodt*Pitman-Moore*Schering-Plough*Sterwin LabsSyntro VetTri-BioAntelliq (Allflex)
AgriLabs (cattle bios)Chem GenCiba GeigyGrand LabsIvy LabsJanssen Animal Health Lohmann Animal HealthMaine Biological LabsMonsanto (rBST)NovartisVet LifeVineland Poultry LabsWyeth Labs (Ireland)AratanaBayer Animal Health
Consolidation Among Leading AH Companies
*indicates past global #1 ranking
Anchor SerumFermentaFort Dodge (SA bios)Merck AgVetMerial *Newport LaboratoriesNobl LabsPhilips RoxaneRhone MerieuxSelect Labs
Copyright © Axxiom Consulting 2019. All rights reserved.
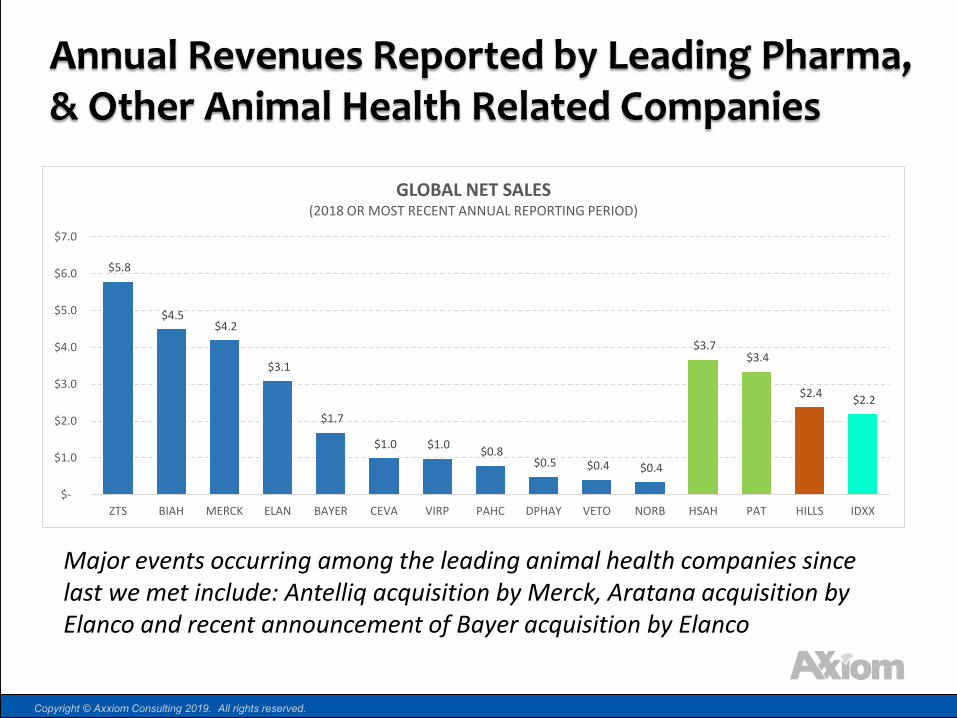
$5.8
$4.5 $4.2
$3.1
$1.7
$1.0 $1.0 $0.8 $0.5 $0.4 $0.4
$3.7 $3.4
$2.4 $2.2
$-
$1.0
$2.0
$3.0
$4.0
$5.0
$6.0
$7.0
ZTS BIAH MERCK ELAN BAYER CEVA VIRP PAHC DPHAY VETO NORB HSAH PAT HILLS IDXX
GLOBAL NET SALES (2018 OR MOST RECENT ANNUAL REPORTING PERIOD)
Annual Revenues Reported by Leading Pharma, & Other Animal Health Related Companies
Major events occurring among the leading animal health companies since last we met include: Antelliq acquisition by Merck, Aratana acquisition by Elanco and recent announcement of Bayer acquisition by Elanco
Copyright © Axxiom Consulting 2019. All rights reserved.
$-
$500,000,000
$1,000,000,000
$1,500,000,000
$2,000,000,000
$2,500,000,000
$3,000,000,000
$3,500,000,000
0
100
200
300
400
500
600
700
$100M+ $50-$100M $25-$50M $10-$25M $5-$10M $1-$5M
Animal Health Product & Tiers by Annual Sales
Products 2018 Sales
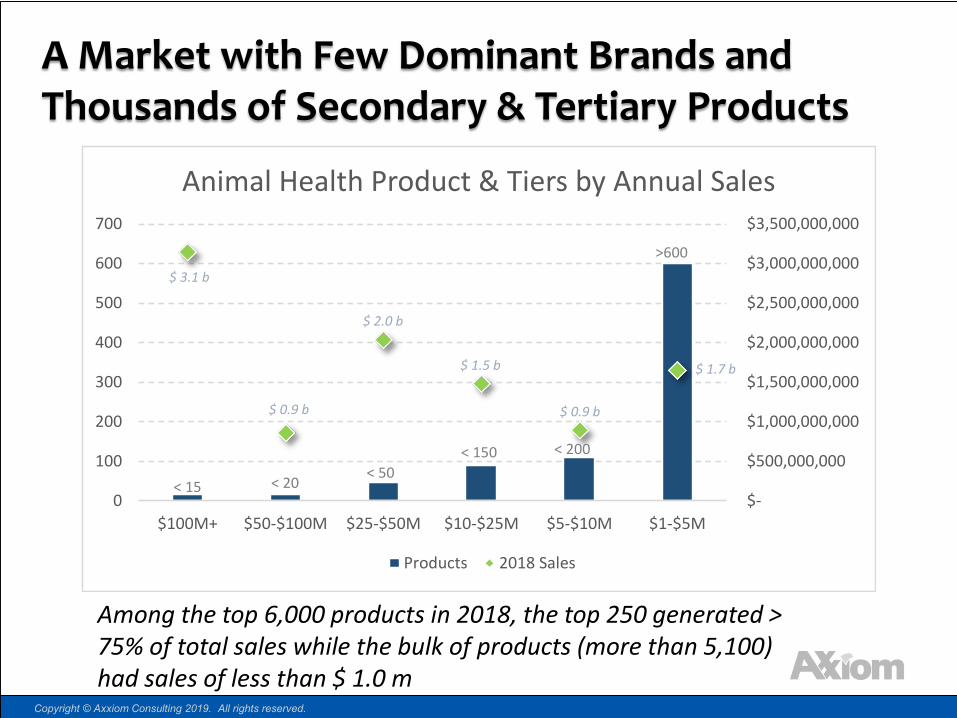
A Market with Few Dominant Brands and Thousands of Secondary & Tertiary Products
Among the top 6,000 products in 2018, the top 250 generated > 75% of total sales while the bulk of products (more than 5,100) had sales of less than $ 1.0 m
$ 3.1 b
$ 0.9 b
$ 1.5 b
$ 2.0 b
$ 0.9 b
$ 1.4 b$ 1.3 b
< 15 < 20< 50
< 150 < 200
>600
Copyright © Axxiom Consulting 2019. All rights reserved.
$ 1.7 b
Copyright © Animalytix 2019. All rights reserved.
Animalytix
2019 Mid-Year Market UpdateSmart Sort™ Segmentation & Price Volume
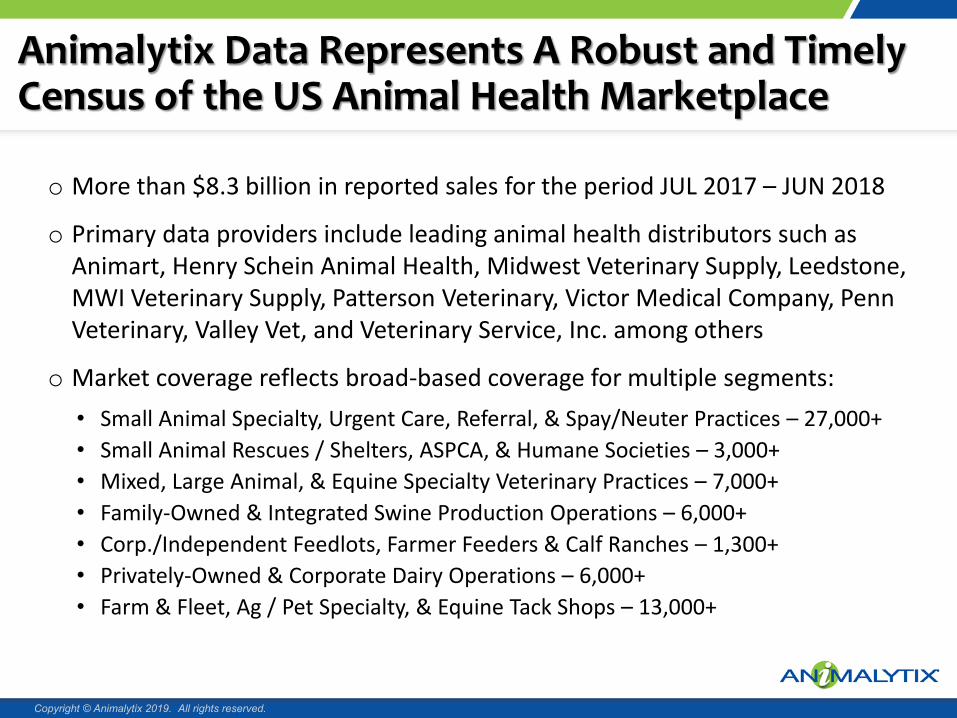
Animalytix Data Represents A Robust and Timely Census of the US Animal Health Marketplace
o More than $8.3 billion in reported sales for the period JUL 2017 – JUN 2018
o Primary data providers include leading animal health distributors such as Animart, Henry Schein Animal Health, Midwest Veterinary Supply, Leedstone, MWI Veterinary Supply, Patterson Veterinary, Victor Medical Company, Penn Veterinary, Valley Vet, and Veterinary Service, Inc. among others
o Market coverage reflects broad-based coverage for multiple segments:• Small Animal Specialty, Urgent Care, Referral, & Spay/Neuter Practices – 27,000+• Small Animal Rescues / Shelters, ASPCA, & Humane Societies – 3,000+• Mixed, Large Animal, & Equine Specialty Veterinary Practices – 7,000+• Family-Owned & Integrated Swine Production Operations – 6,000+• Corp./Independent Feedlots, Farmer Feeders & Calf Ranches – 1,300+• Privately-Owned & Corporate Dairy Operations – 6,000+• Farm & Fleet, Ag / Pet Specialty, & Equine Tack Shops – 13,000+
Copyright © Animalytix 2019. All rights reserved.

Robust Vaccine & Pharmaceutical Sales Growth Driving Small Animal Expansion
• Parasiticides, anti-infectives, sp. pharmas & NSAIDs drove strong SA category growth
• Human labeled sales are often opportunistic and mild annual swings are common; softening nutraceutical sales are surprising
Copyright © Animalytix 2019. All rights reserved.
6.3% 6.4%5.5%
10.6%
5.9%
-1.0%
2.1%
-10%
-5%
0%
5%
10%
15%
$-
$100,000,000
$200,000,000
$300,000,000
$400,000,000
$500,000,000
$600,000,000
$700,000,000
$800,000,000
Small Animal Category Sales 2019 vs PY (YTD)
2019 2018 VAR %
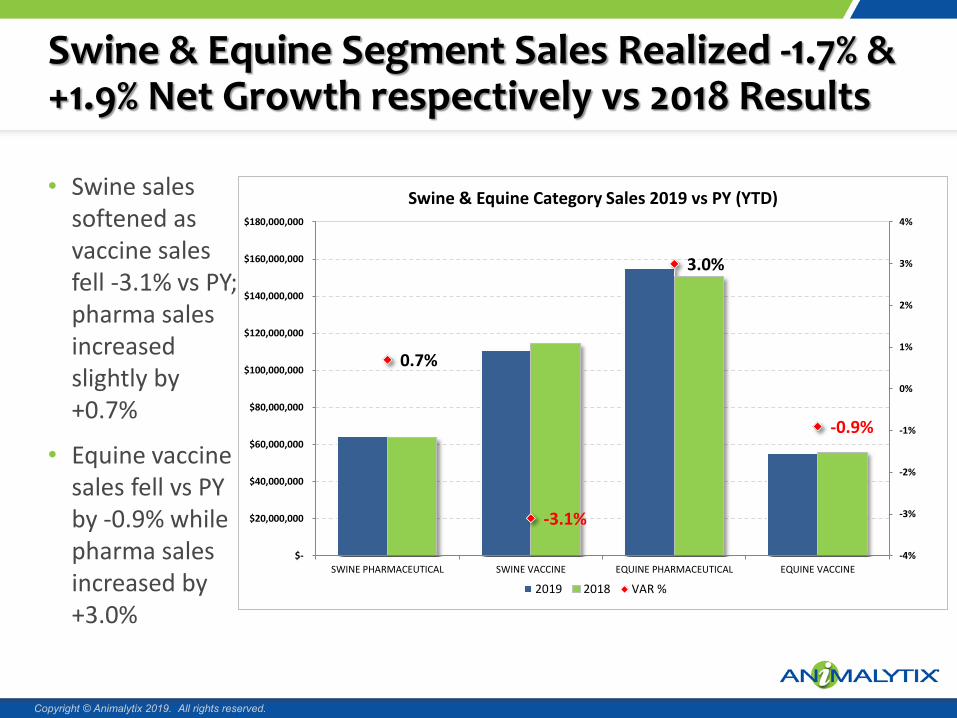
Swine & Equine Segment Sales Realized -1.7% & +1.9% Net Growth respectively vs 2018 Results
• Swine sales softened as vaccine sales fell -3.1% vs PY; pharma sales increased slightly by +0.7%
• Equine vaccine sales fell vs PY by -0.9% while pharma sales increased by +3.0%
Copyright © Animalytix 2019. All rights reserved.
0.7%
-3.1%
3.0%
-0.9%
-4%
-3%
-2%
-1%
0%
1%
2%
3%
4%
$-
$20,000,000
$40,000,000
$60,000,000
$80,000,000
$100,000,000
$120,000,000
$140,000,000
$160,000,000
$180,000,000
SWINE PHARMACEUTICAL SWINE VACCINE EQUINE PHARMACEUTICAL EQUINE VACCINE
Swine & Equine Category Sales 2019 vs PY (YTD)
2019 2018 VAR %

Ruminant Sales Lag; Market Prices & Weather Combine to Challenge Beef & Dairy Producers
• Vaccine & MFA sales remain positive vs losses in all other segments
• Pressure in the dairy segment is off-setting gains in cattle placements to drive negative volumes in multiple categories
Copyright © Animalytix 2019. All rights reserved.
-4.9%
-10.9%
-2.2%
5.3%
-2.4% -1.8%
-7.9%
-2.3%-3.3%
1.1%
-12%
-10%
-8%
-6%
-4%
-2%
0%
2%
4%
6%
8%
$-
$50,000,000
$100,000,000
$150,000,000
$200,000,000
$250,000,000
$300,000,000
(AF) PREMINJECTION
(AF) TRAD.INJ. &
BOLUSES
(AF)MASTITIS
PREPS
MED. FEEDADD.
(AP) ENDOS& ENDECTOS
(AP) PREM.& ECTOS
PROD.ENHANCERS
SPEC.PHARMA
REPROHORMONE
VACCINES
Ruminant Category Sales 2019 vs PY (YTD)
2019 2018 VAR %

Smart Sort™ Customer Segmentation Analysis
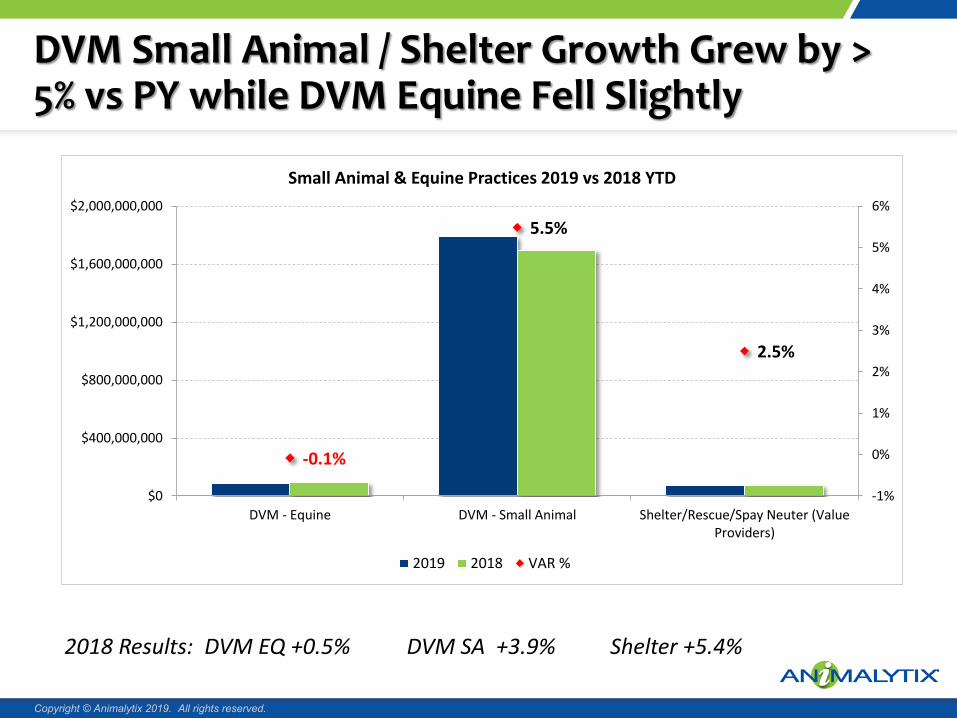
DVM Small Animal / Shelter Growth Grew by > 5% vs PY while DVM Equine Fell Slightly
2018 Results: DVM EQ +0.5% DVM SA +3.9% Shelter +5.4%
Copyright © Animalytix 2019. All rights reserved.
-0.1%
5.5%
2.5%
-1%
0%
1%
2%
3%
4%
5%
6%
$0
$400,000,000
$800,000,000
$1,200,000,000
$1,600,000,000
$2,000,000,000
DVM - Equine DVM - Small Animal Shelter/Rescue/Spay Neuter (ValueProviders)
Small Animal & Equine Practices 2019 vs 2018 YTD
2019 2018 VAR %
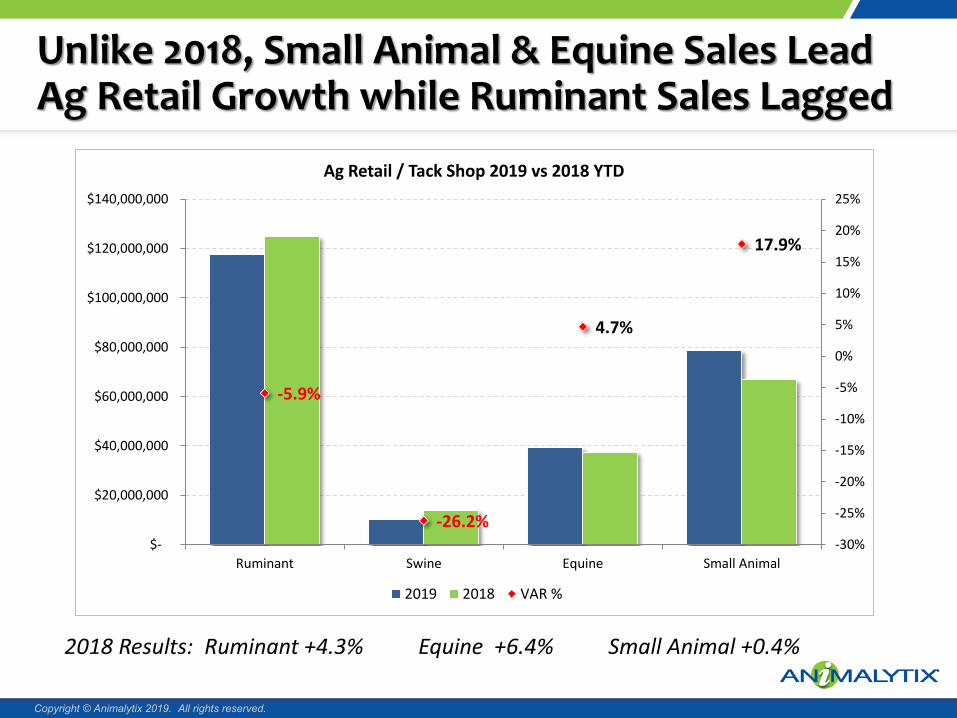
Unlike 2018, Small Animal & Equine Sales Lead Ag Retail Growth while Ruminant Sales Lagged
2018 Results: Ruminant +4.3% Equine +6.4% Small Animal +0.4%
Copyright © Animalytix 2019. All rights reserved.
-5.9%
-26.2%
4.7%
17.9%
-30%
-25%
-20%
-15%
-10%
-5%
0%
5%
10%
15%
20%
25%
$-
$20,000,000
$40,000,000
$60,000,000
$80,000,000
$100,000,000
$120,000,000
$140,000,000
Ruminant Swine Equine Small Animal
Ag Retail / Tack Shop 2019 vs 2018 YTD
2019 2018 VAR %
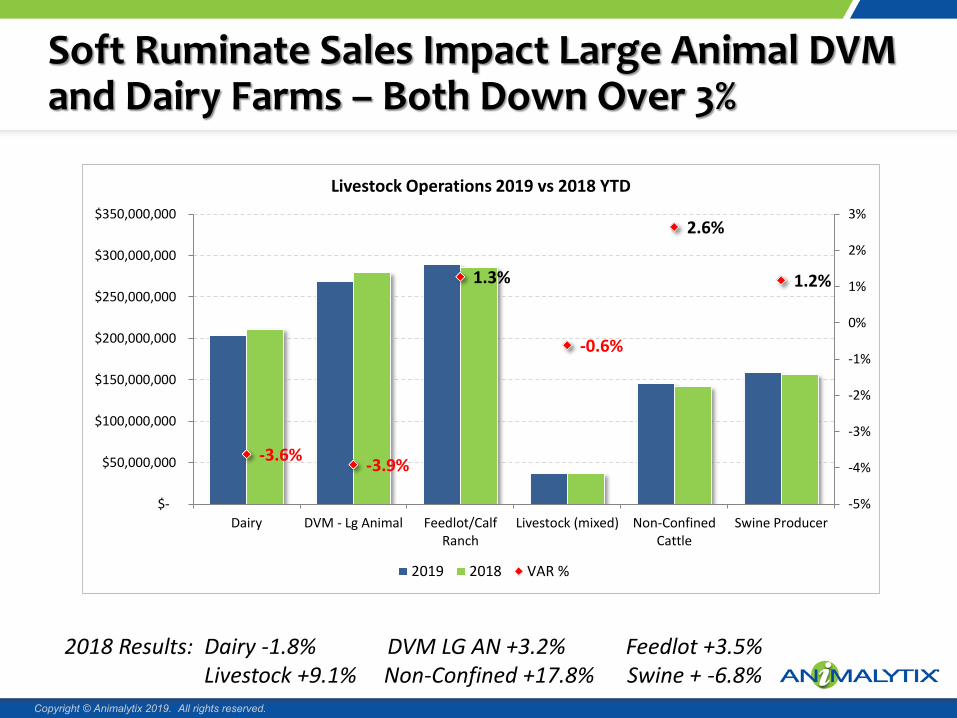
Soft Ruminate Sales Impact Large Animal DVM and Dairy Farms – Both Down Over 3%
2018 Results: Dairy -1.8% DVM LG AN +3.2% Feedlot +3.5%Livestock +9.1% Non-Confined +17.8% Swine + -6.8%
Copyright © Animalytix 2019. All rights reserved.
-3.6% -3.9%
1.3%
-0.6%
2.6%
1.2%
-5%
-4%
-3%
-2%
-1%
0%
1%
2%
3%
$-
$50,000,000
$100,000,000
$150,000,000
$200,000,000
$250,000,000
$300,000,000
$350,000,000
Dairy DVM - Lg Animal Feedlot/CalfRanch
Livestock (mixed) Non-ConfinedCattle
Swine Producer
Livestock Operations 2019 vs 2018 YTD
2019 2018 VAR %
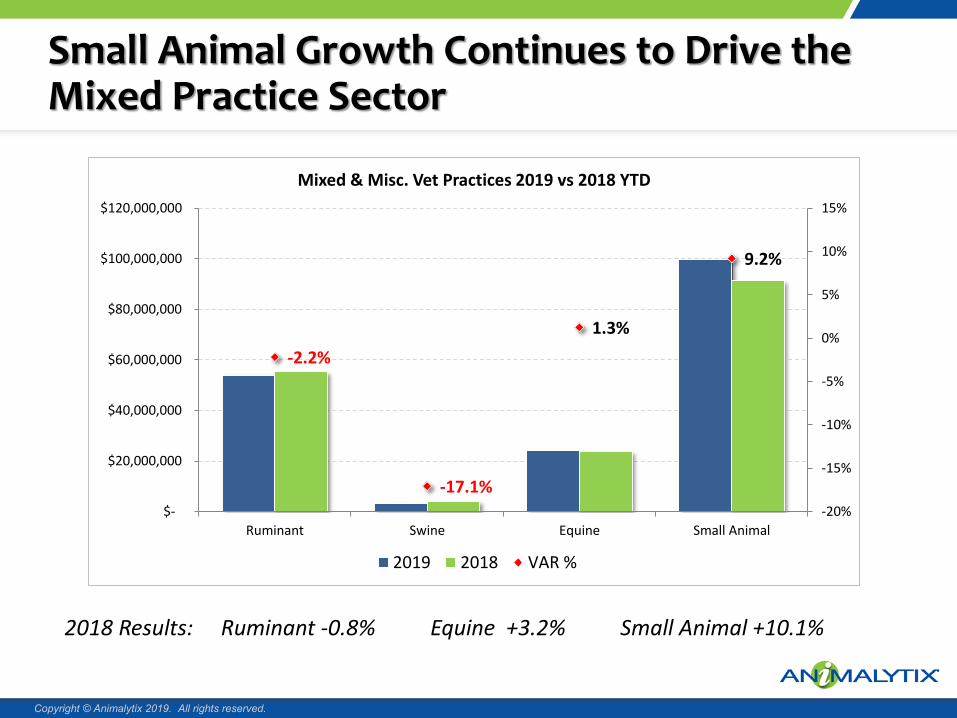
Small Animal Growth Continues to Drive the Mixed Practice Sector
2018 Results: Ruminant -0.8% Equine +3.2% Small Animal +10.1%
Copyright © Animalytix 2019. All rights reserved.
-2.2%
-17.1%
1.3%
9.2%
-20%
-15%
-10%
-5%
0%
5%
10%
15%
$-
$20,000,000
$40,000,000
$60,000,000
$80,000,000
$100,000,000
$120,000,000
Ruminant Swine Equine Small Animal
Mixed & Misc. Vet Practices 2019 vs 2018 YTD
2019 2018 VAR %
Animalytix Price Volume Analysis for Vaccine & Pharmaceutical
Brands (JAN - JUN 2019)

ALX Conducted a 2019 YTD Price Volume Analysis for Established Vaccines & Pharmaceuticals
• A sample of 2,790 animal health products across all species and most product segments was used to assess price/volume effect for 2019 YTD
• Half year sales totaled $3.2 billion and represented 83.9% of total vaccine, pharmaceutical and nutraceutical sales reported by ALX for the period
• All year-over-year comparisons were done on a ‘like-unit’ basis with 5,600+ unique MFG SKUs included in the assessment*
• The analysis was based on distributor invoice pricing and inclusive of all reported free goods delivered but exclusive of any direct to producer, veterinarian or consumer rebates
• Aggregate results through June were as follows:–Net Pricing Variance +2.0%–Net Volume Variance - 0.8%–Net Total Variance +1.2%
*Excludes products incurring a change in go-to-market strategy from 2018 to 2019
Copyright © Animalytix 2019. All rights reserved.

Sharp Volume Declines Among Cattle Products Heavily Impacted YTD Aggregate Results
• Price was the growth driver for ruminant, equine and small animal while swine experienced negative pricing effects; only SA experienced positive volume effects.
• Across all species, results by therapeutic categories were as follows:
PRICING VOLUME TOTAL–Anti-Infectives +1.0% -5.3% -4.3% –Anti-Parasitics +3.3% -1.4% +1.9%–Pharmaceuticals +1.2% +1.5% +2.7%–Vaccines +2.2% - 0.3% +1.8%
Copyright © Animalytix 2019. All rights reserved.
* Excludes impact of any rebates; generally does include free goods programs
Species Brands2019 Sales
(mil) 2018 Sales
(mil)PRI VAR
(mil)VOL VAR
(mil)Total $ VAR
(mil)PRI VAR
%VOL VAR
%Total VAR
%
Ruminant 865 $ 1,053 $ 1,084 $ 20.7 $ (50.9) $ (30.2) 1.9% -4.7% -2.8%
Swine 135 $ 149 $ 156 $ (5.3) $ (2.1) $ (7.4) -3.4% -1.4% -4.7%
Equine 727 $ 210 $ 212 $ 3.5 $ (5.5) $ (2.0) 1.7% -2.6% -0.9%
Small Animal 1040 $ 1,872 $ 1,793 $ 47.1 $ 31.2 $ 79.0 2.6% 1.8% 4.4%Multi Sp 23 $ 3 $ 3 $ - $ 0.1 $ - -1.5% 3.2% 1.7%
Grand Total 2,790 $ 3,287 $ 3,247 $ 66.0 $ (27.2) $ 39.4 2.0% -0.8% 1.2%
Summary Chart - Price/Volume Analysis

Vetalytix™ Market Insights

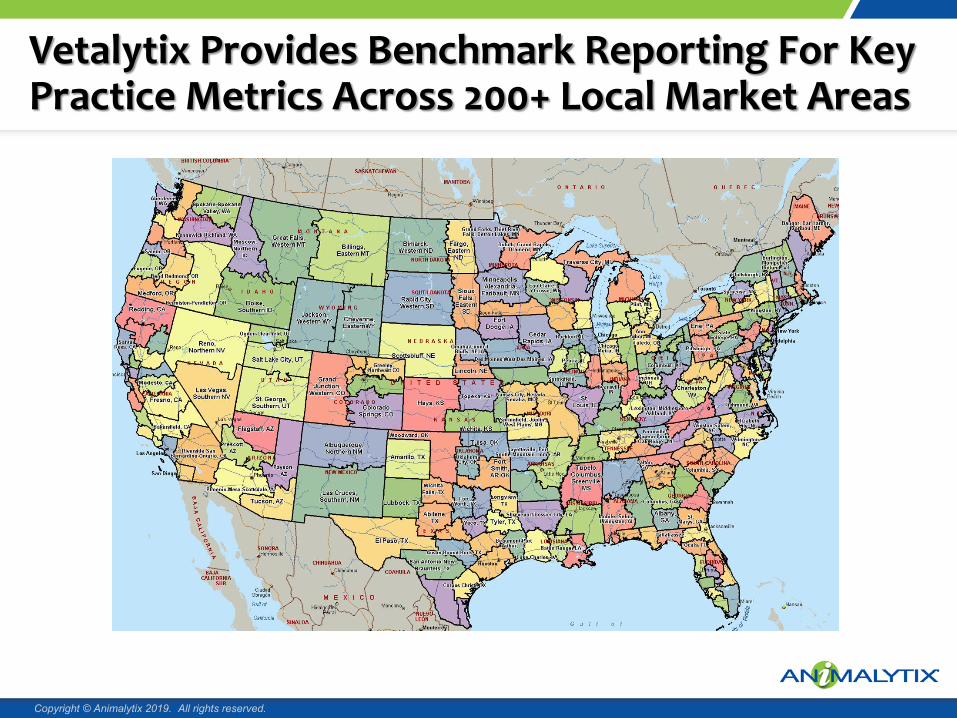
Vetalytix Provides Benchmark Reporting For Key Practice Metrics Across 200+ Local Market Areas
Copyright © Animalytix 2019. All rights reserved.

Growth in Canine Core Doses (DAP) Tepid at 0.4% and Reaching 39.7m (MAT Period JUL ‘18 - JUN ’19)
Copyright © Animalytix 2019. All rights reserved.
+0.1%
+0.8%
+0.9%
+2.8%
+1.6%
+0.4%
-1.9%
+2.2%
+0.4%
Pacific West
Mountain West
South Atlantic
New England
Mid-Atlantic
East South Central
East North Central
West North Central
West South Central
Canine wellness visits are the critical component of the companion animal veterinary market; flat core dose growth suggest weakness in a key area
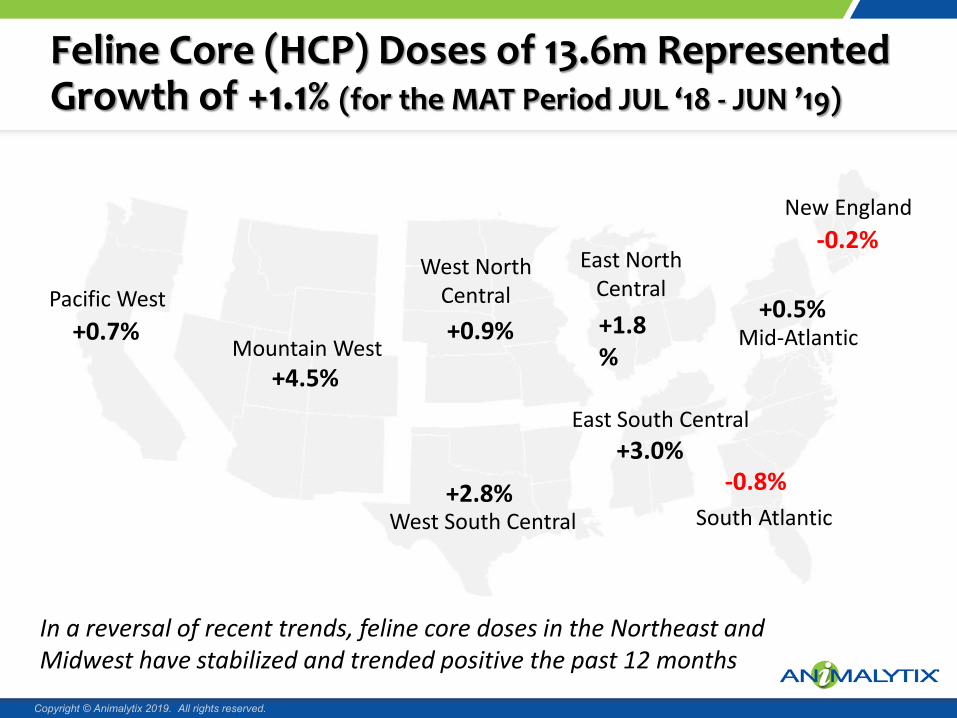
Feline Core (HCP) Doses of 13.6m Represented Growth of +1.1% (for the MAT Period JUL ‘18 - JUN ’19)
Copyright © Animalytix 2019. All rights reserved.
In a reversal of recent trends, feline core doses in the Northeast and Midwest have stabilized and trended positive the past 12 months
Pacific West
Mountain West
South Atlantic
New England
Mid-Atlantic
East South Central
East North Central
West North Central
West South Central
+1.8%
+3.0%
+0.5%
+4.5%
-0.2%
+0.7%
-0.8%
+0.9%
+2.8%
Veterinary Consumption Index
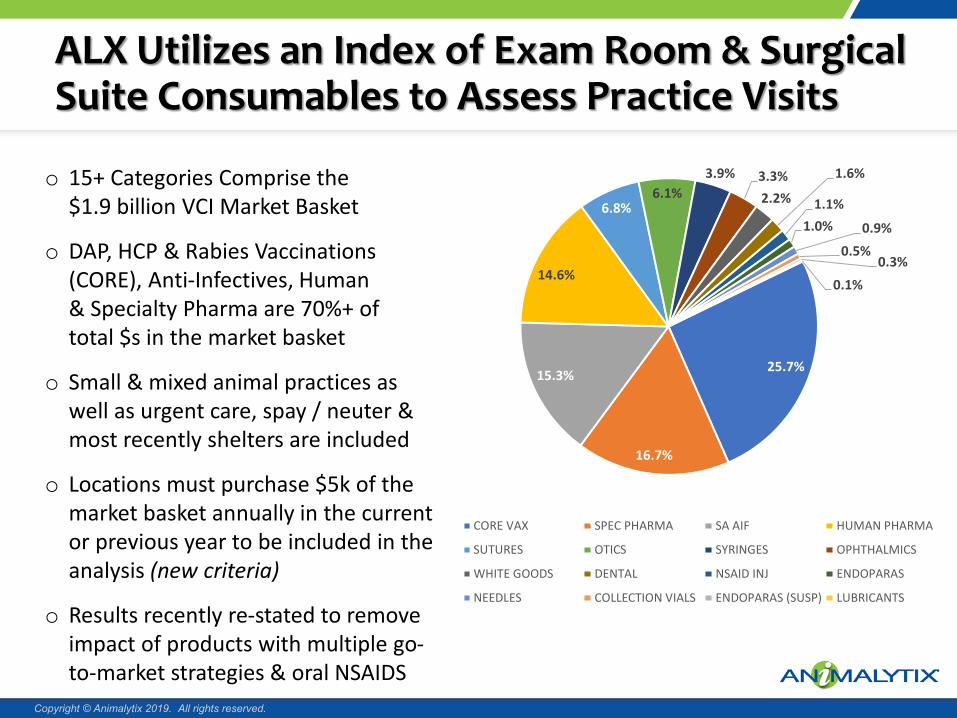
ALX Utilizes an Index of Exam Room & Surgical Suite Consumables to Assess Practice Visits
Copyright © Animalytix 2019. All rights reserved.
25.7%
16.7%
15.3%
14.6%
6.8%6.1%
3.9% 3.3%2.2%
1.6%
1.1%1.0% 0.9%
0.5%0.3%
0.1%
CORE VAX SPEC PHARMA SA AIF HUMAN PHARMA
SUTURES OTICS SYRINGES OPHTHALMICS
WHITE GOODS DENTAL NSAID INJ ENDOPARAS
NEEDLES COLLECTION VIALS ENDOPARAS (SUSP) LUBRICANTS
25.7%
16.7%
15.3%
14.6%
6.8%6.1%
3.9% 3.3%2.2%
1.6%
1.1%1.0% 0.9%
0.5%0.3%
0.1%
CORE VAX SPEC PHARMA SA AIF HUMAN PHARMA
SUTURES OTICS SYRINGES OPHTHALMICS
WHITE GOODS DENTAL NSAID INJ ENDOPARAS
NEEDLES COLLECTION VIALS ENDOPARAS (SUSP) LUBRICANTS
o 15+ Categories Comprise the $1.9 billion VCI Market Basket
o DAP, HCP & Rabies Vaccinations (CORE), Anti-Infectives, Human & Specialty Pharma are 70%+ of total $s in the market basket
o Small & mixed animal practices as well as urgent care, spay / neuter & most recently shelters are included
o Locations must purchase $5k of the market basket annually in the current or previous year to be included in the analysis (new criteria)
o Results recently re-stated to remove impact of products with multiple go-to-market strategies & oral NSAIDS
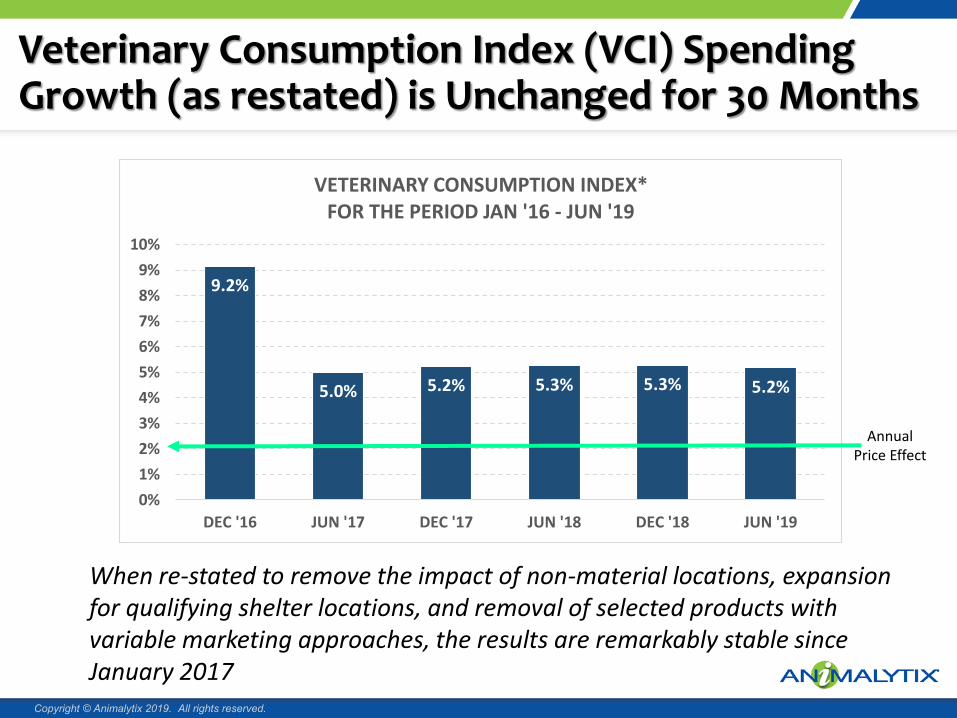
Veterinary Consumption Index (VCI) Spending Growth (as restated) is Unchanged for 30 Months
Copyright © Animalytix 2019. All rights reserved.
When re-stated to remove the impact of non-material locations, expansion for qualifying shelter locations, and removal of selected products with variable marketing approaches, the results are remarkably stable since January 2017
9.2%
5.0% 5.2% 5.3% 5.3% 5.2%
0%1%2%3%4%5%6%7%8%9%
10%
DEC '16 JUN '17 DEC '17 JUN '18 DEC '18 JUN '19
VETERINARY CONSUMPTION INDEX* FOR THE PERIOD JAN '16 - JUN '19
Annual Price Effect

-60%
-50%
-40%
-30%
-20%
-10%
0%
10%
20%
30%
40%
50%
60%
1 18 35 52 69 86 103
120
137
154
171
188
205
222
239
256
273
290
307
324
341
358
375
392
409
426
443
460
477
494
511
528
545
562
579
596
613
630
647
664
681
698
715
732
749
766
783
800
817
834
851
868
885
902
919
936
953
970
987
Random Sample 1,000+ Practices JAN-JUN 2019 vs PY Period
$ VAR Invoice $ % VAR CLIENTS % VAR REV $
PIMS Analysis of 1,000 Unique Practices Reflect Growth with Significant Variance Among Practices
Copyright © Animalytix 2019. All rights reserved.
An analysis of 1,000 random practices showed 2.8% growth in unique patients and 2.5% growth in total invoices while revenue jumped by 6.6% on average; of these practices for patient and invoice results, 40% of practices were negative, 5% flat, 55% positive and 17.5%+ grew double digits
Negative % Clients & Invoices
Flat POS 2% - 6% Growth Double Digit Growth
JAN-JUN '19 - 1,000 Practice Sample 2018 2019 % VAR
Total Revenue 988,025,575$ 1,053,176,945$ 6.6%
Total Number of Invoices 7,204,093 7,382,532 2.5%
Total Number of Unique Clients 2,154,938 2,215,575 2.8%
6% - 9%
Courtesy of Greenline Pet

Kansas City Animal Health CorridorUS ANIMAL HEALTH MARKET INSIGHTS2019 Mid-Year Update
Property of Axxiom Consulting LLC Copyright © 2019. All rights reserved