Updated: 21 September 2017 - UMass Amherst · CEE 572 Lecture #4 9/21/2017 1 Lecture #4 (mass...
15
CEE 572 Lecture #4 9/21/2017 1 Lecture #4 (mass balance, loadings & steady state solutions) Chapra L3 David A. Reckhow CEE 577 #4 1 Updated: 21 September 2017 Print version Completely‐mixed lake or CSTR Often useful to assume perfect mixing same concentration throughout system David A. Reckhow CEE 577 #4 2 Accumulation loading outflow reaction settling C V C in Q C Q settling reaction Loading Outflow
Transcript of Updated: 21 September 2017 - UMass Amherst · CEE 572 Lecture #4 9/21/2017 1 Lecture #4 (mass...

CEE 572 Lecture #4 9/21/2017
1
Lecture #4
(mass balance, loadings & steady state solutions)
Chapra L3
David A. Reckhow CEE 577 #4 1
Updated: 21 September 2017 Print version
Completely‐mixed lake or CSTR Often useful to assume perfect mixing
same concentration throughout system
David A. Reckhow CEE 577 #4 2
Accumulation loading outflow reaction settling
C
VCin
Q
CQ
settling
reactionLoading
Outflow

CEE 572 Lecture #4 9/21/2017
2
Accumulation
David A. Reckhow CEE 577 #4 3
AccumulationM
t
cM
VM Vc
AccumulationVc
t
and
And if volume is constant:
Accumulation Vc
tV
dc
dt
So:
CV
Equals zero at steady state
Loading Point Sources
Municipal Wastewater
Industrial Wastewater
Tributaries
Non‐point sources agricultural
silvicultural
atmospheric
urban & suburban runoff
groundwater
David A. Reckhow CEE 577 #4 4
Diffuse originmore transient
often dependent on precipitation
Well defined origineasily measuredmore constant
Loading W t Qc tin ( ) ( )

CEE 572 Lecture #4 9/21/2017
3
Reported Values Of Selected Waste Input Parameters In The United States
David A. Reckhow CEE 577 #4 5
Variable Unitsa MunicipalInfluentb
CSOc UrbanRunoffd
Agriculture(lb/mi2-d)
eForest
(lb/mi2-d)e
Atmosphere(lb/mi2-day)
f
Averagedaily flow
gcd 125
Totalsuspendedsolids
mg/L 300 410 610 2500 400
CBOD5g mg/L 180 170 27 40 8CBODUg mg/L 220 240NBODg mg/L 220 290Totalnitrogen
mg-N/L 50 9 2.3 15 4 8.9-18.9
Totalphosphorus
mg-P/L 10 3 0.5 1.0 0.3 0.13-1.3
Totalcoliforms
106/100mL
30 6 0.3
Cadmium g/L 1.2 10 13 0.015Lead g/L 22 190 280 1.3Chromium g/L 42 190 22 0.088Copper g/L 159 460 110Zinc g/L 241 660 500 1.8Total PCB g/L 0.9 0.3 - 0.002-0.02
(Table 1.3 from Thomann & Mueller)
Footnotes for T&M Table 1.3
David A. Reckhow CEE 577 #4 6
aUnits apply to municipal, CSO (combined sewer overflow), and urban runoff sources; gcd = gallons per capita per day.
bThomann (1972); heavy metals and PCB, HydroQual (1982).cThomann (1972); total coli, Tetra Tech, (1977); heavy metals Di
Toro et al. (1978): PCB. Hydroscience (1978).dTetra Tech (1977): heavy metals, Di Toro et al. (1978).eHydroscience (1976a).fNitrogen and phosphorus, Tetra Tech (1982): heavy metals and
PC13, HydroQual (1982).gCBOD5 = 5 day carbonaceous biochemical oxygen demand
(CBOD); CBODU = ultimate CBOD; NBOD = nitrogenous BOD.

CEE 572 Lecture #4 9/21/2017
4
Loading: Flow as a function of precipitation Non point sources are difficult to characterize
Empirical approach: export coefficients (see Table 3.1 in T&M)
Mechanistic approach: relate to meteorology, topology, etc.
Flow: use the rational formula: QR = cIA
David A. Reckhow CEE 577 #4 7
Runoff flow [L3/T]
Runoff coefficient0.1-0.3 for rural areas (1 person/acre)0.7-0.9 for heavy commercial areas
Rainfall Intensity [L/T]
DrainageArea [L2]
Note:1 acre-in/hr 1 cfs
Runoff: Contrasting approaches Lumped model
Empirical
Built on a single rainfall intensity from rain gage data
Distributed model Mechanistic
Built on radar data for rainfall Spatial & temporal resolution
Combine with overland flow models Many computer codes
CASC2D, CUHP, CUHP/SWMM, DR3M, HEC‐1, HSPF, PSRM, SWMM, TR20
David A. Reckhow CEE 577 #4 8

CEE 572 Lecture #4 9/21/2017
5
Loading: conc. as a function of flow It is common for pollutant concentrations from uncontrolled sources (e.g. tributaries) to be correlated with flow
David A. Reckhow CEE 577 #4 9
1
10
100
1000
1 10 100 1000
Flow (cfs)
Co
nc
en
tra
tio
n (
mg
/L)
establish a log-log relationship
c=aQb
Log(C) = log(a) + b*log(Q)
Loading Example: #3.1 from T&M Data: Runoff from 100 mi2 of agricultural lands drains to a point in a river
where a city of 100,000 people is located. The city has a land area of 10 mi2
and its sanitary sewers are separated from its storm drains. A sewage treatment plant discharges to the river immediately downstream of the city. The area receives an annual rainfall of 30 in. of which 30% runs off the agricultural lands and 50% drains off the more impervious city area.
Problem: Using the loading data from Table 1.3 and the residual fractions cited in the table below, compare the contributions of the atmospheric, agricultural and urban sources to annual average values of flow, CBOD5, total coliform bacteria, and lead in the river. Neglect any decay mechanisms for all parameters.
David A. Reckhow CEE 577 #4 10
(at) (ag) (ur) Wastewater Treatment Plant Item Atmospheric Agricultural Urban Runoff Influent Resid. Fract.
Fow 30% precip. 50% precip. 125 gcd 1.00 CBOD5 40 lb/mi2-d 27 mg/L 180 mg/L 0.15 Total coliform 100/100 mL 3x10⁵/100mL 3x10⁶/100mL 0.0001 Lead 1.3 lb/mi2-d 280 g/L 22 g/L 0.05

CEE 572 Lecture #4 9/21/2017
6
Solution to loading problem
Flow contributions
David A. Reckhow CEE 577 #4 11
cfs
yrinmiagQ sd
dyr
inft
mift
3.66
3.0/30100)( 400,861
3651
121252802
cfs
MGD
dcap
galcapwwtpQ
MGDcfs
galMG
4.19
5.12
125000,100)(
548.1
101
6
cfs
yrinmiurQ sd
dyr
inft
mift
1.11
5.0/3010)( 400,861
3651
121252802
Solution to loading problem (cont.) CBOD5 loading
David A. Reckhow CEE 577 #4 12
d
lb
dmi
lbmiagW
4000
40100)(2
2
d
lb
LmgMGDwwtpW LmgMGDdlb
2810
15.0/1805.12)( /*/34.8
d
lb
Lmgcfs
dlbLmgcfsurW
1620
/
/4.5/271.11)(
CEE 572 Lecture #4 9/21/2017
7
Solution to loading problem (cont.) Lead loading
David A. Reckhow CEE 577 #4 13
d
lb
dmi
lbmiatmW
13
1.03.1100)(2
2
d
lb
LgMGDwwtpW gmg
LmgMGDdlb
11.0
05.0/225.12)(310
/*/34.8
d
lb
g
mg
Lmgcfs
dlbLgcfsurW
8.16
10
/
/4.5/2801.11)(
3
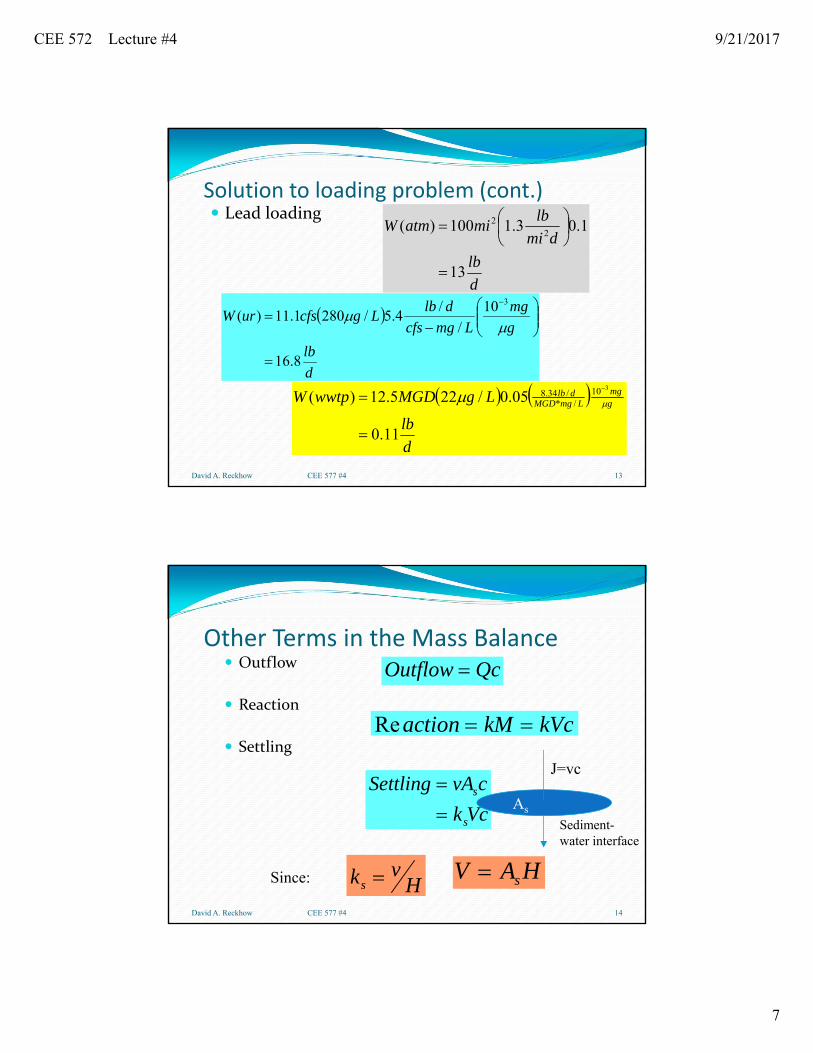
Other Terms in the Mass Balance Outflow
Reaction
Settling
David A. Reckhow CEE 577 #4 14
Outflow Qc
Reaction kM kVc
Settling vA c
k Vcs
s
k vHs V A HsSince:
J=vc
As
Sediment-water interface

CEE 572 Lecture #4 9/21/2017
8
Combining all terms:
Dependent variable: c
Independent variable: t
Forcing function: W(t), the way in which the external world “forces” the system
Parameters: V, Q, k, v, As
David A. Reckhow CEE 577 #4 15
Vdc
dtW t Qc kVc vA cs ( )
Steady State Case
Mass Balance
Solution
Assimilation factor
Where
The assimilation or “cleansing” factor
David A. Reckhow CEE 577 #4 16
cW
Q kV vAs
a
Wc
svAkVQa
or
Vdc
dtW t Qc kVc vA cs 0 ( )
W

CEE 572 Lecture #4 9/21/2017
9
Steady State Example
David A. Reckhow CEE 577 #4 17
A lake has the following characteristics:
Volume m
dC
50 000 3
1
, Mean Depth = 2 m
Inflow = Outflow = 7500 mTemperature = 25
3
o
The lake receives the input of a pollutant from three sources: a factory discharge of 50 kg d-1, a flux from the atmosphere of 0.6 g m-2 d-1, and the inflow stream that has a concentration of 10 mg/L. If the pollutant decays at the rate of 0.25/d at 20oC (note: Ɵ=1.05).
a. compute the assimilation factorb. steady state concentrationc. show breakdown for each term
#3.1 from Chapra (pg.52)
Example 3.1: Solution
David A. Reckhow CEE 577 #4 18
kd
0 25 0 25 1050 319
25 20 25 20
1. . ( . ).
First correct the decay rate for temperature
Now the assimilation factor
13454,23
)000,50(319.07500
dm
kVQa

CEE 572 Lecture #4 9/21/2017
10
Example 3.1: Solution (cont.)
David A. Reckhow CEE 577 #4 19
The surface area of the lake is:
AV
Hms
50 000
225 000 2,
,
The atmospheric and inflow load is then:
W JA g datmosphere s 0 6 25 000 15 000. ( , ) , /
W g dlowinf ( ) , / 7500 10 75 000Combining all loads: W W W W
g d
factory atmosphere low
inf
, , ,, /
50 000 15 000 75 000140 000
Example 3.1: Solution (cont.)
David A. Reckhow CEE 577 #4 20
And finally, the concentration:
Lmg
dm
dga
Wc
/97.5
/454,23
/000,1403

CEE 572 Lecture #4 9/21/2017
11
Transfer function & residence time
David A. Reckhow CEE 577 #4 21
cW
Q kV vAQc
Q kV vA
s
in
s
c
c
Q
Q kV vAin s
Transfer function
E
E
dE dt w
V
Q
cs s
Vc
Qc kVc vA c
V
Q kV vA
Residence times
generic
water
contaminant
Pittsburgh
David A. Reckhow CEE 577 #4 22

CEE 572 Lecture #4 9/21/2017
12
David A. Reckhow CEE 577 #4 23
David A. Reckhow CEE 577 #4 24

CEE 572 Lecture #4 9/21/2017
13
David A. Reckhow CEE 577 #4 25
David A. Reckhow CEE 577 #4 26
CEE 572 Lecture #4 9/21/2017
14
David A. Reckhow CEE 577 #4 27
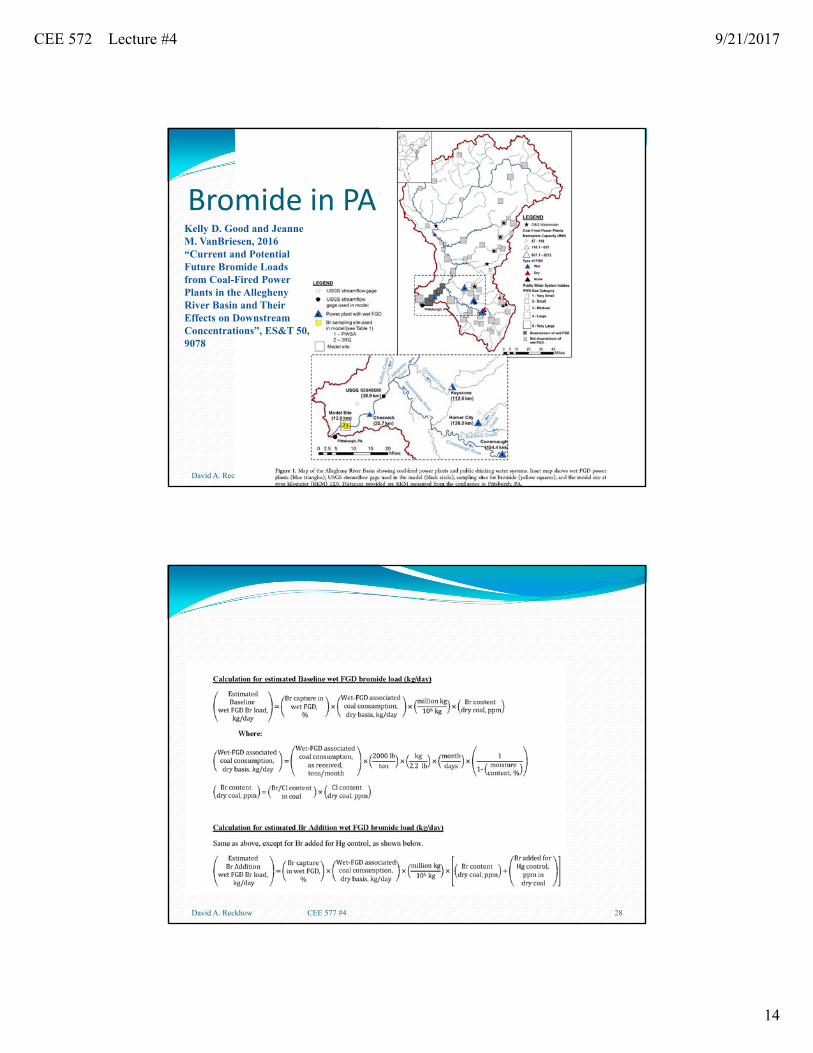
Bromide in PAKelly D. Good and Jeanne M. VanBriesen, 2016 “Current and Potential Future Bromide Loads from Coal-Fired PowerPlants in the Allegheny River Basin and Their Effects on DownstreamConcentrations”, ES&T 50, 9078
David A. Reckhow CEE 577 #4 28

CEE 572 Lecture #4 9/21/2017
15
David A. Reckhow CEE 577 #4 29
To next lecture
David A. Reckhow CEE 577 #4 30