UNU-WIDER : UNU-WIDER - Considering the benefits of hosting … · 2017-09-29 · Considering the...
27
Considering the benefits of hosting refugees: Evidence of refugee camps influencing local labor market activity and economic welfare in Rwanda Craig Loschmann a *, Özge Bilgili b & Melissa Siegel a a Maastricht Graduate School of Governance | UNU-MERIT, Maastricht University b Utrecht University Draft Version: August 2017 [This is an early draft subject to change, please do not disseminate or cite without permission] *Corresponding author contact information: [email protected]. Acknowledgements: We thank Sonja Fransen, Carlos Vargas-Silva and Eleonora Nillesen for invaluable feedback on earlier versions. Likewise we received helpful feedback from participants of the “Beyond Crisis: Rethinking Refugee Studies” conference at the University of Oxford, the “Transnational Migration, Citizenship and the Circulation of Rights and Responsibilities” workshop at the European University Institute, the workshop on “Migration and Conflict” at Université Catholique de Louvain, and the 10 th AFD-World Bank Conference on Migration and Development. We are indebted to Evelina Bonnier and Marijke Verpoorten for timely assistance with secondary data. We are similarly thankful of the UNHCR’s sub-country office in Kigali, as well as the National Institute of Statistics Rwanda for their support during fieldwork. This paper is a result of a project funded by the United Nations High Commissioner for Refugees.
Transcript of UNU-WIDER : UNU-WIDER - Considering the benefits of hosting … · 2017-09-29 · Considering the...

Considering the benefits of hosting refugees: Evidence of refugee camps
influencing local labor market activity and economic welfare in Rwanda
Craig Loschmanna*, Özge Bilgili
b & Melissa Siegel
a
aMaastricht Graduate School of Governance | UNU-MERIT, Maastricht University
bUtrecht University
Draft Version: August 2017
[This is an early draft subject to change, please do not disseminate or cite without permission]
*Corresponding author contact information: [email protected].
Acknowledgements: We thank Sonja Fransen, Carlos Vargas-Silva and Eleonora Nillesen for
invaluable feedback on earlier versions. Likewise we received helpful feedback from participants
of the “Beyond Crisis: Rethinking Refugee Studies” conference at the University of Oxford, the
“Transnational Migration, Citizenship and the Circulation of Rights and Responsibilities”
workshop at the European University Institute, the workshop on “Migration and Conflict” at
Université Catholique de Louvain, and the 10th
AFD-World Bank Conference on Migration and
Development. We are indebted to Evelina Bonnier and Marijke Verpoorten for timely assistance
with secondary data. We are similarly thankful of the UNHCR’s sub-country office in Kigali, as
well as the National Institute of Statistics Rwanda for their support during fieldwork. This paper
is a result of a project funded by the United Nations High Commissioner for Refugees.

Abstract
With an extraordinary number of individuals at present residing in exile due to conflict,
persecution and the like, there is a growing interest in the consequences of hosting refugees for
local populations. Such consequences, however, need not to be unfavorable and in many
instances the presence of refugees results in direct and indirect benefits for host communities. In
this paper we examine the influence of Congolese refugees on host communities in Rwanda,
with a focus on labor market activity and economic welfare. Our analysis takes advantage of
newly collected survey data from three refugee camps and their surrounding areas to compare
individuals and households within communities at various distances from, and therefore
exposure to, the refugee population. We find strong evidence that residing nearby a refugee camp
makes it more likely, on average, that an individual is engaged in wage employment in
comparison to farming or livestock production, representing a shift away from subsistence
farming activities. In addition, there is evidence that females living nearby a camp have a higher
occurrence of self-employment in business both as a primary and secondary activity,
highlighting a gender-specific dynamic. Likewise, living in close proximity to a camp is
associated with greater household asset ownership on average, benefiting both male- and female-
headed households similarly, whereas no relationship is found in regards to ones’ subjective
perception of their household’s economic situation.
JEL classification: O12, F22, R23, J24, I31,
Keywords: Refugees, Host communities, Labor market, Assets, Rwanda

3
Since [the refugees] are our neighbors, we work hand in hand in
businesses or agricultural activities to see how we can develop.
- Local respondent nearby Kigeme refugee camp
1. Introduction
Forced displacement has emerged as one of the most pressing humanitarian and development
issues of our day. Not only are there now more displaced individuals around the world than any
time since World War II (UNHCR, 2017), but the length of time in displacement for a great
many is on the rise (Milner & Loescher, 2011; Crawford et al., 2015; IDMC, 2016; Martin,
2016). And while the so-called ‘migration crisis’ in Europe has helped highlight the issue across
popular media, it is important to keep in mind that the burden of displacement disproportionately
falls on some of the poorest countries neighboring those origin areas in conflict. The vast
majority of refugees for example, 89 percent, reside in other developing nations, whereas 34
percent are located in fragile states (Devictor, 2016). It is not just the immediate humanitarian
concerns that need to be in focus then, but also fundamental medium- to long-term impacts of
displacement that should be considered within a broader development-oriented agenda. In this
regard a more evidence-based discussion around displacement is essential in order to inform
policies that aim to minimize potentially adverse effects of displacement, and leverage potential
opportunities.
Despite clear relevance and greater attention given by the international community as of late,
there has been relatively limited academic research on the impact of refugees on host
populations, especially in low-income countries. And even though many recognize that the
sudden influx of refugees may bring both costs and benefits to host communities, the channels
through which refugee populations influence local economies and how different sub-groups
within the host community are affected is still far from clear. Indeed, one of the seminal writings
on the topic is that of Chambers (1986), who argues that the presence of a refugee camp can have
mixed consequences for the host community depending on local conditions and differing
characteristics of individuals and households.
Using this conjecture as a jumping off point, this article examines the influence of the Congolese
refugee population on host communities in Rwanda, with a focus on labor market activity and
economic welfare. Our analysis takes advantage of newly collected survey data from three
refugee camps and their surrounding areas to compare individuals and households within
communities at various distances from, and therefore exposure to, the refugee population.
Alternatively, we also make use of various rounds of census data in order to validate some of the
main findings derived from the survey data.
Our work builds on and contributes to a growing literature interested in the economic impacts of
forced migration. Despite advances in recent years, most scholarly insight in this area is still

4
predominately of the qualitative or descriptive nature, or focusing on only a small number of
geographical areas (e.g. western Tanzania). Only in the last few years have more quantitatively-
oriented studies begun to emerge looking at a variety of contexts (see, Ruiz and Vargas-Silva,
2013, for a detailed review). One of the principle reasons for the limited number of studies using
quantitative methods is the lack of reliable data in many of those areas experiencing an inflow of
refugees. Similarly, methodological difficulties in establishing a proper counterfactual as well
the exogeneity of the so-called ‘refugee shock’ complicates claims of causality. In this regard,
the data used here which was collected with the support of the livelihoods team at UNHCR is a
step in the right direction, allowing for a more extensive look at the socio-economic dynamics of
displacement. Moreover, given the alarming trends related to displacement as of late, the
findings here should be of interest to a range of relevant stakeholders not only in Rwanda, but
also in other countries hosting considerable refugee populations.
A few key conclusions can be drawn from our analysis. First, residing within 10 km of a refugee
camp makes it more likely on average that an individual is engaged in wage employment in
comparison to farming or livestock production. We interpret this as indication of an overall
adjustment taking place within the local labor market away from subsistence farming activities
due to the presence of the refugee population. In addition, there is evidence that females living
nearby a camp have a higher occurrence of self-employment in business both as a primary and
secondary activity, highlighting a gender-specific dynamic. Likewise, living in close proximity
to a camp is associated with greater household asset ownership on average, benefiting both male-
and female-headed households similarly. On the other hand, no relationship is found in regards
to ones’ subjective perception of their household’s economic situation.
The rest of the article is organized as follows. We first provide a review of the literature
concerning the economic impacts of refugees on host communities in low-income country
contexts. Next, we highlight relevant background information pertaining to Congolese refugees
in Rwanda in order to anchor the analysis within the local context. We then describe the data
along with the empirical approach, before reporting results. We briefly summarize the main
findings in the conclusion, and discuss their policy implications.
2. Literature Review
A review of the broader literature demonstrates how refugee populations may have a variety of
economic consequences for host communities. Chambers’ (1986) oft-cited paper helps frame a
more nuanced discussion regarding unequal effects of the presence of refugees and refugee
programs for surplus farmers, subsistence farmers and laborers with negligible or no land. Since
then, most empirical work on the subject has made an attempt to extend this framework in order
to dig deeper into some of the main economic outcomes of interest including local economic
activity, commodity price changes, labor market effects and general welfare. This review focuses
on each of these themes separately.
5
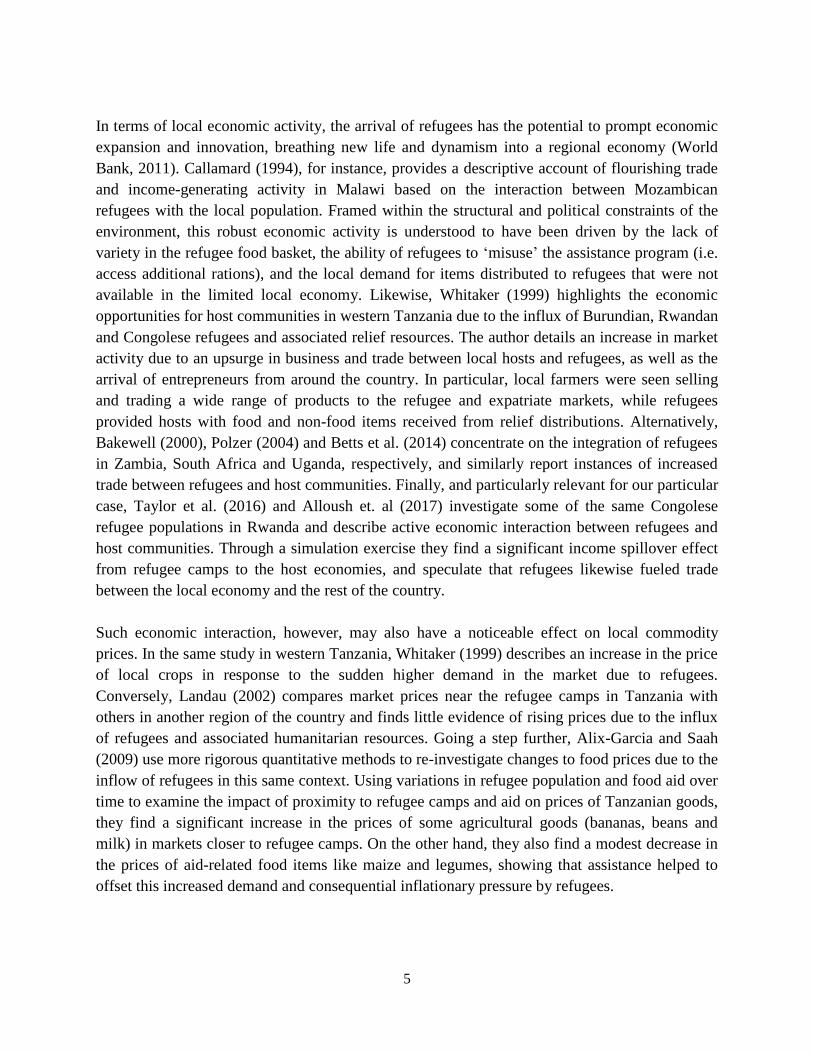
In terms of local economic activity, the arrival of refugees has the potential to prompt economic
expansion and innovation, breathing new life and dynamism into a regional economy (World
Bank, 2011). Callamard (1994), for instance, provides a descriptive account of flourishing trade
and income-generating activity in Malawi based on the interaction between Mozambican
refugees with the local population. Framed within the structural and political constraints of the
environment, this robust economic activity is understood to have been driven by the lack of
variety in the refugee food basket, the ability of refugees to ‘misuse’ the assistance program (i.e.
access additional rations), and the local demand for items distributed to refugees that were not
available in the limited local economy. Likewise, Whitaker (1999) highlights the economic
opportunities for host communities in western Tanzania due to the influx of Burundian, Rwandan
and Congolese refugees and associated relief resources. The author details an increase in market
activity due to an upsurge in business and trade between local hosts and refugees, as well as the
arrival of entrepreneurs from around the country. In particular, local farmers were seen selling
and trading a wide range of products to the refugee and expatriate markets, while refugees
provided hosts with food and non-food items received from relief distributions. Alternatively,
Bakewell (2000), Polzer (2004) and Betts et al. (2014) concentrate on the integration of refugees
in Zambia, South Africa and Uganda, respectively, and similarly report instances of increased
trade between refugees and host communities. Finally, and particularly relevant for our particular
case, Taylor et al. (2016) and Alloush et. al (2017) investigate some of the same Congolese
refugee populations in Rwanda and describe active economic interaction between refugees and
host communities. Through a simulation exercise they find a significant income spillover effect
from refugee camps to the host economies, and speculate that refugees likewise fueled trade
between the local economy and the rest of the country.
Such economic interaction, however, may also have a noticeable effect on local commodity
prices. In the same study in western Tanzania, Whitaker (1999) describes an increase in the price
of local crops in response to the sudden higher demand in the market due to refugees.
Conversely, Landau (2002) compares market prices near the refugee camps in Tanzania with
others in another region of the country and finds little evidence of rising prices due to the influx
of refugees and associated humanitarian resources. Going a step further, Alix-Garcia and Saah
(2009) use more rigorous quantitative methods to re-investigate changes to food prices due to the
inflow of refugees in this same context. Using variations in refugee population and food aid over
time to examine the impact of proximity to refugee camps and aid on prices of Tanzanian goods,
they find a significant increase in the prices of some agricultural goods (bananas, beans and
milk) in markets closer to refugee camps. On the other hand, they also find a modest decrease in
the prices of aid-related food items like maize and legumes, showing that assistance helped to
offset this increased demand and consequential inflationary pressure by refugees.

6
Similar to the impact on local prices, the presence of refugees is likely to have consequences for
the labor market. Again in the case of western Tanzania, Whitaker (1999) highlights that fact that
refugees often represent a source of cheap labor for local agricultural producers, allowing for
increased cultivation and production. More rigorously, Maystadt and Verwimp (2014) take a
quantitative approach in the same setting, using a measure of refugee presence based on both
proximity to and size of the refugee camp to provide a better source of local variation. They find
evidence that local agricultural workers did face fiercer competition in the labor market due to
refugees, while self-employed agricultural producers (i.e. farmers) benefited from this supply of
cheap labor. In addition, skilled workers outside of the agricultural sector were able to benefit
from increased job opportunities in international organizations focused on refugee programs,
while those self-employed in business activities were worse off possibly as a result of increased
competition from outside entrepreneurs. Ruiz and Vargas-Silva (2016) find complementary
evidence to this effect, showing the refugee shock made it more likely that a native was engaged
in within-household agriculture activity as opposed to working outside the household as
employees, including as agricultural employees. This adjustment in labor market activity by
natives in the presence of refugees similarly showed up with respect to casual labor, where
competition with refugees is presumed high. Correspondingly, Tumen (2016) looks at the influx
of Syrian refugees in Turkey, finding a modest decline in natives’ informal employment and
slight increase in natives’ formal employment within the local economy, again indicating a local
labor market adjustment due to the refugee population.
A number of these same studies also investigate changes to general welfare. Alix-Garcia and
Saah (2009), for example, look at household assets as an indicator of wealth and find suggestive
evidence of a positive wealth effect of refugee camps on nearby rural household and negative
wealth effects on households in urban areas. They interpret this as evidence of a scenario where
producer households benefited from higher prices in agricultural goods, and then invested that
money in durable goods. Likewise, Maystadt and Verwimp (2014) show that refugees on
average had a positive impact on household consumption (per adult equivalent) even though this
effect is highly differentiated by occupation as indicated above. Similarly, Maystadt and
Duranton (2014) find that the refugee presence significantly increased real consumption, and
turn their attention towards the channels of transmission of such a persistent and positive welfare
effect. They find that the most important driver of this change was a sizable decrease in transport
costs following increased road building, which continued to benefit the local population even
after the refugees returned to their countries of origin. Additionally, Kreibaum (2015) studies the
impact of Congolese refugees in Uganda and shows increased monthly consumption due to the
refugee presence, although economically small. Despite this objective finding of improved well-
being, the author also finds a contradicting subjective result in that on average locals felt they are
worse off in areas with a higher level of refugees, and even more so when living close to
settlements.

7
Overall, the evidence is mixed with regard to the economic impacts of refugees on host
communities. While the presence of a refugee population may indeed result in increased
economic activity at the local level, it is also likely to result in important changes to the labor
market, prices for goods and services, and ultimately household welfare. Moreover, the
magnitude and direction of these impacts are highly sensitive to local conditions making it
difficult to generalize across contexts. With this in mind, we know turn to the particular case of
Congolese refugees residing in Rwanda.
3. Background
Rwanda has hosted refugees from the Democratic Republic of Congo (DRC) for decades. As of
the 1st of September 2016, UNHCR’s Rwanda operation supports nearly 75,000 Congolese
refugees (UNHCR, 2016). Nearly 90 percent of Congolese refugees in Rwanda reside in one of
five refugee camps that are spread throughout the country. Of these five camps Kiziba, Gihembe
and Nyabiheke camps host ‘old caseload’ refugees – individuals that entered the country during
the first or second Congo wars of the mid- to late-90s. In 2012 and 2014, respectively, Kigeme
and Mugombwa camps were established to accommodate an additional inflow of nearly 30,000
Congolese refugees that fled new outbreaks of violent conflict in Eastern DRC.
In close collaboration with UNHCR and other stakeholders including local and international
NGOs, the Rwandan government provides support to Congolese refugees within these five
designated camps. All camps, for example, are provided with basic healthcare, water and
sanitation. Moreover, refugee children either attend school in local communities or in the camps
themselves. To absorb the refugee children, local schools close to the camps have been provided
with additional classrooms, teaching materials and uniforms (UN, 2012). Officially, Rwanda
does not impose restrictions to Congolese refugees on their right to work, access to education, or
freedom of movement. In principle, refugees hosted in Rwanda therefore have the opportunity to
engage economically in their host communities and can consequently have an impact on local
economies. Moreover, these rights can affect the refugees’ level of integration into their host
communities and may subsequently affect their choice of livelihood activities.
In practice, however, the local integration of Congolese refugees into host communities has been
a persistent challenge. Rwanda is densely populated, and the overall high scarcity of agricultural
land as well as employment opportunities has resulted in the inability for most refugees to lead
sustainable, independent lives (Hovil, 2011). Moreover, the refugee camps are crowded and
suffer from lack of water and livelihood opportunities, while the rights to freedom of movement
and work are complicated by formal procedures and costs (Easton-Calabria & Lindsay, 2013). It
is no surprise than that many of the Congolese refugees residing in Rwanda are dependent on
humanitarian aid for everyday survival (Hovil, 2011). In sum, even though official policies
endorse increased interaction between refugee and local populations, how Congolese refugees
influence local economies remains an open question.
8
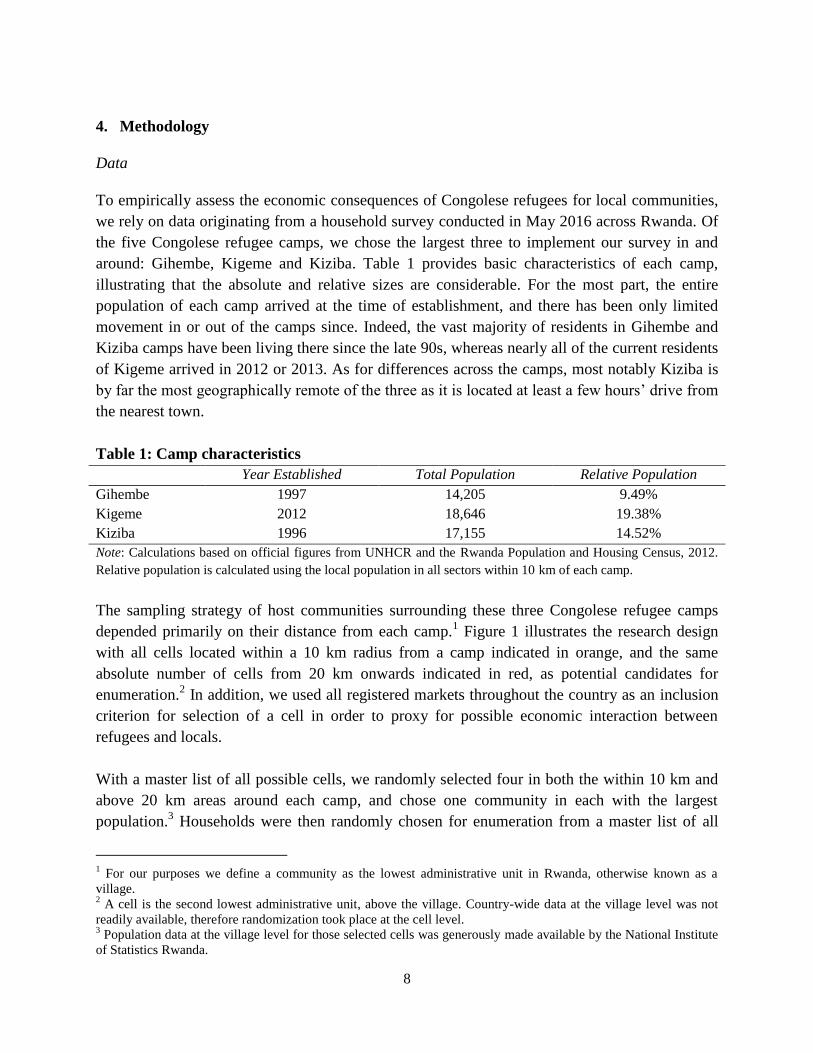
4. Methodology
Data
To empirically assess the economic consequences of Congolese refugees for local communities,
we rely on data originating from a household survey conducted in May 2016 across Rwanda. Of
the five Congolese refugee camps, we chose the largest three to implement our survey in and
around: Gihembe, Kigeme and Kiziba. Table 1 provides basic characteristics of each camp,
illustrating that the absolute and relative sizes are considerable. For the most part, the entire
population of each camp arrived at the time of establishment, and there has been only limited
movement in or out of the camps since. Indeed, the vast majority of residents in Gihembe and
Kiziba camps have been living there since the late 90s, whereas nearly all of the current residents
of Kigeme arrived in 2012 or 2013. As for differences across the camps, most notably Kiziba is
by far the most geographically remote of the three as it is located at least a few hours’ drive from
the nearest town.
Table 1: Camp characteristics
Year Established Total Population Relative Population
Gihembe 1997 14,205 9.49%
Kigeme 2012 18,646 19.38%
Kiziba 1996 17,155 14.52%
Note: Calculations based on official figures from UNHCR and the Rwanda Population and Housing Census, 2012.
Relative population is calculated using the local population in all sectors within 10 km of each camp.
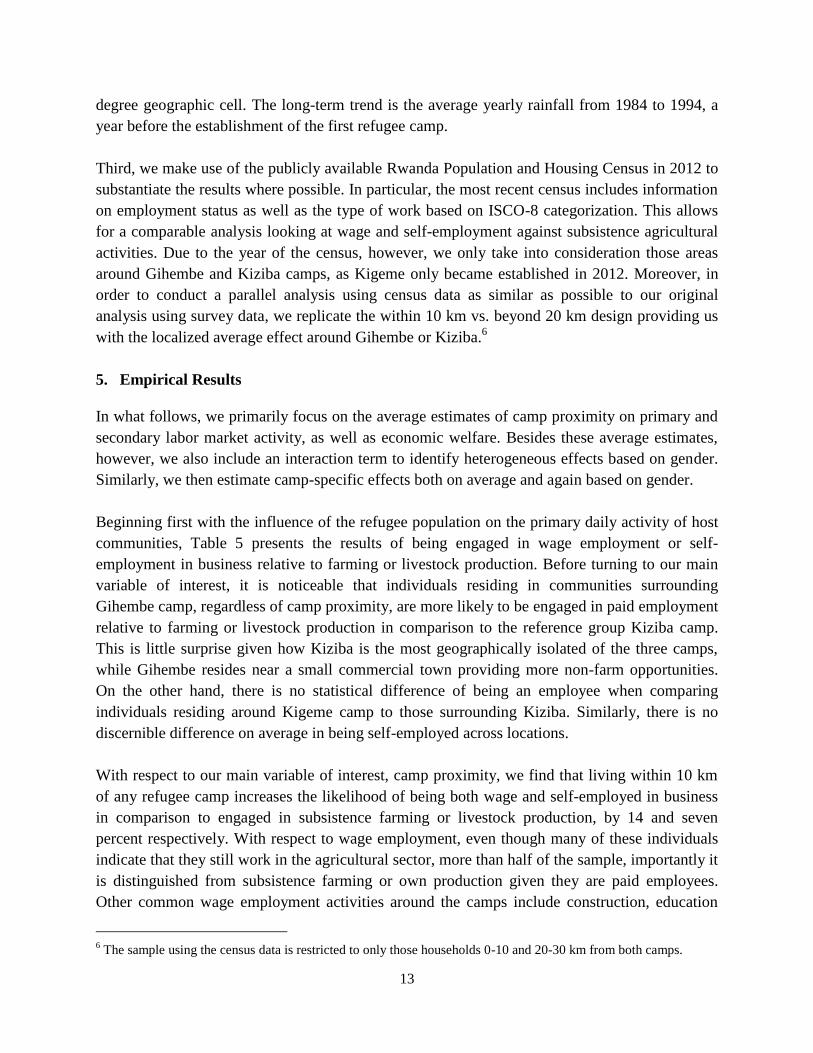
The sampling strategy of host communities surrounding these three Congolese refugee camps
depended primarily on their distance from each camp.1 Figure 1 illustrates the research design
with all cells located within a 10 km radius from a camp indicated in orange, and the same
absolute number of cells from 20 km onwards indicated in red, as potential candidates for
enumeration.2 In addition, we used all registered markets throughout the country as an inclusion
criterion for selection of a cell in order to proxy for possible economic interaction between
refugees and locals.
With a master list of all possible cells, we randomly selected four in both the within 10 km and
above 20 km areas around each camp, and chose one community in each with the largest
population.3 Households were then randomly chosen for enumeration from a master list of all
1 For our purposes we define a community as the lowest administrative unit in Rwanda, otherwise known as a
village. 2 A cell is the second lowest administrative unit, above the village. Country-wide data at the village level was not
readily available, therefore randomization took place at the cell level. 3 Population data at the village level for those selected cells was generously made available by the National Institute
of Statistics Rwanda.

9
households located in the selected community, created in discussion with a community
representative. Overall, our design results in a representative sample for the enumeration areas in
question, namely within 10 km and above 20 km from Gihembe, Kigeme and Kiziba camps.
Figure 1: Sampling strategy at the cell level
Note: Own generation based on publicly available administrative GIS data. Yellow cells indicate the location of each
refugee camp. Orange cells are those within 10 km of each camp. Red cells are those above 20 km of each camp.
In particular cases, it is important to note that randomization veered slightly from this sampling
strategy due to an added priority of re-tracking households in certain communities from an
earlier conducted survey.4 In those cases, we randomly chose four cells from the sampling list of
4 We became aware of a similar research project by a team of researchers from the University of California at Davis
(UC-Davis) following an initial site visit. Given the similarities between sampling designs, and the potential value-
added of re-surveying some of their original households, we decided to adjust course slightly from our original plan.
For more information on the UC-Davis project, see Taylor et al. (2016).
Gihembe
Kiziba
Kigeme

10
the prior survey, and selected all communities in each until reaching the targeted number of
households. Because the original sampling of households from that prior survey was also
randomly assigned, this does not affect the representativeness of our own sample. Table 1 shows
that after censoring for those observations with missing values on key variables, the final dataset
is comprised of 1,632 working age individuals (aged 16 to 65) active and employed in the labor
market, within 913 households. By design, the share of individuals and households in host
communities outside each of the three camps is comparable.
Table 2: Sample in host communities, by distance to the nearest camp
Gihembe Kigeme Kiziba Total
Individual HH Individual HH Individual HH Individual HH
< 10 km 261 149 298 155 261 153 820 457
> 20 km 253 142 282 157 277 157 812 457
Total 514 291 580 312 538 310 1,632 913
Empirical Approach
Considering our objective to provide evidence for the influence of refugees on host communities,
our empirical approach hinges on the comparison between households that are more vs. less
exposed to the refugee population. The sample was designed in such a way as to provide a
counterfactual scenario with exposure based on the distance from each camp, and more precisely
whether the household is located in a community within 10 km of a refugee camp compared to
beyond 20 km. This 10 km vs. 20 km setup was decided following pre-survey site visits and
extensive discussions with stakeholders on the ground in order to gauge a high vs. low potential
for interaction between refugees and host communities, and therefore a localized effect. As
Alloush et al. (2017: 334) put it in their own study focusing exclusively on the 10 km area, “A
10-kilometer radius captures the main markets in which refugees transact. Given poor
transportation infrastructure, refugees rarely engage directly with markets outside this radius.”
To assess the economic consequences, our analysis uses measures of labor market activity and
economic welfare illustrated in Table 3. Concerning primary daily activity in the 12 months prior
to enumeration, we see the importance of the agricultural sector as most respondents, 74 percent
overall, are engaged in subsistence farming or livestock production which corresponds to the
official 70 percent estimated in 2011 (World Bank, 2016). Looking across communities based on
distance to the nearest refugee camp, we find that a working age individual located within 10 km
of a camp is nearly twice as likely to be in wage employment in comparison to someone located
beyond 20 km. A similar trend is found for self-employment in business, albeit at a lower scale,
while those persons outside the 20 km radius are 12 percentage points more likely to be involved
in farming or livestock production.

11
Beyond primary daily activity, respondents also indicated whether they were engaged in multiple
occupations allowing us to investigate secondary activities as well. Of those individuals involved
in farming or livestock production as a primary activity, around 40 percent said they were also
involved in wage employment and 11 percent in self-employment. Across locations, there is no
statistically significant mean difference in terms of wage employment whereas this figure is
around five percentage points higher for self-employment in business within 10 km.
Table 3: Descriptive statistics of outcomes
< 10 km > 20 km
Mean SD Mean SD Total
Primary daily activity:
Wage employment*** 0.20 0.40 0.12 0.33 1,632
Self-employment (business)* 0.11 0.32 0.08 0.27 1,632
Farming/ livestock*** 0.68 0.47 0.80 0.40 1,632
Secondary activity of farming/livestock:
Wage employment 0.41 0.49 0.40 0.49 1,205
Self-employment** 0.13 0.34 0.08 0.28 1,205
Asset ownership index (leisure items)*** 0.03 0.98 -0.31 0.78 913
Subjective economic situation (1-5)** 2.19 0.99 2.02 0.88 913
Note: *** indicates statistically significant mean difference across groups at the one percent level; ** at the five
percent level. The 5-point likert scale for subjective economic situation ranges from 1 (very difficult) to 5 (very
comfortable).
With respect to economic welfare, we rely on an objective and subjective measure at the
household level to indicate general well-being. For the former, we create an asset ownership
index using multiple correspondence analysis to provide a single measure of ownership across a
wide range of leisure items.5 Using the first two dimensions, this index captures more than 80
percent of the overall variation explained in the binary data of asset ownership across all items.
For the latter, we look at a categorical subjective measure of the household’s economic situation
based on an ordered list of five responses: very difficult (1), difficult (2), coping (3), comfortable
(4) and very comfortable (5). Table 3 shows the mean differences along these outcomes across
communities based on proximity to the nearest refugee camp. Households nearby a refugee camp
have a statistically significant higher asset ownership score based on our index, and perceive
their economic situation more positively based on our five-point likert scale despite the average
being difficult for both groups.
Moving beyond descriptive differences based on our 10 km vs. 20 km setup, in the next section
we present the empirical results controlling for a range of individual-, household- and
community-level covariates shown in Table 4. To account for differences in local economic
conditions, we control for distance to the nearest market as well as to the nearest city. Where our
unit of observation is at the household level, namely for those outcomes related to economic
welfare, we collapse individual-level covariates to the level of the household head. And although
5 See Table A.1 in the Appendix for a complete list of leisure items.

12
we find a statistically significant mean difference based on distance to the nearest camp for a few
of these covariates, for example having at least lower secondary education, Table A.2 in the
appendix shows that many of these same covariates are either not statistically significant or
reversed, for instance household size, when using data from the Rwanda Population and Housing
Census in 1991. Given the census data was collected prior to the establishment of the camps, this
helps indicate that any difference found are not systematic and may be to the presence of the
camp itself.
Table 4: Descriptive statistics of covariates (for working age individuals)
< 10 km > 20 km
Mean SD Mean SD Total
Female 0.56 0.50 0.56 0.50 1,632
Age 37.27 12.53 37.58 13.13 1,632
Married** 0.70 0.46 0.66 0.48 1,632
HH head 0.44 0.50 0.45 0.50 1,632
Lower secondary education*** 0.18 0.38 0.12 0.32 1,632
Household size*** 5.54 2.08 5.15 2.26 1,632
Share of children (per adult) 0.97 0.76 1.00 0.78 1,632
Market distance (in minutes)*** 65.39 40.53 77.36 60.70 1,632
City distance (in km)*** 30.07 7.72 21.83 7.65 1,632
Note: *** indicates statistically significant mean difference across groups at the one percent level; ** at the five
percent level. City distance indicates the distance to nearest urban area including the capital, Kigali, as well as all
secondary cities.
Recognizing the potential for selection bias in our estimates we also report a variety of
robustness checks. First, it is possible that individuals voluntarily moved into the areas around
refugee camps after being established in expectation of economic opportunities. To account for
this potential positive selection, we restrict our sample to only those individuals who either were
born in the community or moved there prior to the nearest camp’s year of establishment. While it
is possible that individual was not born in the community but still within the 10 km area,
meaning they were not selected into the area, we unfortunately do not have such detailed
information and are forced to make an overly cautious adjustment by censoring everyone born
outside of the community. This results in censoring the sample by around 300 individuals and
200 households, depending on the unit of analysis.
Second, the decision to establish the camps where they are located may not have been random.
The predominant explanation from stakeholder interviews was that camps were placed where
they are simply due to land availability. Given the limited nature of land in such a densely
populated country, we assume land quality played a significant role in the decision. Following
this line of thought, we take an instrumental variable approach using a measure of long-term
precipitation trend as an exogenous factor to residing nearby a refugee camp. The precipitation
measure originates from the National Oceanic and Atmospheric Administration (NOAA)
database of daily rainfall estimates, which provides high resolution information down to the 0.1
13
degree geographic cell. The long-term trend is the average yearly rainfall from 1984 to 1994, a
year before the establishment of the first refugee camp.
Third, we make use of the publicly available Rwanda Population and Housing Census in 2012 to
substantiate the results where possible. In particular, the most recent census includes information
on employment status as well as the type of work based on ISCO-8 categorization. This allows
for a comparable analysis looking at wage and self-employment against subsistence agricultural
activities. Due to the year of the census, however, we only take into consideration those areas
around Gihembe and Kiziba camps, as Kigeme only became established in 2012. Moreover, in
order to conduct a parallel analysis using census data as similar as possible to our original
analysis using survey data, we replicate the within 10 km vs. beyond 20 km design providing us
with the localized average effect around Gihembe or Kiziba.6
5. Empirical Results
In what follows, we primarily focus on the average estimates of camp proximity on primary and
secondary labor market activity, as well as economic welfare. Besides these average estimates,
however, we also include an interaction term to identify heterogeneous effects based on gender.
Similarly, we then estimate camp-specific effects both on average and again based on gender.
Beginning first with the influence of the refugee population on the primary daily activity of host
communities, Table 5 presents the results of being engaged in wage employment or self-
employment in business relative to farming or livestock production. Before turning to our main
variable of interest, it is noticeable that individuals residing in communities surrounding
Gihembe camp, regardless of camp proximity, are more likely to be engaged in paid employment
relative to farming or livestock production in comparison to the reference group Kiziba camp.
This is little surprise given how Kiziba is the most geographically isolated of the three camps,
while Gihembe resides near a small commercial town providing more non-farm opportunities.
On the other hand, there is no statistical difference of being an employee when comparing
individuals residing around Kigeme camp to those surrounding Kiziba. Similarly, there is no
discernible difference on average in being self-employed across locations.
With respect to our main variable of interest, camp proximity, we find that living within 10 km
of any refugee camp increases the likelihood of being both wage and self-employed in business
in comparison to engaged in subsistence farming or livestock production, by 14 and seven
percent respectively. With respect to wage employment, even though many of these individuals
indicate that they still work in the agricultural sector, more than half of the sample, importantly it
is distinguished from subsistence farming or own production given they are paid employees.
Other common wage employment activities around the camps include construction, education
6 The sample using the census data is restricted to only those households 0-10 and 20-30 km from both camps.

14
and administrative services, whereas most self-employment activities are related to small-scale
trading and selling. Using an interaction term to look across camp proximity and gender, we see
this association for wage employment is positive and significant for both females and males
within 10 km of a camp relative to their same gender counterparts further away, whereas for self-
employment the result holds only for females.
Table 5: Primary daily activity
Base: subsistence farming/livestock Wage employment Self-employment
Female -0.24*** -0.21*** -0.17*** -0.18***
(0.04) (0.05) (0.02) (0.02)
Age -0.00 -0.00 -0.00 -0.00
(0.00) (0.00) (0.00) (0.00)
Married -0.11*** -0.11*** -0.08*** -0.08***
(0.03) (0.03) (0.03) (0.03)
HH head -0.11*** -0.12*** -0.09*** -0.09***
(0.04) (0.04) (0.02) (0.02)
Lower secondary education 0.17*** 0.17*** 0.11*** 0.11***
(0.04) (0.04) (0.04) (0.04)
Household size 0.01 0.01 -0.00 -0.00
(0.01) (0.01) (0.00) (0.00)
Share of children (per adult) -0.01 -0.01 -0.00 -0.00
(0.02) (0.02) (0.01) (0.01)
Market distance 0.00 0.00 -0.00 -0.00
(0.00) (0.00) (0.00) (0.00)
City distance -0.00** -0.00** -0.00 -0.00
(0.00) (0.00) (0.00) (0.00)
Community population 0.09** 0.09** 0.04 0.04
(0.04) (0.04) (0.03) (0.03)
Gihembe 0.15*** 0.15*** 0.02 0.02
(0.03) (0.03) (0.03) (0.03)
Kigeme -0.08** -0.07** -0.03 -0.03
(0.03) (0.03) (0.04) (0.04)
Camp proximity (<10km) 0.14***
0.07**
(0.03)
(0.03)
x Female
0.12***
0.08**
(0.04)
(0.03)
x Male
0.17***
0.05
(0.04) (0.03)
R-squared 0.20 0.20 0.10 0.10
Observations 1474 1474 1363 1363
Note: Estimates are based on a linear probability model, but robust to maximum likelihood estimation. ***p<0.01,
**p<.05, *p<0.10. Kiziba is the reference camp. Standard errors in parentheses are robust and clustered at the
community level.
Restricting ourselves to only those individuals who are engaged in subsistence farming or
livestock production as a primary daily activity, Table 6 provides evidence that a shift in
secondary activity is also occurring nearby the refugee camps and this result is driven primarily
by women. Specifically, native women are nine percent more likely to be involved in self-
employment activities on the side of their primary agricultural activity, with most of this being
categorized as trading and selling. Again, this corresponds to the anecdotal small-scale activities
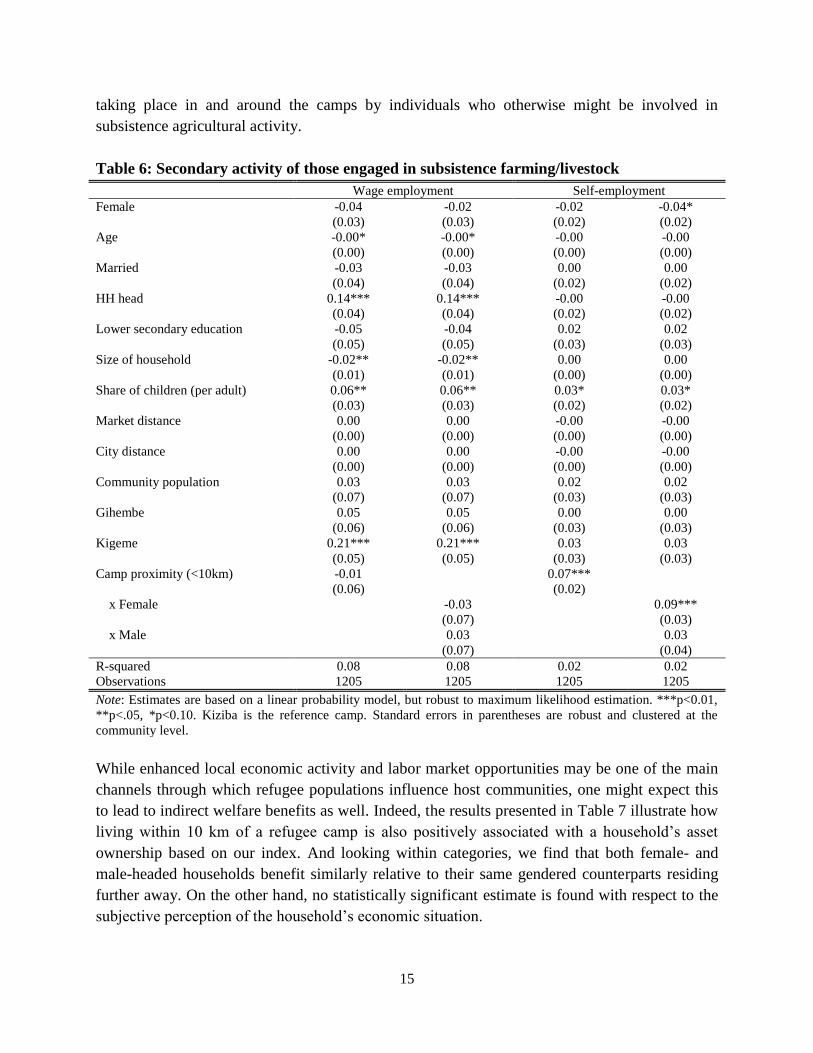
15
taking place in and around the camps by individuals who otherwise might be involved in
subsistence agricultural activity.
Table 6: Secondary activity of those engaged in subsistence farming/livestock
Wage employment Self-employment
Female -0.04 -0.02 -0.02 -0.04*
(0.03) (0.03) (0.02) (0.02)
Age -0.00* -0.00* -0.00 -0.00
(0.00) (0.00) (0.00) (0.00)
Married -0.03 -0.03 0.00 0.00
(0.04) (0.04) (0.02) (0.02)
HH head 0.14*** 0.14*** -0.00 -0.00
(0.04) (0.04) (0.02) (0.02)
Lower secondary education -0.05 -0.04 0.02 0.02
(0.05) (0.05) (0.03) (0.03)
Size of household -0.02** -0.02** 0.00 0.00
(0.01) (0.01) (0.00) (0.00)
Share of children (per adult) 0.06** 0.06** 0.03* 0.03*
(0.03) (0.03) (0.02) (0.02)
Market distance 0.00 0.00 -0.00 -0.00
(0.00) (0.00) (0.00) (0.00)
City distance 0.00 0.00 -0.00 -0.00
(0.00) (0.00) (0.00) (0.00)
Community population 0.03 0.03 0.02 0.02
(0.07) (0.07) (0.03) (0.03)
Gihembe 0.05 0.05 0.00 0.00
(0.06) (0.06) (0.03) (0.03)
Kigeme 0.21*** 0.21*** 0.03 0.03
(0.05) (0.05) (0.03) (0.03)
Camp proximity (<10km) -0.01
0.07***
(0.06)
(0.02)
x Female
-0.03
0.09***
(0.07)
(0.03)
x Male
0.03
0.03
(0.07) (0.04)
R-squared 0.08 0.08 0.02 0.02
Observations 1205 1205 1205 1205
Note: Estimates are based on a linear probability model, but robust to maximum likelihood estimation. ***p<0.01,
**p<.05, *p<0.10. Kiziba is the reference camp. Standard errors in parentheses are robust and clustered at the
community level.
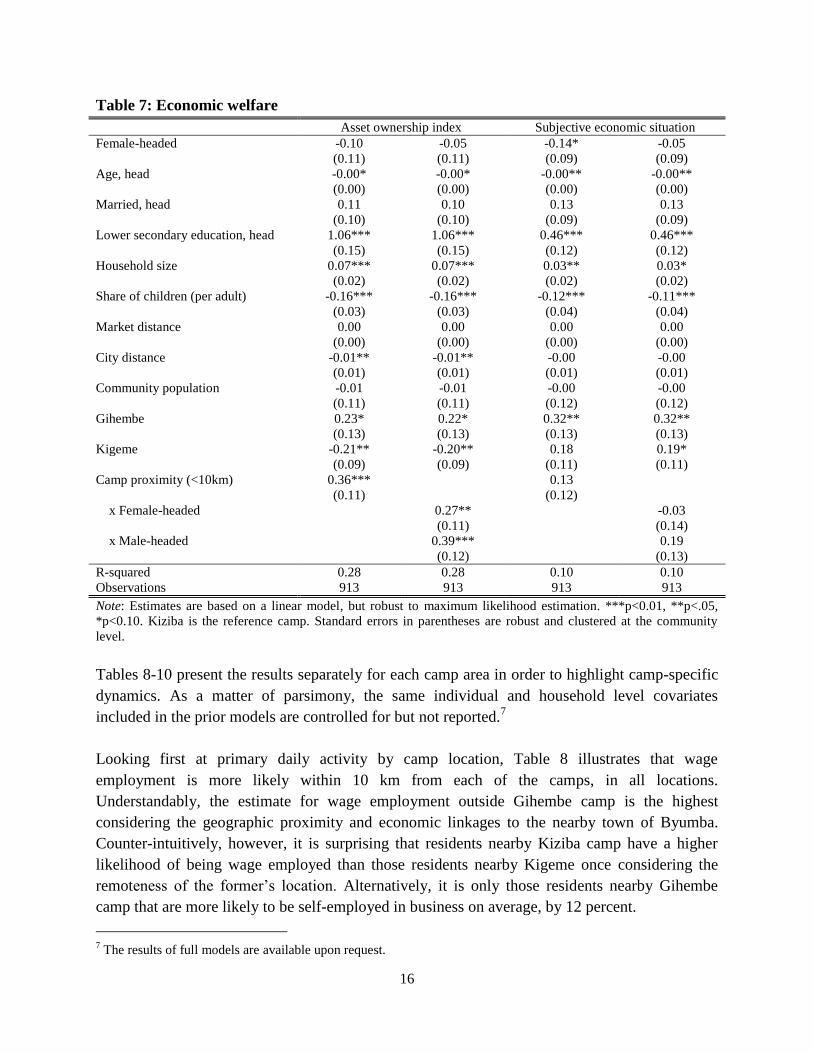
While enhanced local economic activity and labor market opportunities may be one of the main
channels through which refugee populations influence host communities, one might expect this
to lead to indirect welfare benefits as well. Indeed, the results presented in Table 7 illustrate how
living within 10 km of a refugee camp is also positively associated with a household’s asset
ownership based on our index. And looking within categories, we find that both female- and
male-headed households benefit similarly relative to their same gendered counterparts residing
further away. On the other hand, no statistically significant estimate is found with respect to the
subjective perception of the household’s economic situation.
16
Table 7: Economic welfare
Asset ownership index Subjective economic situation
Female-headed -0.10 -0.05 -0.14* -0.05
(0.11) (0.11) (0.09) (0.09)
Age, head -0.00* -0.00* -0.00** -0.00**
(0.00) (0.00) (0.00) (0.00)
Married, head 0.11 0.10 0.13 0.13
(0.10) (0.10) (0.09) (0.09)
Lower secondary education, head 1.06*** 1.06*** 0.46*** 0.46***
(0.15) (0.15) (0.12) (0.12)
Household size 0.07*** 0.07*** 0.03** 0.03*
(0.02) (0.02) (0.02) (0.02)
Share of children (per adult) -0.16*** -0.16*** -0.12*** -0.11***
(0.03) (0.03) (0.04) (0.04)
Market distance 0.00 0.00 0.00 0.00
(0.00) (0.00) (0.00) (0.00)
City distance -0.01** -0.01** -0.00 -0.00
(0.01) (0.01) (0.01) (0.01)
Community population -0.01 -0.01 -0.00 -0.00
(0.11) (0.11) (0.12) (0.12)
Gihembe 0.23* 0.22* 0.32** 0.32**
(0.13) (0.13) (0.13) (0.13)
Kigeme -0.21** -0.20** 0.18 0.19*
(0.09) (0.09) (0.11) (0.11)
Camp proximity (<10km) 0.36***
0.13
(0.11)
(0.12)
x Female-headed
0.27**
-0.03
(0.11)
(0.14)
x Male-headed
0.39***
0.19
(0.12) (0.13)
R-squared 0.28 0.28 0.10 0.10
Observations 913 913 913 913
Note: Estimates are based on a linear model, but robust to maximum likelihood estimation. ***p<0.01, **p<.05,
*p<0.10. Kiziba is the reference camp. Standard errors in parentheses are robust and clustered at the community
level.
Tables 8-10 present the results separately for each camp area in order to highlight camp-specific
dynamics. As a matter of parsimony, the same individual and household level covariates
included in the prior models are controlled for but not reported.7
Looking first at primary daily activity by camp location, Table 8 illustrates that wage
employment is more likely within 10 km from each of the camps, in all locations.
Understandably, the estimate for wage employment outside Gihembe camp is the highest
considering the geographic proximity and economic linkages to the nearby town of Byumba.
Counter-intuitively, however, it is surprising that residents nearby Kiziba camp have a higher
likelihood of being wage employed than those residents nearby Kigeme once considering the
remoteness of the former’s location. Alternatively, it is only those residents nearby Gihembe
camp that are more likely to be self-employed in business on average, by 12 percent.
7 The results of full models are available upon request.
17
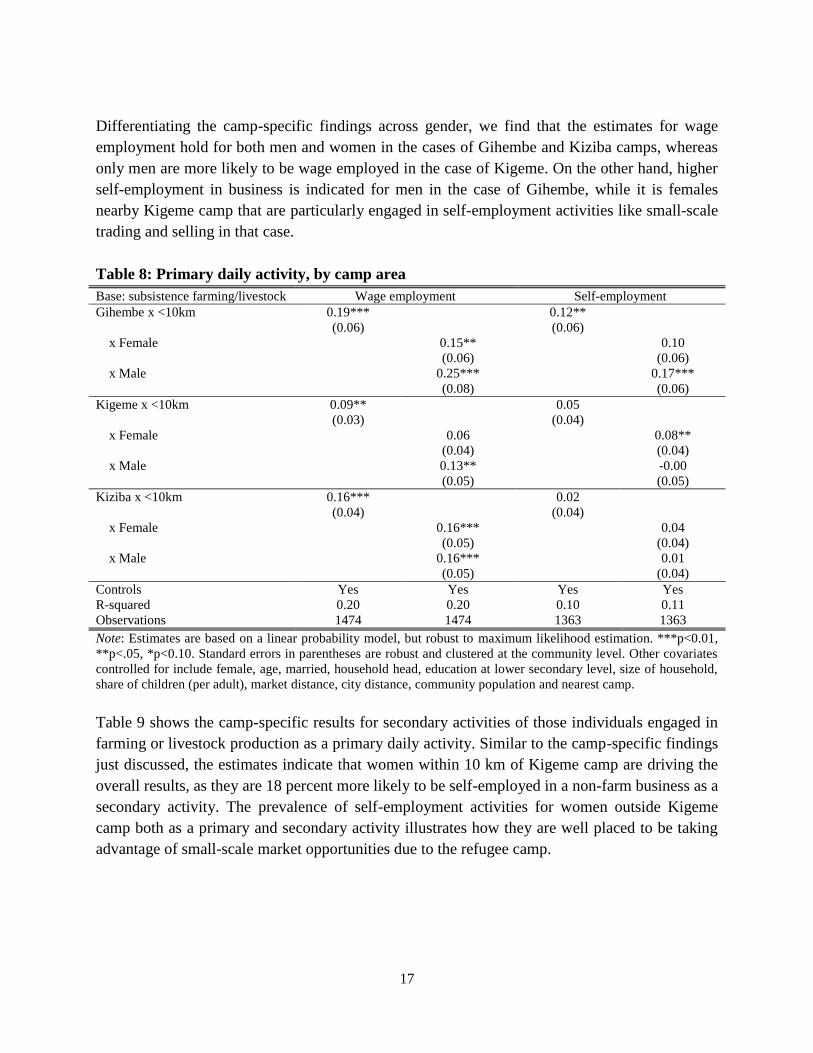
Differentiating the camp-specific findings across gender, we find that the estimates for wage
employment hold for both men and women in the cases of Gihembe and Kiziba camps, whereas
only men are more likely to be wage employed in the case of Kigeme. On the other hand, higher
self-employment in business is indicated for men in the case of Gihembe, while it is females
nearby Kigeme camp that are particularly engaged in self-employment activities like small-scale
trading and selling in that case.
Table 8: Primary daily activity, by camp area
Base: subsistence farming/livestock Wage employment Self-employment
Gihembe x <10km 0.19***
0.12**
(0.06)
(0.06)
x Female
0.15**
0.10
(0.06)
(0.06)
x Male
0.25***
0.17***
(0.08) (0.06)
Kigeme x <10km 0.09**
0.05
(0.03)
(0.04)
x Female
0.06
0.08**
(0.04)
(0.04)
x Male
0.13**
-0.00
(0.05) (0.05)
Kiziba x <10km 0.16***
0.02
(0.04)
(0.04)
x Female
0.16***
0.04
(0.05)
(0.04)
x Male
0.16***
0.01
(0.05) (0.04)
Controls Yes Yes Yes Yes
R-squared 0.20 0.20 0.10 0.11
Observations 1474 1474 1363 1363
Note: Estimates are based on a linear probability model, but robust to maximum likelihood estimation. ***p<0.01,
**p<.05, *p<0.10. Standard errors in parentheses are robust and clustered at the community level. Other covariates
controlled for include female, age, married, household head, education at lower secondary level, size of household,
share of children (per adult), market distance, city distance, community population and nearest camp.
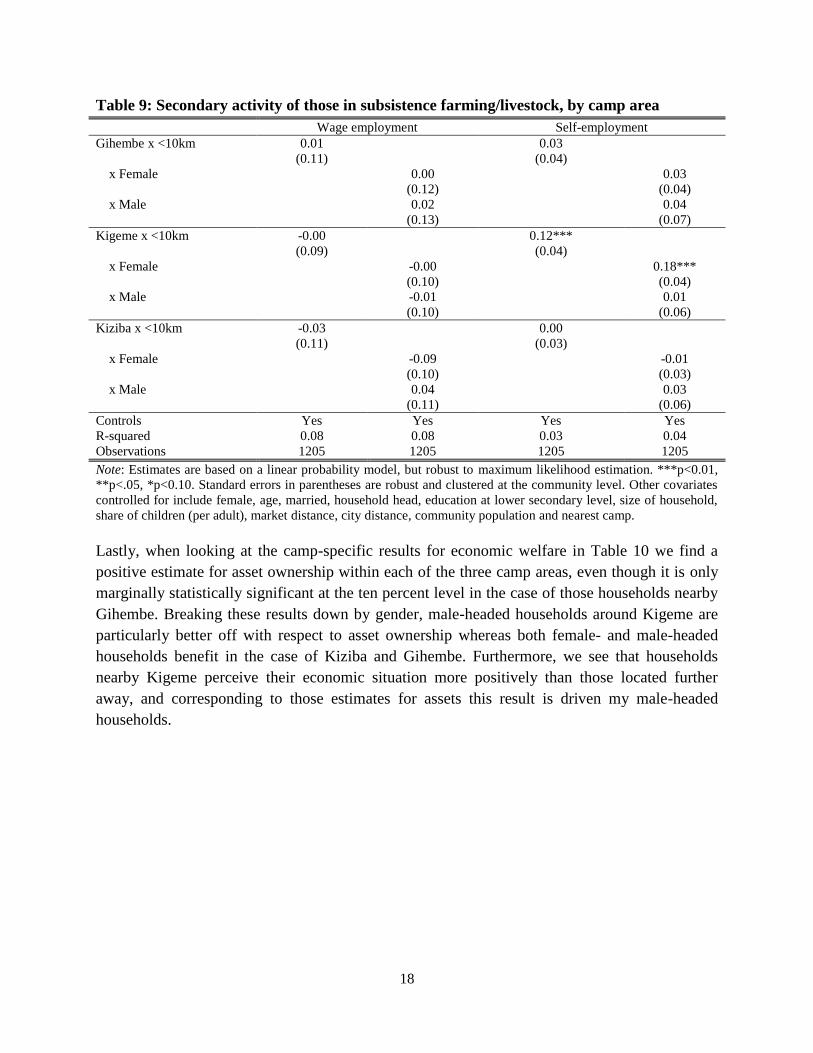
Table 9 shows the camp-specific results for secondary activities of those individuals engaged in
farming or livestock production as a primary daily activity. Similar to the camp-specific findings
just discussed, the estimates indicate that women within 10 km of Kigeme camp are driving the
overall results, as they are 18 percent more likely to be self-employed in a non-farm business as a
secondary activity. The prevalence of self-employment activities for women outside Kigeme
camp both as a primary and secondary activity illustrates how they are well placed to be taking
advantage of small-scale market opportunities due to the refugee camp.
18
Table 9: Secondary activity of those in subsistence farming/livestock, by camp area
Wage employment Self-employment
Gihembe x <10km 0.01
0.03
(0.11)
(0.04)
x Female
0.00
0.03
(0.12)
(0.04)
x Male
0.02
0.04
(0.13) (0.07)
Kigeme x <10km -0.00
0.12***
(0.09)
(0.04)
x Female
-0.00
0.18***
(0.10)
(0.04)
x Male
-0.01
0.01
(0.10) (0.06)
Kiziba x <10km -0.03
0.00
(0.11)
(0.03)
x Female
-0.09
-0.01
(0.10)
(0.03)
x Male
0.04
0.03
(0.11) (0.06)
Controls Yes Yes Yes Yes
R-squared 0.08 0.08 0.03 0.04
Observations 1205 1205 1205 1205
Note: Estimates are based on a linear probability model, but robust to maximum likelihood estimation. ***p<0.01,
**p<.05, *p<0.10. Standard errors in parentheses are robust and clustered at the community level. Other covariates
controlled for include female, age, married, household head, education at lower secondary level, size of household,
share of children (per adult), market distance, city distance, community population and nearest camp.
Lastly, when looking at the camp-specific results for economic welfare in Table 10 we find a
positive estimate for asset ownership within each of the three camp areas, even though it is only
marginally statistically significant at the ten percent level in the case of those households nearby
Gihembe. Breaking these results down by gender, male-headed households around Kigeme are
particularly better off with respect to asset ownership whereas both female- and male-headed
households benefit in the case of Kiziba and Gihembe. Furthermore, we see that households
nearby Kigeme perceive their economic situation more positively than those located further
away, and corresponding to those estimates for assets this result is driven my male-headed
households.

19
Table 10: Economic welfare, by camp area
Asset ownership index Subjective economic situation
Gihembe x <10km 0.39*
-0.24
(0.21)
(0.15)
x Female-headed
0.32*
-0.19
(0.18)
(0.16)
x Male-headed
0.44*
-0.26
(0.25) (0.18)
Kigeme x <10km 0.36***
0.45***
(0.10)
(0.12)
x Female-headed
0.17
0.14
(0.13)
(0.20)
x Male-headed
0.41***
0.54***
(0.12) (0.14)
Kiziba x <10km 0.29**
0.19
(0.13)
(0.11)
x Female-headed
0.28**
0.11
(0.11)
(0.12)
x Male-headed
0.29**
0.20
(0.14) (0.13)
Controls Yes Yes Yes Yes
R-squared 0.28 0.29 0.12 0.13
Observations 913 913 913 913
Note: Estimates are based on a linear model, but robust to maximum likelihood estimation. ***p<0.01, **p<.05,
*p<0.10. Standard errors in parentheses are robust and clustered at the community level. Other covariates controlled
for include female head, married head, size of household, share of children (per adult), market distance, city
distance, community population and nearest camp.
6. Robustness checks
To minimize potential selection bias in our estimates as described prior, we present here three
robustness checks. First, taking into account the possibility for residents within 10 km of a
refugee camp to have positively selected into their community since a camp was established,
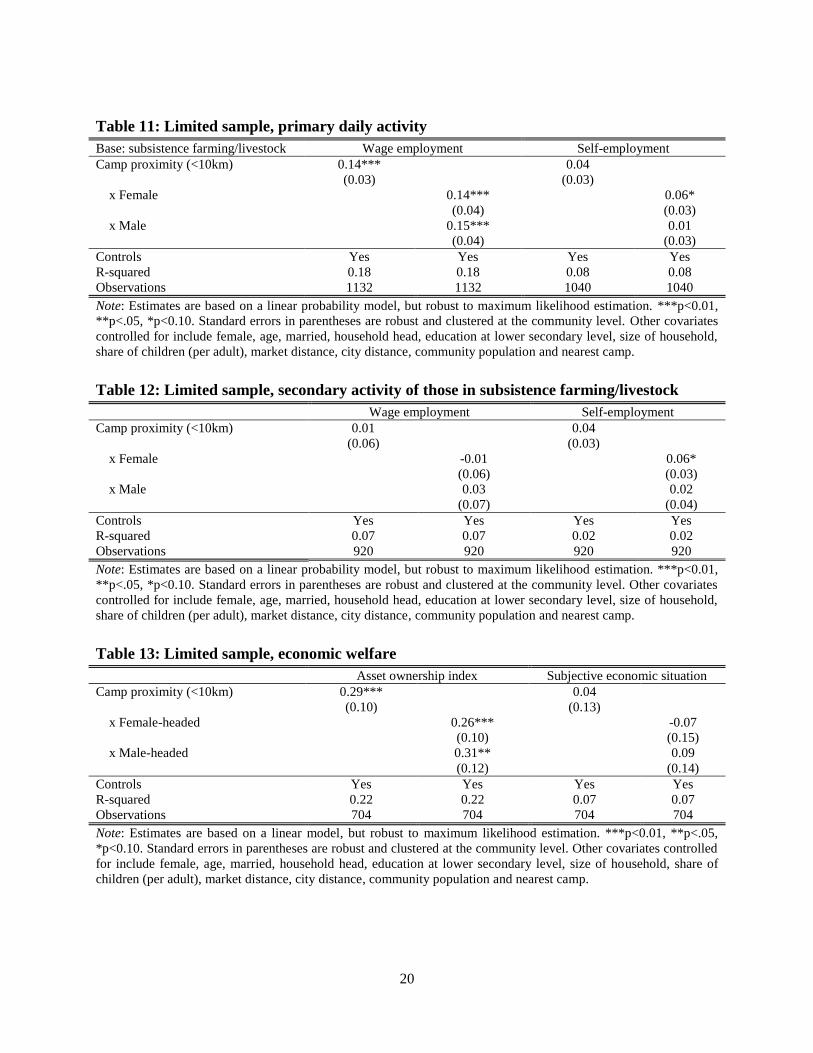
Tables 11-13 report the same models as prior on a limited sample. As discussed, this limited
sample is restricted to those individuals and households who either were born in the community
or moved prior to the nearest camp opening, and is an overly cautious restriction given the fact
that observations are censored even if they may have been born within the 10 km area but not in
the community.
In comparison to the original baseline findings, using the restricted sample leads to slight
changes to our estimates. Table 11 shows that living within 10 km of a refugee camp still results
in a 14 percent higher likelihood of being wage employed both for men and women relative to
their same gender counterparts residing beyond 20 km from a camp. Alternatively, those results
for self-employment lose statistical significance. Similarly, Table 12 illustrates that our original
results with respect to self-employment as a secondary activity do not hold in this limited
sample. On the other hand, Table 13 confirms that asset ownership is higher for those households
residing nearby a camp, again both for male- and female-headed households.
20
Table 11: Limited sample, primary daily activity
Base: subsistence farming/livestock Wage employment Self-employment
Camp proximity (<10km) 0.14***
0.04
(0.03)
(0.03)
x Female
0.14***
0.06*
(0.04)
(0.03)
x Male
0.15***
0.01
(0.04) (0.03)
Controls Yes Yes Yes Yes
R-squared 0.18 0.18 0.08 0.08
Observations 1132 1132 1040 1040
Note: Estimates are based on a linear probability model, but robust to maximum likelihood estimation. ***p<0.01,
**p<.05, *p<0.10. Standard errors in parentheses are robust and clustered at the community level. Other covariates
controlled for include female, age, married, household head, education at lower secondary level, size of household,
share of children (per adult), market distance, city distance, community population and nearest camp.
Table 12: Limited sample, secondary activity of those in subsistence farming/livestock
Wage employment Self-employment
Camp proximity (<10km) 0.01
0.04
(0.06)
(0.03)
x Female
-0.01
0.06*
(0.06)
(0.03)
x Male
0.03
0.02
(0.07) (0.04)
Controls Yes Yes Yes Yes
R-squared 0.07 0.07 0.02 0.02
Observations 920 920 920 920
Note: Estimates are based on a linear probability model, but robust to maximum likelihood estimation. ***p<0.01,
**p<.05, *p<0.10. Standard errors in parentheses are robust and clustered at the community level. Other covariates
controlled for include female, age, married, household head, education at lower secondary level, size of household,
share of children (per adult), market distance, city distance, community population and nearest camp.
Table 13: Limited sample, economic welfare
Asset ownership index Subjective economic situation
Camp proximity (<10km) 0.29***
0.04
(0.10)
(0.13)
x Female-headed
0.26***
-0.07
(0.10)
(0.15)
x Male-headed
0.31**
0.09
(0.12) (0.14)
Controls Yes Yes Yes Yes
R-squared 0.22 0.22 0.07 0.07
Observations 704 704 704 704
Note: Estimates are based on a linear model, but robust to maximum likelihood estimation. ***p<0.01, **p<.05,
*p<0.10. Standard errors in parentheses are robust and clustered at the community level. Other covariates controlled
for include female, age, married, household head, education at lower secondary level, size of household, share of
children (per adult), market distance, city distance, community population and nearest camp.
21
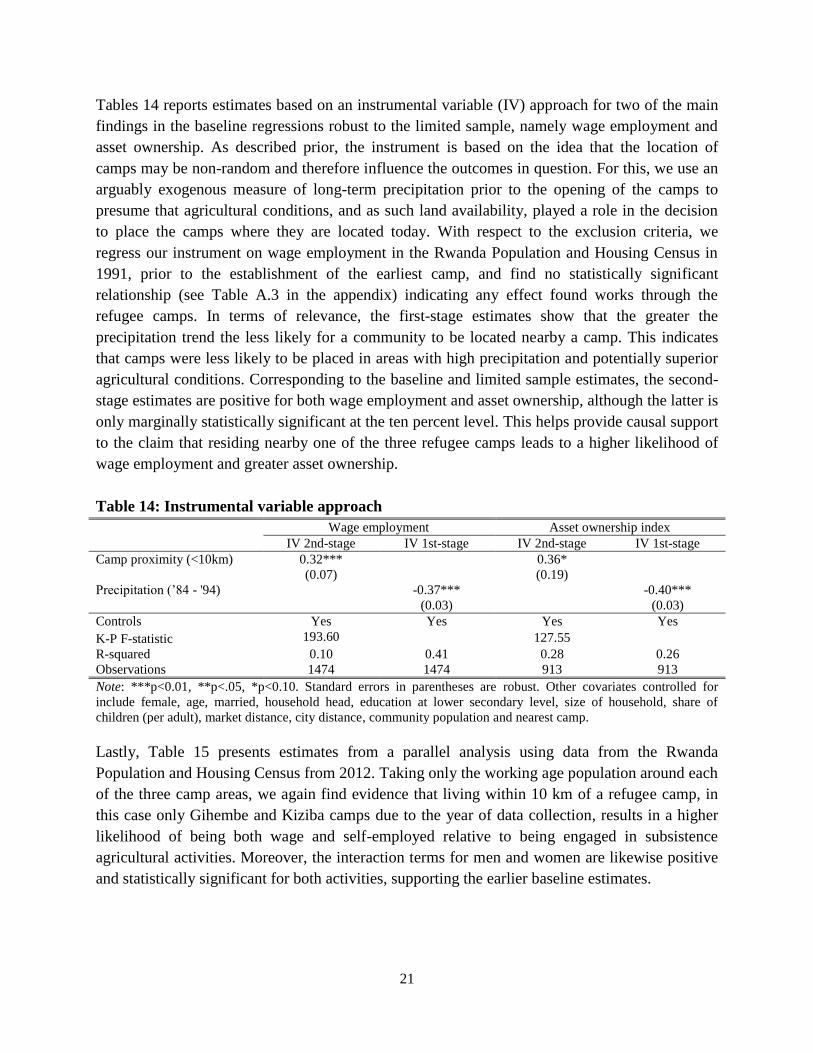
Tables 14 reports estimates based on an instrumental variable (IV) approach for two of the main
findings in the baseline regressions robust to the limited sample, namely wage employment and
asset ownership. As described prior, the instrument is based on the idea that the location of
camps may be non-random and therefore influence the outcomes in question. For this, we use an
arguably exogenous measure of long-term precipitation prior to the opening of the camps to
presume that agricultural conditions, and as such land availability, played a role in the decision
to place the camps where they are located today. With respect to the exclusion criteria, we
regress our instrument on wage employment in the Rwanda Population and Housing Census in
1991, prior to the establishment of the earliest camp, and find no statistically significant
relationship (see Table A.3 in the appendix) indicating any effect found works through the
refugee camps. In terms of relevance, the first-stage estimates show that the greater the
precipitation trend the less likely for a community to be located nearby a camp. This indicates
that camps were less likely to be placed in areas with high precipitation and potentially superior
agricultural conditions. Corresponding to the baseline and limited sample estimates, the second-
stage estimates are positive for both wage employment and asset ownership, although the latter is
only marginally statistically significant at the ten percent level. This helps provide causal support
to the claim that residing nearby one of the three refugee camps leads to a higher likelihood of
wage employment and greater asset ownership.
Table 14: Instrumental variable approach
Wage employment Asset ownership index
IV 2nd-stage IV 1st-stage IV 2nd-stage IV 1st-stage
Camp proximity (<10km) 0.32***
0.36*
(0.07)
(0.19)
Precipitation (’84 - '94)
-0.37*** -0.40***
(0.03) (0.03)
Controls Yes Yes Yes Yes
K-P F-statistic 193.60
127.55
R-squared 0.10 0.41 0.28 0.26
Observations 1474 1474 913 913
Note: ***p<0.01, **p<.05, *p<0.10. Standard errors in parentheses are robust. Other covariates controlled for
include female, age, married, household head, education at lower secondary level, size of household, share of
children (per adult), market distance, city distance, community population and nearest camp.
Lastly, Table 15 presents estimates from a parallel analysis using data from the Rwanda
Population and Housing Census from 2012. Taking only the working age population around each
of the three camp areas, we again find evidence that living within 10 km of a refugee camp, in
this case only Gihembe and Kiziba camps due to the year of data collection, results in a higher
likelihood of being both wage and self-employed relative to being engaged in subsistence
agricultural activities. Moreover, the interaction terms for men and women are likewise positive
and statistically significant for both activities, supporting the earlier baseline estimates.

22
Table 15: Employment activity, using ‘12 census data
Base: Subsistence agriculture Wage employment Self-employment
Camp proximity (<10km) 0.06***
0.04***
(0.01)
(0.00)
x Female
0.06***
0.04***
(0.01)
(0.01)
x Male
0.07***
0.04***
(0.01) (0.01)
R-squared 0.21 0.21 0.06 0.06
Observations 44565 44565 39542 39542
Note: Estimates are based on a linear probability model, but robust to maximum likelihood estimation. ***p<0.01,
**p<.05, *p<0.10. Standard errors in parentheses are robust. Other covariates controlled for include female, age,
married, household head, education at lower secondary level, size of household, share of children (per adult), city
distance and the administrative sector.
7. Conclusion
This study has investigated the economic influence of the Congolese refugee population on host
communities in Rwanda. The research design and empirical approach has allowed us to compare
individuals and households residing within 10 km of one of three refugee camps to those living
beyond 20 km from the same camps. Given the focus on local economic consequences, our
analysis has concentrated on outcomes related to labor market activity and economic welfare.
Considering the results from both the baseline analysis and robustness checks, a few key findings
stand out. First, residing within 10 km of a refugee camp makes it more likely on average that an
individual is engaged in wage employment in comparison to subsistence farming or livestock
production. We interpret this as indication of an overall adjustment taking place within the local
labor market, with natives shifting away from subsistence agricultural activities in the presence
of the refugee population potentially due to greater non-farm business opportunities and/or the
ability to hire low-skilled labor to perform subsistence agricultural work. In addition, there is
evidence that females living nearby a camp have a higher occurrence of self-employment in
business both as primary and secondary activities relative to females in communities further
away. This highlights an important gender-specific dynamic within this overall labor market
adjustment, which supports anecdotal evidence of women engaging in small-scale trading and
selling in and around camps.
In terms of economic welfare, living within 10 km of a refugee camp is found to also result in a
household having greater asset ownership in comparison to those living beyond 20 km. This
finding holds for both female- and male-headed households, comparing to their corresponding
counterparts residing further away from a camp. Alternatively, although we find no indication
that proximity to a camp influences subjective perceptions of the household’s economic
situation, we also find no evidence of a negative estimate along this measure suggesting that
locals do not believe themselves worse off because of the camps.
23
With respect to camp-specific findings, our results vary. Wage employment within range of each
camp is positive across all locations, however the estimates are greatest for Gihembe indicating a
more dynamic local economy. On the other hand, self-employment in business as a secondary
activity is seen in the case of women around Kigeme, reflecting a market opportunity for small-
scale selling and trading in this particular environment. While one reason for this may be due to
the arrival of the refugee population only a few years prior, in 2012, it may also reflect
potentially limited wage employment opportunities available around the camp. Additionally, a
more positive opinion of one’s economic situation is seen in the area nearby Kigeme which
could be due to more direct interaction with refugees in this case.
Taking a step back from the nuances of our results, on the whole it appears that the presence of
the refugee population has benefited host communities in Rwanda. Just as important though,
even in cases where we do not see a clear positive influence of living nearby a refugee camp, nor
do we find any clear negative consequence. And indeed, this non-negative result is in line with
the anecdotal evidence of constructive interaction between refugees and local communities.
Many of the observations from focus group discussions conducted during this research routinely
emphasize the engagement and trade, albeit small scale, between refugees and hosts.
Given the current levels of displacement around the world and the way this topic is often
portrayed in popular media, the findings here help paint an encouraging picture. Supported by a
national policy that puts emphasis on integration, refugees and local communities live together in
a manner that is for the most part beneficial to both, indicating what is possible when refugees
are not only welcomed by their hosts but provided the fundamental right to work. While there is
still ample room to improve the integration of refugees in local communities in Rwanda, other
countries in similar circumstances can readily look upon it as a generally successful example of
how refugees need not be a burden and contribute to their host societies.
24
References
Alloush, M., Taylor J. E., Gupta, A., Rojas Valdes, R. I. & Gonzalez-Estrada, E. (2017).
Economic Life in Refugee Camps. World Development, 91, 334-347.
Alix-Garcia, J. & Saah, D. (2009). The Effect of Refugee Inflows on Host Communities:
Evidence from Tanzania. World Bank Economic Review, 24(1), 148-170.
Baez, J. E. (2011). Civil wars beyond their borders: The human capital and health consequences
of hosting refugees. Journal of Development Economics, 96, 391-408.
Bakewell, O. (2000). Repatriation and Self-Settled Refugees in Zambia: Bringing Solutions to
the Wrong Problems. Journal of Refugee Studies, 13(4), 356-373.
Betts, A., Bloom, L., Kaplan, J. & Omata N. (2014). Refugee Economies: Rethinking Popular
Assumptions. Humanitarian Innovation Project, University of Oxford.
Callamard, A. (1994). Refugees and Local Hosts: A Study of the Trading Interactions between
Mozambican Refugees and Malawian Villagers in the District of Mwanza. Journal of
Refugee Studies, 7(1), 39-62.
Chambers, R. (1986). Hidden Losers? The Impact of Rural Refugees and Refugee Programs on
Poorer Hosts. International Migration Review, 20(2), 245-263.
Clark, C. R. (2008). Borders of everyday life: Congolese young people’s political identification
in contexts of conflict-induced displacement. HiCN Working Paper 38. Households in
Conflict Network, University of Sussex.
Crawford, N., Cosgrave, J., Haysom, S. & Walicki, N. (2015). Protracted displacement:
uncertain paths to self-reliance in exile. London: Overseas Development Institute.
Devictor, X. (2016). Forcibly Displaced: Toward a Development Approach Supporting
Refugees, the Internally Displaced, and Their Hosts. Washington DC: The World Bank.
Easton-Calabria, E. & Lindsay, A. (2013). Towards Durable Solutions for Protracted Congolese
Refugees in Rwanda. Oxford Monitor of Forced Migration, 3(2), 58-66.
Hovil, L. (2011). Shadows of Return: The Dilemmas of Congolese Refugees in Rwanda.
Citizenship and Displacement in the Great Lakes Region Working Paper 6. New York:
International Refugee Rights Initiative (IRRI).
IDMC (2016). Global Report on Internal Displacement. Geneva: IDMC.
Kreibaum, M. (2015). Their Suffering, Our Burden? How Congolese Refugees Affect the
Ugandan Population. World Development, 78, 262-287.
Landau, L. B. (2002). Challenge without transformation: refugees, aid and trade in western
Tanzania. The Journal of Modern African Studies, 42(1), 31-59.
Martin, S. (2016). Rethinking Protection of those Displaced by Humanitarian Crises. American
Economic Review: Papers & Proceedings, 106(5), 446-450.
Maystadt, J.-F. & Duranton, G. (2014). The Development Push of Refugees: Evidence from
Tanzania. Economics Working Paper Series 2014/019. The Department of Economics,
Lancaster University Management School.
Maystadt, J.-F. & Verwimp, P. (2014). Winners and Losers among a Refugee-Hosting
Population. Economic Development and Cultural Change, 63(4), 769-809.
25
Milner, J. & Loescher, G. (2011). Responding to protracted refugee situations: Lessons from a
decade of discussion. Forced Migration Policy Briefing 6. Refugee Studies Centre,
University of Oxford.
Polzer, T. (2004). “We are All South Africans Now:” The Integration of Mozambican Refugees
in Rural South Africa. Forced Migration Working Paper Series #8. Forced Migration
Studies Programme, University of the Witwatersrand.
Ruiz, I. & Vargas-Silva, C. (2013). The Economics of Forced Migration. Journal of
Development Studies, 49(6), 772-784.
Ruiz, I. & Vargas-Silva, C. (2016). The Labor Market Consequences of Hosting Refugees.
Journal of Economic Geography, 16(3), 667-694.
Stearns, J. (2012). North Kivu: The Background to Conflict in North Kivu Province of Eastern
Congo. London: Rift Valley Institute.
Taylor J. E., Filipski, M. J., Alloush, M., Gupta, A., Rojas Valdes, R. I. & Gonzalez-Estrada, E.
(2016). Economic Impact of Refugees. Proceedings of the National Academy of Sciences
of the United States of America (PNAS), 113(27), 7449-7453.
Tumen, S. (2016). The Economic Impact of Syrian Refugees on Host Countries: Quasi-
Experimental Evidence from Turkey. American Economic Review: Papers &
Proceedings, 106(5), 456-460.
UN (2012). United Nations Rwanda Delivering as One Annual Report 2012. Kigali: United
Nations Rwanda.
UNHCR (2017). Global Trends: Forced Displacement in 2016. Geneva: UNHCR.
UNHCR (2016). Rwanda: Population of Concern to UNHCR. Retrieved November 1, 2016 from
<http://www.refworld.org/country,,UNHCR,,RWA,,57d7ec294,0.html>. Geneva: United
Nations High Commissioner for Refugees.
Whitaker, B. E. (1999). Changing opportunities: refugee and host communities in western
Tanzania. Working Paper No. 11. New Issues in Refugee Research, UNHCR.
Williams, C. (2013). Explaining the Great War in Africa: How Conflict in the Congo Became a
Continental Crisis. The Fletcher Forum of World Affairs, 37(2), 81-100.
World Bank (2011). Volume II: Study on Impacts and Costs of Forced Displacement: State of
the Art Literature Review. Washington DC: The World Bank.
World Bank (2016). Rwanda Economic Update: Rwanda at Work. Issue No. 9. Washington DC:
The World Bank
26
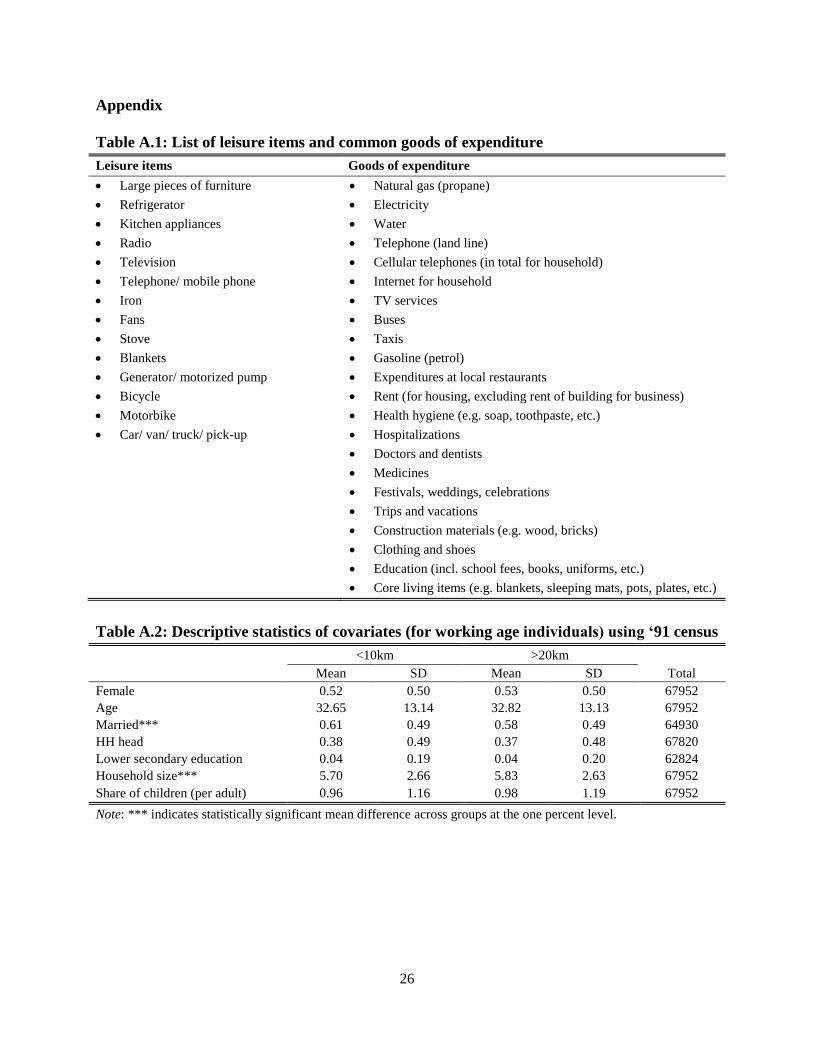
Appendix
Table A.1: List of leisure items and common goods of expenditure
Leisure items Goods of expenditure
Large pieces of furniture Natural gas (propane)
Refrigerator Electricity
Kitchen appliances Water
Radio Telephone (land line)
Television Cellular telephones (in total for household)
Telephone/ mobile phone Internet for household
Iron TV services
Fans Buses
Stove Taxis
Blankets Gasoline (petrol)
Generator/ motorized pump Expenditures at local restaurants
Bicycle Rent (for housing, excluding rent of building for business)
Motorbike Health hygiene (e.g. soap, toothpaste, etc.)
Car/ van/ truck/ pick-up Hospitalizations
Doctors and dentists
Medicines
Festivals, weddings, celebrations
Trips and vacations
Construction materials (e.g. wood, bricks)
Clothing and shoes
Education (incl. school fees, books, uniforms, etc.)
Core living items (e.g. blankets, sleeping mats, pots, plates, etc.)
Table A.2: Descriptive statistics of covariates (for working age individuals) using ‘91 census
<10km >20km
Mean SD Mean SD Total
Female 0.52 0.50 0.53 0.50 67952
Age 32.65 13.14 32.82 13.13 67952
Married*** 0.61 0.49 0.58 0.49 64930
HH head 0.38 0.49 0.37 0.48 67820
Lower secondary education 0.04 0.19 0.04 0.20 62824
Household size*** 5.70 2.66 5.83 2.63 67952
Share of children (per adult) 0.96 1.16 0.98 1.19 67952
Note: *** indicates statistically significant mean difference across groups at the one percent level.

27
Table A.3: Exclusion criteria check using ‘91 census data
Wage employment
Precipitation ('84 - '90) 0.00
(0.00)
Controls Yes
R-squared 0.18
Observations 49,718
Note: Estimates are based on a linear probability model, but robust to
maximum likelihood estimation. Standard errors in parentheses are
robust. Controls include household head, gender, married, lower
secondary education, household size, share of children (per adult) and the
administrative sector. The measure for long-term precipitation in this
check only includes yearly averages from 1984 - 1990, given the census
data is from 1991.