Unleashing Consumer Energy Savings: A Mass-Deployment Strategy
45
Unleashing Consumer Energy Savings: A Mass-Deployment Strategy for Solar Water Heating in Prince George’s County Report to the Prince George’s County Solar Water Heating Task Force Maryland, the birthplace of commercial solar water heating 1892 Advertisement for solar water heating Source: A Golden Thread, Butti and Perlin Craig Marlowe November 7, 2011
Transcript of Unleashing Consumer Energy Savings: A Mass-Deployment Strategy

Unleashing Consumer Energy Savings: A Mass-Deployment Strategy for Solar Water Heating in
Prince George’s County
Report to the
Prince George’s County Solar Water Heating Task Force
Maryland, the birthplace of commercial solar water heating
1892 Advertisement for solar water heating Source: A Golden Thread, Butti and Perlin
Craig Marlowe November 7, 2011

1
Table of Contents Unleashing Consumer Energy Savings: A Mass Deployment Strategy for Solar Water Heating in Prince George’s County
Executive Summary .............................................................................................................................. 3
Key Drivers for Success ........................................................................................................................ 3
Recommendation .................................................................................................................................. 4
Solar Water Heating as a Washington Suburban Sanitary Commission (WSSC) Utility
Service ............................................................................................................................................................................... 4
Value Proposition ....................................................................................................................................................... 4
Target Market ............................................................................................................................................................... 5
Revenue Projections .................................................................................................................................................. 5
Why This Model Will Work .................................................................................................................................... 6
Competitive Strategy ................................................................................................................................................. 6
Background ............................................................................................................................................. 7
Technology Description ...................................................................................................................... 9
Energy Savings ..................................................................................................................................... 10
Reliability ............................................................................................................................................. 15
Incentives ............................................................................................................................................... 16
Solar Renewable Energy Credits ...................................................................................................... 17
Similar Efforts Nationally ................................................................................................................. 19
Wisconsin’s Focus on Energy ............................................................................................................ 20
California’s Solar Initiative Thermal Program .............................................................................. 20
Lakeland Electric Solar Leasing Program ...................................................................................... 21
Valley Electric Association (VEA) ..................................................................................................... 21
Why Has Valley Electric Worked? .................................................................................................... 22
Lessons Learned .................................................................................................................................. 24
Markets ................................................................................................................................................... 24
National ................................................................................................................................................. 24
State of Maryland ................................................................................................................................ 25
Prince George's County ...................................................................................................................... 27
Potential Business Models ............................................................................................................... 28
Why Volume Changes Everything .................................................................................................... 28
Financing .............................................................................................................................................. 29

2
Recommendation ................................................................................................................................ 29
Solar Water Heating as a Washington Suburban Sanitary Commission (WSSC) Utility
Service ............................................................................................................................................................................. 29
Recommended Business Model ......................................................................................................................... 30
Adding Value Through Research and Development ...................................................................... 35
Works Cited ........................................................................................................................................... 37
APPENDIX 1 - Solar Renewable Energy Credit (SREC) .......................................................... 39
Background ........................................................................................................................................... 39
Players ................................................................................................................................................... 39
Renewable Energy Portfolio Standard ............................................................................................ 40
Lifecycle of an SREC .................................................................................................................................................. 41
SREC Trading ............................................................................................................................................................... 42
Appendix II - Destination state for Solar Thermal Collectors ............................................ 43
Appendix III - Solar Thermal Collector Average Costs for 2008 & 2009 ....................... 44

3
Reducing Resident’s Electricity Rates and Usage: A Mass Deployment Strategy for Solar Water Heating in Prince George’s County
Executive Summary Prince George’s County Solar Water Heating Task Force was created in 2010 by the Maryland Legislature
to develop a business model that will lead to rapid and significant deployment of solar water heating
(SWH) throughout the county. A realistic county-wide deployment expectation would be 5,000 systems
per year1. A program of this magnitude would represent the first successful mass deployment of SWH in
the continental United States (US) and would serve as a national showcase. Achieving this goal for mass
deployment of SWH would provide increased employment for installers, sales and customer service
representatives as well as engineers.
In addition to job creation, the major benefits associated with mass deployed SWH are consumer
savings, emission reductions and increased acceptance of alternative energy solutions. When replacing
electric water heaters, a realistic average monthly savings is $40. Other consumer savings are related to
lower and flatter electricity demand curves which can significantly lower the state's cost of electricity.
Finally, SWH is significantly more cost effective at creating clean energy and reducing emissions than
solar photovoltaic (PV) solutions. Emission reductions from the average residential SWH system are
more than a ton of CO₂ annually.
Nationally, despite millions being spent to stimulate SWH adoption, in fiscal year 2011, only 15 SWH
systems were installed in Prince George's County, 423 in Maryland and approximately 30,000 in the US.
Fundamental reasons why SWH use has not taken hold are: 1) it doesn’t make economic sense for most
consumers due to their high installed costs, (in Maryland the average installed cost is $10,000), 2) a
dependency on consumer obtained financing, and 3) an extremely limited targeted market of wealthy
early-adopters. The development of a successful SWH business model must directly address the first
two reasons in a manner that can significantly expand the potential target market.
Key Drivers for Success The two fundamental attributes necessary to drive mass deployment of SWH are: 1) the customer must
save money, and 2) SWH must be easy to buy. Consumer economics of SWH are dependent upon both
installed costs and financing terms. Installed costs can be dramatically lowered by volume purchasing.
Unfortunately, such volume will not occur until the prices drop, and prices will not drop until adoption
increases. What is needed in the marketplace is a solution provider that has the financial capacity and
marketplace credibility to convincingly create the expectation that mass deployment will occur. As
shown by a small electric cooperative in Nevada, a single focused and credible entity can radically
change the dynamics of the SWH supply chain in Maryland, potentially lowering installed costs to under
$4,000.
1 As will be discussed, a successful SWH program was able to achieve a 3.5% penetration in 18 months. A similar
customer acceptance rate for Prince George’s County’s 130,000 non-gas households would be 4,600 systems.

4
The current dependency upon consumer financing for SWH virtually assures little to no real savings for
US residential SWH. With an equipment life of 20 years and limited economic savings, low-cost, long-
term financing is required – the type of financing available to utilities.
Given that economics can be improved and appropriate financing obtained, making SWH easy to buy
requires a trusted and competent solution provider. A trusted name provides the validation necessary
to position SWH away from the “green” niche market and into the mainstream. Validation significantly
decreases customer acquisition costs since consumers trust the solution provider and are no longer
required to understand SWH technology, its incentives and providers. Lower customer acquisition costs
feed into the positive feedback loop of increased volume driving down costs.
Offering SWH as a service from a trusted utility provides an additional benefit – the expansion of poten
tial customers. The easiest way to increase adoption is to expand the number of people who benefit
from the product's value proposition and are in the position to afford it. Newly empowered customers
would include tenants (with their landlord’s permission), low income households and homeowners that
have limited collateral or other credit deficiencies.
The community's embrace of SWH as a community good – one that saves money, improves our
environment and allows us each to make a meaningful difference, can be a signature initiative.
Recommendation
Solar Water Heating as a Washington Suburban Sanitary Commission (WSSC) Utility Service
Currently, the method of selling hot water is for one utility to sell the water and another to sell the
energy used to heat water. There is nothing which precludes hot water as being the only product sold.
While novel, in such an “energy as a service” business model, having the local water utility provide hot
water via its owned solar infrastructure is both feasible and practical. With extremely low cost of capital
and existing billing relationships with most county residents, WSSC can be the low cost provider of SWH
services. Therefore, the Task Force recommends that Prince George’s County residents and small
businesses have access to solar heated water as a utility service from WSSC. Utility service is defined as
utility owned equipment, installed on the user’s structure, that provides hot water partially heated by
solar energy and for which WSSC is entitled to reasonable compensation.
Value Proposition
With WSSC provided SWH, the customer, WSSC and the community individually and collectively are
placed in a superior position, creating a true win-win-win opportunity.
Customer
Immediate monthly savings for electric, propane and heating oil customers
Simple, hassle free, utility service with no new financial obligation
New top-quality water heater – elimination of repair/replacement costs
Being part of the energy solution

5
WSSC
Expanded service offering
New sources of revenue
National, state and local recognition
Green halo
Community
Creates jobs
Enables access to SWH for low income households – where the savings are most critical
Reduces emissions – health benefits
Renewable distributed SWH’s generation of energy reduces the cost, and improves the
reliability of electricity
Delays, or eliminates, the need for new electricity generation plants, transmission lines and
distribution upgrades
Target Market
The primary initial target market will be 130,000 single family and attached residential units that heat
their water with sources other than natural gas and perceive the value proposition as saving money.
The secondary target market consists of the 175,000 households that use natural gas to heat water but
are willing to pay a small premium for clean and renewable energy.
Revenue Projections
Using a very simplified model, with a customer charge of $25 per month, WSSC and partners could
expect $1,800 gross margin per system. Assuming a 5,000 annual install rate over 5 years, around $45
million would be available for program, marketing and reserves (25,000 x $1,800). These numbers are
further improved by the inclusion of program costs in the cost basis used for the federal investment tax
credit (ITC) and accelerated depreciation calculation, or if realized solar renewable energy credit (SREC)
value is higher than assumed. Further beneficial margin improvements are likely as costs for equipment
and installation can reasonably be expected to fall in subsequent years.

6
Table 1 - Present Value of Lifetime Cash Flows Assumptions:
1. System life is 20 years 2. Long term cost of capital is 3% 3. Customer charge is $25 per month and never
increases over lifetime 4. No customer charge-offs 5. Lifetime Warranty/Service/Insurance is
purchased upfront for $1,500 6. Federal ITC is calculated at 30% of PV of
system costs and does not include program and marketing costs
7. SRECs are sold for an upfront payment of $600 each (a significant discount)
8. Each system is eligible for 2.5 SRECs (low estimate)
9. No credit for accelerated depreciation 10. No deduction for tax equity partner's
increased required rate of return
Why This Model Will Work
A similar model achieved a 3.5% penetration of SWH into its customer base in 18 months.
The customer value proposition is appealing: save money while reducing emissions and being
part of the energy and green solutions.
The service is easy to buy and from a trusted name, WSSC. WSSC’s involvement validates the
technology and moves the technology into the mainstream market.
Volume purchasing of equipment and installation will dramatically lower installed costs.
Elimination of consumer financing dramatically expands the potential market, simplifies the
buying process and further lowers costs creating a positive feedback loop.
The customer's financial commitment is to a utility service, not a loan or lease.
Community support and marketing will produce customers while significantly lowering customer
acquisition costs.
Competitive Strategy
Because of WSSC’s competitive advantages of low cost capital and existing customer billing
relationships, the only major threat to this model is a similarly advantaged utility entering the market.
Unlike the gas and electric utilities, WSSC’s existing revenues are not impacted by the customer’s
decision to utilize SWH. With a customer base inclusive of both gas and electric users, WSSC can cost
effectively capture more customers in the service area than any other utility. Even if another utility
would subsequently enter this space, it would not benefit from the initial County and community out-
reach programs that will be put into place for WSSC. Being the first mover, WSSC will benefit by
establishing the competitive price and the envisioned community support. As alternative marketing
channels (Sierra Club, Neighborhood Associations and roofers) develop, it will be increasingly difficult for
another competitor to establish the volume to achieve the necessary economies of scale.
Present value (PV) of system benefits to WSSC
PV of $25 @ 3% for 20 years
$ 4,508
SREC value
$ 1,500
Federal ITC
$ 1,800
PV of Benefits
$ 7,808
PV of system costs to WSSC Equipment
$ 2,000
Installation
$ 2,500
Warranty/Service/Insurance
$ 1,500
PV of Costs
$ 6,000
Net to pay program costs and reserves $ 1,808

7
Background Prince George’s County Solar Water Heating Task Force was created by the Maryland Legislature to
develop a business model that will lead to rapid and significant deployment of solar water heating
(SWH) throughout the county. While the definition of "significant deployment" remains fuzzy, a realistic
county-wide deployment expectation would be 5,000 systems per year. A program of this magnitude
would represent the first successful mass deployment of SWH in the continental United States (US) and
would serve as a national showcase. Achieving this goal for mass deployment of SWH would generate
increased employment for installers, sales and customer service representatives as well as engineers.
In addition to job creation, the major benefits associated with mass deployed SWH are consumer
savings, emission reductions and increased acceptance of alternative energy solutions. Consumer
savings are most directly influenced by conventional energy displaced (electricity or natural gas) and the
household’s use of hot water. When replacing electric water heaters, most studies have shown a direct
average monthly savings between $30 and $50. If single occupant households are excluded from the
data, the minimum average savings are closer to $40. Other consumer savings are related to lower and
flatter electricity demand curves which can significantly lower the state's cost of electricity. Peak
electricity demand is lowered by 0.5 to 0.7 kilowatts (kW) per system, the most of any water heating
technology (1). When coupled with a control system, each system can reduce peak demand by more
than 3 kW (2). Annual consumption reductions have been modeled in the Baltimore area by Solar
Rating and Certification Corporation (SRCC) and average 2,500 kilowatt hours (kWh) per system.
Solar water heating is significantly more cost effective at generating clean energy and reducing
emissions than solar photovoltaic (PV) solutions. The California Center for Sustainable Energy found
that for the same capital costs and panel footprint, SWH produces 3 times more energy, with a
corresponding reduction in emissions, than PV (3). For the average residential SWH system, CO₂
reductions range from 2,500 lbs per year from electricity derived from coal to 2,200 from natural gas (4).
Unlike PV, SWH has low sensitivity to the solar panel, or collector, orientation. As shown in figure 1, at
Baltimore’s latitude, over 90% of the potential energy from the sun (insolation) is available to collectors
that face almost due east or west even while accommodating a tilt2 from horizontal to almost 60⁰ (5).
This flexibility suggests that a higher percentage of buildings will have an acceptable orientation to
utilize SWH than would for PV, in keeping with the goal of mass deployment.
2 Tilt refers to the angle of the collector measured from the horizontal. An tilt of 90⁰ means the collector is
perpendicular to the ground. Azimuth refers to the collectors orientation measured from due south. A collector facing due south has an azimuth of 0⁰ and 90⁰ if facing due west.

8
Figure 1 - Percentage of insolation against collector tilt and azimuth
Source: Christenson, Burch, et al, 2002
According to the Department of Energy (DOE), water heating accounts for between 15 and 25 percent of
residential energy use (6). In 2009, residential usage represented almost 30% of the natural gas and
electricity energy consumed by the United States (7). Therefore, residential water heating accounts for
4.5% to 7.5% of the nations demand for both natural gas and electricity. Unfortunately, most
consumers (and many policy makers) remain in the dark about the energy costs associated with heating
water.
Despite clear advantages to using solar energy to heat water, last year there were only 15 solar water
heating systems (SWHS) installed into Prince George's County (8). The primary reasons are:
1) high capital costs, the average cost in Maryland was $10,000;
2) limited consumer access to low-cost long-term financing;
3) mismatched terms of home ownership and equipment life;
4) poor consumer understanding of the costs to heat water, and
5) the lack of credible and trusted solution provider brands.
Today, the decision to install thousands of dollars of equipment to heat water is not taken lightly by
consumers. When coupled with a requirement for customer obtained financing, the option does not
even exist for many. Novel programs around the county are attempting to address high costs and
financing by offering 20 year leases for SWH systems. Unfortunately, since homes have an average
seven (7) year occupancy, concerns about the future sale of their home has kept consumer acceptance
low. Alternatively, customers are familiar and comfortable with enabling services by utilities. During a
home's sale, despite an infinitely long commitment for existing utility services, little anguish occurs. All
parties just expect that the utility service will pass to the next occupant.
SWH systems’ weak marketing brands (channels) impose a significant burden on potential consumers.
Today, due to the lack of a credible solution provider, when electing to purchase a SWH system a
consumer must become educated in SWH technology, installation contractors and incentives. Each
aspect has a significant learning curve and potential for mistake. Not surprisingly, even motivated
customers become frustrated or overwhelmed, and do not complete the transaction. Offering SWH

9
systems through a trusted and competent party, such as a utility, allows the consumer to forgo the
steep learning curve and rely upon the provider.
Around the country, most programs have focused primarily on providing incentives to lower the capital
costs and have not addressed the lack of financing or weak brands. Not surprisingly, these types of
programs have resulted in customer adoption rates of less than a single percent. Two alternative
program structures have emerged; community bulk buying, best typified by Valley Electric Association
(VEA), and leasing SWH systems from a utility, as pioneered by Lakeland Electric.
Selling SWH as a utility service effectively addresses the above impediments and plays on the strengths
possessed by most utilities. Clearly, utilities have expertise in financing, volume purchasing and
managing distributed capital infrastructure. The lack of a competing strong brand that offers an
affordable and reliable SWH solution is a real and exciting opportunity for utilities.
Technology Description Solar water heaters use the sun to heat water either directly or indirectly via a working fluid and heat
exchanger. The heated water is maintained in a storage tank, giving SWH systems the ability to store
renewable energy. When hot water demands exceed the system’s capabilities, conventional electric or
gas heating devices provide augmentation. The ability of a SWH system to reduce its reliance from
these conventional energy sources is measured by its solar fraction. A system with a 60% solar fraction
means that, on average, 60% of the hot water and associated energy demand can be met by solar
energy. Typical average solar fractions in Maryland are in the range of 55-65% with summer fractions
approaching 100%. Cost effective and reversible energy storage is a key distinction between, and
advantage of, SWH from other forms of solar driven energy generation.
Figure 2 Solar Fraction Source: Denholm, 2007
Counter-intuitively, a National Renewable Energy Lab (NREL) 2011 study found that when displacing
electricity, SWH was more cost effective in Maryland than Florida, primarily due to higher electricity
rates and cold ground water temperatures (9). Maryland's need to use a great deal of high cost
electricity to heat water from a lower ambient ground temperature makes SWH a compelling renewable
solution.

10
Figure 3 Value of electricity savings Source: Cassard, Denholm, & Ong, 2011
The typical SWH system’s ability to deliver energy is directly limited by two factors: 1) the volume of the
storage tank and 2) the timing and draw of hot water. If there is no usage of hot water, the system can
quickly reach its design temperature and no further energy can be captured by the system3. Since solar
energy technologies that directly generate electricity, such as PV, can shed their excess energy
(electricity) into the grid, they are less dependent on the end-user’s actual energy consumption. Due to
interior space and cost constraints, the tank size for SWH systems will be limited. Thus the end-users
hot water draw profile becomes the critical variable to determine the energy displaced by solar.
Unfortunately, limited actual time-stamped data is available for modeling and therefore pilot results are
most often used to calculate energy savings (10).
Energy Savings The lack of published typical residential hourly hot water draw profiles limits the ability to model
expected savings. The American Society of Heating, Refrigeration and Air Conditioning Engineers
(ASHRAE) standard 90.2-1993 represents average annual hourly hot water draws for both high and low
residential usage (11).
3 The SWH system will continue to produce a minor amount of energy associated with the thermal losses from the
tank, although for all practical purposes the net energy generated approaches zero.

11
Figure 4 - ASHRAE Annual Residential Hot Water Load Profile Source: NAHB, 2002
Even the Solar Ratings Certification Corporation (SRCC) uses a primitive water draw test as part of its OG 300 rating. The OG-300 rating is the industry standard certification and is required by Maryland law for the SWH system to be eligible for state incentives. Table 2 reflects that the SRCC testing for overall system performance assumes 6 hourly draws of 3 gallons per minute for an aggregate daily draw of 64.3 gallons (12), significantly different than the ASHRAE profile and clearly not in keeping with the typical residential usage of hot water.
Table 2 - SRCC OC-300 Certification test water draw Source: SRCC, 2011
Fortunately, there are several pilots that have published their energy saving results. In 2006, Valley
Electric Association (VEA), a Nevada electric co-operative, conducted an 18 month pilot with 40
households, all of whom used electricity to heat water (2). The below table shows the results for the 10
units that were metered during the pilot. The VEA pilot results show the wide variation of energy savings
associated with SWH. As discussed, these variations are primarily attributable to the overall usage of
hot water which is mainly dependent on household size. The average savings during the pilot period
was almost 9% of the end-user's electricity which translated into an approximately $30/month reduction
in their bill. By focusing on larger households the actual average savings will be much higher. Removing

12
the four households in the sample that saved ~1,000 kWh or less, the average monthly savings rises to
over $40. In any event, the maximum monthly savings was almost $50 and 3 of 10 households had
monthly savings of over $40. With electricity costs assumed to be $0.103/kWh, about 70% of the cost in
Prince George’s County, comparable savings in Prince George’s County would be between $56 and $70.
Table 3 VEA's pilot study results Source: Cliburn and Associates, 2008
California ran a metered pilot in 342 residential, multifamily and commercial units from 2007 to 2010 in
San Diego. The results are shown in Table 4. The 99% realization rate for electric water heating signifies
that, on average, 99% of the expected savings was realized. Monthly SWH savings are based on a
$0.177/kWh and $1.28/therm for electricity and gas rates, respectively (3). Similar to VEA, California
found that the number of occupants in a household had the greatest impact on hot water usage and
expected savings.
Table 4 California's SWH Pilot Program savings Source: Itron, Inc, 2011
The National Renewable Energy Lab (NREL) has developed a solar energy modeling software package
called System Advisor Model (SAM) that now includes the ability to model SWH. Unfortunately, there
are system issues and weak assumptions that have been discovered and reported to NREL by the author.
Again, the lack of accurate hot water draw data is the central weakness. Regardless, the software does
provide accurate insolation projections, and if appropriate precautions are taken can provide a better
understanding of SWH potential performance in Maryland. Fig. 5 reflects the monthly energy savings
from an Alternative Energy Technologies AE-24 system with two collectors (total area ~48 square feet)
and an average daily water draw of 70 gallons. The noticeable drop in August’s energy savings is due to

13
the NREL hot water draw assuming a one week absence of water draws in that month, as well as in May
and December4.
Figure 5 - SAM Model of Maryland Cost Savings
System Cost
The US cost of SWH systems varies dramatically and is often quoted in a $5,000 to $10,000 range. As
shown in Fig. 6, a Navigant study found typical installed costs are approximately $6,000 which compares
poorly to high efficiency heat-pump water heating systems (13). To effectively compete with heat
pump and other efficient water heating technology, Navigant claims that SWH systems must have an
installed cost nearer to $3,000 after incentives (13).
Figure 6 Water Heater Pricing Source: Goetzler, 2011
US SWH prices are significantly above global prices. Israeli has successfully achieved mass deployment
via low cost SWH. Fig. 7 shows some of the explainable components for this differential with Israeli.
Half the difference is associated with less installer competition, high contractor overhead and marketing
costs. Differences in US codes, labor costs and construction styles will work against US pricing
approaching the ~$2,000 Israeli level, although there is clearly room for US pricing to drop and approach
the costs of other efficient water heating solutions. Through a volume buying program, at least one US
4 NREL has also struggled with the lack of hot water draw data. Their data is from a system being studied and the
lack of water draws is due to vacations.
$-
$10.00
$20.00
$30.00
$40.00
Jan Feb Mar April May June July Aug Sept Oct Nov Dec
Monthly Savings assuming a $0.145 cost per kWh in Maryland

14
program has already lowered installed costs to around $4,000, significantly below typical US
installations.
Figure 7 Components of US v. Israeli SWH prices Source: Goetzler, 2011
Manufacturing production volume is extremely low in the US market. Alternative Energy Technology,
Inc., one of the largest volume US manufacturers of solar collectors, has an annual production line
capacity of 17,000 units (14). Despite this capacity, the company only sold 5,000 systems in 2010.
As shown in Fig. 8, the top 5 manufacturers have represented ~80% or more of total annual shipments,
although this dominance is decreasing (15). Having the vast majority of the market controlled by just
five manufacturers limits the ability to negotiate equipment price; however, Rheem’s significant
concessions to VEA and the author’s discussions with AET support the conclusion that volume
commitments will result in the desired price reductions.
Figure 8 Market Share Dominance Source: EIA, 2011

15
Reliability If properly installed, SWH can have extremely low system and component failure rates. As shown in Table 5, Hawaii Electric Company’s (HECO’s) SWH program, with 40,000 systems, had 158 equipment and component failures during the 1996 to 2004 time period. The Table’s top sets of numbers reflect the rate of equipment failure expected by Hawaii. The bottom set shows the actual failure rate experienced.
Table 5 Hawaii Electric SWH System Reliability Based on >20,000 Systems Source: (Cliburn and Associates, LLC, 2008)
A more recent Sandia National Lab analysis of Hawaii’s experience reported in much more depth and
postulated there were two fundamental reasons why Hawaii’s experience was so trouble-free. First, the
systems used were simple direct systems. Second, a structured problem identification and resolutions
process supported its trained city inspectors (16). This second component was put into place as
warranty issues began to escalate in the early 2000’s. As shown in Fig. 9, warranty issues can clearly be
influenced by a managed installation process with high quality control standards.
Figure 9 HECO warranty trends Source: Building Specialists Inc., 2011
The Sandia reliability study used three databases of major SWH projects, they were: 1) Sacramento
Municipal Utility (SMUD), 2) an anonymous major installer and 3) HECO. The study found that HECO’s
repair experience was exceptionally low, although noting the SMUD data was from the 1990’s and the
anonymous installer’s performance showed significant improvement between the two years examined
(16).

16
Other than issues with valves, there was no consistency between these databases of repair issues. Fig.
10 shows the relative percentage of problem types between component and the installation database.
It reflects the relative percentage of problems experienced by each component in relation to total
problems for that data set (color).
Figure 10 Comparison of component failure Source: Building Specialists Inc., 2011
While SWH certainly is not trouble free, HECO’s experience shows the exposure can be managed by
proactive management of the installation process. Additionally, WePower, a SWH leasing company, has
purchased a third party insurance contract for its Rheem SWH systems to cover all required repairs. The
ability to offload all warranty and service risk has significant appeal during the program’s initial ramp up.
Incentives Incentives are used to lower prices in order to stimulate higher purchasing volume which will hopefully
lead to higher economies of scale. The incentives available for Maryland SWH purchasers are:
Federal 30% investment tax credit (ITC)
State MEA SWH grant
County property tax credits
Carbon credits
SRECs
The Federal ITC for SWH has been extended until the end of 2016. While its future is uncertain, political
winds suggest the credit may not see another extension. The ITC is a non-refundable tax credit,
meaning that it can only be used to reduce a Federal tax liability. If the taxpayer has no Federal tax
liability there is no value to this ITC. If the SWH asset is sold or transferred within 5 years of claiming the
ITC, the ITC’s value is recaptured from the taxpayer.
MEA is currently offering a grant for residential SWH of 20% of the installed costs up to a $500
maximum. The funding for this grant is from Regional Greenhouse Gas Initiative (RGGI) proceeds and
SREC alternative compliance payment (ACP) fees. Both funding sources are diminishing and the grant is
not expected to survive into next year (17).

17
Prince George’s County offers a property tax credit for SWH and PV installations. The annual funding is
limited to $250,000 and has been fully subscribed for the last two year.
The Regional Greenhouse Gas Initiative (RGGI) was expected to create a marketplace for selling carbon
offsets. With the recent collapse of RGGI’s market price on carbon, there is little short-term expectation
for any significant financial incentive value from monetizing emission reductions.
A solar renewable energy credit (SREC) represents a megawatt hour (MWh) of electricity. For SWH, a
simple conversion of displaced thermal energy into electricity is used to determine the number of
credits awarded. For residential systems, both displaced thermal energy and its conversion to electricity
is modeled by the SRCC. The average Maryland SWH system will earn 2.5 SRECs annually.
Because their funding is limited, the assumption of mass deployment means both the MEA and the
county property tax credit incentives will not be available. Therefore, incentive value in Maryland for
mass deployed SWH is primarily dependent upon the ITC and the value obtained from the solar
renewable energy credits (SRECs). The avoided ACP represents the maximum value of an SREC.
Beginning with the 2012 ACP, the aggregate ACP over the RPS’s lifetime is $3,050. Assuming the SREC is
worth 50% of the ACP's value and then discounting at 10%, this lifetime SREC payment stream has a
value of $970. The ultimate value of the SREC is dependent upon the needs of the Load Serving Entities
(LSEs). The SREC's historically high price has led to significant amount of solar PV development from
both LSE affiliated and outside interests. Unfortunately, or fortunately, depending on your perspective,
over 30 MW of new large scale solar PV is expected to come on line in 2012, which may result in another
surplus year. For example, on July 27, 2011 Maryland's Board of Public Works approved the contract
with the prison near Hagerstown for an additional 20 MW project that will begin construction this year.
Solar Renewable Energy Credits [For an explanation of the solar renewable energy credit (SREC) and Maryland's electricity landscape
please read Appendix 1]
With the 2011 passage of HB 993, Maryland has made solar water heating eligible for SRECs. The actual incentive available is dependent upon the market value of the SREC and the SREC owner’s ability to receive that value over time. Beginning in 2011 the SREC's market price variation has been increasing. Fig. 11 shows the highest price, the lowest price and the weighted average prices paid for SRECs (17). The significant drop in 3/11 is associated with the announcement that the obligated parties expected to have enough SRECs to be in compliance this year.

18
Figure 11 Historical Maryland SREC market prices
As shown in Table 6, despite significant increases in required SRECs, existing or already announced large scale solar projects are forecasted to meet much of the demand in years 2012 and 2013 (18). Thereafter each year’s required new generation is assumed to be built and fully operational for the next compliance year. Clearly the combination of existing and already announced generation will meet the majority of the SREC requirement for years 2012 and 2013. The likelihood of meeting the 65 MW shortfall in 2014 is less certain, although the forecast does not include any significant SWH penetration. In each year of full operation, an ongoing 5,000 SWH system build-out program will generate approximately 12,500 SRECs. If the SWH program began in mid 2012, in year 2014 the program would generate 31,250 SRECs for that year, over 50% of the forecasted need. By 2017, the SWH program would generate 62,500 SRECs annually.
Table 6 Forecasted Maryland SRECs Requirements Source: Lucas, 2011
Year Existing
MW SRECs
Needed Existing or planned
SRECs New SRECs
Needed Required New
Generation (MW)
2011 14.0 30,784 18,200 12,584 18.2
2012 40.0 62,472 52,000 10,472 15.1
2013 80.0 126,171 104,000 22,171 32.0
2014 112.0 190,896 145,590 45,306 65.4
2015 177.4 256,337 230,578 25,758 37.2
2016 214.5 324,672 278,898 45,774 66.1
There are at least two factors that suggest that solar energy build-out will not continue to match the SREC requirements. First, the drop of SREC value in several states, as shown in Table 7, has not gone unnoticed by the large solar developers (19). A significant loss of SREC value decrease the economic viability of “numbers driven” large scale photovoltaic installs. Last fiscal year 61% of Maryland’s new installed solar capacity was created via 200 kW or larger systems. If Maryland SREC value begins to approach that of Delaware or even Pennsylvania, the economic viability for such systems will vanish. Absent large scale development and faced with low SREC values, Maryland’s small-scale solar system
0100200300400500600
2011 2011 2011 2011 2010 2010 2010 2010 2010 2010 2009 2009 2009 2009 2009 2009 2008
7 6 5 4 3 2 1 121110 9 8 7 6 5 4 3 2 1 121110 9 8 7 6 5 4 3 2 1 1211
MARYLAND SREC Prices High (PriceperCertificate)
WeightedAverage PriceperCertificateLow (PriceperCertificate)

19
build-out5 will not be able to ramp up to meet the SREC goals for exactly the same reason, low SREC value.
Table 7 - Summer SREC Prices in PJM Territory Source: SREC Trader, 2011
The second factor is known as the “kink”. In 2016, Maryland’s RPS requires that 0.5% of the electricity sold in the state be produced by solar. In 2017, that percentage is increased to 0.55% and in 2018 it rises to 0.9%. The kink resulted from last minute reconciliation of the House and Senate versions of the 2010 RPS legislation. It is widely expected that the 2017 solar carve out requirement will be adjusted to be more towards the middle of the increase between 2016 and 2018. Even if it is not, by 2018, a near doubling of 2016’s SRECs will be required. Thus, even in the worse case, 2018 and beyond still appear to be very promising for SREC values.
Ultimately, low SREC value plays into the strength of SWH, the most cost effective solar energy option on the market. The proposed business model works with an SREC value of just over $40 per year, well below what is required to make utility scale photovoltaic feasible.
Similar Efforts Nationally In the US, only the Hawaii Electric Company (HECO) SWH program can be considered a mass-implementation, arguably due mostly to their lack of natural gas and reliance upon imported oil to generate electricity. The combination of a well run program, high electricity prices and mandates requiring SWH have resulted in over 40,000 installations. Outside of Hawaii, four programs that
5 Currently, small scale systems, which includes SWH, are being added at the rate of little over 700 kW per month
or 9 MW annually.

20
characterize US SWH programs are discussed below. The first two are traditional programs. The last two represent innovative attempts to break into the SWH market.
Wisconsin’s Focus on Energy This statewide program is administered through Wisconsin's regulated utilities. The program is very
similar to the Maryland Energy Administration's SWH incentive program. A key difference is the
requirement for a 5 year installation warranty. The program offers no financing or bulk purchasing and
relies upon the existing industry to conduct marketing. In 2008, the maximum residential incentive paid
was $2,500 which has since been reduced to $1,200. While the program has been showing steady
improvements, the 870 installed projects is much less than 1% of the potential market (20).
Table 8 Wisconsin's SWH results
Year # of Projects (residential)
# of Projects (business) # of Projects (total)
2007 92 15 107
2008 122 33 155
2009 120 49 169
2011 218 52 270
Total Projects Installed Since 2007 701
Total Projects (with 2005-6 approximation) 870
California’s Solar Initiative Thermal Program In 2010, the California Public Utility Commission (CPUC) created a $280 million incentive program to drive the installation of 200,000 SWH systems throughout the state. The program's goals are to lower installation and permitting costs, educate the public on the benefits of SWH, expand the workforce and remove other impediments to SWH. The program is administered through the regulated electric and gas utilities. The maximum residential incentive is $1,875. Similar to Wisconsin's Focus on Energy, the program provides no financing or bulk purchasing. Unlike Wisconsin’s Focus on Energy, California’s program funds significant marketing through the participating utilities and directly. Nonetheless, as reflected by the numbers below, the program has not been well received. As of 9/19/2011, there have only been 117 systems added to the below totals (21).
Table 9 California Solar Program costs vs. results (10/1/2010-3/31/2011)
Total Program Expenditures System applications
Gas Electric Gas Electric
$1,715,074 $361,231 66 70
There are likely two key reasons for California’s lack of success. First, SWH is not cost effective due to the lack of an appropriate financing program. With California’s average cost for installed residential SWH of $8,363, the Federal ITC and the State's incentive reduce the customer's cost to $4,000. Assuming 100% financing over 10 years at a consumer rate of 7%, the monthly payment is over $46, more than the expected savings. Second, program management is left to the electric and gas utility

21
companies. Because the program has been set up as a zero sum game, both sets of utilities ultimately will see a net decline in revenue from any program that results in a consumer gain.
Lakeland Electric Solar Leasing Program For over a decade, Lakeland Electric has been providing a SWH solution and was the first US utility to
offer solar water heating (SWH) on an end-use, or “energy as a service” basis. Despite considerable
effort, marketing efforts have not resulted in significant penetration into their 112,000 customers. As of
May, 2011 there were still just over 100 active SWH accounts.
The utility's first model installed SWH systems on customer’s roofs and billed the customer for the SWH
system's output on a monthly basis. The model has now matured to a 20 year fixed payment lease that
is collected on the electric bill. The $34.95 monthly fee is expected to result in little to no net electric bill
impact for most customers. Once a customer is accepted into the program, Lakeland's partner,
Regenesis, will install an 80 gallon direct (water is used as the working fluid) SWH system. The end-user
has no responsibility other than making the payment. Both Lakeland and Regenesis are staffed by long
time SWH industry veterans who have modified an Alternative Energy Technology, Inc. (AET) system for
their use. The program only offers one equipment option, a direct single collector with an 80 gallon
tank, sized for a family of four. According to published reports, in 2002 the system's installed cost was
just over $2,000 (22) and a 2008 report quoted a $1,200 bulk purchase equipment cost (1).
Valley Electric Association (VEA) VEA officially kicked off their program on September 5, 2009 and since have made 1,000 customer site visits to determine suitability of SWH. There are currently over 550 installed systems. Including in-process systems, VEA already has 3.5% of their 17,000 members utilizing SWH. VEA entered into a bulk purchase agreement with Rheem Manufacturing and hired a General Contractor (GC) to oversee the sub-contracted installation process. The program centers around the volume buying power of the co-op as both the equipment and installation costs have been pre-negotiated. Their process flow:
Site Visit by GC
Estimate back to the Valley Electric Association (VEA)
VEA calls member with estimate
Member signs contract and credit application
Financing approved
Job order is scheduled and sent to GC
VEA warehouse assembles system equipment
Sub Contractor pre-fab systems/Installation
Paperwork to VEA for billing ,UCC filing, RECs
22
Table 10 VEA System models and costs
Systems Rheem's
Price Installation Total Cost Monthly Payment
Manufactured Homes
System 1 –65 gallon tank and (1) 3x8 collector $1,758 $1,210 $4,002 $22.23
Site Built Homes
System 2 –80 gallon tank and (1) 4x8 collector $1,813 $1,210 $3,891 $21.62
System 3 –80 gallon tank and (2) 3x8 collectors $2,336 $1,370 $4,769 $26.49
System 4 –120 gallon tank and (2) 4x8 collectors $2,557 $1,370 $5,007 $27.82
Rheem Manufacturing is supplying four different systems based on household size and/or hot water usage. All models are indirect active systems (gycol). Material not provided by Rheem and consumed during the installation averages an additional $700. With an entry level installed cost around $4,000, the VEA model clearly shows the benefits of volume buying. VEA provided financing carries a zero percent interest rate over a 15 year term. The end-user retains the federal investment tax credit (ITC). Since the financing represents 100% of the installed costs, in effect the program is providing a ~$1,200 incentive to the end-user. Monthly payments are collected on the utility bill. VEA funds the program's administrative expenses by selling the retained SRECs. In the Nevada market, these SRECs are worth ~$25/MWh, significantly below Maryland's expected minimum value.
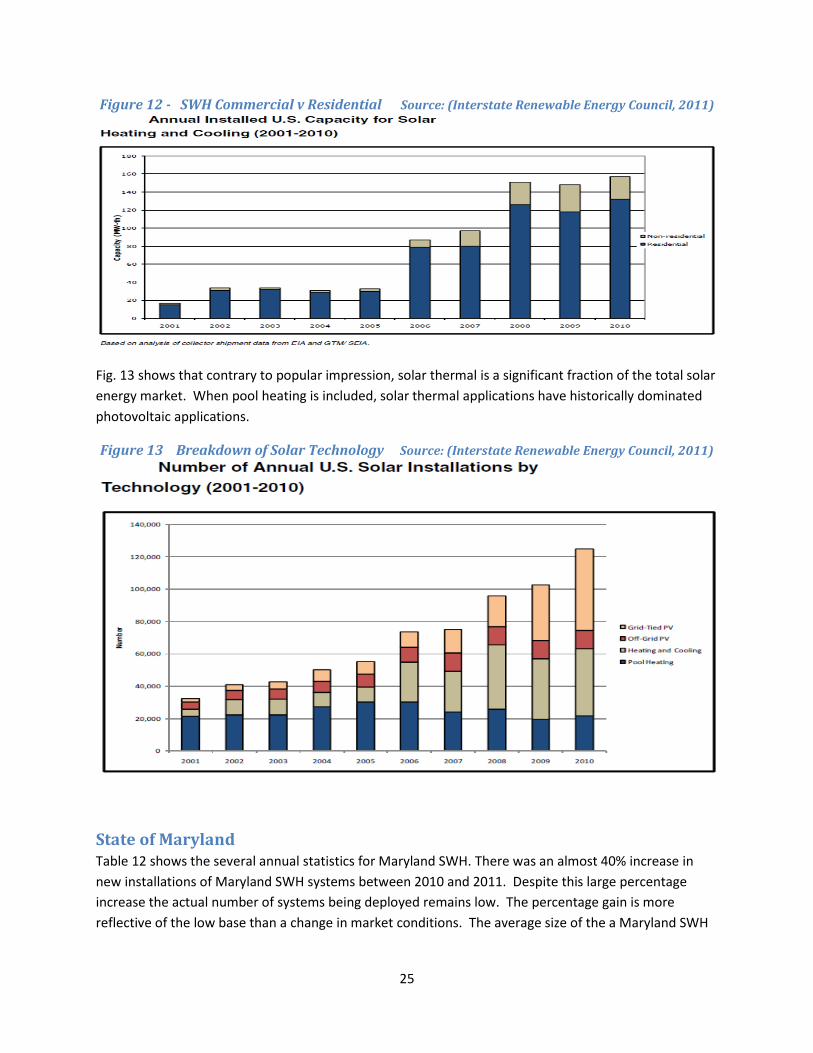
Why Has Valley Electric Worked? The two most interesting models are the programs developed by VEA and Lakeland Utility. Both models
have adopted similar approaches to drive down costs. These characteristics are:
Standardized equipment options
Bulk purchase agreements from limited SWH manufacturers
Managed sub-contractor installation process and pricing
No upfront costs to end-user
Low monthly payment designed to be below energy savings
Monthly payment included in utility bill
The key differences between the programs are related to equipment options, maintenance
responsibility, program management, marketing focus, investment tax credit ownership and pricing.
Lakeland offers only one system option and is sized for family of four - VEA offers four sizes.
VEA SWH end-users are responsible for their system. The end-user is responsible if the system
breaks or has issues outside of the warranty. In Lakeland's program, all system issues are
retained by Regenesis.
VEA's program management is all internal where Lakeland outsources the program to Regenesis
VEA has been very aggressive in the use of community relations to sell the program. Utilizing
their "Ambassadors" program, VEA has developed community leaders that have adopted the

23
program and actively promote it. In part to its cooperative ownership by the community, VEA
has made SWH a core program. Lakeland's model lacks the community aspects and focuses on
the program's economic aspects.
In Lakeland the Investment Tax Credit (ITC) is retained by the system's owner, Regenesis. In
VEA's program, the end-user owns the system and is entitled to the 30% tax credit, thus VEA
essentially provides the end-user an interest free loan of the ITC’s value. While it is tempting to
solely attribute VEA’s program’s success to the customer’s retention of the ITC, a large number
of VEA’s customers do not have Federal tax liability and do not benefit from the ITC.
Despite retention of the ITC, Lakeland's pricing is $34.95 for a twenty year lease. VEA's payment
varies, although the equivalent system is $21.62 for fifteen year loan term. In addition, the end-
user is entitled to a ~$1,200 ITC.
Using a 6% discount rate, a net present value analysis for the customer was conducted on the two
models. Energy savings were assumed to be equal to the Lakeland's monthly payment for both models
and are assumed to rise by 2% a year. System life was set at 240 months. Since maintenance costs are
subjective, it is left to the reader to determine an estimated amount to be subtracted from the VEA's
value; however, WePower (another company offering 20 year SWH leasing) has purchased third party
insurance that covers all repairs and liability associated with the system for approximately $1,000 (23).
Excluding maintenance and warranty costs, there is an over $3,600 difference in present value between
the models. The VEA model depends upon an interest rate buydown to zero. With a 7% interest rate
the resulting $34.97 payment would be equivalent to Lakeland. Without the interest subsidy, the
present value still greatly favors the VEA model, primarily due to the end-user retention of the ITC.
Because of the five year faster payoff, and the resulting increased energy savings, the lower the discount
rate, the more favorable the VEA model.
Table 11 Present Value Analysis VEA vs. Lakeland
Comparison of VEA and Lakeland SWH end-user cost
(utilizing the comparable system option) VEA Lakeland
Monthly Payment $21.62 $34.95
ITC* $1,167 0
Residual Value 0 0
Discount rate 6% 6%
Term (months) 180 240
System life (months) 240 240
Saving w/o maintenance costs $13.33 $0
Maintenance Unknown 0
Energy inflation rate 2% 2%
Present Value $4,304 $883
Present Value w/o interest sub. $2,722 $883
* ITC received in 12 month

24
The fundamental reasons that 3.5% of VEA’s customers have adopted SWH are not just economics.
Other factors include:
Customer perception of the long term personal commitment
o VEA's long term commitment is shorter and the customer owns the asset
o Lakeland has a lease agreement – in essence homeowners paying rent
Community involvement
o VEA's community is classic small-town with established relationships
o VEA’s process is not profit driven – customer’s interests protected
o VEA conducted 18 month open and transparent pilot proving customer value
proposition
Lessons Learned There are two successful SWH programs in the US: HECO and VEA. Both share two fundamental
attributes. First, the program provides an economically attractive cost for SWH to the customer. In
both models, a customer will save money by installing a SWH system. Second, each has a committed
and holistic approach to a SWH program.
A commonality between unsuccessful programs is their focus on the incentive as the primary driver for
customer adoption. Little to no focus is paid to the customer’s value proposition. Quite simply, the
programs throw money at the problem in the hope that volume will eventually drive down installed
costs until SWH becomes economically viable. Despite the clear advantages, unsuccessful programs
offer little to no collective purchasing of equipment, installation or maintenance, and leave these
negotiations to the party with the least buying power; the homeowner. Similarly, SWH financing is not
part of the program and is left to the customer to obtain. The lack of a holistic program approach to
SWH, limited competition and poor demand for the solution, virtually ensures the program cannot offer
an economically compelling proposition to potential customers. Finally, many unsuccessful programs
further compound the problem by creating bureaucratic, time consuming and temporal processes that
must be followed to receive incentives.
To mass deploy SWH a program really must only do two things. Save customers money and make SWH easy to buy. Both are much harder to do than say.
Markets
National Nationally, the SWH market has grown to approximately 30,000 systems annually and represents a $800
million industry (24) (13). The markets total revenue is about equally composed of equipment sales and
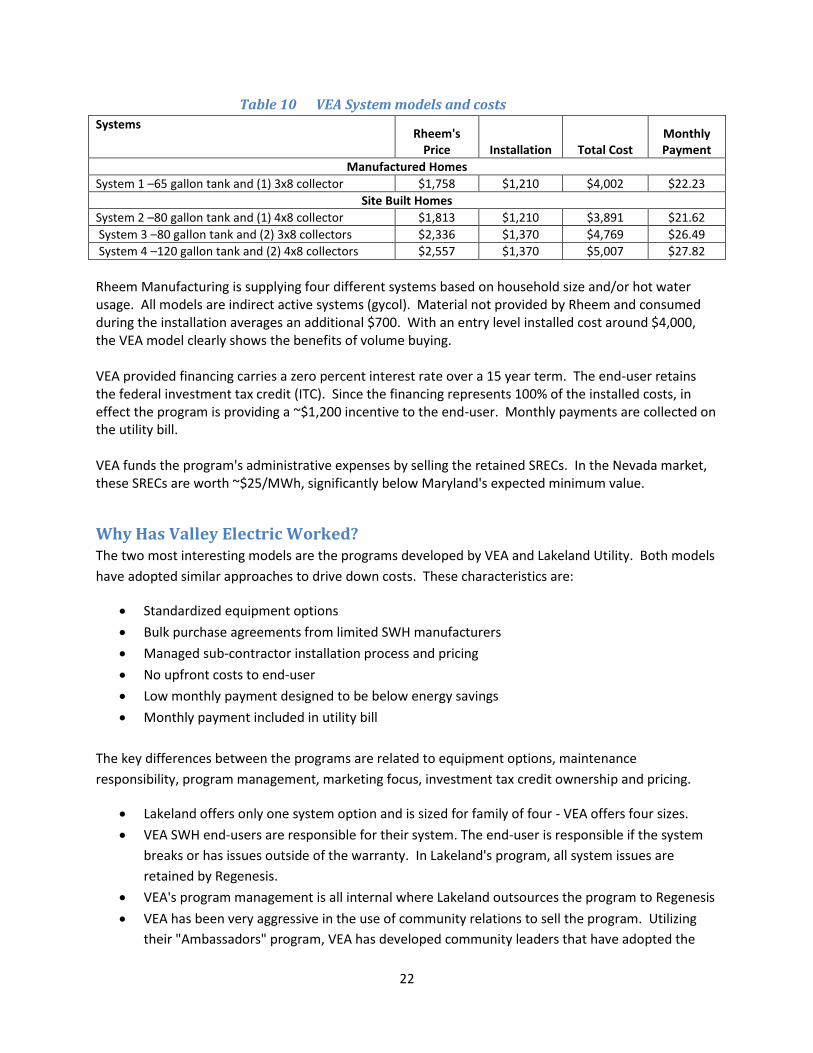
labor charges. While the commercial component of the market is increasing, as shown in Fig. 12, it has a
relatively minor impact.
25
Figure 12 - SWH Commercial v Residential Source: (Interstate Renewable Energy Council, 2011)
Fig. 13 shows that contrary to popular impression, solar thermal is a significant fraction of the total solar
energy market. When pool heating is included, solar thermal applications have historically dominated
photovoltaic applications.
Figure 13 Breakdown of Solar Technology Source: (Interstate Renewable Energy Council, 2011)
State of Maryland Table 12 shows the several annual statistics for Maryland SWH. There was an almost 40% increase in
new installations of Maryland SWH systems between 2010 and 2011. Despite this large percentage
increase the actual number of systems being deployed remains low. The percentage gain is more
reflective of the low base than a change in market conditions. The average size of the a Maryland SWH

26
system was just over 50 square feet and represented two 3’ X 8’ solar collector panels. It is notable that
for both full fiscal years the median number of installs per contractor was a single system.
Table 12 Maryland's SWH statistics (8) * Maryland's fiscal year ends 6/30
Fiscal Year Total
Awards
Average installs per Contractor
Median installs per Contractor
Total SWH Contractors
Installs by largest single
Contractor
Average price per
foot²
Average square foot
collector area
Average Total
System price
2010 307 7 1 42 95 $ 190 52 $9,901
2011 423 10 1 43 157 $ 185 58 $ 10,730
2012 * 12 2 2 7 4 $191 51 $ 9,789
* As of August 30, 2011
Fig. 14 shows the trend for the average Maryland installed cost for residential SWH (18). At $10,000, the
average price paid for the system is at the top of national price range. It is interesting to contemplate
the impact of Maryland's incentives on this price. The MEA incentive for SWH heating has been at a
steadily decreasing percentage of installed costs. What has been consistent is the $10,000 cap on
installed costs.
Figure 14 Maryland's Average SWH Installed Costs Source: Lucas, 2011
In 2009, the average factory sales price for a flat plate SWH collector was $19.43 per square foot, an
increase of 12% from 2008 (25). Given that Maryland's average collector was 50 square feet, collectors
had a wholesale collector cost of $972 plus shipping. Solar water heater tanks are more expensive than
traditional tanks, nonetheless, these tanks can be purchased at retail for less than $1,500. Thus even if
the collector costs are doubled, equipment costs cannot explain the price being charged in Maryland.
Certainly the high price for SWH is related to the extremely low volumes installed by most contractors.
In 2011, over half of the contractors completed only one SWH install. Resulting inefficiencies include
low purchasing power, high distribution costs (as most systems are not stocked locally and must be
individually shipped), no economies of scale and a steep learning curve. Without repetition, the
$8,000
$8,500
$9,000
$9,500
$10,000
$10,500
$11,000
$11,500
$12,000
Sep-08 Mar-09 Sep-09 Mar-10 Sep-10 Mar-11

27
contractor cannot be expected to gain confidence and the necessary skills to minimize installation costs.
In FY 2011, the top two contractors were responsible for 235 of the 423 installs. Despite their volume,
both contractors had average installed price similar to the state-wide average. One must conclude that
Maryland customers are faced with limited price competition for SWH.
Prince George's County Historical sales of SWH into Prince George's County have been almost non-existent. In FY 2010, MEA
awarded 12 SWH grants, 2 commercial and 10 residential. In FY 2011, grants totaled 15, all of which
were residential (8).
Table 13 shows the potential Prince George’s County market with a population of 863,420 housed in
304,000 residential units. Over two thirds of these units are attached or detached single family
residences. In keeping with this ratio, almost two-thirds of total housing units are owner occupied and
37% are rentals.
Table 13 Breakdown of PG housing units
Occupied Units 2010 Total: 304,042
Percent Number of Units
Number of Buildings
Single-Family Detached 52.3% 159,014 159,014
Attached 15.9% 48,343 48,343
2 Apartments 0.6% 1,824 912
3 or 4 Apartments 1.7% 5,169 1,477
5 to 9 Apartments 7.3% 22,195 N/A
10 or more Apartments 21.6% 65,673 N/A
Mobile Home/Other 0.5% 1,520 1,520
Totals 99.9% 303,738
The initial focus of the Task Force was multifamily properties inside the beltway. Unfortunately, it was
quickly determined that the majority of the county’s multifamily units were using natural gas to heat
their water. Table 14 reflects that 57% of Prince George’s residential units heat their water via natural
gas. As shown by the California energy savings data, SWH is not economically competitive with natural
gas that currently has an approximate cost of $0.04/kWh.
Table 14 Current Water Heating Source
Occupied Units 2010 Total: 304,042
Percent Number of Units
Utility Gas 57.5% 174,824
Bottled Tank or LP 1.1% 3,344
Electric 34.5% 104,894
Fuel Oil 6.1% 18,547
All Other 0.4% 1,216
No Fuel Used 0.3% 912
Totals 99.9% 303,738

28
The average household in Prince George’s contains 2.74 residents. The composition of housing
inventory is shown in Table 15. As discussed, the county’s relatively large household size is very
favorable to SWH economics.
Table 15 Breakdown of household size
Occupied Units 2010 Total: 304,042
Percent Number of Units
No Bedroom 0.9% 2,736
1 Bedroom 12.6% 38,309
2 or 3 Bedrooms 54.3% 165,095
4 or more Bedrooms 32.1% 97,597
Totals 99.9% 303,738
Potential Business Models All solar hot water heating (SWH) business models are derived from the end-user’s ownership of the
system. System ownership is direct, leased, or none. The first two are easily understood. The last, no
system ownership, means that only the end product, hot-water, is owned by the end-user. Hot water as
a service equates SWH to other forms of energy that are metered and sold at retail.
The sellers of SWH services are contractors, retailers or government, and utilities. Each of these parties
can operate in all three ownership modes. The strengths, weaknesses and value proposition of each
combination can be evaluated by considering these main drivers:
Ability to maximize potential market
Realized incentive value,
Access to and cost of capital,
Ability to reduce costs,
Realized and perceived consumer value.
Why Volume Changes Everything Mass deployment will not occur unless the customer value proposition is compelling. Nationally6, other
than VEA, the existing customer value proposition from an economic point of view is non-existent. The
economics will not improve unless there is volume.
Despite the chicken and egg dilemma above, the benefits of building a high volume model include:
Nationally, the only successful SWH program is predicated on volume
Volume is the primary way to reduce equipment costs
Volume enables installers to be installers and not marketers
Volume allows specialization; reducing installation time and uncertainty premium
6 Nationally means the continental US. While Hawaii’s programs are successful, the state’s unique attributes are
not replicable in Maryland.

29
Capital is attracted to larger deals
Volume allows program/marketing costs to be spread over larger base
The presumption that high volume is necessary to obtain a rapid and mass deployment requires a
holistic approach to the program. The typical incentive program/business model is not predicated on
volume and has the results to prove it. Only VEA's model is designed around generating low margins on
high volume installations. Unfortunately, VEA's model cannot be readily replicated as it is designed on
negative margins.
Financing Every examined business model for deploying SWH relies upon consumer financing. This simple
assumption, that SWH is a consumer asset financed by consumer debt, is a major factor in why SWH has
not scaled.
Building a utility scale infrastructure on the back of consumer financing is a fatal flaw for two major
reasons. First, while consumer financing costs are historically low, unless the funds are obtained in
conjunction with the financing of the home, they usually carry high transaction costs, short repayment
terms and high interest rates in comparison to utility cost of capital. While VEA’s model has significantly
softened these attributes, there are few parties like VEA that are willing to absorb the associated costs.
Second, the reliance on consumer financing significantly limits the size of the potential market. Even if it
made sense economically, people may be reluctant to take on a long term personal obligation for
several reasons including: 1) payment term exceeds the expected length of occupancy, 2) lack of equity
in home, 3) weak credit, and 4) tenant occupancy of home. Additionally, current economic conditions
have severely disrupted consumer’s ability to obtain the necessary financing.
To deploy a utility scale infrastructure, you need a utility with utility margins and costs of capital.
Recommendation
Solar Water Heating as a Washington Suburban Sanitary Commission (WSSC) Utility Service
Currently, the method of selling hot water is for one utility to sell the water and another to sell the
energy used to heat water. There is nothing which precludes hot water as being the only product sold.
While novel, in such an “energy as a service” business model, having the local water utility provide hot
water via its owned solar infrastructure is both feasible and practical. With extremely low cost of capital
and existing billing relationships with most county residents, WSSC can be the low cost provider of SWH
services. Therefore, the Task Force recommends that Prince George’s County residents and small
businesses have access to solar heated water as a utility service from WSSC. Utility service is defined as
utility owned equipment, installed on the user’s structure, that provides hot water partially heated by
solar energy and for which WSSC is entitled to reasonable compensation.

30
Recommended Business Model
A business model uses technological characteristics and potentials as inputs, filters them through
customers and markets, and results in economic outputs (26). This is normally done by examining how
the provider can maximize the customer's value proposition and then attempt to capture a portion of
that value for themselves. The ideal model will create a win-win-win proposition for the consumer,
WSSC and the community at large. Our framework for understanding value is defined by:
Value Proposition – What is the value created, both from the customer and WSSC’s
perspectives?
Target Market – Who will benefit, to what extent, and how are revenues generated?
Value Chain – What internal capabilities does WSSC have and what must be obtained externally?
Value Network – How does WSSC fit into the supply chain to customers?
Cost and Earnings – What is the cost structure and profit potential given the value proposition,
chain and network?
Competitive Strategy – How does WSSC maintain its favorable position?
Figure 15 - The Business Model Concept Source: (27)
Value Proposition
Customer
Low cost, renewable, hot water
Immediate monthly savings for electric, propane and heating oil customers
Reduced emissions
Simple, hassle free, utility service
New top-quality water heater – elimination of repair/replacement costs
Ease of purchase
No new financial obligation
Being part of the energy solution
WSSC
Expanded service offering
Capital based rate of return
Commissioning fees
Program fees
Community supported marketing

31
Local, State and National recognition for developing the first successful SWH program in the
continental US
Green halo
Community
Creates jobs
Enables access to SWH for low income households – where the savings are most critical
Reduces emissions – health benefits
Renewable distributed SWH’s generation of energy reduces the cost, and improves the
reliability of electricity
Delays, or eliminates, the need for new electricity generation plants, transmission lines and
distribution upgrades
Target Market
The primary initial target market will be single family and attached residential units that heat their water
with sources other than natural gas and perceive the value proposition as saving money. As previously
shown in Table 14, this suggests that 130,000 Prince George’s County’s households are potential
customers. The primary value obtained is an immediate average $40 monthly savings on their electricity
bill. In a marketing assessment done for VEA, the ideal candidate was defined as households of two or
more with an income in excess of $50,000 (2), a target demographic that is extremely favorable for
Prince George’s County. Assuming that 20% of the households met the above criteria, the VEA
assessment concluded that its market potential, including some commercial systems, was 25% of their
total utility accounts. A similar 25% penetration of Prince George’s County 130,000 non-gas customers
would result in 32,500 systems without any adjustments for the county’s superior demographics,
The secondary target market consists of households that are willing to pay a premium for clean and
renewable energy. Some portion of the 175,000 households using natural gas will perceive the value
proposition as reducing emissions and being part of the energy solution for just a few pennies a day.
The differential between costs of heating water with SWH against natural gas will be a significant
determinant for the penetration percentage.
Value Chain
WSSC’s key strengths and capabilities include:
Access to low cost capital
Credibility in the marketplace
Customer billing is already in place with no major incremental costs
Customer sales and service interfaces
Risk management/Insurance
Sophisticated and large scale purchasing
Repair and maintenance management

32
Key weaknesses and functionality that will need to be obtained:
SWH product expertise |
SWH installation | Can be outsourced to known third parties
SWH repair and warranty |
SWH Marketing/Sales |
Solar Renewable Energy Credit (SREC) off-take or value-capture7
Tax Equity (WSSC is not eligible for Federal Investment Tax Credit (ITC))
Value Network
The five major business components of utility scale SWH are marketing/program management, capital,
equipment, installation and maintenance/warranty service. The utility can influence, or directly control,
lower costs for each via scale and centralized purchasing.
Marketing The number of the potential buyers of SWHS will be determined by access to financing, perceived value
and the ease of purchase. SWH as a utility service eliminates the need for consumer financing, which
greatly expands the potential market size, simplifies the buying process and improves the economics.
These synergistic impacts reinforce each other as sales volume increases, creating a positive feedback
loop. WSSC’s ability to dramatically expand potential users of SWH fundamentally changes the market
dynamics.
Most SWH marketing programs today utilize a shotgun approach to marketing. One sophisticated
program forecasts customer acquisition costs of $1,600 per system and is heavily dependent upon
television and direct mail advertising. WSSC incremental costs of direct mail are trivial. In addition,
WSSC can target high water consumption users with customized estimated savings associated with a
SWH system, greatly increasing the impact of the message.
It is envisioned that WSSC’s creation of a SWH utility infrastructure would be promoted by Prince
George’s County government and community groups. Community driven marketing can significantly
lower the hurdles and costs for marketing SWH. Approaching the build-out of a SWH infrastructure as a
community goal allows grass roots marketing to be effective. Instead of selling SWH as a luxury good,
SWH is positioned as a benefit to the individual and community from financial and environmental
perspectives. In return, by standardizing product offerings, providing quality control and making the
costs affordable, WSSC creates an environment that enables the rapid growth of SWH's benefits
throughout the community.
By developing alternative marketing channels for its SWH solution, WSSC’s trusted solution can create
entrepreneurial and fund-raising opportunities for Prince George's small businesses and community
organizations respectively. Using a client-server computer analogy, WSSC becomes a server capable of
7 For detailed discussions about SRECs, how their value is determined and who is required to have them please
refer to the SREC section of this report and Appendix I.
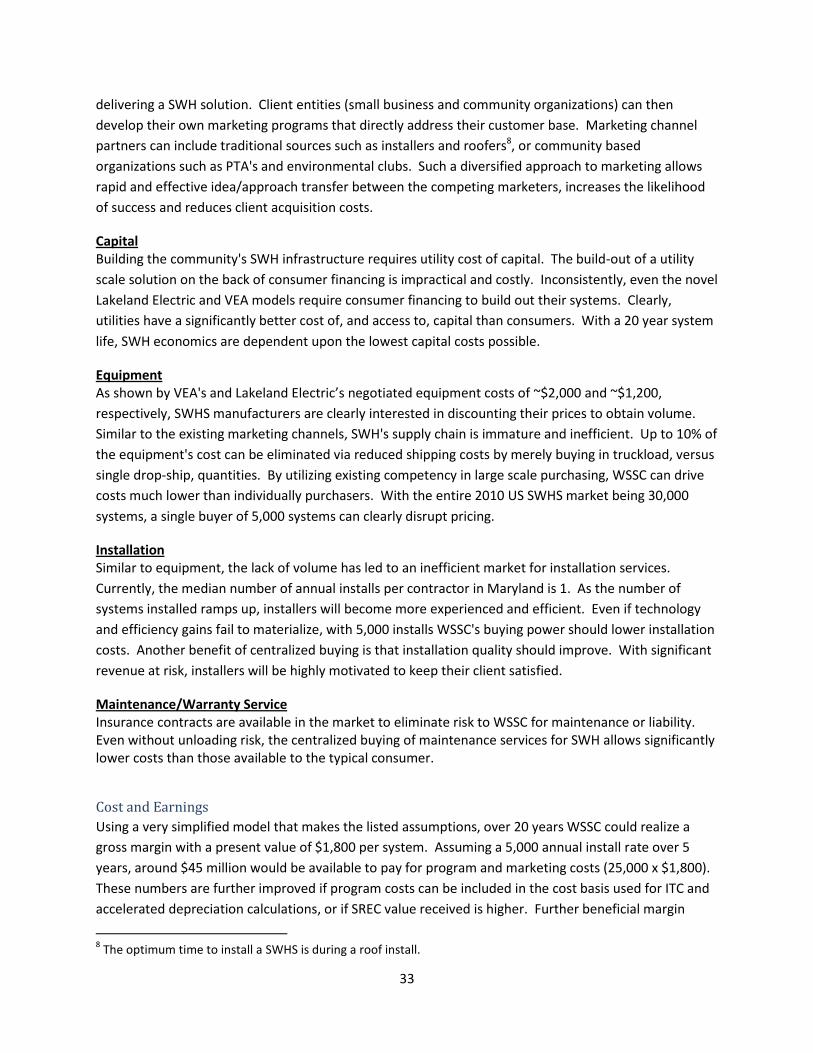
33
delivering a SWH solution. Client entities (small business and community organizations) can then
develop their own marketing programs that directly address their customer base. Marketing channel
partners can include traditional sources such as installers and roofers8, or community based
organizations such as PTA's and environmental clubs. Such a diversified approach to marketing allows
rapid and effective idea/approach transfer between the competing marketers, increases the likelihood
of success and reduces client acquisition costs.
Capital Building the community's SWH infrastructure requires utility cost of capital. The build-out of a utility
scale solution on the back of consumer financing is impractical and costly. Inconsistently, even the novel
Lakeland Electric and VEA models require consumer financing to build out their systems. Clearly,
utilities have a significantly better cost of, and access to, capital than consumers. With a 20 year system
life, SWH economics are dependent upon the lowest capital costs possible.
Equipment As shown by VEA's and Lakeland Electric’s negotiated equipment costs of ~$2,000 and ~$1,200,
respectively, SWHS manufacturers are clearly interested in discounting their prices to obtain volume.
Similar to the existing marketing channels, SWH's supply chain is immature and inefficient. Up to 10% of
the equipment's cost can be eliminated via reduced shipping costs by merely buying in truckload, versus
single drop-ship, quantities. By utilizing existing competency in large scale purchasing, WSSC can drive
costs much lower than individually purchasers. With the entire 2010 US SWHS market being 30,000
systems, a single buyer of 5,000 systems can clearly disrupt pricing.
Installation Similar to equipment, the lack of volume has led to an inefficient market for installation services.
Currently, the median number of annual installs per contractor in Maryland is 1. As the number of
systems installed ramps up, installers will become more experienced and efficient. Even if technology
and efficiency gains fail to materialize, with 5,000 installs WSSC's buying power should lower installation
costs. Another benefit of centralized buying is that installation quality should improve. With significant
revenue at risk, installers will be highly motivated to keep their client satisfied.
Maintenance/Warranty Service Insurance contracts are available in the market to eliminate risk to WSSC for maintenance or liability. Even without unloading risk, the centralized buying of maintenance services for SWH allows significantly lower costs than those available to the typical consumer.
Cost and Earnings
Using a very simplified model that makes the listed assumptions, over 20 years WSSC could realize a
gross margin with a present value of $1,800 per system. Assuming a 5,000 annual install rate over 5
years, around $45 million would be available to pay for program and marketing costs (25,000 x $1,800).
These numbers are further improved if program costs can be included in the cost basis used for ITC and
accelerated depreciation calculations, or if SREC value received is higher. Further beneficial margin
8 The optimum time to install a SWHS is during a roof install.

34
improvements are likely as costs for equipment and installation can reasonably be expected to fall in
subsequent years.
Table 16 - Present Value of Lifetime Cash Flows Assumptions:
1. System life is 20 years 2. Long term cost of capital is 3% 3. Customer charge is $25 per month and never
increases over lifetime 4. No customer charge-offs 5. Lifetime Warranty/Service/Insurance is
purchased upfront for $1,500 6. Federal ITC is calculated at 30% of PV of
system costs and does not include program and marketing costs
7. SRECs are sold for an upfront payment of $600 each (a significant discount)
8. Each system is eligible for 2.5 SRECs (low estimate)
9. No credit for accelerated depreciation 10. No deduction for tax equity partner's
increased required rate of return
Since WSSC cannot take advantage of the Federal ITC or accelerated depreciation, a tax equity partner
(TEP) will need to own the system for the first five (5) years9. There are multiple methods for sharing
ownership of utility assets, including a contracted buy-out, "flip", or arm’s length transaction. In a
contracted buy-out arrangement, a TEP would initially purchase the equipment. In year 6, the
equipment could be sold to WSSC10. A flip transaction refers to the formation of a new entity that is
jointly owned by WSSC and a TEP. During the first five years the TEP would own most of the entity.
After the tax benefits have been realized, the ownership would be flipped to WSSC upon the buy-out of
the TEP. The arm’s length transaction would have no agreed upon terms and would be subject to both
party’s future interests. All but the last transaction are complicated and require professional guidance.
In years 1 through 5, since the TEP would own the system and no WSSC capital would be at risk, WSSC
would only benefit from fees associated with program management and billing. After five years, the
installations during the first year would possess a known and consistent income stream that could be
purchased by WSSC and readily bonded. At a capitalization rate of 6%, the fair market value of the
income stream for a system installed in the first year ($25 per month for 15 years at 6%) is $3,000. Thus,
assuming 5,000 installed systems, WSSC’s capital requirement in year 6 would be $15 million. Given
WSSC’s current 3% bonding cost of capital, the resulting 3% (6% - 3%) net yield spread would produce a
net present value of $3.25 million for the first year’s installs.
9 IRS regulations require the ITC to be recaptured if the qualifying asset is disposed of during a five year period.
10 IRS regulations require that the purchase be at least fair market value at the time of purchase. Thus to some
degree the future sales price is uncertain.
Present value (PV) of system benefits to WSSC
PV of $25 @ 3% for 20 years
$ 4,508
SREC value
$ 1,500
Federal ITC
$ 1,800
PV of Benefits
$ 7,808
PV of system costs to WSSC Equipment
$ 2,000
Installation
$ 2,500
Warranty/Service/Insurance
$ 1,500
PV of Costs
$ 6,000
Net to pay program costs and reserves $ 1,808

35
Other than lower than expected customer adoption, the most significant financial risk is a collapse in the
Maryland SREC value. Several states, notably Pennsylvania and New Jersey, have already experienced a
dramatic drop in their SREC value and the Maryland Energy Administration has suggested that
Maryland’s SREC value may be threatened. Ultimately, the risk of a short-term market imbalance may
be beneficial to SWH. Competing utility scale solar projects, which have comprised the majority of
Maryland’s new solar capacity, are dependent upon high SREC values. As the most cost effective solar
technology, SWH can thrive with SREC values that will make these other projects unfeasible.
Competitive Strategy
Because of WSSC’s competitive advantages of low cost capital and existing customer billing
relationships, the only major competitive threat to this model is a similarly advantaged utility entering
the market. Unlike the gas and electric utilities, WSSC’s existing revenues are not impacted by the
customer’s decision to utilize SWH. With billing relationship with gas and electric customers, WSSC can
cost effectively capture more customers in the service area than any other utility. While Washington
Gas is currently considering options in SWH, their existing customer relationship is with consumers
utilizing natural gas to heat water. The weak economics of SWH against natural gas suggest that their
best alternative is to partner with WSSC as the SREC off-taker and tax equity partner.
Pepco can clearly compete in this space. Pepco has been approached about putting together such a
program but have not expressed any interest to date. Pepco does have existing relationships with most
customers in the WSSC service area; however, existing revenues are decreased by SWH. Additionally,
Pepco's subsequent entry into the market would not benefit from the initial County and community out-
reach programs that will be put into place for WSSC.
While a competitor could potentially develop a lower cost for SWH utility service, it would be difficult
and unlikely to possess enough margins to pay for the program costs. Being the first mover, WSSC will
benefit by establishing the competitive price and the envisioned community support. As alternative
marketing channels (Sierra Club, Neighborhood Associations and roofers) develop, it will be increasingly
difficult for another competitor to establish the volume to achieve the necessary economies of scale.
Adding Value Through Research and Development
As the birthplace of commercial SWH, Maryland once had the leadership role in SWH. Restoring our
leadership position has clear benefits to Maryland’s residents and the economic vitality of SWH. By
leveraging our universities, Maryland can make a meaningful impact in the public’s understanding of
SWH’s inherent value while greatly expanding SWH’s potential benefits and lowering their costs.
Prove Real World Energy Savings
There is a surprising lack of data on real world performance of SWH; more so for Maryland specific data.
Even the nationally recognized SWH certification authority uses primitive data to model expected
performance. With a relatively modest investment, Maryland can establish the benchmarks and data
that allow accurate energy savings forecasts. Moving this new found and proven knowledge into the
collective consciousness is central to mass acceptance of SWH.

36
Invest in SWH Installation Technology Development
While increased penetration of photovoltaics has greatly improved their installation technology and
lowered costs, these gains have not transferred to SWH. Developing technology through Maryland’s
Universities that lowers SWH’s installed costs directly benefits Maryland residents and has the potential
to generate licensing revenue.
Leverage Established University of Maryland (UMD) SWH Technology
A fundamental issue with SWH is the high capital costs compared to the relatively small annual energy
savings. Two complimentary approaches can be used to address this issue. The first, lowering capital
costs is readily apparent. The second is to increase the possible uses of SWH. UMD has applied for a
patent on their liquid desiccant waterfall that helped them win the 2011 Department of Energy Solar
Decathlon. Their technology uses SWH to remove humidity from indoor spaces, greatly reducing the
energy required for air conditioning. The combination of lower capital costs and increased energy
savings holds real potential to drive mass-deployment.

37
Works Cited
1. Cliburn and Associates, LLC. Solar Water Heating Best Practices and Economics for Electric
Cooperatives. s.l. : Cooperative Research Network, 2008.
2. Cliburn and Associates, LLC. Solar Water Heating Best Practices and Economics for Electric
Cooperatives. 2008.
3. Itron, Inc. Solar Water Heating Pilot Program: Final Evaluation. 2011.
4. California PG&E. [Online] [Cited: Sept 14, 2011.]
http://pge.com/about/environment/calculator/assumptions.shtml.
5. Optimizing and Integrating Solar Systems in Buildings. Christensen, Craig, et al. Baltimore : NREL,
2002.
6. DOE. Building America - DOE. Energy Efficiency and Renewable Energy - DOE. [Online] [Cited: Sept 19,
2011.] http://apps1.eere.energy.gov/buildings/publications/pdfs/building_america/26465.pdf.
7. Lawrence Livermore National Lab and DOE. LLNL US Energy Flow 2009. LLNL.gov. [Online] 2010.
https://flowcharts.llnl.gov/content/energy/energy_archive/energy_flow_2009/LLNL_US_Energy_Flow_
2009.png.
8. Database, Maryland Energy Administration - Salesforce. Query on Prince George's grants for SWH.
August 2011.
9. Cassard, Hannah, Denholm, Paul and Ong, Sean. Break-even Cost for Residential Solar Water Heating
in the United States: Key Drivers and Sensitivities. NREL. [Online] 2011. [Cited: 7 22, 2011.]
http://apps1.eere.energy.gov/buildings/publications/pdfs/ush2o/48986.pdf.
10. An alternative method to load modeling for obtaining end-use load profiles. Colson, C. and M. H.
Nehrir. Starksville : s.n., 2009.
11. NAHB Research Center, Inc. Domestic Hot Water System Modeling for the Design of Energy Efficient
Systems. s.l. : NREL, 2002.
12. SRCC. Solar Facts. SRCC. [Online] 2011. [Cited: October 20, 2011.] http://www.solar-
rating.org/facts/system_ratings.html#OG300.
13. Low-Cost Cold Climate Solar Water Heating Roadmap Webinar. Goetzler, Bill. DOE Webinar : DOE -
EERE, 2011.
14. Byrom, Billy. CEO, Alternative Energy Technologies. July 29, 2011.
15. EIA. SolarThermal Collector Manufacturing Activities 2009. s.l. : U.S. Energy Information
Administration, 2010.

38
16. Building Specialists Inc. Report on the Analysis of Field Data Relating to the Reliability of Solar Hot
Water Systems. s.l. : Sandia National Labratory, 2011.
17. PJM. Generational Assets Tracking System (GATS). 2011.
18. Lucas, Kevin. Solar Industry Update, September 8, 2011. s.l. : MEA, 2011.
19. SREC Trader - Current Prices. SREC Trade. [Online] [Cited: Sept 22, 2011.]
http://www.srectrade.com/srec_prices.php.
20. Wisconsin’s Co-op’s program, Focus on Energy. Power point presentation - current status. July 2011.
21. Solar Thermal Incentive Database. Go Solar California - Solar Thermal. Sept 19, 2011.
22. Colan, Carlos and Curry, Jeff. Annual Solar Thermal Collector Program in Florida. s.l. : Florida Solar
Energy Center, 2002.
23. Mackler, Howard. President, WePower. September 10, 2011.
24. Interstate Renewable Energy Council. US Solar Market Trends 2010. [Online] 2011. [Cited: July 22,
2011.] http://irecusa.org/wp-content/uploads/2011/07/IREC-Solar-Market-Trends-Report-
revised070811.pdf.
25. Energy Information Agency. Solar Thermal Collector Manufacturing Activities 2009. EIA. [Online]
January 2011. [Cited: August 2, 2011.]
http://www.eia.gov/cneaf/solar.renewables/page/solarreport/solar.html.
26. Chesbrough, H and Rosenbloom, R. The Role of the Business Model in Capturing Value from
Innovation. Industrial and Corporate change. Vol. 11, 3, p. 552.
27. Simmons, John and Taylor, Mike. Utility Solar Business Models: Emerging Utility Strategies &
Innovation. s.l. : SEPA, 2008.
28. PSC. 2011 Annual Compliance Report. [Online]
http://webapp.psc.state.md.us/Intranet/Reports/MD%20RPS%202011%20Annual%20Report.pdf.
29. Industry Review: Low-Cost Cold Climate Solar Water Heating Roadmap. Goetzler, William. s.l. : DOE -
EERA, 2011.
30. Denholm, Paul. The Technical Potential of Solar Water Heating to Reduce Fossil Fuel Use and GHG
Emissions in the US. s.l. : NREL, 2007.

39
APPENDIX 1 - Solar Renewable Energy Credit (SREC)
Background Maryland significantly strengthened its commitment to the RPS model with the passage, in the 2010 Legislature, of the Administration sponsored Senate Bill 277 and House Bill 471 - Renewable Energy Portfolio Standard - Solar Energy. Shown below are the percentages of electricity required to be provided by solar before and after this legislation. Also shown is the new and old penalty for non-compliance, the alternative compliance payment (ACP). Each year, the amount of electricity required to be generated, and what actually was generated, for each type of renewable energy is determined by the Maryland Public Service Commission (PSC). For each megawatt-hour (MWh) of electricity that was not properly generated, an ACP must be paid to the Strategic Energy Investment Fund (SEIF). Maryland’s RPS Solar Carve Out and ACP as amended 2010 SB277/HB471 Year Solar %
(prior to 2010)
Solar %
(amended)
Solar ACP
(prior to 2010)
Solar ACP
(amended)
2011 0.040% 0.050% $350 $400
2012 0.060% 0.100% 350 400
2013 0.100% 0.200% 300 400
2014 0.150% 0.300% 300 400
2015 0.250% 0.400% 250 350
2016 0.350% 0.500% 250 350
2017 0.550% 0.550% 200 200
2018 0.900% 0.900% 200 200
2019 1.200% 1.200% 150 150
2020 1.500% 1.500% 150 150
2021 1.850% 1.850% 100 100
2022 2.000% 2.000% 100 100
2023 2.000% 2.000% 50 50
2024 2.000% 2.000% 50 50
2025 2.000% 2.000% 50 50
2026 2.000% 2.000% 50 50
2027 2.000% 2.000% 50 50
Table 5 - RPS Solar Carve out and Penalty before and after
Players After the deregulation of electricity generation the “Electric Company” has been split into several organizations with specific functions and roles in the electric market. Figure 5 shows the participants in Maryland’s electricity generation and distribution market:
Load Serving Entities (LSE) – are in the business of producing electricity usually on a large scale. Includes coal and nuclear, as well as renewable energy as sources of power generation.
PJM Interconnection, LLC (PJM) [Pennsylvania, Jersey, Maryland] – the operator of electricity transmission for 13 states and the District of Columbia. PJM is charged with the overall reliability of the transmission system, the administration of the competitive wholesale electricity market, as well as operating a spot market for wholesale power transactions for short-term (hourly) electricity.
Public Service Commission of Maryland (PSC) – regulator of electricity in Maryland. Their principal focus is to ensure the reliability of Maryland’s electric supply. The PSC supervises the wholesale auctions that determine the pricing of Standard Offer of Service (SOS) electricity.

40
Distributers – often considered the electric company. These entities own and operate the Maryland electrical grid that distributes electricity to the end user. They provide SOS electricity to the end user.
Supplier – a competitive provider of electricity service who may take title to, or just broker, the electricity that it sells to the end user.
Small Solar Power Generators (SSPG) – homeowners and businesses that generate power from the installation of photovoltaic panels (PV) or solar water heaters (SWH). For all practical purposes, all of this power is consumed by the end user.
Aggregator – third party that is free to buy and sell SRECs to any interested party. The following graphic shows how all these parties are interconnected.
Figure 1 - How Electricity Players are connected
Renewable Energy Portfolio Standard A renewable energy portfolio standard (RPS) requires a certain amount of energy to be generated from renewable sources. It differs from a goal in that it: 1) assigns responsibility for achieving the requirement to a specific party11 and 2) creates a penalty for failure to obtain the requirement. Each megawatt-hour (MWh) of electricity produced by a targeted renewable source is eligible for the issuance of one Renewable Energy Credit (REC). Maryland defines its renewable energy goal as a percentage of the annual retail sales of electricity.12 Each year, RECs equal to the renewable energy goal defined by the RPS must be presented by the obligated party to the PSC and retired, or a compliance fee, known as an alternative compliance payment (ACP), is assessed. In Maryland, the obligated party is the LSE.
11
The specific party is known as either the obligated or compliance party 12
In 2008 – the last report available- there was 64 million MWh of retail electricity sales, of which 5 million MWh were exempt. Most of the exempted amount was for industrial loads over a certain threshold or sales through certain electric co-ops.

41
The Legislature placed a special emphasis on supporting solar energy and a portion of the overall goal was “carved-out”. Solar Renewable Energy Credits (SRECs) are those RECs specific to the solar carve-out. To further show the importance of solar energy, the Legislature set the solar ACP at over 20 times the penalty for other renewable sources. Effective 1/1/2012 all solar power generation must be located within Maryland’s borders to be eligible for a SREC. The purpose behind the creation of a REC is to create a string of payments that defray the costs of developing the power generation. The renewable energy generator’s sale of the REC to the obligated party would create a long term incentive to the generator. Maryland’s solar RPS legislation intended that the LSE provide the small-scale solar power generator financing via an upfront payment for long-term contracts of the small solar generator’s SRECs. The value of a SREC is ultimately determined by the price the LSE (obligated party) is willing to pay. The theory is that a SREC scarcity will lead to prices close to the ACP, while a glut could drive the value close to zero. Because an ACP can be paid instead of the retirement of a SREC, the market value of a SREC is effectively capped at the alternative compliance payment (ACP). Today, other than the cap, and the number of SRECs required annually, the state has little influence on the value of the SREC, with a resulting uncertainty of SREC market value. The uncertainty creates issues in both the forecast of electricity prices impact on ratepayers and the ability of small generators to obtain financing of solar power generating assets.
Lifecycle of an SREC
The following list outlines the creation, awarding and retirement process of a Maryland small-scale SREC:
Solar generator builds solar water heating (SWH) project;
Solar generator applies to PSC for certification as a Solar Tier 1 renewable energy facility;
Solar generator applies to establish an account with a PSC authorized solar renewable energy credit tracking system in its name not later than 30 days after PSC certification of the renewable energy facility;
Solar generator certifies, using PVWATTS or revenue-quality meter, energy production at least annually;
One Solar Renewable Energy Credit (SREC) is awarded by the credit tracking system for each MWh of energy production so certified;
Solar generator offers to sell their SRECs to any LSE (obligated parties);
The solar generator is free to sell their SRECs to any third party if no offers from an LSE are received (under the regulated terms);
An aggregator (third party) buys the SRECs from the solar generator and then attempts to resell them to an LSE;
The PSC requires an LSE to produce an annual report certifying that a certain percent of their electricity used for retail delivery is met via solar
o Proof of compliance is shown by the submission of individual SRECs against the annual requirement and the associated SRECs are retired by the credit tracking system;
Should the LSE be unable to produce SRECs sufficient to meet the requirement, the LSE is responsible for the payment of the ACP to the SEIF for each missing MWh.

42
SREC Trading
PJM-Energy Information System’s (PJM-EIS) Generation Attributes Tracking System (GATS) is the PSC
authorized system used for tracking the SREC’s status, ownership, transaction price and dates of
transfer. Efforts to create a “true” marketplace for SRECs include: (USPV, Inc 2010)
Auction Platforms Platforms including SRECTrade and EnviroTrade, offer monthly auctions where offers and bids are matched and a clearing price determined. Results have been disappointing with SRECs being sold for $325 in April, 2010, almost 20% lower than the expected sales price to the LSE. Exchanges Flett Exchange offers the only open and transparent real-time marketplace for Maryland SRECs today. This exchange’s value has been limited due to extremely low transaction levels. Spot Market Sales The spot market, the matching of buyers and sellers via existing relationships, is where the vast majority of transaction takes place.

43
Appendix II - Destination state for Solar Thermal Collectors

44
Appendix III - Solar Thermal Collector Average Costs for 2008 & 2009