University of Heidelberg Department of Economics · University of Heidelberg ... Chair for...
35
University of Heidelberg Discussion Paper Series No. 538 482482 Department of Economics Enhancing Foreign Direct Investment via Transparency? Evaluating the Effects of the EITI on FDI Maya Schmaljohann January 2013
Transcript of University of Heidelberg Department of Economics · University of Heidelberg ... Chair for...

U n iver s it y o f He id e lbe r g
Discussion Paper Series No. 538 482482
Department of Economics
Enhancing Foreign Direct Investment via Transparency? Evaluating the Effects of the EITI on FDI
Maya Schmaljohann
January 2013

*Heidelberg University, Alfred Weber Institut, Chair for International and Development Politics, Prof. Dr. Axel Dreher, Bergheimer Straße 56, 69115 Heidelberg, Germany. Phone:+49 6221 54 31 72, [email protected]
Enhancing Foreign Direct Investment via Transparency?
Evaluating the Effects of the EITI on FDI
Maya Schmaljohann*
January 2013
ABSTRACT
The so called resource curse, the fact that countries rich in natural resources often show lower
rates of economic growth compared to resource-poor countries, is commonly attributed to the
low quality of governance in resource-rich countries. The Extractive Industries Transparency
Initiative (EITI) was founded in 2003 to address this problem through increasing the quality
of the public financial management of resource flows. By joining this initiative, governments
show their willingness to reform and to improve their governance. As the quality of
governance is an important factor for investors in deciding where to invest, this signal has the
potential to improve a country’s appeal for foreign direct investment (FDI). This study shows
in a panel of 81 countries that joining the EITI increases the ratio of FDI inflows to GDP on
average by around two percentage points. This is a remarkable increase given that the average
ratio of FDI inflows to GDP in the sample is five percent. The results are robust when
controlling for selection bias due to the voluntary decision to join the initiative and possible
endogeneity of the candidate variable.
JEL: F21, O19, O23, Q32, Q37, Q38
Keywords: FDI, EITI, Corruption, Natural Resources
Acknowledgements: I would like to thank Axel Dreher, colleagues from the chair for International
and Development Politics, participants of the Nordic Conference in Development Economics
(Gothenburg 2012) and participants of the PEGNet Conference (Dakar 2012) for valuable comments
and suggestions. I thank Jamie Parsons for proof-reading.
2
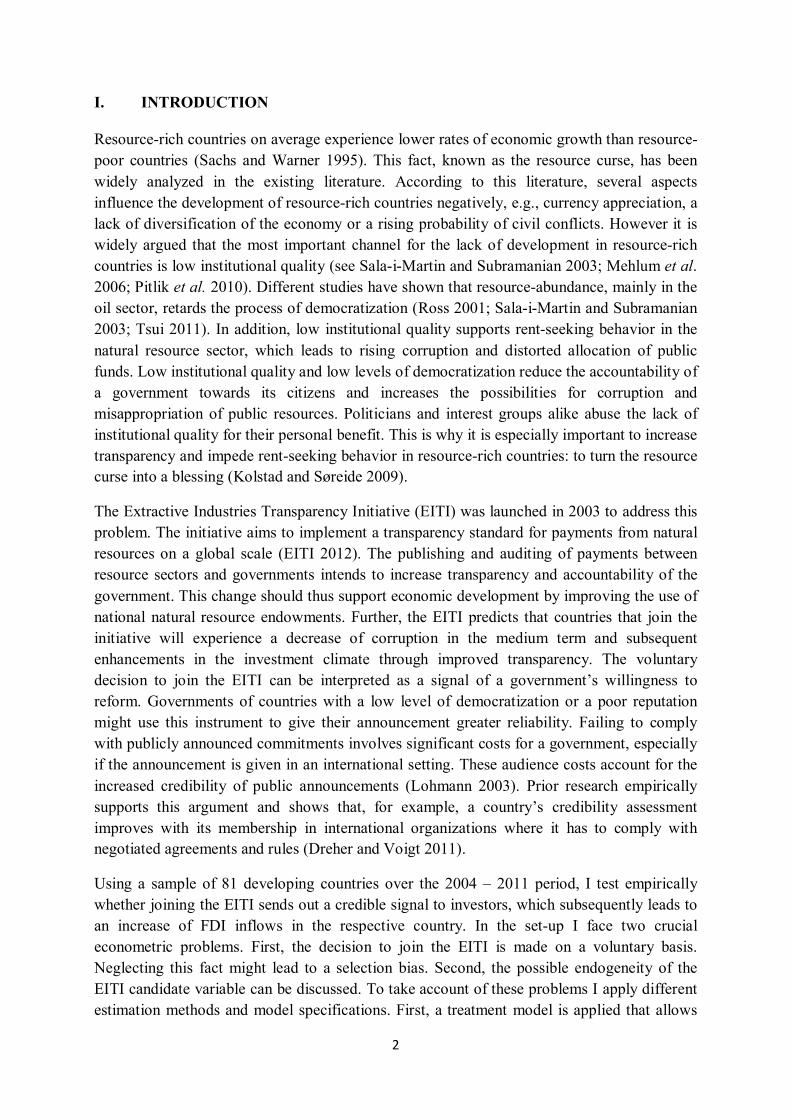
I. INTRODUCTION
Resource-rich countries on average experience lower rates of economic growth than resource-
poor countries (Sachs and Warner 1995). This fact, known as the resource curse, has been
widely analyzed in the existing literature. According to this literature, several aspects
influence the development of resource-rich countries negatively, e.g., currency appreciation, a
lack of diversification of the economy or a rising probability of civil conflicts. However it is
widely argued that the most important channel for the lack of development in resource-rich
countries is low institutional quality (see Sala-i-Martin and Subramanian 2003; Mehlum et al.
2006; Pitlik et al. 2010). Different studies have shown that resource-abundance, mainly in the
oil sector, retards the process of democratization (Ross 2001; Sala-i-Martin and Subramanian
2003; Tsui 2011). In addition, low institutional quality supports rent-seeking behavior in the
natural resource sector, which leads to rising corruption and distorted allocation of public
funds. Low institutional quality and low levels of democratization reduce the accountability of
a government towards its citizens and increases the possibilities for corruption and
misappropriation of public resources. Politicians and interest groups alike abuse the lack of
institutional quality for their personal benefit. This is why it is especially important to increase
transparency and impede rent-seeking behavior in resource-rich countries: to turn the resource
curse into a blessing (Kolstad and Søreide 2009).
The Extractive Industries Transparency Initiative (EITI) was launched in 2003 to address this
problem. The initiative aims to implement a transparency standard for payments from natural
resources on a global scale (EITI 2012). The publishing and auditing of payments between
resource sectors and governments intends to increase transparency and accountability of the
government. This change should thus support economic development by improving the use of
national natural resource endowments. Further, the EITI predicts that countries that join the
initiative will experience a decrease of corruption in the medium term and subsequent
enhancements in the investment climate through improved transparency. The voluntary
decision to join the EITI can be interpreted as a signal of a government’s willingness to
reform. Governments of countries with a low level of democratization or a poor reputation
might use this instrument to give their announcement greater reliability. Failing to comply
with publicly announced commitments involves significant costs for a government, especially
if the announcement is given in an international setting. These audience costs account for the
increased credibility of public announcements (Lohmann 2003). Prior research empirically
supports this argument and shows that, for example, a country’s credibility assessment
improves with its membership in international organizations where it has to comply with
negotiated agreements and rules (Dreher and Voigt 2011).
Using a sample of 81 developing countries over the 2004 – 2011 period, I test empirically
whether joining the EITI sends out a credible signal to investors, which subsequently leads to
an increase of FDI inflows in the respective country. In the set-up I face two crucial
econometric problems. First, the decision to join the EITI is made on a voluntary basis.
Neglecting this fact might lead to a selection bias. Second, the possible endogeneity of the
EITI candidate variable can be discussed. To take account of these problems I apply different
estimation methods and model specifications. First, a treatment model is applied that allows

3
separate modeling of the decision to join the EITI. Modeling the decision process solves the
problem of a selection bias but cannot solve the problem of possible endogeneity due to a
third factor influencing both: EITI membership and FDI inflows. Due to the fact that the
timing of becoming EITI candidate cannot be perfectly controlled by the applying
government and the time lag between the countries’ decision to join the initiative and the
official approval by the EITI this risk seems however insignificant. Nevertheless I further
control for factors potentially influencing the dependent variable and the EITI candidate
dummy simultaneously. In addition I evaluate the effect of the government’s announcement to
be willing to join the EITI, which is more likely to coincide with other factors leading to an
increase in FDI flows. The results stay robust to these additional controls. Foreign direct
investment increases in countries joining the EITI on average by around two percentage
points. The government’s announcement that it is willing to implement the EITI standard is
not enough by itself to have an effect on FDI inflows. This supports the assumption that the
EITI provides governments with an additional source of credibility. Countries joining the
EITI are thus not only able to benefit from increased income from the resource-sector by
reducing corruption and fraud through the implementation of the EITI standard, but also from
the ameliorated perception of foreign investors.
This paper is structured as follows. In the following section two, the Extractive Industries
Transparency Initiative will be introduced with its organization and rules. Section three
focuses on the connection between the EITI and FDI, which motivates the research question.
In that section, first, important factors for the investment decision will be discussed followed
by how these are influenced by the EITI. Further, the section gives an overview on the
literature on signaling. The fourth section describes the estimation set-up as well as the
strategy to present the results of the estimation. The final section concludes and draws policy
implications from the findings.
II. THE EXTRACTIVE INDUSTRIES TRANSPARENCY INITIATIVE
“3.5 billion people live in resource-rich countries. Still, many are not seeing results from
extraction of their natural resources. And too often poor governance leaves citizens suffering
from conflict and corruption. The EITI was formed to change this.”
EITI 2012.
The Extractive Industries Transparency Initiative was launched in 2003, a year after Tony
Blair announced plans for its founding at the World Summit for Sustainable Development in
Johannesburg 2002. The aim of the initiative is to fight the often-observed lack of
transparency in the management of natural resource income by the public sector. This lack of
transparency and the general low quality of governance in resource-rich countries is seen as
the main reason for the low economic performance and development of many resource-rich
countries today (Sala-i-Martin and Subramanian 2003; Mehlum et al. 2006; Pitlik et al. 2010).
The EITI can be seen as the keeper of a transparency and good governance standard in the
resource sector. It is a multilateral organization that consists of an international secretariat
based in Oslo, the EITI Board, and the multi-donor trust fund (MDTF) that is administered by

4
the World Bank. Members of the EITI are the governments of implementing and supporting
countries, companies and investors in the resource-sector as well as civil society groups. The
EITI Board is the executive organ of the initiative and consists of twenty members: nineteen
members that represent all stakeholder groupings within the EITI and the EITI chair. Board
elections are held every two years during the ordinary member meeting in which all the
members vote. The Board meets at least two times a year. The EITI chair is elected during the
same meeting for a two-year term that can be extended to a second term. Besides chairing the
Board and member meetings, the EITI chair’s function is to represent the EITI Board in
external matters. The first chair of the EITI was Peter Eigen, the founder of Transparency
International.
The MDTF is currently supported by thirteen donors1 and had received over 35 million US
dollars by the end of 2010. The MDTF provides technical and monetary assistance to
countries that are on the way to implement the EITI standard or plan to join in order to fulfill
this task. Technical assistance includes the help of consultants in implementing the EITI’s
standard as well as sharing international best practices. By the end of 2011, 35 countries (see
A1, appendix) had implemented the EITI.
The member countries of the EITI can be divided into supporting countries and implementing
countries. The former are those countries that support the idea of a global transparency
standard for resource-rich countries and want to support the implementation of this standard
although they may not necessarily be resource-rich themselves. Implementing countries are
those resource-rich countries that decide to comply with the standard. They show this by
implementing the six basic requirements the EITI has set up. These requirements (see A2,
appendix) include the regular reporting of payments by the resource-sector to the government
and the revenues received by the government from the resource-extracting companies. These
payment reports have to fulfill international auditing standards and are verified by an
independent auditor. Furthermore, the civil society should be included in public dialogue and
the process of transparency enhancement. The first step to implementing the EITI is for an
implementing country to set up a working group consisting of politicians, company
representatives of the resource sector and civil society groups. This group then develops a
working plan on how to implement these requirements including a timeline and budgeting.
Once this task is completed the country sends an official form to the EITI stating its intention
to implement the EITI standard. The EITI board then verifies whether the working group and
working plan meet its requirements and, based on this decision, declare whether or not the
country is a candidate country. A successful candidate country has 18 months to publish its
first EITI report containing the audited payments between the resource-sector and the
government. Furthermore it has a total of two and a half years to complete the validation
process. This process verifies the accurate fulfillment of the basic requirements. A country
that successfully completes this validation process becomes a compliant country. The
maintenance of this status depends on the continuing application of the EITI standard and
criteria, which is assessed at least once every 5 years. If a country fails either to publish the
EITI report or to complete the validation process in time, it may be granted a deadline
1 Australia, Belgium, Canada, European Union, Finland, France, Germany, Netherlands, Norway, Spain, Switzerland, United Kingdom, United States of America.

5
extension. If the Board observes behavior contradicting the EITI principles or has doubts that
the country is willing or able to fulfill the requirements, its candidate or compliant status can
be suspended. This has occurred to both Yemen and Madagascar. The latter is still
suspended.2 By now, 36 countries have become implementing countries of which 14 have
achieved compliant status (see appendix).
III. FOREIGN DIRECT INVESTMENT AND THE EITI
One of the basic problems leading to the economic difficulties of developing countries is the
lack of capital and savings needed for growth-spurring investments. Foreign direct
investments have become the preferred source of external finance for developing countries to
fill this gap between domestic savings and investment for two main reasons: they are a less
volatile source of capital and have the possible additional advantage of knowledge transfers
which would also spur growth (e.g., Borensztein et al 1998; Jensen 2003). These advantages
are recognized internationally by both international institutions as well as developed and
developing countries themselves. In the UN Millennium Declaration the signing states
explicitly named foreign direct investments as potentially providing the means to face the
special needs of Africa.3 Many governments offer special treatments like tax exemptions to
multinational enterprises to attract more investments. Hence the flow of FDI to low and lower
middle income countries has steadily increased during the last decade and since 2006 the
amount of FDI inflows have surpassed the amount of official aid flows (see Figure 1,
appendix).
What determines FDI?
Foreign direct investments aim at establishing a long-term business relationship with an
enterprise in the host country. The incentives to establish this relationship differ based on the
aims of the investor. First, the investor might want to reduce his production costs or get better
access to natural resources that are needed in the production process of an existing good. In
this case the investment is of the so-called vertical type and aims at reducing production costs
and increasing the security of the chain of production. The final produced good is not made
for the local market but for export to other markets. This vertical investment is the dominant
form of FDI between high-income and developing countries. The second type of FDI is
horizontal. In this case, production of a good in the investor’s country is duplicated in the host
country and the investment aims at accessing a new market. As opposed to vertical
investment, the good here is produced for the local market. This type of FDI is especially
relevant if exports to the host country are too expensive due to, for example, trade restrictions
or highly-bureaucratized import procedures. These additional costs for imports make
producing locally more attractive.
These initial reasons reflect some determinants for the level and type of FDI, for example the
presence of high trade restrictions. If it is harder or costlier to export goods to a country than
2 Madagascar has been suspended because the EITI Board does "not believe that the relationships necessary for effective EITI implementation in Madagascar are currently possible and capable of being sustained.” 3 See UN RES A/res/55/2. See: http://www.un.org/millennium/declaration/ares552e.htm accessed on
10/09/2012.

6
to invest there and build up a production process an investor will probably decide in favor of
FDI. This is of course reliant upon the recipient country’s market potential. As in the first
case, another possible reason for FDI is the availability of natural resources, e.g., oil or special
minerals and ores, which the investor wants to extract. Apart from these basic factors of
resource endowments and trade restrictions that determine the attractiveness of a country to
foreign investors, there are other factors that influence the investment climate and the final
decision to invest. The investment climate is shaped by factors that influence the achievable
rate of return. This depends to a large extent on the risks and quality of governance and
institutions an investor faces in the respective country.
Political uncertainties, risk of expropriation, risk of social and political unrest, corruption or
low bureaucratic quality are examples of factors that influence the cost of investment.
However it is not always clear whether these factors positively or negatively influence the
decision. The costs of corruption for example can be seen in two different ways. On the one
hand corruption increases the cost of an investment as it leads to additional costs in the forms
of bribes to officials. On the other hand corruption might facilitate an investment as
bureaucratic processes can be accelerated (“greasing the wheels”) allowing for faster and
easier access to natural resources, for example through paying for extraction licenses rather
than applying for them. The empirical evidence on this is mixed. Wei (2000) shows that
foreign direct investment flows are significantly reduced if corruption rises. Accordingly a
rise in corruption from the level of Singapore to that of Mexico would decrease the FDI
inflow to the same extent as an eighteen to fifty percentage point increase of the tax rate. Not
only the amount of FDI flows is influenced by the degree of corruption but also the initial
decision whether to invest in a certain country (Barassi and Zhou 2012). On the other hand
Egger and Winner (2005) present empirical support to the hypothesis that higher levels of
corruption can partially explain the growth of FDI stocks in developing and less developed
countries. They argue in favor of the hypothesis that corruption might work as an incentive
for investment. Thus both, the empirical and the theoretical evidence on the effect of
corruption on FDI is ambiguous.
Apart from corruption, other indicators of the quality of governance such as bureaucratic
efficiency, law and order or democratic accountability also influence the investment climate.
Busse and Hefeker (2007) show that the quality of these indicators is positively related to
FDI. But again the empirical evidence is ambiguous. As with corruption, a lower quality of
governance or bureaucracy might also have positive side-effects for investors. Asiedu and
Lien (2011) show that for resource-rich countries the impact of democratic regimes seems to
be different than for resource-poor countries. According to their study, for countries with a
very high share of natural resource exports to total merchandise exports (>50%) democracy
seems to be less attractive for foreign investors. Put differently, for less resource-dependent
countries, democracy seems to support FDI inflows, whereas for resource-poor countries
democracy does not promote investment behavior. Investments in the natural resource sector
are related to high sunk costs for setting up the needed infrastructure to extract the resources.
In such countries, investors therefore prefer a stable political environment. As government
changes are more frequent in democracies, investors might favor stable autocracies instead.
Furthermore, the government usually intensively controls the natural resource sector.

7
Autocracies might provide an investor with more possibilities to establish close ties with the
government and thus sway decisions to its own interest. In addition, the judgment on what a
good investment climate is depends on competition for investments. In times when many
investors look for investments abroad, for example due to low interest rates, they seem to care
less about the political risk in the host country (Méon and Sekkat 2012) compared to times
with a lower urge for FDI.
How can the EITI influence FDIs?
Countries, especially developing countries that are competing for FDI can influence investor
decisions by providing a favorable institutional surrounding. The EITI argues that by
improving transparency and the government’s accountability a country can enhance its
investment climate and thus attract more investors (EITI 2005). Countries joining the EITI
can expect to enjoy the two-fold effect of increased levels of FDI as well as the increased
amount of revenues from the resource sector with the decreased chance for this money to be
subject to fraud or misappropriation. However, some time is needed before the positive effects
of the EITI on corruption and government transparency can become effective. As explained
before, a country must first set up a working group and an implementation plan before
becoming a candidate country and then starting to publish and audit the payments between the
resource and the public sector. Nevertheless one can argue that the action of joining the EITI
alone sends a positive signal of willingness to reform and ameliorates the quality of
governance in the eyes of investors (see EITI 2005; Pitlik et al. 2010). But why should
investors pay attention to a signal like becoming EITI candidate country in the absence of real
reforms being implemented? This can be attributed to the “audience cost” (Lohmann 2003).
Pledges made in the international arena are considered as being more reliable by investors as
failure to meet these commitments can result in international political or economic pressure
being placed on the announcing government. This audience, which is greater than if the
announcement of intentions was made locally or unofficially, can consist of domestic voters,
foreign governments, international organizations and investors. Political pressure can be
executed by demonstrations, reelection threat or, on the international level, by threatening
with sanctions or even military intervention supported by the United Nations Security
Council. At the domestic level the political costs are influenced by the political regime. In
autocracies the domestic costs are clearly lower than the international costs. Fang and Owen
(2011) therefore argue that the use of international institutions and arrangements might be an
instrument by which non-democracies can make internationally accepted commitments. As in
autocracies the domestic costs of failing to fulfill announcements is low, the credibility of
these announcements is low. The international audience and the possibilities to punish
misbehavior might thus work as a mechanism to make commitments credible for countries
that are otherwise lacking credibility. This situation therefore potentially makes the EITI a
very important initiative.
Empirical evidence supports the hypothesis that investors indeed care for these kinds of
signals. The IMF is a widely studied example (see, e.g., Bird 2002; Bird and Rowlands 2008;
Biglaiser and DeRouen 2010; Bauer et al. 2012). Countries that implement IMF programs
have to implement the attached structural adjustment conditions as well. Investors take these
reforms as the right way to ameliorate the economic fundamentals and to put the local

8
economy back on track. Furthermore the implementation of the conditions is likely as the
country faces the risk that future loan tranches will not be delivered or the organization even
restraints from giving further credits to the country if it fails to fulfill the conditions. Investors
can trust in the implementation of reforms due to the attached costs of failure for the recipient
country. Biglaiser and DeRouen (2010) show that US investors use this information to assume
amelioration in the economic situation of the recipient country and respond by increasing their
FDI to those countries. The increased faith in a country becoming an IMF loan recipient
depends both on the likelihood that it will be reprimanded for failing to comply with its
conditions and its regime type. For instance, those countries that implement programs under
the Poverty Reduction and Growth Facility (PRGF) do not receive a similar increase in FDI
inflows. Investors know that the respective countries are so poor that the IMF is trapped in the
Samaritan dilemma and will not punish the country if it does not comply. In terms of regime
type, in a recent study, Bauer et al. (2012) show that the reliability of the IMF loan-recipient
signal depends on the regime in the recipient country. Only democratic countries can commit
themselves in a trustworthy way to the implementation of IMF conditions. Accordingly,
acceptance of loans from the IMF has a catalytic and FDI-enhancing effect but only in
democratic countries. This finding contradicts, to some extent, that of Fang and Owen (2011)
who see the credibility-enhancing effect of international commitments as being especially
strong for non-democracies.
The signaling effect of international commitments has not only been studied for the IMF.
Dreher et al. (2010) and Dreher and Voigt (2011) show that membership in international
institutions like the International Centre for the Settlement of Investment Disputes (ICSID) or
the signing of the optional protocol on the abolition of the death penalty also have credibility-
and FDI-enhancing effects. The country risk rating is one of the most important pieces of
information determining investment decisions, with increases in rating being linked to higher
rates of investment into the economy. This number has been found to significantly improve
with membership in international organizations, especially those that include punishing
mechanisms. The authors show that the risk-rating of a country improves by 0.4 points when
the number of organizations a country is a member of increases by ten. According to Dreher
et al. (2010) membership in international organizations indeed gives a positive signal to
investors and increases FDI inflows. This shows that investors take the membership in
international organizations as sign for trustworthiness and credibility of the government.
Trustworthiness of the host government is an important factor for the investment decision as it
reduces the risks of unfavorable policy changes and expropriation.
Hypothesis
I derive my hypothesis using this existing literature that shows the importance of international
memberships and agreements on the credibility of a country. Becoming a candidate country of
the EITI sends a credible signal to foreign investors that a government is willing to reform
and improve its accountability and transparency standards which in turn influences FDI.
Resource-rich countries that are willing to reform and improve the governance of their natural
resource management find in the EITI an international association that addresses this issue
and are able to use the EITI standard as instrument to achieve this goal. Countries that join the
initiative as an implementing country therefore state publicly and internationally exactly this
9
will to reform. As summarized in the previous section, transparency and corruption are
important factors for foreign direct investment decisions. Although the EITI is a
comparatively non-binding institution with no threat of direct economic or political sanctions
following non-compliance, candidate governments can be seen as gaining credibility as they
face considerable audience costs. These costs which are incurred upon failing to comply with
the EITI rules, include first and foremost the loss in international credibility as they display
their inability to fight corruption, to improve transparency and to stick to their commitments.
With the threat of such a severe credibility loss, becoming a candidate of the EITI should
therefore have a direct influence on FDI inflows.
Formulating an expectation on the direction of the effect, however, is not clear-cut. By joining
the EITI a government shows that it is committed to fighting corruption and increasing its
transparency. According to the general findings, this signal should improve the investment
climate in the respective country as the expected decrease in corruption reduces the
achievable rent (Wei 2000). On the other hand, the EITI is designed for countries rich in
natural resources. As discussed before, for investors in this specific sector, existing evidence
suggests that corruption and lower transparency are in fact preferred. These characteristics
give investors easier access to the valuable goods (Egger and Winner 2005; Asiedu and Lien
2011). Unfortunately information on FDI flows to different sectors within developing
economies is very fragmented so I am not able to distinguish the two effects.
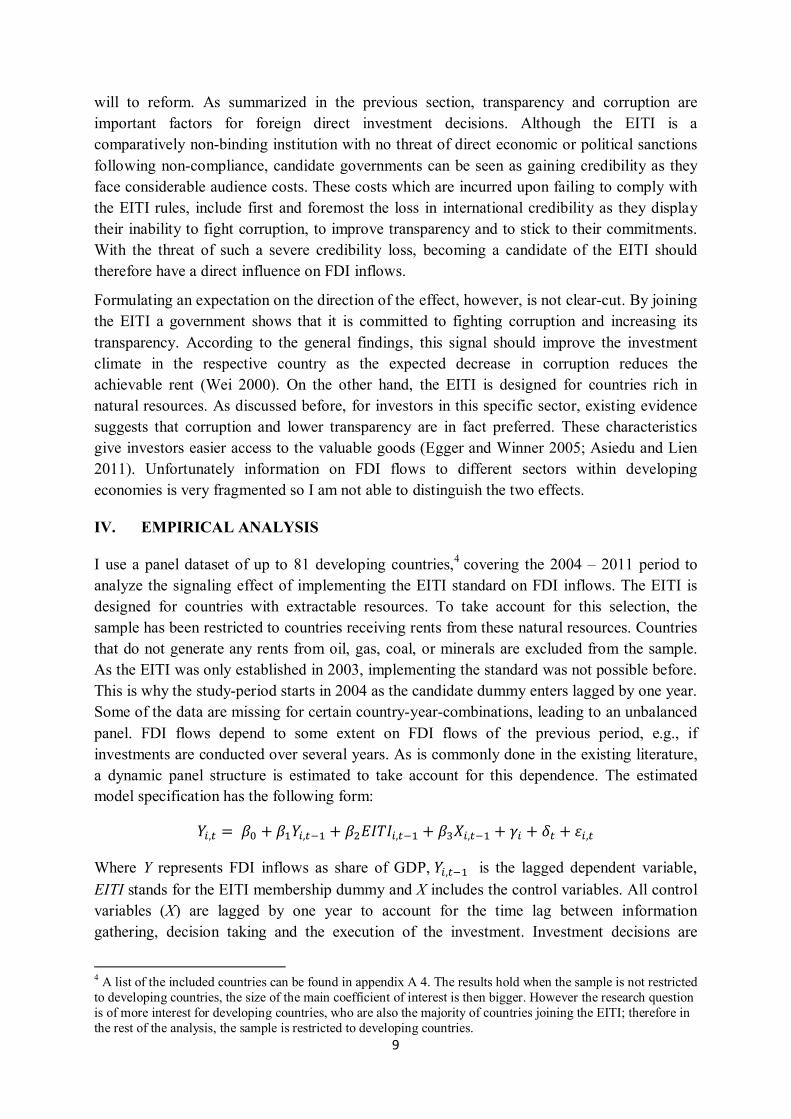
IV. EMPIRICAL ANALYSIS
I use a panel dataset of up to 81 developing countries,4 covering the 2004 – 2011 period to
analyze the signaling effect of implementing the EITI standard on FDI inflows. The EITI is
designed for countries with extractable resources. To take account for this selection, the
sample has been restricted to countries receiving rents from these natural resources. Countries
that do not generate any rents from oil, gas, coal, or minerals are excluded from the sample.
As the EITI was only established in 2003, implementing the standard was not possible before.
This is why the study-period starts in 2004 as the candidate dummy enters lagged by one year.
Some of the data are missing for certain country-year-combinations, leading to an unbalanced
panel. FDI flows depend to some extent on FDI flows of the previous period, e.g., if
investments are conducted over several years. As is commonly done in the existing literature,
a dynamic panel structure is estimated to take account for this dependence. The estimated
model specification has the following form:
��,� = �� + ����,��� + �������,��� + ����,��� + �� + �� + ��,�
Where Y represents FDI inflows as share of GDP, ��,��� is the lagged dependent variable,
EITI stands for the EITI membership dummy and X includes the control variables. All control
variables (X) are lagged by one year to account for the time lag between information
gathering, decision taking and the execution of the investment. Investment decisions are
4 A list of the included countries can be found in appendix A 4. The results hold when the sample is not restricted to developing countries, the size of the main coefficient of interest is then bigger. However the research question is of more interest for developing countries, who are also the majority of countries joining the EITI; therefore in the rest of the analysis, the sample is restricted to developing countries.

10
presumably led as well by some country-specific characteristics that are not captured in the
analysis, e.g. geographic factors. Further, there might be some time-specific general
investment trends across countries (see Méon and Sekkat 2012). Country fixed effects (γ) and
year dummies (δ) are included to control for this.
Data
The study analyzes whether implementing the EITI rules has a signaling effect for investors
leading to an increase in foreign direct investment inflows. The dependent variable is net
foreign direct investment inflows as a percentage of GDP. Net inflows are calculated as new
investments less disinvestments as reported in the balance of payments. The measure is
provided by the World Bank’s World Development Indicators (World Bank 2012a) and
gathered from several different sources.
As I want to investigate the signaling effect of the EITI on investments, the main variable of
interest is the dummy indicating whether a country is a candidate country of the EITI or not.
The dummy candidate turns 1 for all years a country is candidate of the EITI so it stays 1 in
the years after a country becomes a candidate. 5 It is not further distinguished between
candidate and compliant country for two reasons: first, one would assume that becoming a
candidate gives a much stronger signal as it reflects a bigger change in the government’s
behavior than the change between being a candidate and a compliant country; second, the two
first compliant countries, Azerbaijan and Liberia, reached this status only in 2009. Analyzing
the effect of becoming compliant country would thus not be possible due to the restricted
length of the data series.
As control variables, I generally follow Tobin and Rose-Ackermann (2011) and use trade
openness, GDP growth, population, country risk and natural resource rents. I do not include
GDP per capita as it will not provide intuitively interpretable information given that the
change of GDP, GDP growth, and population are already included. In addition to the control
variables used by Tobin and Rose-Ackermann I include corruption as EITI membership
might lead to a lower perception of corruption that could be the transmission channel for a
change in FDI flows. I include corruption and thus close this channel to test whether EITI
membership has a signaling effect beyond perceived corruption, i.e., in terms of a general
intend to improve the quality of governance. Trade openness is measured as the sum of
exports and imports of goods and services to GDP and is provided by the World Bank (World
Bank 2012a). This measure is used to account for trade restrictions that might influence FDI
activity in the receiving country. A low share of trade to GDP can be an indication of trade
restrictions. These restrictions incentivize foreign investors to make horizontal investments,
i.e., investments aiming to gain access to the local market by circumventing these restrictions.
On the other hand, investors seeking countries in which they can produce their goods more
cheaply so as to export them to their target markets will be more attracted by countries with a
higher degree of openness (Asiedu 2002).
5 The memberships of Madagascar and Yemen were only suspended in 2011. This is not covered by the data as the EITI dummy is lagged by one period.

11
Two measures for a recipient country’s market potential are included: GDP growth and
population. Market potential is important for horizontal investments. Countries with a higher
GDP growth should be more attractive to investors as they promise higher returns to
investment and are especially attractive for long-term FDI. Population on the other hand
shows the size of the market. A bigger population should be more attractive for investors as it
reflects more potential consumers (Tobin and Rose-Ackermann 2011).
Corruption is taken from the Worldwide Governance Indicators (Kaufmann et al. 2009). This
indicator measures the perception of corruption in the sense of public power being used for
private advantages. It is exactly this type of corruption that should be reduced by strengthened
transparency in the public sector. The measure ranges from -2.5 (low control of corruption) to
+2.5 (strong control of corruption). Corruption usually makes investments more expensive
through extra payments, protracted bureaucratic procedures and additional uncertainties.
Foreign direct investments are in general assumed to be negatively affected by high
corruption (see Wei 2000; Barassi and Zhou 2012). As higher values of the measure indicate a
better control of corruption, a positive outcome in the analysis would indicate that lower
corruption is connected to higher investment flows. Corruption is one of the channels through
which implementation of EITI can affect FDI flows as it should contribute to a reduction of
corruption in the resource sector.
Country risk measures the economic and political risks investors face when investing in a
country. I measure country risk via the political risk rating of the International Country Risk
Guide (PRS Group 2012). This measure evaluates twelve different indicators including
political and economic indicators such as law and order, the investment profile or democratic
accountability of the government. The index ranges from zero to 100 where higher values
reflect a lower risk level.
The amount of natural resource availability might have an influence on a country’s
attractiveness for foreign investors even if the sample is already reduced to countries having
extractive resources. Natural resource rents as share of GDP are provided by the World
Bank’s World Development Indicators (2010). Resource rents include rents from oil, coal,
natural gas, forest and several minerals and ores. They are calculated as the product of unit
rents and the volume of the commodity extracted. Unit rents reflect the difference between the
unit price of a commodity and its extraction costs. The measure including all natural resource
rents is used as non-extractive natural resources might be of general interest for investment
though not for joining the EITI.
Estimation strategy
Several econometric problems in the given model can lead to a bias of OLS estimators. This is
why I apply a treatment regression and system GMM in addition to OLS. The first problem I
face is that membership in the EITI is not randomly assigned but countries decide whether or
not to implement the standard. A possible problem of self-selection with the candidate

12
variable thus emerges. To solve this problem I use a binary treatment effect model6 to control
for the selection decision. This method takes account of the factors leading to the decision to
join the EITI, and thus the non-random treatment assignment, and models it in a non-linear
way. The non-linear prediction equation for the candidate status and the linear estimation of
FDI inflows are conducted simultaneously. In choosing the determinants of EITI membership
I follow Pitlik et al. (2010). According to their study, GDP per capita, ethnic fractionalization,
OPEC membership, voice and accountability, the share of fuel and mineral exports and
control of corruption all have a robust influence on the decision to join the EITI. I replace fuel
and mineral exports by fuel and mineral rents to keep the measure consistent in the model.7
These determinants of EITI membership are used in the first step of the treatment regression
to estimate the probability of becoming candidate. I do not include country fixed effects in the
first step as the average number of years included in the regression is only seven years and the
inclusion of country dummies would cause inconsistent estimates in the probit estimation.
This problem is known as the incidental parameter problem (Neyman and Scott 1948). The
estimated candidate variable is then included in the second step to measure the linear
relationship between EITI membership and FDI inflows according to the estimation equation
presented before. The treatment regression compared to the Heckman selection method
(Heckman 1979) simulates the situation where both outcomes of the binary decision are
observed. The Heckman selection, in contrast, is built for cases where only observations for
one result of the decision process are observed and models the “missing” observations.
Although the treatment regression addresses the selection bias, it does not solve a potential
endogeneity problem due to a third variable influencing both EITI membership and FDI
inflows. However, the risk of endogeneity appears to be small as a country has to fulfill
certain initial reforms in order to receive candidate status. There is thus a time lag between the
decision to be willing to join the EITI and the realization of membership. Factors that might
influence a government’s decision to join the EITI should then only have an effect on FDI
two to three years later. Although the probability of such a relationship is small, I nevertheless
control for additional variables that might cause this problem. As an additional test for
endogeneity and thus whether my results can be interpreted causally, I analyze the effect of
the government’s announcement to implement the EITI standard on FDI inflows. Here, only
the government itself determines the timing and coinciding events affecting FDI inflows so
that endogeneity is more likely. If I cannot find an effect of the announcement on FDI inflows
it strengthens the assumption of a causal link between the EITI membership and FDI inflows
as the existence of endogeneity is less likely there.
A last problem with the estimation strategy can arise due to the inclusion of country-fixed
effects in a model comprising the lagged dependent variable with a rather short time
dimension. According to Nickell (1981) the correlation between the lagged dependent
variable and the fixed effects might cause inconsistent estimators. To take account of this
possible bias, I use system GMM 8 with internal instruments (Arellano and Bond 1991;
6 I use the treatreg command implemented in Stata 12.0. 7 Using resource exports instead does not change the main results. 8 Estimations are based on Roodman’s two-step estimator (Roodman 2003) including the finite-sample
correction by Windmeijer (2005).

13
Arellano and Bover 1995; Blundell and Bond 1998) to eliminate this possible bias by
instrumenting the lagged dependent variable. The system GMM estimator uses the lagged
differences and the lagged levels of the variables as instruments of the endogenous and
predetermined variables as these are not correlated with the error term. As proposed by
Roodman (2006), I collapse the instrument matrix to prevent the problem of too many
instruments. In all estimations the standard errors are clustered at the country level to account
for possible correlation of a country’s error terms over time and heterogeneity between the
clusters.
V. RESULTS
Figures 1 and 2 provide a first, descriptive look at the effect of joining EITI on FDI inflows.
Figure 1 shows the average FDI inflows as share of GDP for those countries that do not join
the EITI during the sample period compared to those that join the EITI. We can see that FDI
inflows of the EITI countries are on average higher than those of the non-EITI countries.
However this difference can be due to inherent differences between the two groups. The two
bars on the right-hand side therefore refer to a sample including only those countries that
become EITI candidates and compares their average FDI inflows before and after becoming
members. The average FDI inflows after the membership in the EITI are clearly higher than
before. While the average share of FDI to GDP is almost five percent before membership, it
increases to around seven percent after countries become EITI candidates. Figure 2 shows the
results of an event-study approach where the effect of the timing of becoming EITI candidate
on FDI inflows from three years before to three years after becoming candidate is visualized.
A substantial increase in FDI inflows is observable from the year of becoming candidate to
the first year after. Furthermore, a general increase in FDI inflows after becoming an EITI
candidate can be observed.
These graphs only provide a first, descriptive insight into the relationship in question as I do
not control for other country characteristics. Nevertheless it is in line with the following
estimation results. Table 1 shows the results for the baseline regression for both OLS and the
treatment regression. Models 1 and 2 show the results for the OLS estimation. The lagged
dependent variable has a significant and positive effect at the one percent level, as expected.
Although it is expected that vertical FDI should dominate the investments in resource-rich
developing countries and open countries should therefore be more likely to receive more FDI
inflows, no significant effect of trade openness on the dependent variable can be observed at
conventional levels of significance. As fixed country effects are included, the results show
that a change in a country’s openness does not have an influence on its FDI inflows. It is
likely that a country’s openness influences investors’ initial decision of whether to invest in
the country. If this initial decision is taken changes in openness possibly have a low influence
on following decisions. While GDP growth stays insignificant at conventional levels in all
regressions, the second measure of market potential, population, is positive and significant at
the five percent level. Countries growing in size, i.e., those with expanding markets, on
average receive higher FDI inflows. The measure for country risk shows the expected positive
and significant sign at the ten percent level. Countries that reduce their financial, political and

14
economic risk, i.e., a rise in the country risk measure, experience an increase in their FDI
inflows. Increasing the country risk measure by ten points leads to a corresponding increase in
the share of FDI to GDP by one percentage point. However this result only holds for the OLS
models: when controlling for the possible selection bias in models 3 and 4, the coefficient of
political risk loses its significance. Resource rents do not seem to matter for the investment
inflows to the countries under study. It should be kept in mind, however, that the sample is
already reduced to only those countries with extractive natural resources and we are only
looking at the effect of changes in the explanatory variables due to the fixed-effects.
For the main variable of interest, the candidate dummy, a highly significant and positive
relationship between the dummy and the dependent variable can be seen. The results of all
models support the hypothesis that becoming an EITI candidate country increases FDI
inflows in the following year. Countries that receive the candidate status experience on
average an increase of FDI inflows as share of GDP by almost two percentage points. This is
in line with the first descriptive result shown in the previous figure where the average FDI to
GDP ratio increased by 2.2 percentage points after becoming an EITI member.
In Model 2, I include as additional explanatory variable control of corruption. This measure
closes the possible transmission channel of a reduction in corruption when implementing the
EITI standard. However the coefficient of perceived corruption is not significant at
conventional levels whereas the effect of the EITI candidate dummy stays significant at the
one percent level and changes the coefficient’s magnitude only marginally. This supports the
initial hypothesis that the fact of becoming EITI candidate sends a positive signal to investors
leading to higher investments. This effect does not depend on a perceived change in
corruption or risk.
Models 3 and 4 show the results for the treatment regression. The upper part shows the results
for the linear estimation of FDI inflows on the control variables. The results do not differ
remarkably from those of the OLS estimation with the exception of political risk. The
similarity of the results of the two estimation methods is a sign that the importance of the
selection bias is rather negligible. The coefficient of the candidate dummy is slightly bigger
than in the OLS estimation and significant at the one percent level, supporting the results that
candidate countries receive on average around two percentage points more of FDI inflows.
The lower part of the table shows the results for the non-linear treatment regression that
estimates the probability to join the EITI. The results do in general support the findings of
Pitlik et al. (2010). Richer countries and OPEC member countries have a significantly lower
probability of becoming candidate countries of the EITI. On the other hand, countries with a
higher ethnic fractionalization and a higher share of extractive resource rents with respect to
their GDP have a higher probability to implement the standard. Only for voice and
accountability and control of corruption do I fail to find a significant influence on selection
into the EITI. This might be attributed to the fact that Pitlik et al. (2010) use a cross-country
estimation whereas I include the time dimension as well. Though voice and accountability
might in general determine the probability to join the EITI, their change over time might be
too small to make a definite prediction on the precise moment of joining the EITI.

15
The results of the baseline estimations support my hypothesis that joining the EITI increases
FDI inflows. As discussed before, the decision to join the EITI might also coincide or even be
driven by other factors that also influence the investors’ perception of a country. A third
factor might influence both the implementation of the EITI standard as well as the rising FDI
inflows. As Dreher and Voigt (2011) argue, this factor might be a general change in the
government’s behavior. Such behavior would include the government deciding to enhance the
investment climate by inducing economic reforms including the fight against corruption via
implementing the EITI. In this case the observed change in the investment flows might be
attributed to the general change in the government’s behavior and the economic reforms
conducted rather than to the implementation of the EITI. Following Dreher and Voigt (2011),
I test for this factor and proxy the occurrence of economic reforms by the changes in the index
of economic freedom provided by the Heritage Foundation (2012). A second factor that could
cause the change in the investors’ behavior would be a change in the government that
coincides with the decision to join the EITI. If a change in government occurs and the
succeeding one acts in a more investor-friendly manner than the previous one or conducts
needed business reforms, this might cause a surge in investments in the country. This is
captured by the dummy variable suggested by Dreher and Voigt (2011), with the new
government dummy being derived from the database of political institutions (Beck et al.
2001). Whenever the indicator measuring the years the party of the chief executive has been
in power (prtyin) turns one, the new government dummy turns one as well and stays zero
elsewise.9
The estimations in table 2 (OLS estimation) and table 3 (treatment regression) include these
additional control variables. As some time usually passes between the time of the decision to
join the EITI and the date of becoming candidate due to time taken to implement the required
reforms, longer lags for the additional control variables are tested as well. Compared to table
1 without the additional control variables of government change and economic reforms, only
a marginal change in the results can be observed. Both a change in economic freedom in the
previous year (model 1) and a change in government (model 4) do not influence the share of
inflowing FDI. Both have a positive sign but they are not statistically significant at
conventional levels. Furthermore, and of particular interest, the inclusion of the two additional
control variables does not substantially change the magnitude of the candidate dummy.
Nevertheless an estimated increase of FDI inflows of around 1.8 percentage points is
observed for countries becoming EITI candidates. This result is robust to a longer lag
structure of the additional control variables. Economic reforms become significantly negative
for the second and third lag. This can be explained by an only-short-term effect on FDI in the
same period whereas in the following years the FDI inflows return to their previous level. The
other possible explanation is that economic reforms might unsettle investors as they are
unsure about further reforms to come that might have an influence on their investments.
Nevertheless neither a change in economic reforms two or three years ago nor a change of
government in these years substantially changes the effect of becoming an EITI candidate on
FDI inflows. Likewise, controlling for the simultaneous occurrence of government change
9 In the presented results the cases where the variable is not defined due to turmoil etc. the new government dummy is set zero. The results do not change when these observations are coded as missing.

16
and economic reforms in models 7 – 9 has no significant effect on the main variable of
interest. Thus, the observed effect for becoming an EITI candidate does not seem to be the
result of coinciding changes in the government or in the general reform behavior of the
government. The results further support the hypothesis that investors react to the information
of a country becoming an EITI candidate and its implied willingness to reform and enhance
transparency in the resource sector and the perceived increase in the government’s
accountability.
Table 3 shows the results for the treatment regression. As the assumption is that both
economic reforms and government change have a simultaneous effect on the FDI inflows and
the EITI membership, they are included in both parts of the treatment estimation. Only the
economic reforms variable lagged by three years has a significant and positive effect on
joining the EITI. As it takes around two years to become EITI candidate, the reforms two
years before (the candidate dummy is lagged by one year as well) might be an indicator for
the government’s general will to reform including the will to join the EITI. It might also be
the result of the government’s decision to join the EITI and simply reflect the first visible
reforms undertaken in this regard. In any case, this has no effect on the significance and the
magnitude of the candidate dummy. Throughout all models the candidate dummy stays
significant at the one percent level and the coefficient lies between 1.9 and 2.2. Thus even
when controlling for possible omitted factors it seems that becoming an EITI candidate
increases FDI inflows to GDP by around 2 percentage points.
In the first two specifications I tested that the positive effect on FDI depends neither on a
change in the perception of corruption nor on changes in the government or its economic
reform behavior. As a last step I want to further reinforce the signaling hypothesis by testing
the effect of the governments’ announcement to plan to join the EITI on FDI inflows. If the
resulting positive effect on FDI inflows is not due to the improved credibility of the EITI
statement but due to the simple will to reform, a positive effect on FDI should be observed
already when the government announces its plan to join the EITI. Further, if a third factor
influences the government’s decision to join the EITI and the dependent variable
simultaneously, the announcement should have a positive effect on FDI as well. Should the
positive effect on FDI however be observable only for the official statement by the EITI, it
gives additional support to the assumed causality of my results. I therefore replace in the
following the candidate dummy by the announcement dummy. This announcement
information covers only those countries that indeed became EITI candidates afterwards.10
The dummy is coded 1 beginning in the year the government has announced its intent in
joining the EITI until it has received the candidate status. Often it is only a period of one to
two years between the announcement and the membership where the needed reforms to
become candidate are conducted. As the treatment model is not applicable,11 I use OLS for
10
I could gather information on the year of announcement for the majority but not all EITI candidate countries. The EITI countries without announcement information are: Democratic Republic of Congo, Guinea, Guatemala, Madagascar, Mali, and Togo. 11
The treatment model could be used to predict the treatment effect, hence the time when the government announces its will to join the EITI. However the end of the treatment, the turn from announcement to becoming EITI candidate, would not be predictable.
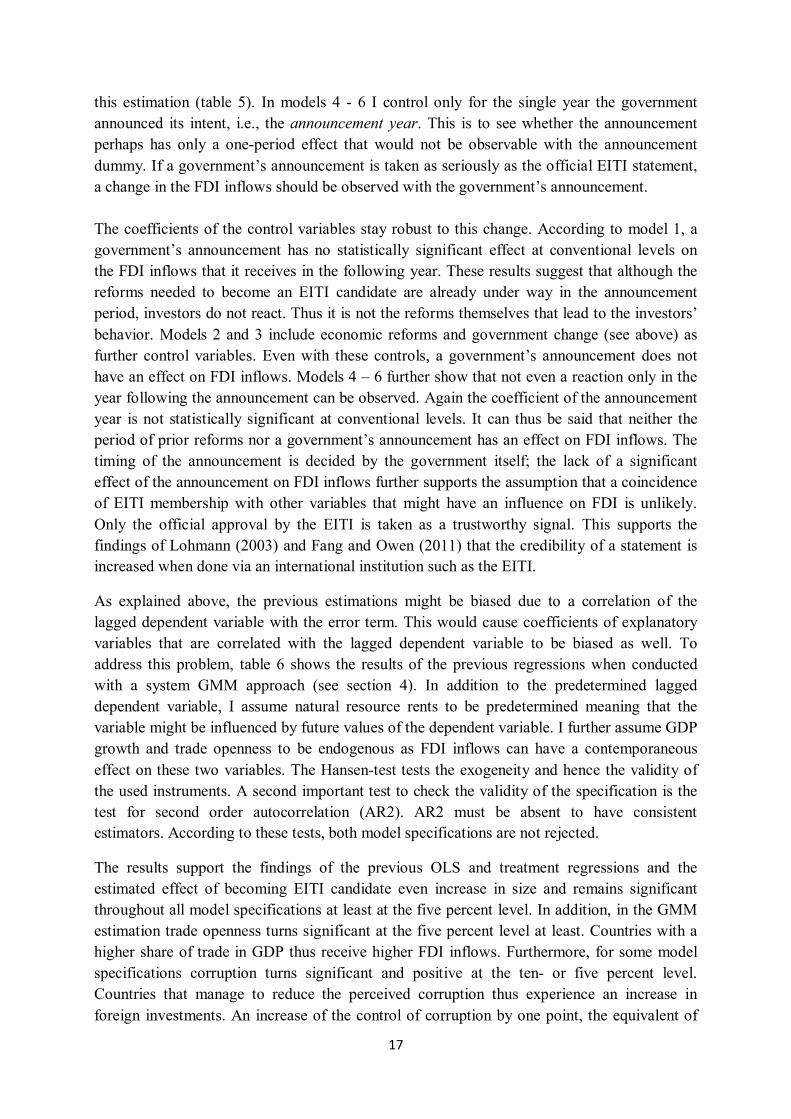
17
this estimation (table 5). In models 4 - 6 I control only for the single year the government
announced its intent, i.e., the announcement year. This is to see whether the announcement
perhaps has only a one-period effect that would not be observable with the announcement
dummy. If a government’s announcement is taken as seriously as the official EITI statement,
a change in the FDI inflows should be observed with the government’s announcement.
The coefficients of the control variables stay robust to this change. According to model 1, a
government’s announcement has no statistically significant effect at conventional levels on
the FDI inflows that it receives in the following year. These results suggest that although the
reforms needed to become an EITI candidate are already under way in the announcement
period, investors do not react. Thus it is not the reforms themselves that lead to the investors’
behavior. Models 2 and 3 include economic reforms and government change (see above) as
further control variables. Even with these controls, a government’s announcement does not
have an effect on FDI inflows. Models 4 – 6 further show that not even a reaction only in the
year following the announcement can be observed. Again the coefficient of the announcement
year is not statistically significant at conventional levels. It can thus be said that neither the
period of prior reforms nor a government’s announcement has an effect on FDI inflows. The
timing of the announcement is decided by the government itself; the lack of a significant
effect of the announcement on FDI inflows further supports the assumption that a coincidence
of EITI membership with other variables that might have an influence on FDI is unlikely.
Only the official approval by the EITI is taken as a trustworthy signal. This supports the
findings of Lohmann (2003) and Fang and Owen (2011) that the credibility of a statement is
increased when done via an international institution such as the EITI.
As explained above, the previous estimations might be biased due to a correlation of the
lagged dependent variable with the error term. This would cause coefficients of explanatory
variables that are correlated with the lagged dependent variable to be biased as well. To
address this problem, table 6 shows the results of the previous regressions when conducted
with a system GMM approach (see section 4). In addition to the predetermined lagged
dependent variable, I assume natural resource rents to be predetermined meaning that the
variable might be influenced by future values of the dependent variable. I further assume GDP
growth and trade openness to be endogenous as FDI inflows can have a contemporaneous
effect on these two variables. The Hansen-test tests the exogeneity and hence the validity of
the used instruments. A second important test to check the validity of the specification is the
test for second order autocorrelation (AR2). AR2 must be absent to have consistent
estimators. According to these tests, both model specifications are not rejected.
The results support the findings of the previous OLS and treatment regressions and the
estimated effect of becoming EITI candidate even increase in size and remains significant
throughout all model specifications at least at the five percent level. In addition, in the GMM
estimation trade openness turns significant at the five percent level at least. Countries with a
higher share of trade in GDP thus receive higher FDI inflows. Furthermore, for some model
specifications corruption turns significant and positive at the ten- or five percent level.
Countries that manage to reduce the perceived corruption thus experience an increase in
foreign investments. An increase of the control of corruption by one point, the equivalent of

18
Lithuania increasing its control of corruption (0.15) to the level of the United States (1.15),
increases the received FDI as share of GDP by around 2 percentage points. Although the
increase of the control of corruption should have a much more pronounced effect on the
investment climate, its estimated effect on FDI inflows is slightly lower than the estimated
effect of joining the EITI. According to the GMM estimation, the effect of joining the EITI is
on average 2.7; a country becoming an EITI candidate receives on average 2.7 percentage
points more FDI with respect to the years it was not yet a candidate.
In summary, throughout all model specifications and estimation techniques I find a robust
positive effect of EITI membership on inflows of foreign direct investments. The
announcement by the government to implement the EITI standard, on the other hand, does not
cause any change in FDI inflows.
VI. CONCLUSION
The Extractive Industries Transparency Initiative, set up in 2003, aims at increasing
transparency and accountability with regards to revenues and payments from the resource
sector in resource-rich countries. The aim of the demanded reforms is to turn the resource
curse in the respective countries into a resource blessing. This blessing comes in the form of
both increasing public revenues and increasing foreign investment inflows. The demanded
reforms are designed to contribute to lower degrees of corruption, more transparency in the
public sector and thus a better quality of governance. They have the possibility to make the
countries more attractive for foreign investors. Countries that want to join the EITI have to
fulfill specific requirements before becoming a candidate country. Becoming a candidate
country signals that the government has taken the first steps towards increasing transparency
and fighting corruption. Furthermore, after joining the EITI it becomes more costly for
governments to not further fulfill the EITI requirements, as they would internationally be
recognized as a country unable to reform or honor their commitments.
Analyzing a panel dataset of 81 countries, this study shows that the signal of becoming an
EITI member is indeed rewarded by the market with an increase in foreign direct investment
inflows. The hypothesis has been confirmed that becoming an EITI candidate works as a
signal for the willingness to reform. Investors recognize this signal of increased
trustworthiness, which they reward by investing in the respective country. It is not enough to
state the intention to join, as can be seen by the finding that the announcement of a
government to plan to join the EITI is not rewarded. This shows that investors do not seem to
trust the governments’ announcements to the same extent as they trust the initiative.
Becoming an EITI candidate country increases the share of FDI inflows to GDP on average
by around 2 percentage points. This is a substantial increase given that the average share of
FDI to GDP in the sample is around 4%. This result holds both when controlling for the self-
selection of countries into the EITI and for possible endogeneity. As the EITI candidate status
raises FDI inflows, improving transparency and accountability seem to be positive and
important aspects for the investment decisions of foreign investors.

19
Countries joining the initiative thus do not only benefit from more transparency in the
resource sector, which might increase public revenues via reduced possibilities of fraud of
payments from the resource sector. They also benefit from the increased investment in their
markets. As most of the implementing countries are developing countries - especially in Sub-
Saharan Africa - this is even more important. Many of these countries lack access to capital,
which FDI readily provides. Foreign investments are therefore a crucial source of finance for
them and thus anything that can increase these inflows is desirable. Even if other studies were
not yet able to show a significant effect of EITI on fighting corruption, this study shows that
the initiative has been effective in supporting investments in the participating countries.
The findings of this study are important for policy makers in resource-rich countries as well as
for the international community as it shows that improving domestic institutions and fighting
corruption is rewarded by investors already in the short run given that the reforms are
undertaken within an internationally accepted setting as the EITI. The study gives thus
support to both the beneficial effect of joining international organizations on a government’s
credibility including the credibility of reform announcements and the positive effect of
fighting corruption and increasing transparency in the resource sector.
This study has analyzed the impact of the EITI from a macro perspective. It would be
interesting to have a more detailed look at single countries joining the initiative where sector-
specific FDI data are available. This would allow evaluating the effect of the EITI
membership on investments in different sectors given that corruption might be perceived
differently harmful between sectors. I leave this for future research.

20
VII. REFERENCES
Arellano, Manuel and Stephen Bond. 1991. "Some Tests of Specification for Panel Data: Monte Carlo Evidence and an Application to Employment Equations." The Review of Economic Studies, 58(2), 277-97.
Arellano, Manuel and Olympia Bover. 1995. "Another Look at the Instrumental Variable Estimation of Error-Components Models." Journal of Econometrics, 68(1), 29-51.
Asiedu, Elizabeth. 2002. "On the Determinants of Foreign Direct Investment to Developing Countries: Is Africa Different?" World Development, 30(1), 107-19.
Asiedu, Elizabeth and Donald Lien. 2011. "Democracy, Foreign Direct Investment and Natural Resources." Journal of International Economics, 84(1), 99-111.
Barassi, Marco R. and Ying Zhou. 2012. "The Effect of Corruption on FDI: A Parametric and Non-Parametric Analysis." European Journal of Political Economy, 28(3), 302-12.
Bauer, Molly; Cesi Cruz and Benjamin Graham. 2012. "Democracies Only: When Do IMF Agreements Serve as a Seal of Approval?" The Review of International Organizations, 7(1), 33-58.
Beck, Thorsten; George Clarke; Alberto Groff; Philip Keefer and Patrick Walsh. 2001. "New Tools in Comparative Political Economy: The Database of Political Institutions " World Bank Economic Review, 15(1), 165 - 76.
Biglaiser, Glen and Karl DeRouen. 2010. "The Effects of IMF Programs on U.S. Foreign Direct Investment in the Developing World." The Review of International Organizations, 5(1), 73-95.
Bird, Graham. 2002. "The Credibility and Signaling Effect of IMF Programs." Journal of Policy Modeling, 24(9), 799-811.
Bird, Graham and Dane Rowlands. 2008. "The IMF's Role in Mobilizing Private Capital Flows: Are There Grounds for Catalytic Conversion?" Applied Economics Letters, 16(17), 1705-08.
Blundell, Richard and Stephen Bond. 1998. "Initial Conditions and Moment Restrictions in Dynamic Panel Data Models." Journal of Econometrics, 87(1), 115-43.
Borensztein, E.; J. De Gregorio and J. W. Lee. 1998. "How Does Foreign Direct Investment Affect Economic Growth?" Journal of International Economics, 45(1), 115-35.
Busse, Matthias and Carsten Hefeker. 2007. "Political Risk, Institutions and Foreign Direct Investment." European Journal of Political Economy, 23(2), 397-415.
Dreher, Axel; Heiner Mikosch and Stefan Voigt. 2010. "Membership Has Its Privileges - the Effect of Membership in International Organizations on FDI." CESifo Working Paper Series, (3231).
Dreher, Axel and Stefan Voigt. 2011. "Does Membership in International Organizations Increase Governments’ Credibility? Testing the Effects of Delegating Powers." Journal of Comparative Economics, 39(3), 326-48.
Egger, Peter and Hannes Winner. 2005. "Evidence on Corruption as an Incentive for Foreign Direct Investment." European Journal of Political Economy, 21(4), 932-52.
EITI. 2012. "EITI Factsheet," http://eiti.org/files/2012-09-20_Fact_Sheet_0.pdf
____. 2011. "EITI Rules," http://eiti.org/files/2011-11-01_2011_EITI_RULES.pdf
____. 2005. "The Extractive Industries Transparency Initiative Source Book."
Fang, Songying and Erica Owen. 2011. "International Institutions and Credible Commitment of Non-Democracies." The Review of International Organizations, 6(2), 141-62.
Heckman, James J. 1979. "Sample Selection Bias as a Specification Error." Econometrica, 47(1), 153-61.

21
Heritage Foundation, The. 2012. "Index of Economic Freedom," The Heritage Foundation, Washington:
Jensen, Nathan M. 2003. "Democratic Governance and Multinational Corporations: Political Regimes and Inflows of Foreign Direct Investment." International Organization, 57(3), 587-616.
Kaufmann, Daniel; Aart Kraay and Massimo Mastruzzi. 2009. „Governance Matters VIII: Aggregate and Individual Governance Indicators, 1996-2008.” World Bank Policy Research Working Paper, No. 4978.
Kolstad, Ivar and Tina Søreide. 2009. "Corruption in Natural Resource Management: Implications for Policy Makers." Resources Policy, 34(4), 214-26.
Lohmann, Susanne. 2003. "Why Do Institutions Matter? An Audience–Cost Theory of Institutional Commitment." Governance, 16(1), 95-110.
Mehlum, Halvor; Karl Moene and Ragnar Torvik. 2006. "Institutions and the Resource Curse." The Economic Journal, 116(508), 1-20.
Méon, Pierre-Guillaume and Khalid Sekkat. 2012. "FDI Waves, Waves of Neglect of Political Risk." World Development, 40(11), 2194 - 205.
Neyman, Jerzy and Elizabeth L. Scott. 1948. “Consistent Estimates based on Partially Consistent Observations.” Econometrica, 16(1), 1-32.
Nickell, Stephen. 1981. "Biases in Dynamic Models with Fixed Effects." Econometrica, 49(6), 1417-26.
Pitlik, Hans; Björn Frank and Mathias Firchow. 2010. "The Demand for Transparency: An Empirical Note." The Review of International Organizations, 5(2), 177-95.
PRS Group, The. 2012. "International Country Risk Guide," The PRS Group, East Syracuse:
Roodman, David. 2003. "Xtabond2: Stata Module to Extend Xtabond Dynamic Panel Data Estimator." Statistical Software Components, Boston College Department of Economics.
____. 2006. " How to Do xtabond2: An Introduction to “Difference” and “System” GMM in Stata" Center for Global Development, Working Paper 103.
Ross, Michael L. 2001. "Does Oil Hinder Democracy?" World Politics, 53(03), 325-61.
Sachs, Jeffrey D. and Andrew M. Warner. 1995. "Natural Resource Abundance and Economic Growth." National Bureau of Economic Research Working Paper Series, No. 5398.
Sala-i-Martin, Xavier and Arvind Subramanian. 2003. "Addressing the Natural Resource Curse: An Illustration from Nigeria." National Bureau of Economic Research Working Paper Series, No. 9804.
Tobin, Jennifer and Susan Rose-Ackerman. 2011. "When Bits Have Some Bite: The Political-Economic Environment for Bilateral Investment Treaties." The Review of International Organizations, 6(1), 1-32.
Tsui, Kevin K. 2011. "More Oil, Less Democracy: Evidence from Worldwide Crude Oil Discoveries." The Economic Journal, 121(551), 89-115.
Wei, Shang-Jin. 2000. "How Taxing Is Corruption on International Investors?" Review of Economics and Statistics, 82(1), 1-11.
Windmeijer, Frank. 2005. "A Finite Sample Correction for the Variance of Linear Efficient Two-Step GMM Estimators." Journal of Econometrics, 126(1), 25-51.
World Bank. 2012. "World Development Indicators," The World Bank, Washington.

22
VIII. APPENDIX
EITI Candidate and Compliant countries
Candidate Compliant*
Afghanistan (2010) Azerbaijan (2007, 2009)
Albania (2009) Central African Republic (2009, 2011)
Burkina Faso (2009) Ghana (2007, 2010)
Cameroon (2007) Kyrgyz Republic (2007, 2011)
Chad (2010) Liberia (2007, 2009)
Côte d'Ivoire (2010) Mali (2009, 2011)
Dem. Rep. Congo (2010) Mongolia (2007, 2010)
Rep. Congo (2010) Niger (2007, 2011)
Gabon (2005) Nigeria (2007, 2011)
Guatemala (2011) Norway (2009, 2011)
Guinea (2011) Timor-Leste (2008, 2010)
Indonesia (2010)
Iraq (2010)
Kazakhstan (2007)
Madagascar (2008)
Mauretania (2007)
Mozambique (2009)
Peru (2007)
Sierra Leone (2008)
Tanzania (2009)
Togo (2010)
Yemen (2007)
Zambia (2009)
Trinidad and Tobago (2011)
* The first year refers to the year of becoming candidate and the second
to the year the country received compliant status.

23
EITI Criteria
1. Regular publication of all material oil, gas and mining payments by companies to governments (“payments”) and all material revenues received by governments from oil, gas and mining companies (“revenues”) to a wide audience in a publicly accessible, comprehensive and comprehensible manner.
2. Where such audits do not already exist, payments and revenues are the subject of a credible, independent audit, applying international auditing standards.
3. Payments and revenues are reconciled by a credible, independent administrator, applying international auditing standards and with publication of the administrator’s opinion regarding that reconciliation including discrepancies, should any be identified.
4. This approach is extended to all companies including state-owned enterprises. 5. Civil society is actively engaged as a participant in the design, monitoring and evaluation of this process
and contributes towards public debate. 6. A public, financially sustainable work plan for all the above is developed by the host government, with
assistance from the international financial institutions where required, including measurable targets, a timetable for implementation, and an assessment of potential capacity constraints.
Source: (EITI 2011)

24
Figure 1: FDI and aid flows to low and lower middle income countries (billion USD)
Notes: The graph shows the yearly Net official development assistance and official aid received (red line) and the yearly net inflows of foreign direct investment (blue line) to low and lower middle income countries according to the World Bank country classification. Source: Global Development Finance (2012), own illustration.
Figure 2: Average FDI inflows
Notes: The graph shows the average FDI inflows as share of GDP for non-EITI countries, EITI countries and EITI countries before and after becoming candidate. The countries included are identical to the estimation sample. The black line reports the average FDI/GDP ratio for either the whole sample (left line) or the sample of EITI countries (right line).
0.00
20.00
40.00
60.00
80.00
100.00
120.00
140.00
160.00
FDI
Aid

25
Figure 3: Effect of EITI membership on FDI
Notes: The green line shows the marginal effect of becoming EITI candidate on FDI net inflows to GDP. Point 0 marks the year a country becomes candidate of the EITI, the points on the left hand side to 0 indicate the first, the second and the third year before becoming EITI candidate and the points on the right hand side respectively the years after becoming EITI candidate. The gray area shows the 90% confidence interval.
-20
24
6E
ffe
cts
on
FD
I
-3 -2 -1 0 1 2 3Timing of EITI membership

26
Table 1: Baseline regression
Notes: The dependent variable is net FDI inflows/GDP. Country fixed effects (for the treatment regression only for the linear estimation) and year dummies are included. The standard errors are clustered at the country level. P-values in brackets, where ***p<0.01, **p<0.05, *p<0.1.
(1) (2) (3) (4)
FDI t-1 0.458*** 0.459*** 0.464*** 0.465***
[0.000] [0.000] [0.000] [0.000]
Trade t-1 0.005 0.004 -0.005 -0.005
[0.780] [0.817] [0.804] [0.805]
GDP growth t-1 0.001 -0.001 -0.013 -0.014
[0.983] [0.981] [0.793] [0.777]
Population t-1 15.458** 15.527** 15.696** 15.768**
[0.049] [0.048] [0.036] [0.037]
Political Risk t-1 0.107* 0.093* 0.075 0.069
[0.093] [0.074] [0.124] [0.120]
Resource Rent t-1 0.027 0.025 0.027 0.026
[0.674] [0.694] [0.671] [0.684]
Corruption t-1 1.057 0.530
[0.532] [0.723]
Candidate t-1 1.939*** 1.889*** 2.109*** 2.087***
[0.009] [0.008] [0.005] [0.005]
Constant -264.239** -263.899** -259.394** -259.581**
[0.046] [0.045] [0.035] [0.034]
Treatment Regression
GDP p.c. t-2 -0.299** -0.299**
[0.050] [0.050]
Extractive Resource Rent t-2 0.030*** 0.030***
[0.002] [0.002]
Corruption t-2 -0.065 -0.066
[0.823] [0.822]
Ethnic Fractionalization t-2 1.573** 1.573**
[0.024] [0.024]
OPEC t-2 -0.801* -0.801*
[0.081] [0.081]
Voice and Accountability t-2 0.290 0.290
[0.186] [0.186]
Constant -0.571 -0.572
[0.656] [0.656]
Observations 566 566 552 552
Number of Countries 81 81 79 79
Adjusted within R2
0.332 0.334
OLS Treatment Regression

Table 2: Control for economic reforms and new government, OLS
Notes: The dependent variable is net FDI inflows/GDP. Country fixed effects and year dummies are included. The standard errors are clustered at the country level. P-values in brackets, where ***p<0.01, **p<0.05, *p<0.1.
(1) (2) (3) (4) (5) (6) (7) (8) (9)
FDI t-1 0.462*** 0.457*** 0.211** 0.464*** 0.463*** 0.463*** 0.468*** 0.461*** 0.213**
[0.000] [0.000] [0.036] [0.000] [0.000] [0.000] [0.000] [0.000] [0.034]
Trade t-1 -0.001 -0.012 0.033* 0.003 -0.006 -0.001 -0.002 -0.013 0.033*
[0.949] [0.647] [0.059] [0.874] [0.787] [0.947] [0.913] [0.615] [0.060]
GDP growth t-1 -0.010 -0.026 -0.025 -0.001 -0.015 0.002 -0.010 -0.029 -0.025
[0.842] [0.590] [0.698] [0.986] [0.763] [0.977] [0.839] [0.556] [0.704]
Population t-1 14.259* 13.619** 20.952* 16.033** 14.979* 15.359** 14.750* 13.951** 21.497*
[0.058] [0.049] [0.072] [0.043] [0.050] [0.048] [0.052] [0.045] [0.080]
Political Risk t-1 0.075 0.062 0.228*** 0.090* 0.074 0.085* 0.073 0.060 0.229***
[0.106] [0.103] [0.004] [0.085] [0.114] [0.091] [0.123] [0.122] [0.005]
Resource Rent t-1 0.031 0.032 -0.011 0.026 0.035 0.029 0.032 0.032 -0.007
[0.637] [0.614] [0.853] [0.690] [0.587] [0.655] [0.632] [0.606] [0.900]
Corruption t-1 0.557 0.373 1.121 1.037 0.602 0.868 0.519 0.388 1.083
[0.699] [0.780] [0.558] [0.539] [0.686] [0.587] [0.716] [0.770] [0.566]
Economic Reforms t-1 0.009 0.010
[0.407] [0.384]
Economic Reforms t-2 -0.012** -0.013**
[0.047] [0.046]
Economic Reforms t-3 -0.005* -0.005*
[0.056] [0.087]
New Government t-1 0.010 -0.084
[0.981] [0.865]
New Government t-2 0.117 0.162
[0.838] [0.785]
New Government t-3 -0.433 -0.846
[0.413] [0.205]
Candidate t-1 1.950** 1.716*** 1.922*** 1.893*** 1.834*** 1.832*** 1.979** 1.707*** 1.914**
[0.011] [0.008] [0.009] [0.009] [0.007] [0.008] [0.013] [0.008] [0.010]
Constant -241.544* -229.200** -364.234* -272.373** -253.351** -260.623** -249.856** -234.823** -373.707*
[0.055] [0.047] [0.063] [0.040] [0.047] [0.045] [0.050] [0.043] [0.070]
Observations 565 564 486 561 560 560 560 559 481
Number of Countries 81 81 81 80 80 80 80 80 80
Adjusted within R2
0.328 0.325 0.243 0.334 0.322 0.326 0.330 0.327 0.245

28
Table 3: Control for economic reforms and new government, Treatment regression
Notes: The dependent variable is net FDI inflows/GDP. Country fixed effects for the linear estimation and year dummies are included. The standard errors are clustered at the country level. P-values in brackets, where ***p<0.01, **p<0.05, *p<0.1.
(1) (2) (3) (4) (5) (6)
FDI t-1 0.471*** 0.463*** 0.207* 0.464*** 0.465*** 0.462***
[0.000] [0.000] [0.051] [0.000] [0.000] [0.000]
Trade t-1 -0.002 -0.012 0.014 -0.005 -0.005 -0.016
[0.934] [0.628] [0.544] [0.806] [0.805] [0.566]
GDP growth t-1 -0.009 -0.028 -0.046 -0.014 -0.014 -0.015
[0.858] [0.557] [0.421] [0.774] [0.769] [0.767]
Population t-1 15.528** 14.759** 17.005 15.766** 15.762** 14.124*
[0.039] [0.032] [0.134] [0.037] [0.037] [0.052]
Political Risk t-1 0.070 0.057 0.166*** 0.069 0.069 0.054
[0.134] [0.138] [0.003] [0.119] [0.124] [0.174]
Resource Rent t-1 0.023 0.024 -0.004 0.026 0.026 0.033
[0.729] [0.695] [0.943] [0.686] [0.686] [0.600]
Corruption t-1 0.448 0.347 -0.013 0.528 0.523 0.093
[0.752] [0.795] [0.993] [0.724] [0.724] [0.943]
Economic Reforms t-1 0.011
[0.350]
Economic Reforms t-2 -0.013**
[0.031]
Economic Reforms t-3 -0.005
[0.129]
New Government t-1 -0.042
[0.922]
New Government t-2 0.111
[0.842]
New Government t-3 -0.463
[0.395]
Candidate t-1 2.253*** 1.907*** 1.967** 2.086*** 2.089*** 1.986***
[0.006] [0.007] [0.013] [0.005] [0.005] [0.003]
Constant -256.057** -242.366** -285.959 -259.560** -259.513** -231.856**
[0.036] [0.029] [0.122] [0.034] [0.034] [0.050]
GDP p.c. t-2 -0.296** -0.300** -0.310* -0.300** -0.299** -0.295*
[0.049] [0.046] [0.051] [0.048] [0.048] [0.051]
Extractive Resource Rent t-2 0.030*** 0.030*** 0.030*** 0.030*** 0.030*** 0.030***
[0.002] [0.002] [0.002] [0.002] [0.002] [0.002]
Corruption t-2 -0.063 -0.073 -0.098 -0.058 -0.062 -0.072
[0.829] [0.804] [0.755] [0.846] [0.831] [0.804]
Ethnic Fractionalization t-2 1.567** 1.585** 1.764** 1.570** 1.570** 1.589**
[0.024] [0.023] [0.016] [0.024] [0.023] [0.023]
OPEC t-2 -0.796* -0.806* -0.921* -0.799* -0.801* -0.801*
[0.085] [0.077] [0.054] [0.083] [0.082] [0.080]
Voice and Accountability t-2 0.288 0.286 0.292 0.284 0.287 0.300
[0.189] [0.191] [0.217] [0.184] [0.181] [0.165]
Economic Reforms t-1 -0.000
[0.847]
Economic Reforms t-2 0.000
[0.879]
Economic Reforms t-3 0.008**
[0.021]
New Government t-1 0.065
[0.837]
New Government t-2 0.031
[0.915]
New Government t-3 -0.236
[0.478]
Constant -0.585 -0.569 -0.545 -0.563 -0.567 -0.582
[0.648] [0.657] [0.688] [0.661] [0.658] [0.650]
Observations 552 551 474 552 552 551
Countries 79 79 79 79 79 79
Treatment Regression

29
Table 4: Control for economic reforms and new government, Treatment regression continued
Notes: The dependent variable is net FDI inflows/GDP. Country fixed effects for the linear estimation and year dummies are included. The standard errors are clustered at the country level. P-values in brackets, where ***p<0.01, **p<0.05, *p<0.1.
(7) (8) (9)
FDI t-1 0.471*** 0.463*** 0.208**
[0.000] [0.000] [0.043]
Trade t-1 -0.001 -0.012 0.014
[0.941] [0.628] [0.532]
GDP growth t-1 -0.009 -0.028 -0.045
[0.850] [0.545] [0.426]
Population t-1 15.523** 14.760** 17.479
[0.039] [0.031] [0.136]
Political Risk t-1 0.069 0.058 0.163***
[0.133] [0.136] [0.004]
Resource Rent t-1 0.023 0.024 -0.000
[0.733] [0.700] [0.995]
Corruption t-1 0.444 0.340 -0.082
[0.754] [0.798] [0.953]
Economic Reforms t-1 0.011
[0.352]
Economic Reforms t-2 -0.013**
[0.034]
Economic Reforms t-3 -0.005
[0.113]
New Government t-1 -0.097
[0.841]
New Government t-2 0.161
[0.783]
New Government t-3 -0.991
[0.177]
Candidate t-1 2.255*** 1.907*** 2.014**
[0.007] [0.008] [0.012]
Constant -255.983** -242.426** -293.794
[0.036] [0.029] [0.124]
GDP p.c. t-2 -0.298** -0.301** -0.307*
[0.048] [0.044] [0.051]
Extractive Resource Rent t-2 0.030*** 0.030*** 0.030***
[0.002] [0.002] [0.002]
Corruption t-2 -0.055 -0.070 -0.103
[0.853] [0.812] [0.741]
Ethnic Fractionalization t-2 1.565** 1.583** 1.772**
[0.024] [0.022] [0.015]
OPEC t-2 -0.794* -0.805* -0.921*
[0.086] [0.077] [0.054]
Voice and Accountability t-2 0.282 0.284 0.307
[0.186] [0.186] [0.188]
Economic Reforms t-1 -0.000
[0.842]
Economic Reforms t-2 0.000
[0.882]
Economic Reforms t-3 0.008**
[0.020]
New Government t-1 0.066
[0.833]
New Government t-2 0.026
[0.931]
New Government t-3 -0.233
[0.527]
Constant -0.577 -0.565 -0.551
[0.653] [0.658] [0.683]
Observations 552 551 474
Countries 79 79 79
Treatment Regression
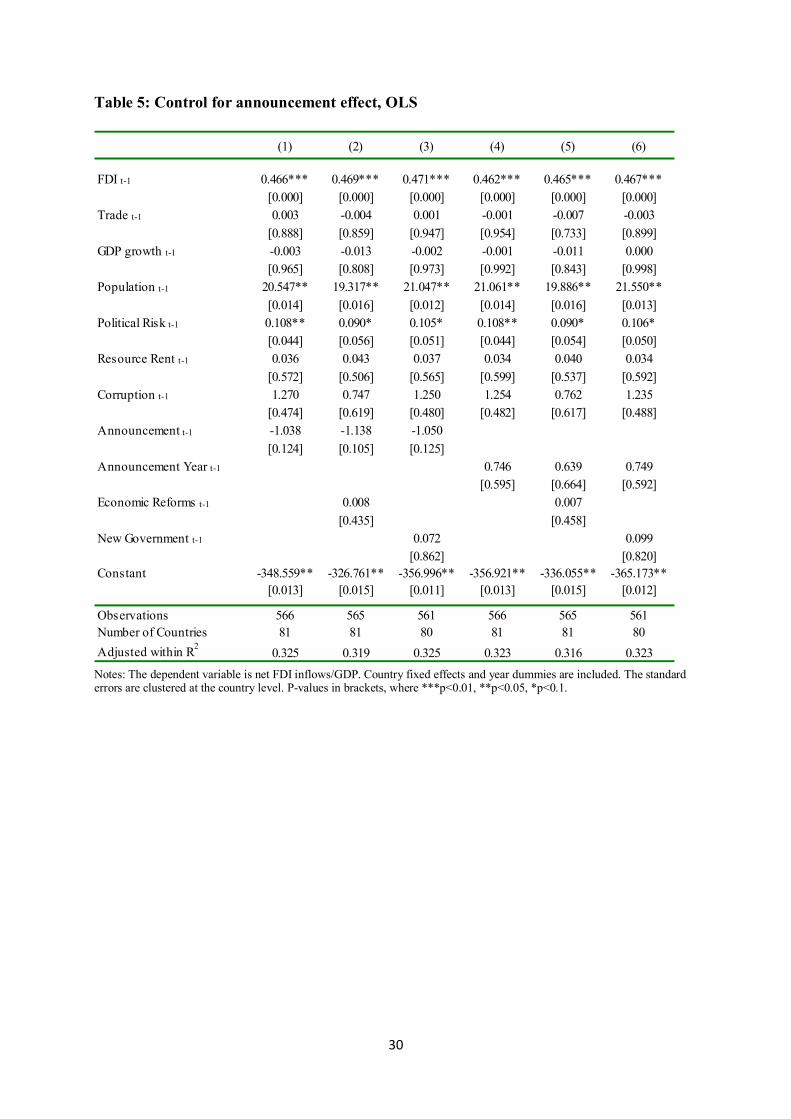
30
Table 5: Control for announcement effect, OLS
Notes: The dependent variable is net FDI inflows/GDP. Country fixed effects and year dummies are included. The standard errors are clustered at the country level. P-values in brackets, where ***p<0.01, **p<0.05, *p<0.1.
(1) (2) (3) (4) (5) (6)
FDI t-1 0.466*** 0.469*** 0.471*** 0.462*** 0.465*** 0.467***
[0.000] [0.000] [0.000] [0.000] [0.000] [0.000]
Trade t-1 0.003 -0.004 0.001 -0.001 -0.007 -0.003
[0.888] [0.859] [0.947] [0.954] [0.733] [0.899]
GDP growth t-1 -0.003 -0.013 -0.002 -0.001 -0.011 0.000
[0.965] [0.808] [0.973] [0.992] [0.843] [0.998]
Population t-1 20.547** 19.317** 21.047** 21.061** 19.886** 21.550**
[0.014] [0.016] [0.012] [0.014] [0.016] [0.013]
Political Risk t-1 0.108** 0.090* 0.105* 0.108** 0.090* 0.106*
[0.044] [0.056] [0.051] [0.044] [0.054] [0.050]
Resource Rent t-1 0.036 0.043 0.037 0.034 0.040 0.034
[0.572] [0.506] [0.565] [0.599] [0.537] [0.592]
Corruption t-1 1.270 0.747 1.250 1.254 0.762 1.235
[0.474] [0.619] [0.480] [0.482] [0.617] [0.488]
Announcement t-1 -1.038 -1.138 -1.050
[0.124] [0.105] [0.125]
Announcement Year t-1 0.746 0.639 0.749
[0.595] [0.664] [0.592]
Economic Reforms t-1 0.008 0.007
[0.435] [0.458]
New Government t-1 0.072 0.099
[0.862] [0.820]
Constant -348.559** -326.761** -356.996** -356.921** -336.055** -365.173**
[0.013] [0.015] [0.011] [0.013] [0.015] [0.012]
Observations 566 565 561 566 565 561
Number of Countries 81 81 80 81 81 80
Adjusted within R2
0.325 0.319 0.325 0.323 0.316 0.323

31
Table 6: GMM control estimations
Notes: The dependent variable is net FDI inflows/GDP. Year dummies are included. The lagged dependent variable, and natural resource rents are treated as predetermined variables, GDP growth and trade openness as endogenous. The standard errors are clustered at the country level. P-values in brackets, where ***p<0.01, **p<0.05, *p<0.1.
(1) (2) (1) (2) (3) (4) (5) (6) (7) (8) (9) (10) (11)
FDI t-1 0.504*** 0.484*** 0.488*** 0.499*** 0.309* 0.493*** 0.504*** 0.505*** 0.496*** 0.500*** 0.324* 0.546*** 0.543***
[0.000] [0.000] [0.000] [0.000] [0.082] [0.000] [0.000] [0.000] [0.000] [0.000] [0.060] [0.000] [0.000]
Trade t-1 0.101** 0.120*** 0.125** 0.119** 0.133** 0.118** 0.113*** 0.119** 0.122** 0.123** 0.127** 0.093** 0.088**
[0.013] [0.009] [0.018] [0.014] [0.047] [0.010] [0.007] [0.012] [0.013] [0.013] [0.037] [0.036] [0.033]
GDP growth t-1 -0.107 -0.126 -0.079 -0.118 -0.137 -0.122 -0.091 -0.094 -0.083 -0.128 -0.133 -0.039 -0.031
[0.378] [0.289] [0.564] [0.230] [0.189] [0.303] [0.454] [0.433] [0.522] [0.196] [0.227] [0.785] [0.828]
Population t-1 0.700* 1.013** 1.029* 1.074** 0.864 0.985** 0.983** 1.060* 0.985* 1.114* 0.837 0.724* 0.669*
[0.090] [0.046] [0.071] [0.046] [0.169] [0.049] [0.046] [0.058] [0.071] [0.050] [0.182] [0.094] [0.088]
Political Risk t-1 -0.015 -0.124 -0.138 -0.128 -0.105 -0.127 -0.111 -0.118 -0.142* -0.141* -0.104 -0.085 -0.081
[0.775] [0.112] [0.113] [0.102] [0.342] [0.108] [0.106] [0.118] [0.098] [0.077] [0.330] [0.193] [0.195]
Resource Rent t-1 0.021 0.008 0.013 0.016 -0.059 0.004 0.015 0.008 0.009 0.016 -0.055 0.035 0.025
[0.648] [0.820] [0.768] [0.647] [0.280] [0.907] [0.728] [0.832] [0.841] [0.657] [0.300] [0.369] [0.458]
Corruption t-1 2.182* 2.282 2.349** 1.762 2.223* 2.308* 2.339* 2.286 2.562** 1.854 1.887* 1.760*
[0.053] [0.114] [0.037] [0.212] [0.055] [0.070] [0.059] [0.105] [0.037] [0.213] [0.073] [0.088]
Candidate t-1 2.497** 2.727*** 2.623*** 2.550*** 2.910** 2.697*** 2.730*** 2.766*** 2.658*** 2.604*** 2.915**
[0.015] [0.005] [0.007] [0.007] [0.028] [0.009] [0.005] [0.004] [0.007] [0.007] [0.035]
Economic Reforms t-1 0.009 0.010
[0.381] [0.249]
Economic Reforms t-2 -0.009 -0.011
[0.200] [0.132]
Economic Reforms t-3 -0.004 -0.005
[0.200] [0.230]
New Government t-1 0.170 0.325
[0.742] [0.535]
New Government t-2 0.252 0.126
[0.569] [0.765]
New Government t-3 -0.273 -0.335
[0.555] [0.650]
Announcement t-1 -0.765
[0.433]
Announcement Year t-1 0.763
[0.298]
Constant -15.913 -14.554 -14.759 -15.305* -12.906 -13.836 -14.783 -15.948* -13.581 -15.420 -12.139 -10.610 -9.669
[0.108] [0.121] [0.151] [0.099] [0.244] [0.128] [0.105] [0.099] [0.170] [0.112] [0.266] [0.175] [0.177]
Observations 566 566 565 564 486 561 560 560 560 559 481 566 566
Number of Countries 81 81 81 81 81 80 80 80 80 80 80 81 81
Number of Instruments 53 54 55 55 54 55 55 55 56 56 55 54 54
Arellano-Bond (Pr>z) 0.349 0.342 0.326 0.332 0.267 0.340 0.347 0.357 0.320 0.325 0.275 0.338 0.355
Hansen (Pr>chi2) 0.897 0.885 0.791 0.922 0.742 0.888 0.785 0.800 0.827 0.911 0.711 0.775 0.776

32
Data Sources
Variable Description Source
FDI Net FDI flows as share to GDP World Development Indicators, World Bank (2012b)
Openness Sum of imports and exports as share of GDP World Development Indicators, World Bank (2012b)
GDP p.c. growth World Development Indicators, World Bank (2012b)
GDP p.c. World Development Indicators, World Bank (2012b)
Population World Development Indicators, World Bank (2012b)
Resource Rents Resource rents are calculated as: World Development Indicators, World Bank (2012a) (Unit price – Extraction cost per unit) x Extracted
volume
Resources covered:
Bauxit, copper, lead, nickel, phosphate, tin, zinc, gold, silver, iron, hard coal, soft coal, oil, natural gas
Country Risk Political risk measure combining twelve indicators: government stability, socioeconomic conditions, bureaucratic quality, investment profile, internal conflict, external conflict, military in politics, religious tensions, corruption, law and order, ethnic tensions, democratic accountability. The indicator ranges from zero (high risk) to 100 (low risk)
International Country Risk Guide, PRS Group
Corruption Assessment of the perception of corruption. Ranging from -2.5 (low control of corruption) to +2.5 (high control of corruption)
Worldwide Governance Indicators, Kaufmann et al. (2009)
OPEC Member 1 in case the country is an OPEC member country, 0 otherwise.
OPEC webpage
Extractive Resource Rents
Sum of oil, gas and mineral rents.
Ethnic Fractionalization
Average value for ethnic fractionalization based on five ethnolinguistic indices. Ranges from 0 to 1. Where a high value indicated higher fractionalization.
Alesina et al. (2003)
New Government Derived from prtyin measure of the Database of Political Institutions. 1 in years prtyin turns 1, 0 otherwise
Beck, et al. (2001)
Reform Difference in the Index of Economic Freedom from one year to the next.
Index of Economic Freedom, Heritage Foundation (2012)
Candidate 1 in years a country is candidate or compliant country to EITI, 0 otherwise
EITI Homepage
Announcement 1 in years a country announced its intent to implement EITI but has not yet reached candidate status, 0 otherwise
EITI Homepage, country specific EITI homepages
Announcement year 1 in the year a country announced its intent to implement EITI, 0 otherwise
EITI Homepage, country specific EITI homepages

33
Country sample
EITI members bold
Angola Ethiopia Mozambique Ukraine
Albania Gabon Malaysia Uruguay
Argentina Ghana Namibia Venezuela, RB
Armenia Guinea Niger Vietnam
Azerbaijan Guatemala Nigeria Yemen, Rep.
Burkina Faso Guyana Nicaragua South Africa
Bangladesh Honduras Pakistan Congo, Dem. Rep.
Bulgaria Indonesia Peru Zambia
Belarus India Philippines Zimbabwe
Bolivia Iran, Islamic Rep. Papua New Guinea
Brazil Jamaica Romania
Botswana Jordan Russian Federation
Chile Kazakhstan Sudan
China Kenya Senegal
Cote d'Ivoire Liberia Sierra Leone
Cameroon Libya Serbia
Congo, Rep. Sri Lanka Suriname
Colombia Lithuania Syrian Arab Republic
Costa Rica Morocco Togo
Cuba Moldova Thailand
Dominican Republic Madagascar Tunisia
Algeria Mexico Turkey
Ecuador Mali Tanzania
Egypt, Arab Rep. Mongolia Uganda

34
Descriptive statistics
Variable Observations Mean
Standard
Deviation Minimum Maximum
FDI (% of GDP) 566 4.44 5.33 -14.37 46.38
Trade Openness 557 80.18 34.43 22.12 212.10
GDP Growth 566 5.46 4.56 -17.67 37.76
Population (in million) 566 66.00 194.00 0.49 1340.00
Political Risk 566 61.98 8.58 37.83 81.75
Resource Rent (% of GDP) 537 13.50 16.53 0.13 78.55
Corruption 537 -0.51 0.56 -1.48 1.50
GDP per capita 566 2096.55 2022.71 88.25 11601.63
Rents from EITI Ressources 537 12.76 16.69 0 75.79
Ethnic Fractionalization 526 0.53 0.24 0.04 0.93
OPEC 566 0.08 0.27 0 1
Voice and Accountability 537 -0.43 0.73 -1.96 1.22
New Government 533 0.06 0.24 0 1
Economic Reforms 566 206.59 86.20 4 457
Announcement 566 0.06 0.24 0 1
Announcement Year 566 0.03 0.17 0 1
Candidate 566 0.13 0.34 0 1