University of Arkansas · Welcome and Special Remarks Brent Williams, Associate Dean . Sam M....
35
Transcript of University of Arkansas · Welcome and Special Remarks Brent Williams, Associate Dean . Sam M....


Business ForecastPresented by: Center for Business and Economic Research
Walton Presenting Partner
Walmar t /Sam’s Club
Walton Academic PartnersCenter for Reta i l ing Excel lence
Greenwood Gearhar t In c.
Walton corporate PartnerS
Frost , PLLCMckee Foods
Reece Moore Pendergraf t LLPSmith Hurst PLC
Walton Business Partners
AEP SWEPCOCox Communicat ions
HoganTaylor LLPHyatt P lace Hote l
J.B. Hunt Transpor t Serv ices, Inc.Quatt lebaum, Grooms & Tul l PLLC
Regions BankRegions Insurance
Wright , L indsey & Jennings LLP
Walton MEDIA PartnersCelebrate Arkansas
Talk Business & Pol i t ics/NWA Business Journa l

Business Forecast 2017 Friday, January 27, 2017
11:30 a.m. - 1:30 p.m. Schedule of Events
Welcome and Special Remarks Brent Williams, Associate Dean Sam M. Walton College of Business, University of Arkansas
2016 Contest Awards Kathy Deck, Director Center for Business and Economic Research Sam M. Walton College of Business, University of Arkansas
Introduction of Moderator Brent Williams
Introduction of Panelists Shelley Simpson Chief Marketing Officer J.B. Hunt Transport Services, Inc.
Presentations
Global Forecaster Stuart Mackintosh Executive Director Group of Thirty
Domestic Forecaster Ellen Hughes-Cromwick Former Chief Economist U.S. Department of Commerce
Regional Forecaster Kathy Deck
Panel Discussion Shelley Simpson, Stuart Mackintosh, Ellen Hughes-Cromwick, Kathy Deck
Recognitions and Announcements Brent Williams
Business Forecast 2017 is in association with the National Association for Business Economics (NABE).
Please use Twitter hashtag #BF2017 for this event.
Shelley Simpson is the Chief Marketing Officer of J.B. Hunt Transport Services, Inc., President of J.B. Hunt Integrated Capacity Solutions (ICS) and Truck, and is an Executive Vice President of the parent company. After graduating in 1994 from the University of Arkansas at Fayetteville with a marketing degree, she began her career at J. B. Hunt. Her career has included positions across various business segments including: Director of Pricing for Truck and Intermodal, Vice President of Economic Analysis, Senior Vice President of Finance and Administration. In 2007, Shelley assumed the role of President of Integrated Capacity Solutions. In 2011, she assumed the sales and marketing executive responsibilities and was appointed as the company's Chief Marketing Officer. In 2014, she also assumed the position of President of J.B. Hunt's truck division. Shelley lives in Rogers with her husband of 19 years, David, and their three children. She enjoys her family time and active participation in her faith as a member of Cross Church at Pinnacle Hills and as a board member of WorkMatters. Shelley is also a board member of Mercy, a member of the Walton College Dean's Executive advisory board, and is extremely devoted to causes related to promoting women in the workplace. In 2016, she was awarded with the Distinguished Woman in Logistics award by Women in Trucking organization.
Stuart Mackintosh is the Executive Director of the Group of Thirty, an international financial think tank comprised of senior figures from central banking, the financial sector, and academia. He is responsible for all aspects of the organization's work program, fundraising, and program of events. The Group's mission is to deepen understanding of international economic and financial issues, to explore the international repercussions of decisions taken in the public and private sectors, and to examine the choices available to market practitioners and policymakers. Dr. Mackintosh has a B.A. and Ph.D. from Newcastle University and a M.Sc. from the University of Edinburgh. He is a Certified Business Economist (CBE) and currently serves as the president of the National Association for Business Economics (NABE).
Ellen Hughes-Cromwick served as the Secretary of Commerce's principal adviser on economic matters and as a member of the Secretary's principal management team as Chief Economist. She was on leave as an adjunct professor at the University of Michigan's Ross School of Business, following a distinguished, 18-year career with the Ford Motor Company as Director and Chief Global Economist. She also served as a senior economist at Mellon Bank from 1990 to 1996. Prior to joining Mellon Bank, Ellen was assistant professor at Trinity College and also served as a staff economist at the President's Council of Economic Advisers. She is a past president of the National Association for Business Economics (NABE), and recently completed a 5-year term on the Board of Directors for the National Bureau for Economic Research. Dr. Hughes-Cromwick is a Certified Business Economist (CBE) and received her Bachelor's degree in Government and French from the University of Notre Dame. She earned a Master's degree in International Development and a Ph.D. in Economics from Clark University in Massachusetts.
Kathy Deck is director for the Center for Business and Economic Research in the Walton College. Her research interests include local economic development, industry market structure and higher education economics. She has managed studies for dozens of organizations throughout Arkansas and also acts as a media resource for analysis of current events and trends. She was named Business Advocate of the Year in 2015 by the Fayetteville Chamber of Commerce, Communicator of the Year in 2009 by the Northwest Arkansas Public Relations Society of America, 40 under 40 by Arkansas Business and the Northwest Arkansas Business Journal and as a Woman of Influence by Arkansas Business. Deck earned a B.A. in economics from the College of William and Mary and an M.S. in economics from the University of Wisconsin-Madison.

Stuart Mackintosh, Group of [email protected] 9, 2017
I. Globalization in Retreat?
II. Economic Forecasts – View with Caution
III. The International Economic Outlook:Warning - Uncertainty and Risk Aheada. Chinab. Japanc. European Union
The views expressed are those of the author and do not represent the position of the G30 or of its members.

Source: OECD Economic Outlook, September 2016
Globalization in Retreat?
Free Trade Deals Abandoned

WorldAdvancedEconomies U.S. U.K. Japan
Euro Area
Emerging Market and Developing Economies China
CommodityExporting
Economies
2015 3.2 2.1 2.6 2.2 0.5 2.0 4.0 6.9 0.8
2016 3.1 1.6 1.6 1.8 0.5 1.7 4.2 6.6 0.9
2017 3.4 1.8 2.2 1.1 0.6 1.5 4.6 6.2 2.5
Revision from Jul. 2016 0.0 0.0 -0.3 -0.2 0.5 0.1 0.0 0.0 0.0
Sources: IMF, World Economic Outlook October 2016; and IMF, World Economic Outlook July 2016 Update.
IMF Growth Forecasts (% change from previous year)
Source: IMF
IMF’s Economic Forecasts: View with Caution
“THE only function of economic forecasting is to make
astrology look respectable,” John Kenneth Galbraith.

China: Control, Debt, and Disaster?
Depreciation Slashes Reserves
Source: World Bank
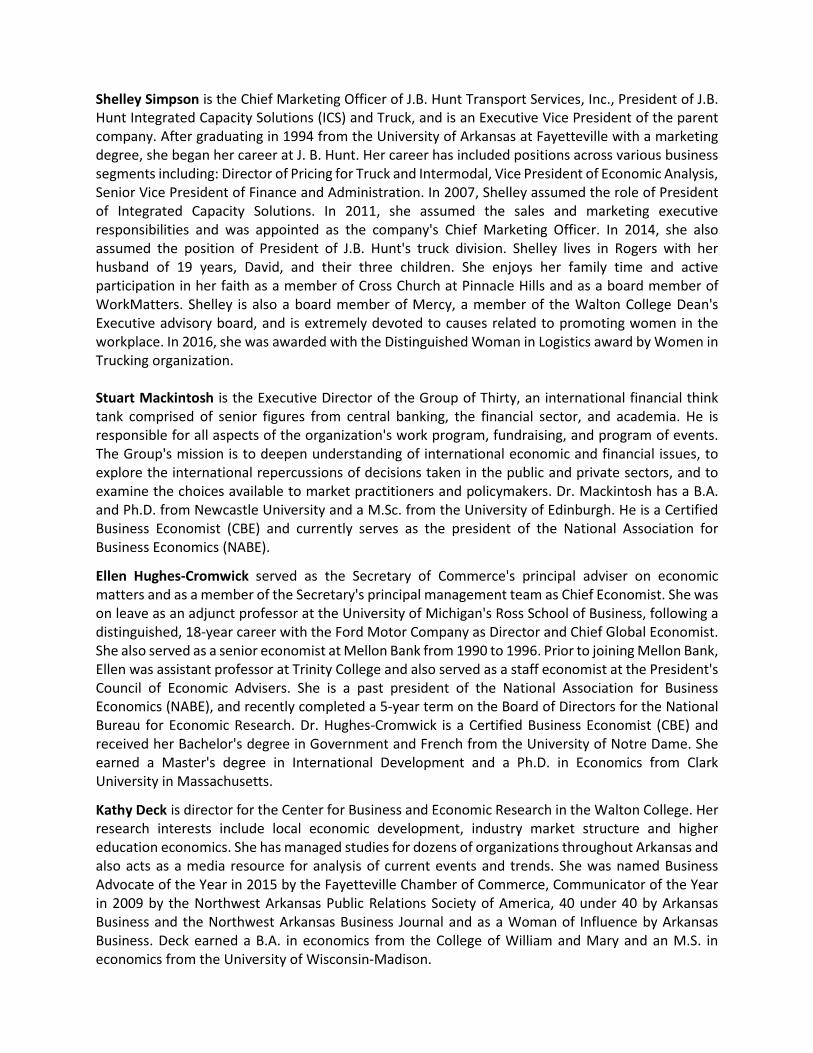
Source: G30/MGI
Debt Will Get You in the End
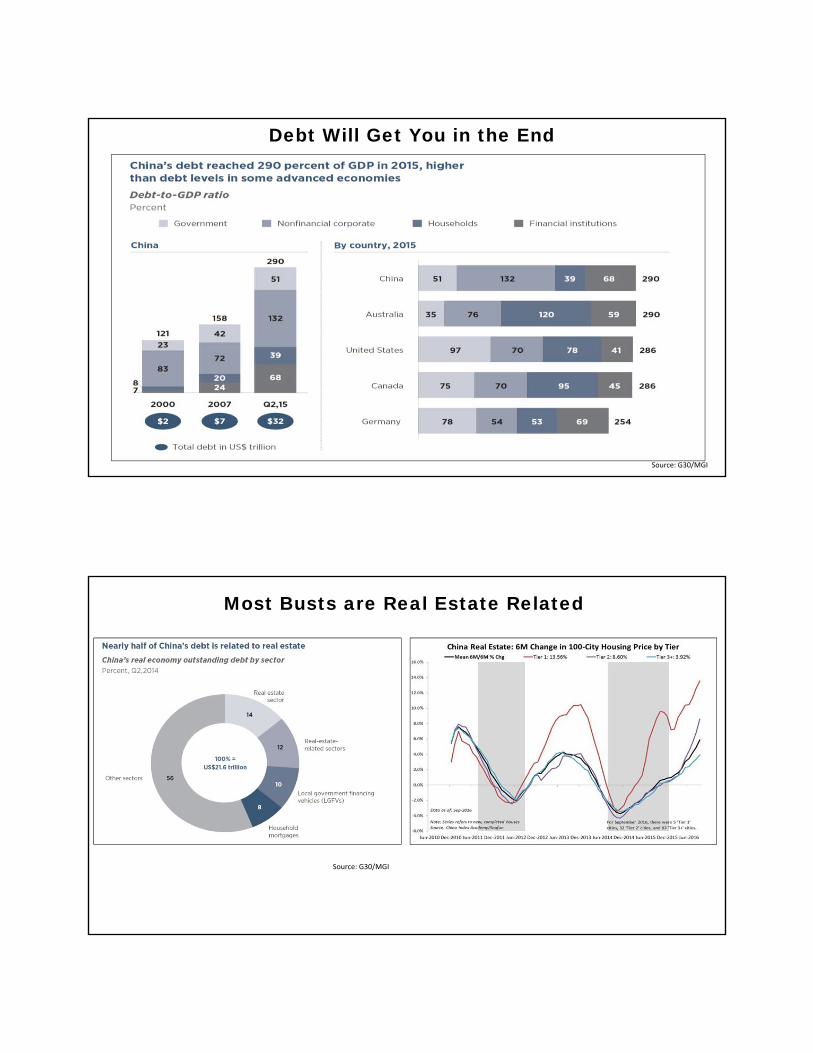
Most Busts are Real Estate Related
Source: G30/MGI

Don’t Trust What You Cannot Understand
See: J.K. Galbraith ‘The Great Crash’
NPLs =?
Source: G30/MGI
Stability Now, Payment Later

Japan: Shifting the Consensus
Abenomics’ Three Arrows
1. Monetary2. Fiscal3. Structural
Japanese National Debt in Relation to GDP
‐0.2
0
0.2
0.4
0.6
0.8
1
1.2
1.4
1.6
1.8
2
2012 2013 2014 2015 2016 2017 2018 2019 2020
Percent Change
Japan’s GDP Growth
Source: OECD‐0.5
0
0.5
1
1.5
2
2.5
3
2012 2013 2014 2015 2016 2017 2018 2019 2020
Percent Change
Japan’s Inflation Rate
Source: IMF
Heroic Efforts with Little Effect
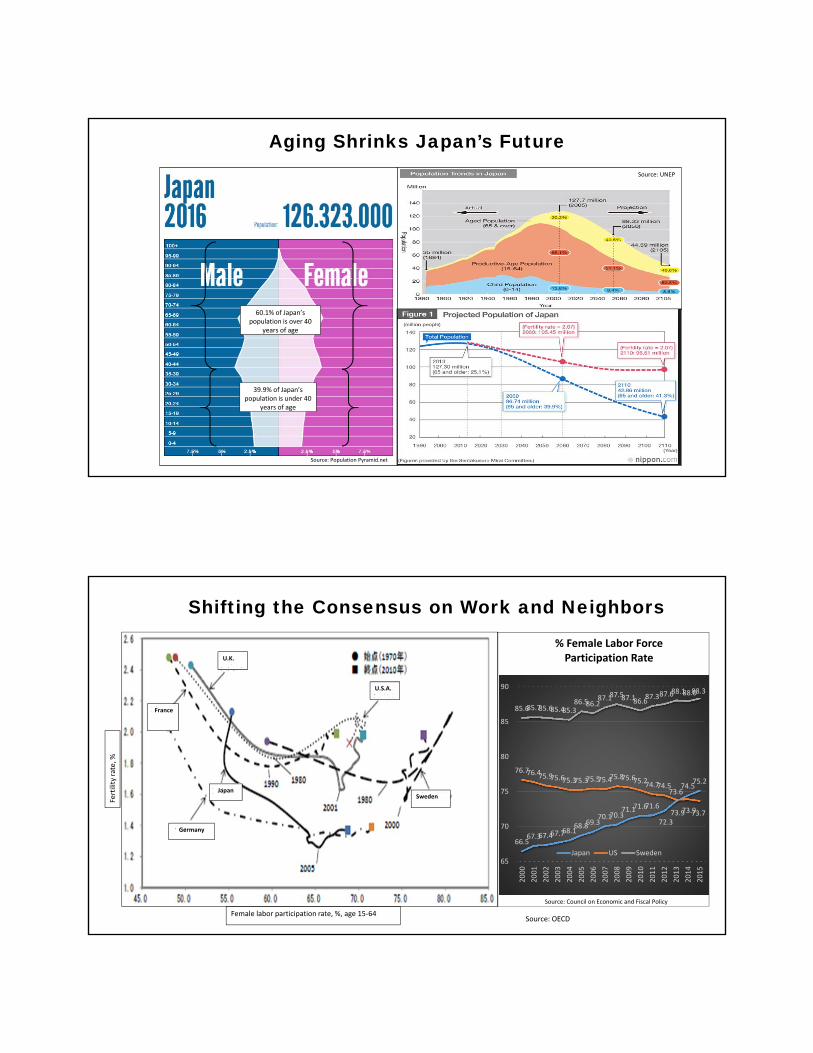
Aging Shrinks Japan’s FutureSource: UNEP
Source: Population Pyramid.net
60.1% of Japan’s population is over 40
years of age
39.9% of Japan’s population is under 40
years of age
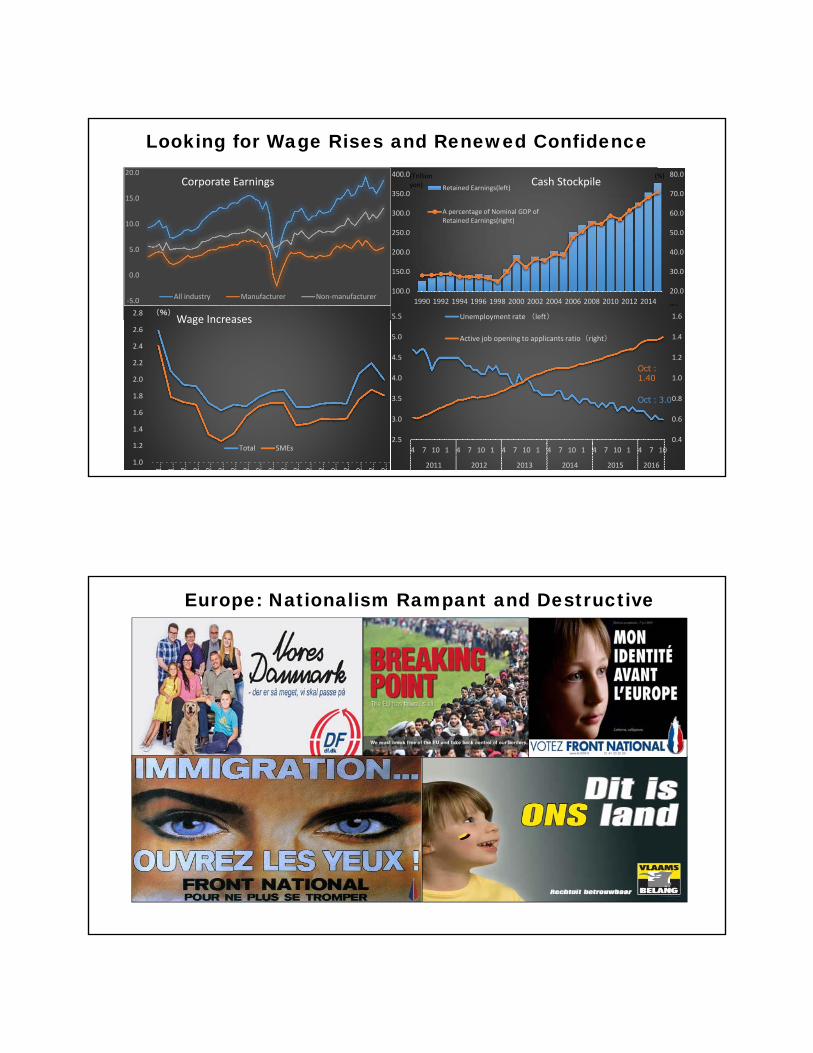
Shifting the Consensus on Work and Neighbors
Source: Council on Economic and Fiscal Policy
Female labor participation rate, %, age 15‐64
U.S.A.
France
Germany
Sweden
U.K.
Japan
Fertility rate, %
47.5
48.0
48.5
49.0
49.5
50.0
Jan‐09
Jun‐09
Nov‐09
Apr‐10
Sep‐10
Feb‐11
Jul‐11
Dec‐11
May‐12
Oct‐12
Mar‐13
Aug‐13
Jan‐14
Jun‐14
Nov‐14
% Female Labor Force Participation Rate
66.5 67.3 67.4 67.7
68.1 68.8 69.3
70.1 70.3 71.1 71.6 71.6
72.3
73.6 74.5
75.2
76.7 76.4 75.9 75.6 75.3 75.3 75.5 75.4 75.8 75.6 75.2 74.7 74.5
73.9 73.9 73.7
85.6 85.7 85.6 85.4 85.386.5 86.2
87.1 87.5 87.1 86.6 87.3 87.6
88.1 88.0 88.3
65
70
75
80
85
90
2000
2001
2002
2003
2004
2005
2006
2007
2008
2009
2010
2011
2012
2013
2014
2015
Japan US Sweden
Source: OECD
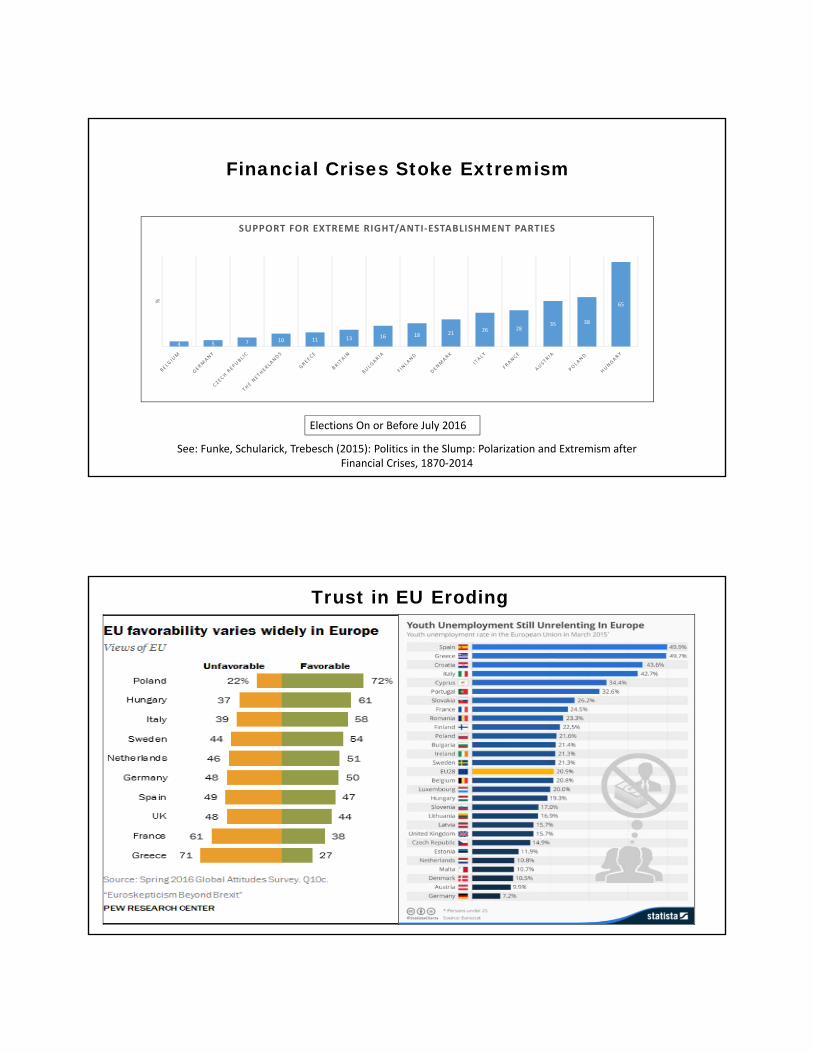
Looking for Wage Rises and Renewed Confidence
0.4
0.6
0.8
1.0
1.2
1.4
1.6
2.5
3.0
3.5
4.0
4.5
5.0
5.5
4 7 10 1 4 7 10 1 4 7 10 1 4 7 10 1 4 7 10 1 4 7 10
2011 2012 2013 2014 2015 2016
Unemployment rate (left)
Active job opening to applicants ratio(right)
Oct:3.0
Oct:1.40
1.0
1.2
1.4
1.6
1.8
2.0
2.2
2.4
2.6
2.8
1…
1…
2…
2…
2…
2…
2…
2…
2…
2…
2…
2…
2…
2…
2…
2…
2…
2…
2…
(%)
Total SMEs
‐5.0
0.0
5.0
10.0
15.0
20.0
All industry Manufacturer Non‐manufacturer20.0
30.0
40.0
50.0
60.0
70.0
80.0
100.0
150.0
200.0
250.0
300.0
350.0
400.0
1990 1992 1994 1996 1998 2000 2002 2004 2006 2008 2010 2012 2014
Retained Earnings(left)
A percentage of Nominal GDP ofRetained Earnings(right)
(FY
(Trillionyen)
(%)Corporate Earnings
Wage Increases
Cash Stockpile
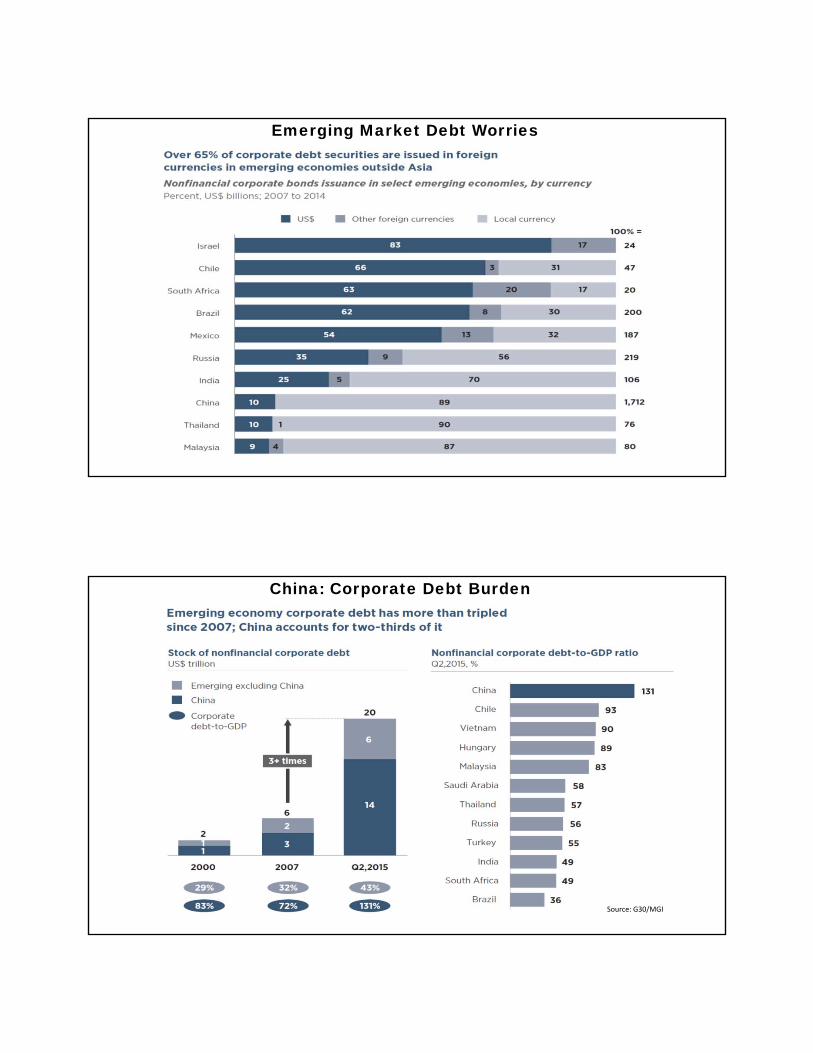
Europe: Nationalism Rampant and Destructive
Elections On or Before July 2016
4 5 7 10 11 13 16 18 2126 28
35 38
65
%
SUPPORT FOR EXTREME RIGHT/ANTI‐ESTABLISHMENT PARTIES
See: Funke, Schularick, Trebesch (2015): Politics in the Slump: Polarization and Extremism after Financial Crises, 1870‐2014
Financial Crises Stoke Extremism
Trust in EU Eroding

BREXIT as a Warning
GDP Growth(as % Change)
Unemployment(as %)
Youth Unemployment(as %)
Government Deficit (% GDP)
Government Debt(% GDP)
Austria 1.4 5.9 11.3 ‐1.0 86
Spain 3.1 19.2 46.2 ‐5.1 100
Germany 1.7 4.1 6.4 0.7 71
Netherlands 1.7 5.6 11.1 ‐1.9 65
France 1.3 9.7 25.9 ‐3.5 96
Italy 0.8 11.6 39.9 ‐2.6 132
Greece 0.1 23.4 49 ‐7.5 180
Hungary 2.0 4.9 15.3 ‐1.6 75
Poland 3.1 5.7 20.2 ‐2.6 65
UK 1.8 4.7 13.4 ‐4.3 89
Europe 2.0 8.3 19.6 2.4 85
European Risks Ahead
Source: Eurostat

• Globalization: stalled and is under threat
• International outlook: risks ahead
• China: control is paramount; debt, shadow banking risks loom large
• Japan: is a consensus shift possible?
• Europe: nationalism could breakup the Eurozone/EU
To Conclude – in 2017
Appendix

0.5
1
1.5
2
2.5
3
3.5
4
1950 1955 1960 1965 1970 1975 1980 1985 1990 1995 2000 2005 2010 2015
Japan U.S. France
Germany Italy Sweden
U.K.
Total fertility rate in Japan
1985 1995 2005 2008 2011 2012 2013 2014 20151.76 1.42 1.26 1.37 1.39 1.41 1.43 1.42 1.46
Source: Japan Cabinet Office
U.S.1.86(2014)
France1.98(2014)
Germany1.47(2014)
Japan1.46(2015)
Sweden1.88(2014)U.K.
1.81(2014)
Fertility Rates – Major Economies
24
Italy1.37(2014)
Source: G30/MGI
Global Debt is Up
Emerging Market Debt Worries
China: Corporate Debt Burden
Source: G30/MGI

Germany AfD 21.9% in state elections, pulling ahead of Merkel’s CDU on Sep. 4, 2016. On Sept. 18 2016, AfD 14.1%.
Source: The Economist
Croatia H.D.Z. wins majority with 40.4% on Sept. 11, 2016. Source: NY Times
Spain Mariano Rajoy, leader of Spain’s
conservative People's Party, was re‐elected as Prime Minister on October 29, 2016.
Source: NYT
Italy ReferendumPM Renzi admits defeat. Source:
BBC
Austria Far‐Right Nationalist, Norbert Hoffer, admits defeat in the Presidential elections
Dec. 4, 2016. Source: CNN
Hungary Referendum Oct. 2, 2016. 98% voters anti‐
immigration. Source: Bloomberg
France Presidential elections April 2017. Source: France 24
UK Local elections May 4, 2017. Source: Bloomberg
EU Electoral Indicators and Red Flags?
2017 Outlook
Business Forecast Luncheon
Center for Business & Economic ResearchThe Sam M. Walton College of Business
University of Arkansas
January 27, 2017
Ellen Hughes-Cromwick

The views expressed today are my own and are not attributable to the U.S. Federal Government or to the University of Michigan. These are personal views and do not in any way reflect on policy positions for other related judgments of policy makers in any part of the U.S. Federal
Government. The information presented is provided for educational purposes only and is not to be considered a solicitation for support of any kind. Tables, charts and commentary provided in this presentation have been prepared on a best efforts basis by the author using sources believed
to be reliable although the accuracy of the information is not guaranteed.
Ellen Hughes-Cromwick1
• Global macroeconomic backdrop
• Stage of the U.S. business cycle
• Policy considerations
• Sentiment
• Risks and Opportunities
Framework for Futuring 2017
2

Global Recovery: Euro Area and U.S. Contributions
3
3.4 3.23.5
4.0
-1.0
0.0
1.0
2.0
3.0
4.0
5.0
6.0
2006 2007 2008 2009 2010 2011 2012 2013 2014 2015 2016Est.
2017Fcst.
Global GDP% Chg Over Prior Year
Source: Historical data are IMF World Economic Outlook, October 2016, Constant Prices
U.S. Consumer Solid
4
U.S. ConsumerKey Statistics on Fundamentals
2015 2016Unemployment rate % year end 5.0 4.7Nonfarm employment yoy % chg 2.0 1.4 Jobs created 000s 2,789 2,032Wages yoy % chg 2.6 2.9After-tax income yoy % chg 3.6 3.7Consumer spending yoy % chg 3.2 4.2Saving rate % of Income 6.1 5.5Consumer confidence Index year end 92.6 98.2Mortgage interest rate % year end 3.97 4.26Inflation yoy % chg 0.7 1.7
Source: BEA, University of Michigan, Wall Street Journal and OCE; 2016 data include December 2016 unless otherw ise noted; w ages are average hourly earnings of all employees in private sector; 2016 current dollar after-tax income, current dollar consumer spending saving rate and inflation are November 2016; mortgage rate is 30-year f ixed mortgage rate in last w eek of each year and excludes closing costs.

5
Skew
48.148.5
47.3
47.848.2
47.9
48.9 48.9
49.4
48.948.6
46.0
46.5
47.0
47.5
48.0
48.5
49.0
49.5
50.0
2005 2006 2007 2008 2009 2010 2011 2012 2013 2014 2015
Share of Total U.S. Family IncomeTop 20%
Source: Census Bureau
Financial Asset Returns
6
$195
$108
$157
$0
$50
$100
$150
$200
$250
Stocks Cash Bonds
Today's Compounded Value of $100 Investment in 2006
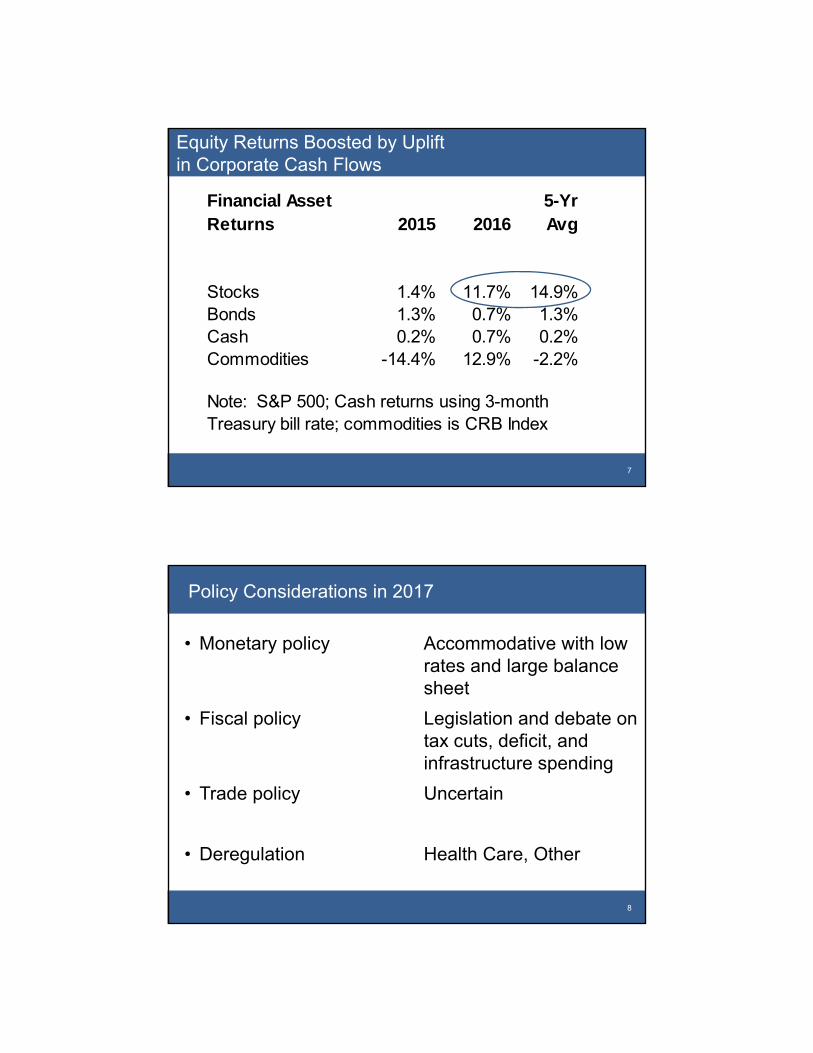
Equity Returns Boosted by Uplift in Corporate Cash Flows
7
Financial Asset Returns 2015 2016
5-YrAvg
Stocks 1.4% 11.7% 14.9%Bonds 1.3% 0.7% 1.3%Cash 0.2% 0.7% 0.2%Commodities -14.4% 12.9% -2.2%
Note: S&P 500; Cash returns using 3-month Treasury bill rate; commodities is CRB Index
8
• Monetary policy Accommodative with low rates and large balance sheet
• Fiscal policy Legislation and debate on tax cuts, deficit, and infrastructure spending
• Trade policy Uncertain
• Deregulation Health Care, Other
Policy Considerations in 2017
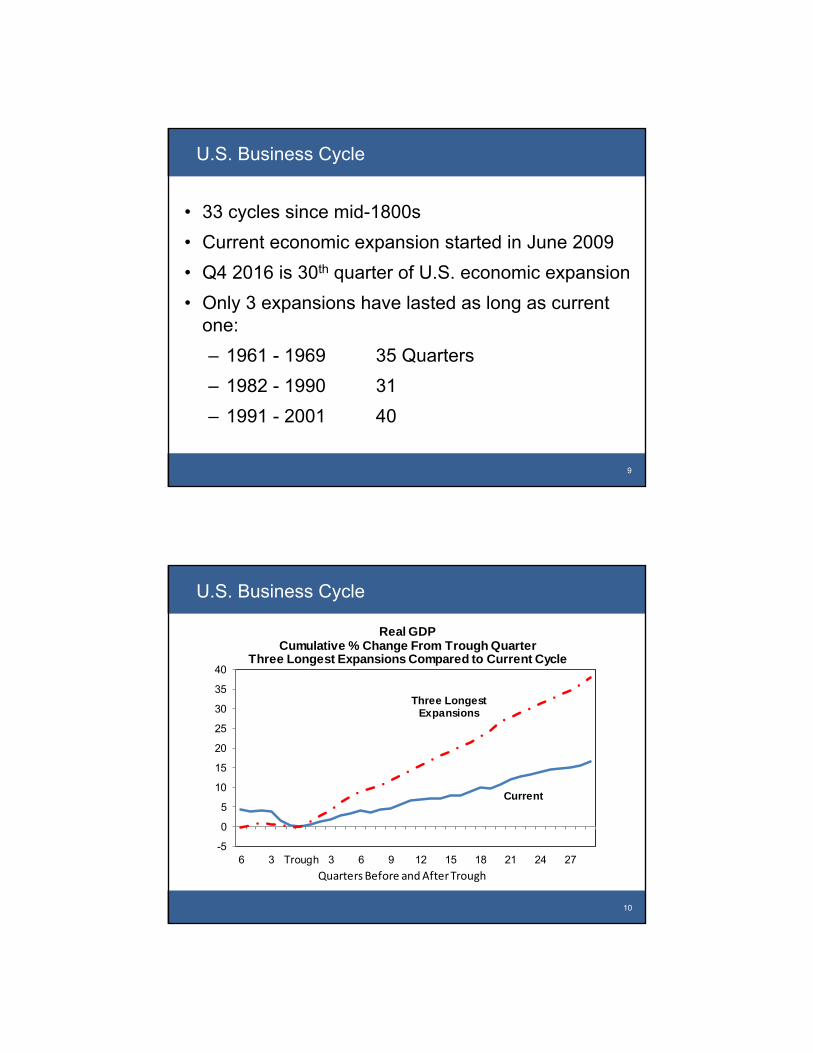
• 33 cycles since mid-1800s
• Current economic expansion started in June 2009
• Q4 2016 is 30th quarter of U.S. economic expansion
• Only 3 expansions have lasted as long as currentone:
‒ 1961 - 1969 35 Quarters
‒ 1982 - 1990 31
‒ 1991 - 2001 40
U.S. Business Cycle
9
U.S. Business Cycle
10
-5
0
5
10
15
20
25
30
35
40
6 3 Trough 3 6 9 12 15 18 21 24 27
Real GDPCumulative % Change From Trough Quarter
Three Longest Expansions Compared to Current Cycle
Current
Three Longest Expansions
Quarters Before and After Trough
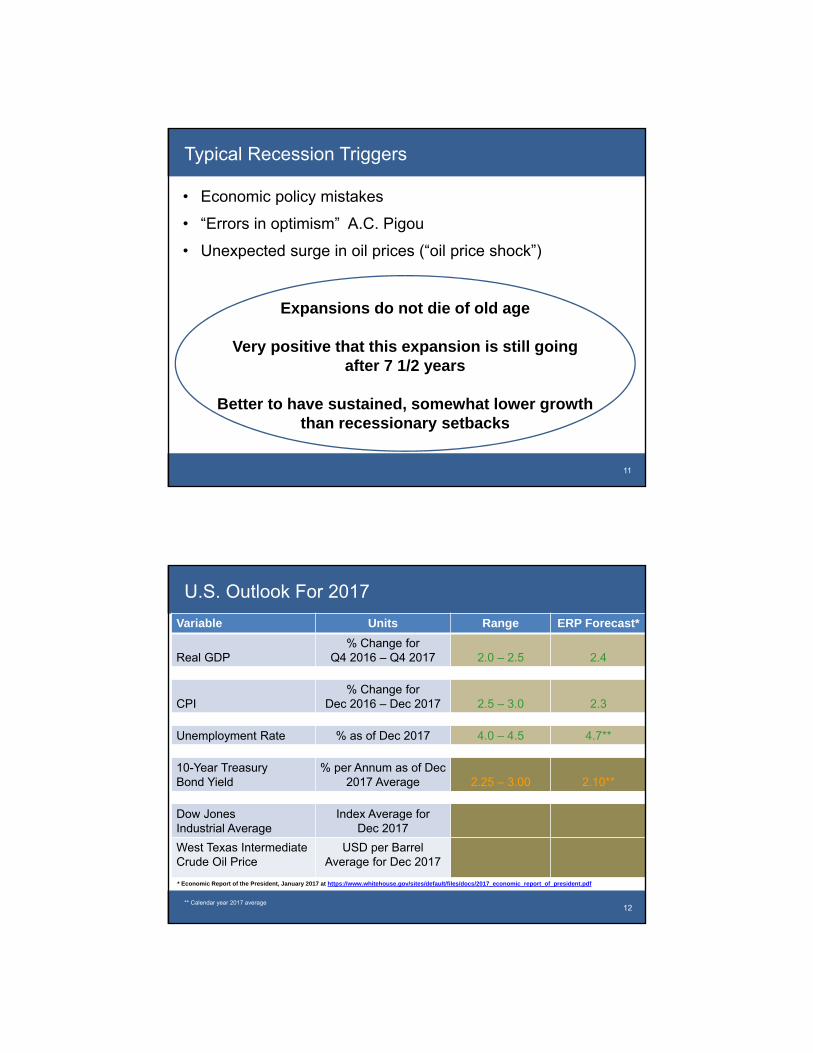
• Economic policy mistakes
• “Errors in optimism” A.C. Pigou
• Unexpected surge in oil prices (“oil price shock”)
Typical Recession Triggers
11
Expansions do not die of old age
Very positive that this expansion is still going after 7 1/2 years
Better to have sustained, somewhat lower growth than recessionary setbacks
U.S. Outlook For 2017
12
Variable Units Range ERP Forecast*
Real GDP% Change for
Q4 2016 – Q4 2017 2.0 – 2.5 2.4
CPI% Change for
Dec 2016 – Dec 2017 2.5 – 3.0 2.3
Unemployment Rate % as of Dec 2017 4.0 – 4.5 4.7**
10-Year TreasuryBond Yield
% per Annum as of Dec2017 Average 2.25 – 3.00 2.10**
Dow Jones Industrial Average
Index Average for Dec 2017
West Texas Intermediate Crude Oil Price
USD per Barrel Average for Dec 2017
* Economic Report of the President, January 2017 at https://www.whitehouse.gov/sites/default/files/docs/2017_economic_report_of_president.pdf
** Calendar year 2017 average

• Consumer spending growth trending in 3% range
‒ Income growth in 3.0 – 4.0% range (inflation adjustedwage growth of 2.0% PLUS job growth of 1.5% EQUALS income growth in this range)
• Inflation well contained
• Modest build in inventories this year
• Housing investment growth trending around 5%
• Still weak growth in plant and equipment investment
• Bigger trade deficit
• Government spending growth trending under 2%
Behind The Forecast
13
14
Climate Change Policy
Source: Harvard Institute of Politics, The Kennedy Schoolhttp://iop.harvard.edu/iop‐now/millennials‐global‐warmingBased on a survey of 3,000 Americans aged 18 to 29

Global Vehicle Stock (Parc) in 2050: What Parc and Where?
15
• “A 2.5-billion global vehicle parc would mean that to keep carbon emissions level withtoday's total, average fleet fuel efficiency would have to double.”
Source: http://www.greencarreports.com/news/1093560_1-2-billion-vehicles-on-worlds-roads-now-2-billion-by-2035-report
• The Paris Agreement goal of keeping warming to less than 2 degrees Celsius, and also tothe U.S. goal under the Paris Agreement to reduce net GHG emissions by 80% or morebelow 2005 levels by 2050.
• This long run goal would require a global parc with substantially different technology and aminimal wells-to-wheels carbon footprint.
1.0
1.5
2.0
2.5
0.0
0.5
1.0
1.5
2.0
2.5
3.0
2010 2020 2035 2050
Global Vehicle Parc ScenarioBils of Units
In Closing
16
Business Sector Poised To Grow
• Record corporate cash flow
• Global economy picking up
• Digital
• Innovation
• Potential for fiscal policy thrust
THE ARKANSAS ECONOMY IN 2017:KEEP YOUR SEATBELTS FASTENED
IN CASE OF TURBULENCE
Kathy Deck, Director
Center for Business and Economic Research
January 27, 2017

$‐
$10,000
$20,000
$30,000
$40,000
$50,000
$60,000
1970
1972
1974
1976
1978
1980
1982
1984
1986
1988
1990
1992
1994
1996
1998
2000
2002
2004
2006
2008
2010
2012
2014
Per Capita Personal Income
United States Arkansas Northwest ArkansasSource: Bureau of Economic Analysis
‐4.0%
‐2.0%
0.0%
2.0%
4.0%
6.0%
8.0%
Jan‐07
Jul‐07
Jan‐08
Jul‐08
Jan‐09
Jul‐09
Jan‐10
Jul‐10
Jan‐11
Jul‐11
Jan‐12
Jul‐12
Jan‐13
Jul‐13
Jan‐14
Jul‐14
Jan‐15
Jul‐15
Jan‐16
Jul‐16
Labor Force, Year Over Year Percent Change
United States Arkansas Northwest ArkansasSource: Bureau of Labor Statistics
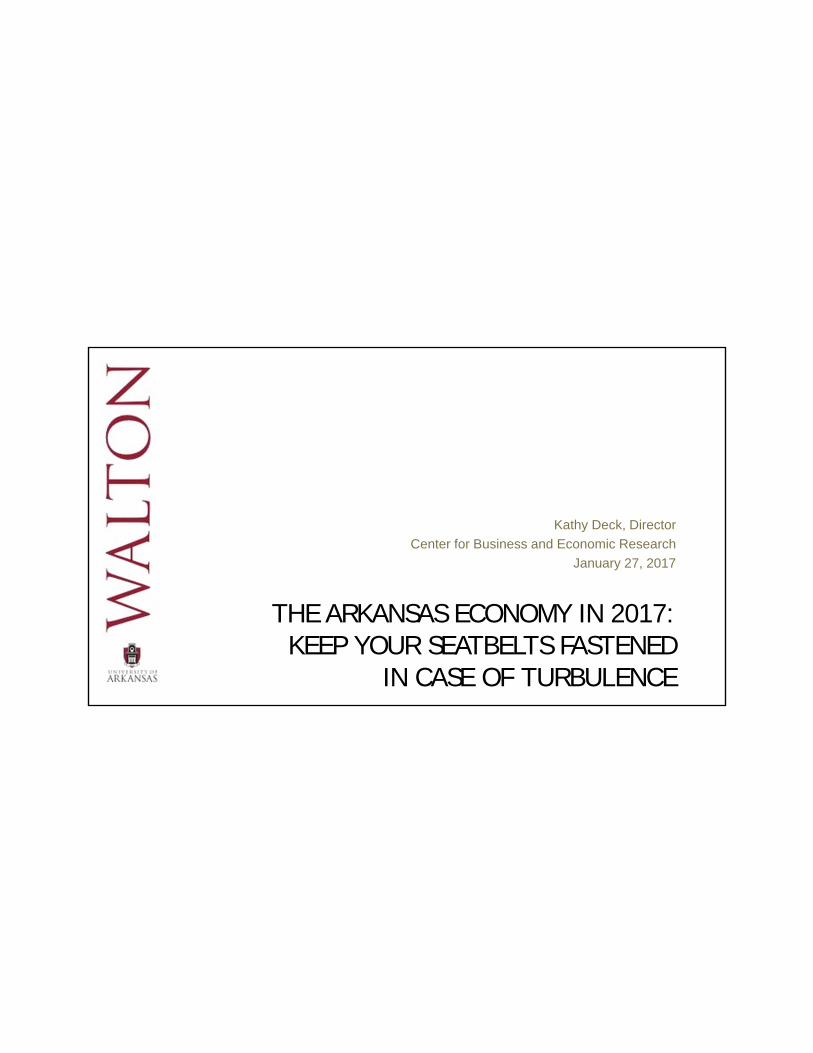
0.0%
2.0%
4.0%
6.0%
8.0%
10.0%
12.0%
Jan‐07
Jul‐07
Jan‐08
Jul‐08
Jan‐09
Jul‐09
Jan‐10
Jul‐10
Jan‐11
Jul‐11
Jan‐12
Jul‐12
Jan‐13
Jul‐13
Jan‐14
Jul‐14
Jan‐15
Jul‐15
Jan‐16
Jul‐16
Unemployment Rates, Not Seasonally Adjusted
United States Arkansas Northwest ArkansasSource: Bureau of Labor Statistics
1,120
1,140
1,160
1,180
1,200
1,220
1,240
1,260
Jan‐07
Jul‐07
Jan‐08
Jul‐08
Jan‐09
Jul‐09
Jan‐10
Jul‐10
Jan‐11
Jul‐11
Jan‐12
Jul‐12
Jan‐13
Jul‐13
Jan‐14
Jul‐14
Jan‐15
Jul‐15
Jan‐16
Jul‐16
Jan‐17
Jul‐17
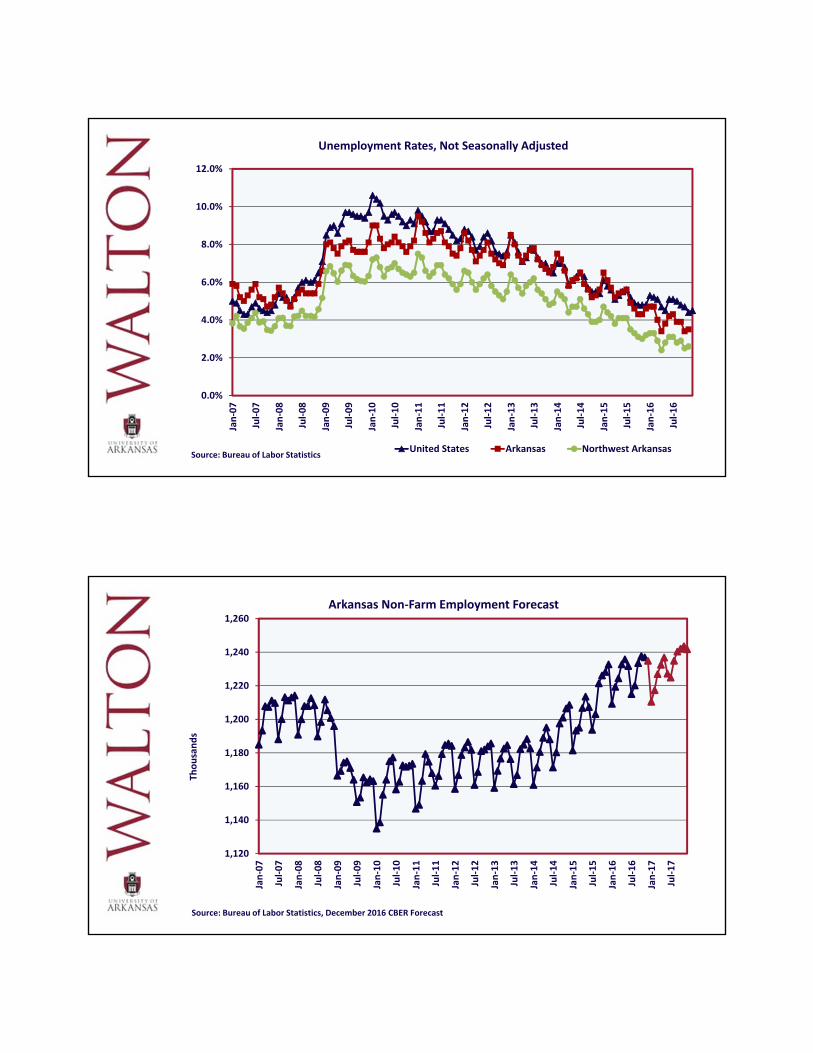
Arkansas Non‐Farm Employment Forecast
Source: Bureau of Labor Statistics, December 2016 CBER Forecast
Thousands
Mining and Logging0.5%
Construction4%
Manufacturing12%
Trade, Transportation and Utilities
21%
Information1%
Financial Activities4%Professional and
Business Services12%
Education and Health Services15%
Leisure and Hospitality9%
Other Services4%
Government18%
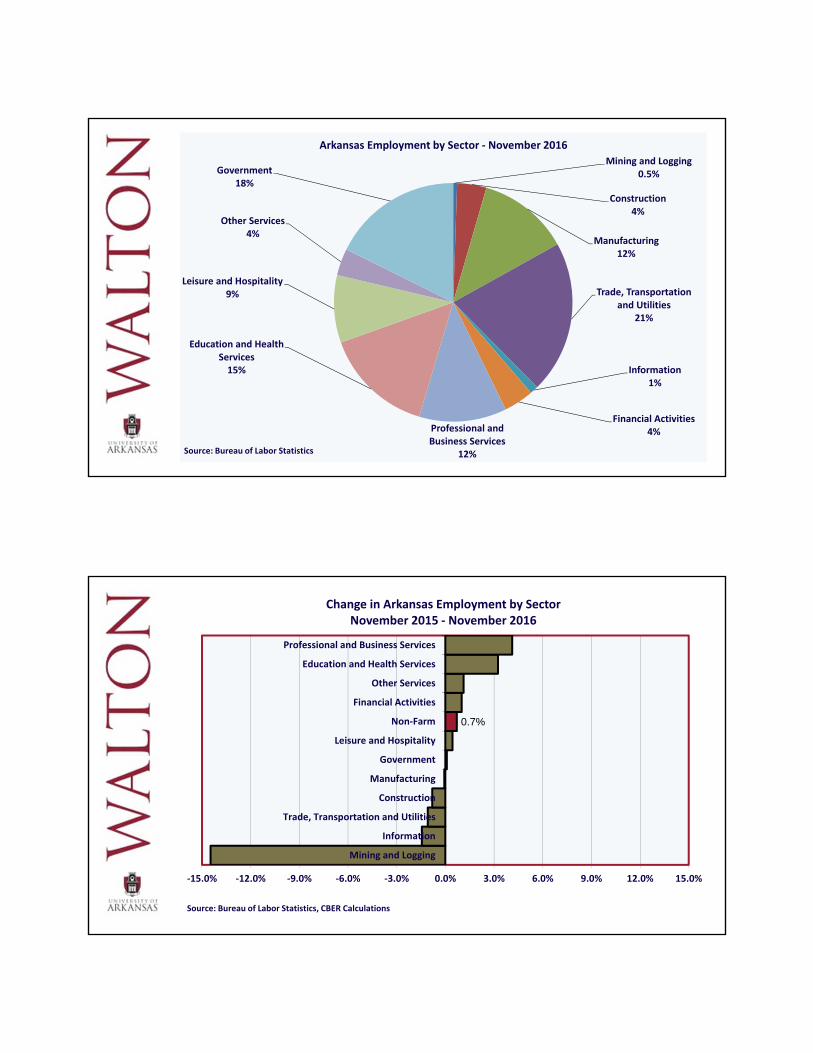
Arkansas Employment by Sector ‐ November 2016
Source: Bureau of Labor Statistics
0.7%
‐15.0% ‐12.0% ‐9.0% ‐6.0% ‐3.0% 0.0% 3.0% 6.0% 9.0% 12.0% 15.0%
Mining and Logging
Information
Trade, Transportation and Utilities
Construction
Manufacturing
Government
Leisure and Hospitality
Non‐Farm
Financial Activities
Other Services
Education and Health Services
Professional and Business Services
Change in Arkansas Employment by SectorNovember 2015 ‐ November 2016
Source: Bureau of Labor Statistics, CBER Calculations

190
200
210
220
230
240
250
260
Jan‐07
Jan‐08
Jan‐09
Jan‐10
Jan‐11
Jan‐12
Jan‐13
Jan‐14
Jan‐15
Jan‐16
Jan‐17
Northwest Arkansas Employment Forecast
Source: Bureau of Labor Statistics, December 2016 CBER Forecast
Thousands
Mining, Logging and Construction
4%
Manufacturing10%
Trade, Transportation and Utilities
22%
Information1%
Financial Activities3%
Professional and Business Services
21%
Education and Health Services11%
Leisure and Hospitality10%
Other Services3%
Government15%
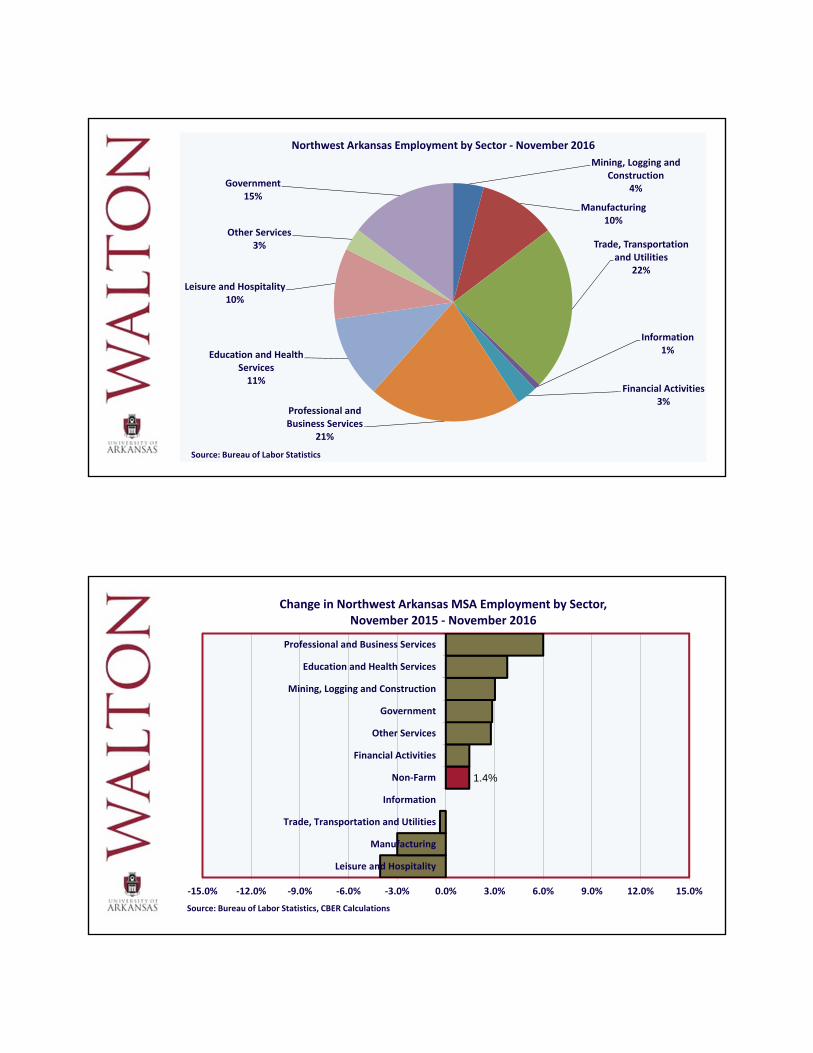
Northwest Arkansas Employment by Sector ‐ November 2016
Source: Bureau of Labor Statistics
1.4%
‐15.0% ‐12.0% ‐9.0% ‐6.0% ‐3.0% 0.0% 3.0% 6.0% 9.0% 12.0% 15.0%
Leisure and Hospitality
Manufacturing
Trade, Transportation and Utilities
Information
Non‐Farm
Financial Activities
Other Services
Government
Mining, Logging and Construction
Education and Health Services
Professional and Business Services
Change in Northwest Arkansas MSA Employment by Sector, November 2015 ‐ November 2016
Source: Bureau of Labor Statistics, CBER Calculations
2015 is a Year of Transition Watch for employment growth in places outside ofNorthwest and Central Arkansas for the state to prosper as it did in the early parts of 2016.
Higher per capita personal income is associated withcommunities that can invest in ‘soft’ amenities, whichcan lead to a virtuous cycle of growth.
Health care employment growth is likely to lead theway during much of 2017 in Northwest Arkansas.
The region will have to weather the changing nature ofemployment, particularly in the retail andtransportation industries. This is likely to dampengrowth from recent trends.
Critical investments are needed in technologicalinfrastructure (both physical and human capital) inNorthwest Arkansas for the area to compete in thecoming years.