Republic of Iraq Al-Anbar Investment Commission Invest in Anbar.
University of Anbar Assist prof.
College of science 2018 - 2019 Dr. Mohammed Ghazi
Dept. Of physic MATERIALS SCIENCE Chapter (6)
1
Phase Diagrams
6-1- Introduction
The understanding of phase diagrams for alloy systems is extremely
important because there is a strong correlation between microstructure
and mechanical properties, and the development of microstructure of an
alloy is related to the characteristics of its phase diagram. In addition,
phase diagrams provide valuable information about melting, casting,
crystallization, and other phenomena.
6-2- Solubility Limit
For many alloy systems and at some specific temperature, there is a
maximum concentration of solute atoms that may dissolve in the solvent
to form a solid solution; this is called a solubility limit. The addition of
solute in excess of this solubility limit results in the formation of another
solid solution or compound that has a distinctly different composition. To
illustrate this concept, consider the sugar–water (C12H22O11-H2O ) system.
Initially, as sugar is added to water, a sugar–water solution or syrup
forms. As more sugar is introduced, the solution becomes more
concentrated, until the solubility limit is reached, or the solution becomes
saturated with sugar. At this time the solution is not capable of dissolving
any more sugar, and further additions simply settle to the bottom of the
container. Thus, the system now consists of two separate substances: a
sugar–water syrup liquid solution and solid crystals of undissolved sugar.
This solubility limit of sugar in water depends on the temperature of
the water and may be represented in graphical form on a plot of
temperature along the ordinate and composition (in weight percent sugar)

University of Anbar Assist prof.
College of science 2018 - 2019 Dr. Mohammed Ghazi
Dept. Of physic MATERIALS SCIENCE Chapter (6)
2
along the abscissa, as shown in Figure 6.1. Along the composition axis,
increasing sugar concentration is from left to right, and percentage of
water is read from right to left. Since only two components are involved
(sugar and water), the sum of the concentrations at any composition will
equal 100 wt%. The solubility limit is represented as the nearly vertical
line in the figure. For compositions and temperatures to the left of the
solubility line, only the syrup liquid solution exists; to the right of the
line, syrup and solid sugar coexist. The solubility limit at some
temperature is the composition that corresponds to the intersection of the
given temperature coordinate and the solubility limit line. For example, at
20 oC the maximum solubility of sugar in water is 65 wt%. As Figure 6.1
indicates, the solubility limit increases slightly with rising temperature.
Figure 6.1 The solubility of sugar (C12H22O11-H2O ) in a
sugar–water syrup.

University of Anbar Assist prof.
College of science 2018 - 2019 Dr. Mohammed Ghazi
Dept. Of physic MATERIALS SCIENCE Chapter (6)
3
6-3- Phases and the phase diagram
Pure metallic elements have engineering applications; for example,
ultra-high purity copper (Cu) or aluminum (Al) is used to make
microelectronic circuitry. In most applications, however, we use alloys.
We define an “alloy” as a material that exhibits properties of a metallic
material and is made from multiple elements. A plain carbon steel is an
alloy of iron (Fe) and carbon (C). Corrosion-resistant stainless steels are
alloys that usually contain iron (Fe), carbon (C), chromium (Cr), nickel
(Ni), and some other elements.
A phase can be defined as any portion, including the whole, of a
system which is physically homogeneous within itself and bounded by a
surface that separates it from any other portions. For example, water has
three phases—liquid water, solid ice, and steam. A phase has the
following characteristics:
1. The same structure or atomic arrangement throughout;
2. Roughly the same composition and properties throughout; and
3. A definite interface between the phase and any surrounding or
adjoining phases.
If more than one phase is present in a given system, each will have its
own distinct properties, and a boundary separating the phases will exist
across which there will be a discontinuous and abrupt change in physical
and/or chemical characteristics. When two phases are present in a system,
it is not necessary that there be a difference in both physical and chemical
properties; a disparity in one or the other set of properties is sufficient.
Sometimes, a single-phase system is termed “homogeneous.” Systems
composed of two or more phases are termed “mixtures” or
“heterogeneous systems.” Most metallic alloys and, for that matter,
University of Anbar Assist prof.
College of science 2018 - 2019 Dr. Mohammed Ghazi
Dept. Of physic MATERIALS SCIENCE Chapter (6)
4
ceramic, polymeric, and composite systems are heterogeneous.
Ordinarily, the phases interact in such a way that the property
combination of the multiphase system is different from, and more
attractive than, either of the individual phases.
6-4- Microstructure
Many times, the physical properties and, in particular, the mechanical
behavior of a material depends on the microstructure. In metal alloys,
microstructure is characterized by the number of phases present, their
proportions, and the manner in which they are distributed or arranged.
The microstructure of an alloy depends on such variables as the alloying
elements present, their concentrations, and the heat treatment of the alloy
(i.e., the temperature, the heating time at temperature, and the rate of
cooling to room temperature).
6-5- Phase rule
Gibbs developed the phase rule in 1875–1876. It describes the
relationship between the number of components and the number of
phases for a given system and the conditions that may be allowed to
change (e.g., temperature, pressure, etc.). It has the general form:
2 + C = F + P (when temperature and pressure both can vary)
A useful mnemonic (something that will help you remember) for the
Gibbs phase rule is to start with a numeric and follow with the rest of the
terms alphabetically (i.e., C, F, and P) using all positive signs.
In the phase rule, C is the number of chemically independent
components, usually elements or compounds, in the system; F is the
number of degrees of freedom, or the number of variables (such as
University of Anbar Assist prof.
College of science 2018 - 2019 Dr. Mohammed Ghazi
Dept. Of physic MATERIALS SCIENCE Chapter (6)
5
temperature, pressure, or composition), that are allowed to change
independently without changing the number of phases in equilibrium; and
P is the number of phases present (please do not confuse P with
“pressure”). The constant “2” in this equation implies that both the
temperature and pressure are allowed to change. The term “chemically
independent” refers to the number of different elements or compounds
needed to specify a system. For example, water (H2O) is considered as a
one component system, since the concentrations of H and O in H2O
cannot be independently varied.
As an example of the use of the phase rule, let’s consider the case of
pure magnesium (Mg). Figure 6-1 shows a unary (C = 1) phase diagram
in which the lines divide the liquid, solid, and vapor phases. This unary
phase diagram is also called a pressure-temperature or P-T diagram. In
the unary phase diagram, there is only one component; in this case,
magnesium (Mg). Depending on the temperature and pressure, however,
there may be one, two, or even three phases present at any one time: solid
magnesium, liquid magnesium, and magnesium vapor. Note that at
atmospheric pressure (one atmosphere, given by the dashed line), the
intersection of the lines in the phase diagram give the usual melting and
boiling temperatures for magnesium. At very low pressures, a solid such
as magnesium (Mg) can sublime, or go directly to a vapor form without
melting, when it is heated.
Suppose we have a pressure and temperature that put us at point A in
the phase diagram (Figure 6-1). At this point, magnesium is all liquid.
The number of phases is one (liquid). The phase rule tells us that there are
two degrees of freedom. From phase rule:
2 + C = F + P, therefore, 2 + 1 = F + 1 (i.e., F = 2)

University of Anbar Assist prof.
College of science 2018 - 2019 Dr. Mohammed Ghazi
Dept. Of physic MATERIALS SCIENCE Chapter (6)
6
Figure 6-1 Schematic unary phase diagram for magnesium, showing the
melting and boiling temperatures at one atmosphere pressure.
On this diagram, point X is the triple point.
What does this mean? Within limits, as seen in Figure 6-1, we can
change the pressure, the temperature, or both, and still be in an all-liquid
portion of the diagram. Put another way, we must fix both the
temperature and the pressure to know precisely where we are in the liquid
portion of the diagram.
Consider point B, the boundary between the solid and liquid portions
of the diagram. The number of components, C, is still one, but at point B,
the solid and liquid coexist, or the number of phases P is two. From the
phase rule,
2 + C = F + P, therefore, 2 + 1 = F + 2 (i.e, F = 1)
Or there is only one degree of freedom. For example, if we change the
temperature, the pressure must also be adjusted if we are to stay on the
boundary where the liquid and solid coexist. On the other hand, if we fix

University of Anbar Assist prof.
College of science 2018 - 2019 Dr. Mohammed Ghazi
Dept. Of physic MATERIALS SCIENCE Chapter (6)
7
the pressure, the phase diagram tells us the temperature that we must have
if solid and liquid are to coexist.
Finally, at point X, solid, liquid, and vapor coexist. While the number
of components is still one, there are three phases. The number of degrees
of freedom is zero:
2 + C = F + P, therefore, 2 + 1 = F + 3 (i.e., F = 0)
Now we have no degrees of freedom; all three phases coexist only if
both the temperature and the pressure are fixed. A point on the phase
diagram at which the solid, liquid, and gaseous phases coexist under
equilibrium conditions is the triple point (Figure 6-1).
6-6- Phase Equilibrium
Equilibrium is another essential concept that is best described in
terms of a thermodynamic quantity called the free energy. In brief, free
energy is a function of the internal energy of a system, and also the
randomness or disorder of the atoms or molecules (or entropy). A system
is at equilibrium if its free energy is at a minimum under some specified
combination of temperature, pressure, and composition. In a macroscopic
sense, this means that the characteristics of the system do not change with
time but persist indefinitely; that is, the system is stable. A change in
temperature, pressure, and/or composition for a system in equilibrium
will result in an increase in the free energy and in a possible spontaneous
change to another state whereby the free energy is lowered.
The term phase equilibrium, often used in the context of this
discussion, refers to equilibrium as it applies to systems in which more
than one phase may exist. Phase equilibrium is reflected by a constancy

University of Anbar Assist prof.
College of science 2018 - 2019 Dr. Mohammed Ghazi
Dept. Of physic MATERIALS SCIENCE Chapter (6)
8
with time in the phase characteristics of a system. Perhaps an example
best illustrates this concept. Suppose that a sugar–water syrup is
contained in a closed vessel and the solution is in contact with solid sugar
at 20 oC. If the system is at equilibrium, the composition of the syrup is
65 wt% C12H22O11-35 wt% H2O (Figure 6.1), and the amounts and
compositions of the syrup and solid sugar will remain constant with time.
If the temperature of the system is suddenly raised - say, to 100 oC - this
equilibrium or balance is temporarily upset in that the solubility limit has
been increased to 80 wt% C12H22O11 (Figure 6.1). Thus, some of the solid
sugar will go into solution in the syrup. This will continue until the new
equilibrium syrup concentration is established at the higher temperature.
This sugar–syrup example illustrates the principle of phase
equilibrium using a liquid–solid system. In many metallurgical and
materials systems of interest, phase equilibrium involves just solid
phases. In this regard the state of the system is reflected in the
characteristics of the microstructure, which necessarily include not only
the phases present and their compositions but, in addition, the relative
phase amounts and their spatial arrangement or distribution. It is often the
case, especially in solid systems, that a state of equilibrium is never
completely achieved because the rate of approach to equilibrium is
extremely slow; such a system is said to be in a nonequilibrium or
metastable state. For example, some steel and aluminum alloys rely for
their strength on the development of metastable microstructures during
carefully designed heat treatments.
Thus not only is an understanding of equilibrium states and structures
important, but also the speed or rate at which they are established and the
factors that affect the rate must be considered.

University of Anbar Assist prof.
College of science 2018 - 2019 Dr. Mohammed Ghazi
Dept. Of physic MATERIALS SCIENCE Chapter (6)
9
6-7- Equilibrium phase diagrams
Phase diagrams are helpful in predicting phase transformations and
the resulting microstructures, which may have equilibrium or
nonequilibrium character. Equilibrium phase diagrams represent the
relationships between temperature and the compositions and the
quantities of phases at equilibrium. There are several different varieties;
but in the present discussion, temperature and composition are the
variable parameters, for binary alloys. A binary alloy is one that contains
two components. If more than two components are present, phase
diagrams become extremely complicated and difficult to represent.
External pressure is also a parameter that influences the phase
structure. However, in practicality, pressure remains virtually constant in
most applications; thus, the phase diagrams presented here are for a
constant pressure of one atmosphere (1 atm).
6-7-1- Binary Isomorphous Systems
Possibly the easiest type of binary phase diagram to understand and
interpret is the type that is characterized by the copper–nickel system
(Figure 6.2a). Temperature is plotted along the ordinate, and the abscissa
represents the composition of the alloy, in weight percent (bottom) and
atom percent (top) of nickel. The composition ranges from 0 wt% Ni (100
wt% Cu) on the left horizontal extremity to 100 wt% Ni (0 wt% Cu) on
the right. Three different phase regions, or fields, appear on the diagram,
an alpha (α) field, a liquid (L) field, and a two-phase α+L field. Each
region is defined by the phase or phases that exist over the range of
temperatures and compositions delimited by the phase boundary lines.
University of Anbar Assist prof.
College of science 2018 - 2019 Dr. Mohammed Ghazi
Dept. Of physic MATERIALS SCIENCE Chapter (6)
10
The liquid L is a homogeneous liquid solution composed of both
copper and nickel. The α phase is a substitutional solid solution
consisting of both Cu and Ni atoms, and having an FCC crystal structure.
At temperatures below about 1080 oC copper and nickel are mutually
soluble in each other in the solid state for all compositions. This complete
solubility is explained by the fact that both Cu and Ni have the same
crystal structure (FCC).The copper–nickel system is termed isomorphous
because of this complete liquid and solid solubility of the two
components.
For Figure 6.2a, the solidus and liquidus lines intersect at the two
composition extremities; these correspond to the melting temperatures of
the pure components. For example, the melting temperatures of pure
copper and nickel are 1085 oC and 1453
oC respectively. Heating pure
copper corresponds to moving vertically up the left-hand temperature
axis. Copper remains solid until its melting temperature is reached.The
solid-to-liquid transformation takes place at the melting temperature, and
no further heating is possible until this transformation has been
completed.
For any composition other than pure components, this melting
phenomenon will occur over the range of temperatures between the
solidus and liquidus lines; both solid and liquid phases will be in
equilibrium within this temperature range. For example, upon heating an
alloy of composition 50 wt% Ni–50 wt% Cu (Figure 6.2a), melting
begins at approximately 1280 oC (2340
oF); the amount of liquid phase
continuously increases with temperature until about 1320 oC (2410
oF), at
which the alloy is completely liquid.

University of Anbar Assist prof.
College of science 2018 - 2019 Dr. Mohammed Ghazi
Dept. Of physic MATERIALS SCIENCE Chapter (6)
11
Figure 6.2 (a) The copper–nickel phase diagram. (b) A portion of the
copper–nickel phase diagram for which compositions and phase
amounts are determined at point B. (Adapted from Phase
Diagrams of Binary Nickel Alloys,
University of Anbar Assist prof.
College of science 2018 - 2019 Dr. Mohammed Ghazi
Dept. Of physic MATERIALS SCIENCE Chapter (6)
12
6-8- Interpretation of Phase Diagrams
For a binary system of known composition and temperature that is at
equilibrium, at least three kinds of information are available: (1) the
phases that are present, (2) the compositions of these phases, and (3) the
percentages or fractions of the phases. The procedures for making these
determinations will be demonstrated using the copper–nickel system.
6-8-1- Phases Present
The establishment of what phases are present is relatively simple. One
just locates the temperature–composition point on the diagram and notes
the phase(s) with which the corresponding phase field is labeled. For
example, an alloy of composition 60 wt% Ni–40 wt% Cu at 1100 oC
would be located at point A in Figure 6.2a; since this is within the α
region, only the single α phase will be present. On the other hand, a
35 wt% Ni–65 wt% Cu alloy at 1250 oC (point B) will consist of both α
and liquid phases at equilibrium.
6-8-2- Determination of Phase Compositions
The first step in the determination of phase compositions (in terms of
the concentrations of the components) is to locate the temperature–
composition point on the phase diagram. Different methods are used for
single- and two-phase regions. If only one phase is present, the procedure
is trivial: the composition of this phase is simply the same as the overall
composition of the alloy.
For an alloy having composition and temperature located in a two-
phase region, the situation is more complicated. In all two-phase regions
University of Anbar Assist prof.
College of science 2018 - 2019 Dr. Mohammed Ghazi
Dept. Of physic MATERIALS SCIENCE Chapter (6)
13
(and in two-phase regions only), one may imagine a series of horizontal
lines, one at every temperature; each of these is known as a tie line, or
sometimes as an isotherm. These tie lines extend across the two-phase
region and terminate at the phase boundary lines on either side. To
compute the equilibrium concentrations of the two phases, the following
procedure is used:
1. A tie line is constructed across the two-phase region at the
temperature of the alloy.
2. The intersections of the tie line and the phase boundaries on either
side are noted.
3. Perpendiculars are dropped from these intersections to the horizontal
composition axis, from which the composition of each of the
respective phases is read.
For example, consider again the 35 wt% Ni–65 wt% Cu alloy at
located at point B in Figure 6.2b and lying within the α+L region. Thus,
the problem is to determine the composition (in wt% Ni and Cu) for both
the α and liquid phases. The tie line has been constructed across the α+L
phase region, as shown in Figure 6.2b. The perpendicular from the
intersection of the tie line with the liquidus boundary meets the
composition axis at 31.5 wt% Ni–68.5 wt% Cu, which is the composition
of the liquid phase, CL. Likewise, for the solidus–tie line intersection, we
find a composition for the α solid-solution phase, Cα, of 42.5 wt% Ni–
57.5 wt% Cu.
6-8-3- Determination of Phase Amounts
The relative amounts (as fraction or as percentage) of the phases
present at equilibrium may also be computed with the aid of phase

University of Anbar Assist prof.
College of science 2018 - 2019 Dr. Mohammed Ghazi
Dept. Of physic MATERIALS SCIENCE Chapter (6)
14
diagrams. Again, the single- and two-phase situations must be treated
separately. The solution is obvious in the single-phase region: Since only
one phase is present, the alloy is composed entirely of that phase; that is,
the phase fraction is 1.0 or, alternatively, the percentage is 100%. From
the previous example for the 60 wt% Ni–40 wt% Cu alloy at 1100 oC
(point A in Figure 6.2a), only the α phase is present; hence, the alloy is
completely or 100% α.
If the composition and temperature position is located within a two-
phase region, things are more complex. The tie line must be utilized in
conjunction with a procedure that is often called the lever rule (or the
inverse lever rule), which is applied as follows:
1. The tie line is constructed across the two-phase region at the
temperature of the alloy.
2. The overall alloy composition is located on the tie line.
3. The fraction of one phase is computed by taking the length of tie
line from the overall alloy composition to the phase boundary for
the other phase, and dividing by the total tie line length.
4. The fraction of the other phase is determined in the same manner.
5. If phase percentages are desired, each phase fraction is multiplied
by 100. When the composition axis is scaled in weight percent, the
phase fractions computed using the lever rule are mass fractions-
the mass (or weight) of a specific phase divided by the total alloy
mass (or weight). The mass of each phase is computed from the
product of each phase fraction and the total alloy mass.
Consider again the example shown in Figure 6.2b, in which at 1250
oC both α and liquid phases are present for a 35 wt% Ni–65 wt% Cu
alloy. The problem is to compute the fraction of each of the α and liquid

University of Anbar Assist prof.
College of science 2018 - 2019 Dr. Mohammed Ghazi
Dept. Of physic MATERIALS SCIENCE Chapter (6)
15
phases. The tie line has been constructed that was used for the
determination of α and L phase compositions. Let the overall alloy
composition be located along the tie line and denoted as Co, and mass
fractions be represented by WL and Wα for the respective phases. From
the lever rule, WL may be computed according to:
𝑊𝐿 = 𝑆
𝑅 + 𝑆 … … … . (1)
Or, by subtracting compositions,
𝑊𝐿 = 𝐶𝛼 − 𝐶𝑜
𝐶𝛼 − 𝐶𝐿 … … … . (2)
Composition need be specified in terms of only one of the
constituents for a binary alloy; for the computation above, weight percent
nickel will be used (i.e., Co= 35 wt% Ni, Cα= 42.5 wt% Ni, and CL= 31.5
wt% Ni), and:
𝑊𝐿 = 42.5 − 35
42.5 − 31.5= 0.68
Similarly, for the α phase,
𝑊𝑎 = 𝑅
𝑅 + 𝑆 … … … . (3)
𝑊𝐿 = 𝐶𝑜 − 𝐶𝐿
𝐶𝛼 − 𝐶𝐿 … … … . (4)
𝑊𝐿 = 35 − 31.5
42.5 − 31.5= 0.32
Of course, identical answers are obtained if compositions are expressed in
weight percent copper instead of nickel.
Thus, the lever rule may be employed to determine the relative
amounts or fractions of phases in any two-phase region for a binary alloy
if the temperature and composition are known and if equilibrium has been
established.

University of Anbar Assist prof.
College of science 2018 - 2019 Dr. Mohammed Ghazi
Dept. Of physic MATERIALS SCIENCE Chapter (6)
16
For any alloy consisting of a single phase, the composition of that
phase is the same as the total alloy composition. If two phases are
present, the tie line must be employed, the extremities of which determine
the compositions of the respective phases.
Example (1):
For multiphase alloys, it is often more convenient to specify relative
phase amount in terms of volume fraction rather than mass fraction.
Phase volume fractions are preferred because they (rather than mass
fractions) may be determined from examination of the microstructure;
furthermore, the properties of a multiphase alloy may be estimated on the
basis of volume fractions.
For an alloy consisting of α and β phases, the volume fraction of the α
phase, Va is defined as:
6-2b

University of Anbar Assist prof.
College of science 2018 - 2019 Dr. Mohammed Ghazi
Dept. Of physic MATERIALS SCIENCE Chapter (6)
17
𝑉𝑎 = 𝑣𝛼
𝑣𝛼 + 𝑣𝛽 … … … . (5)
Where va and vB denote the volumes of the respective phases in the alloy.
Of course, an analogous expression exists for and, for an alloy consisting
of just two phases, it is the case that Va + VB= 1
On occasion conversion from mass fraction to volume fraction (or
vice versa) is desired. Equations that facilitate these conversions are as
follows:
𝑉𝛼 =
𝑊𝛼
𝜌𝛼
𝑊𝛼
𝜌𝛼+
𝑊𝛽
𝜌𝛽
… … … . (6)
𝑉𝛽 =
𝑊𝛽
𝜌𝛽
𝑊𝛼
𝜌𝛼+
𝑊𝛽
𝜌𝛽
… … … . (7)
𝑊𝛼 = 𝑉𝛼𝜌𝛼
𝑉𝛼𝜌𝛼 + 𝑉𝛽𝜌𝛽 … … … . (8)
𝑊𝛽 = 𝑉𝛽𝜌𝛽
𝑉𝛼𝜌𝛼 + 𝑉𝛽𝜌𝛽 … … … . (9)
In these expressions, ρα and ρβ are the densities of the respective phases.
When the densities of the phases in a two-phase alloy differ
significantly, there will be quite a disparity between mass and volume
fractions; conversely, if the phase densities are the same, mass and
volume fractions are identical.

University of Anbar Assist prof.
College of science 2018 - 2019 Dr. Mohammed Ghazi
Dept. Of physic MATERIALS SCIENCE Chapter (6)
18
6-9- Development of Microstructure in Isomorphous Alloys
6-9-1- Equilibrium Cooling
At this point it is instructive to examine the development of
microstructure that occurs for isomorphous alloys during solidification.
We first treat the situation in which the cooling occurs very slowly, in
that phase equilibrium is continuously maintained.
Figure 6.3 Schematic representation of the development of
microstructure during the equilibrium solidification of a
35 wt% Ni–65 wt% Cu alloy.

University of Anbar Assist prof.
College of science 2018 - 2019 Dr. Mohammed Ghazi
Dept. Of physic MATERIALS SCIENCE Chapter (6)
19
Let us consider the copper–nickel system (Figure 6.2a), specifically
an alloy of composition 35 wt% Ni–65 wt% Cu as it is cooled from 1300
oC. The region of the Cu–Ni phase diagram in the vicinity of this
composition is shown in Figure 6.3.
Cooling of an alloy of the above composition corresponds to moving
down the vertical dashed line. At 1300 oC, point a, the alloy is completely
liquid (of composition 35 wt% Ni–65 wt% Cu) and has the
microstructure represented by the circle inset in the figure. As cooling
begins, no microstructural or compositional changes will be realized until
we reach the liquidus line (point b, ~1260 oC).At this point, the first solid
α begins to form, which has a composition dictated by the tie line drawn
at this temperature [i.e., 46 wt% Ni–54 wt% Cu, noted as α(46 Ni)];
the composition of liquid is still approximately 35 wt% Ni–65 wt% Cu
[L(35 Ni)], which is different from that of the solid α.With continued
cooling, both compositions and relative amounts of each of the phases
will change. The compositions of the liquid and α phases will follow the
liquidus and solidus lines, respectively. Furthermore, the fraction of the α
phase will increase with continued cooling. Note that the overall alloy
composition (35 wt% Ni–65 wt% Cu) remains unchanged during cooling
even though there is a redistribution of copper and nickel between the
phases.
At 1250 oC, point c in Figure 6.3, the compositions of the liquid and α
phases are 32 wt% Ni–68 wt% Cu [L(32 Ni)] and 43 wt% Ni–57 wt% Cu
[α(43 Ni)], respectively.
The solidification process is virtually complete at about 1220 oC,
point d; the composition of the solid α is approximately 35 wt% Ni–
65 wt% Cu (the overall alloy composition) while that of the last
remaining liquid is 24 wt% Ni–76 wt% Cu. Upon crossing the solidus

University of Anbar Assist prof.
College of science 2018 - 2019 Dr. Mohammed Ghazi
Dept. Of physic MATERIALS SCIENCE Chapter (6)
20
line, this remaining liquid solidifies; the final product then is a
polycrystalline α-phase solid solution that has a uniform 35 wt% Ni–65
wt% Cu composition (point e, Figure 6.3). Subsequent cooling will
produce no microstructural or compositional alterations.
6-9-2- Nonequilibrium Cooling
Some of the consequences of nonequilibrium solidification for
isomorphous alloys will now be discussed by considering a 35 wt% Ni–
65 wt% Cu alloy, the same composition that was used for equilibrium
cooling in the previous section. The portion of the phase diagram near
this composition is shown in Figure 6.4; in addition, microstructures and
associated phase compositions at various temperatures upon cooling are
noted in the circular insets. To simplify this discussion it will be assumed
that diffusion rates in the liquid phase are sufficiently rapid such that
equilibrium is maintained in the liquid.
Let us begin cooling from a temperature of about 1300 oC; this is
indicated by point αʹ in the liquid region. This liquid has a composition of
35 wt% Ni–65 wt% Cu [noted as L(35 Ni) in the figure], and no changes
occur while cooling through the liquid phase region (moving down
vertically from point αʹ). At point bʹ (approximately 1260 oC), α-phase
particles begin to form, which, from the tie line constructed, have a
composition of 46 wt% Ni–54 wt% Cu [ α(46 Ni)].
Upon further cooling to point cʹ (about 1240 oC), the liquid
composition has shifted to 29 wt% Ni–71 wt% Cu; furthermore, at this
temperature the composition of the α phase that solidified is 40 wt% Ni–
60 wt% Cu [α(40 Ni)]. However, since diffusion in the solid α phase is
relatively slow, the α phase that formed at point bʹ has not changed

University of Anbar Assist prof.
College of science 2018 - 2019 Dr. Mohammed Ghazi
Dept. Of physic MATERIALS SCIENCE Chapter (6)
21
composition appreciably—i.e., it is still about 46 wt% Ni—and the
composition of the α grains has continuously changed with radial
position, from 46 wt% Ni at grain centers to 40 wt% Ni at the outer grain
perimeters. Thus, at point cʹ, the average composition of the solid α
grains that have formed would be some volume weighted average
composition, lying between 46 and 40 wt% Ni; for the sake of argument,
let us take this average composition to be 42 wt% Ni–58 wt% Cu [α(42
Ni)].
Figure 6.4 Schematic representation of the development of
microstructure during the nonequilibrium solidification of a
35 wt% Ni–65 wt% Cu alloy.
University of Anbar Assist prof.
College of science 2018 - 2019 Dr. Mohammed Ghazi
Dept. Of physic MATERIALS SCIENCE Chapter (6)
22
At point dʹ (~1220 oC) and for equilibrium cooling rates,
solidification should be completed. However, for this nonequilibrium
situation, there is still an appreciable proportion of liquid remaining, and
the α phase that is forming has a composition of 35 wt% Ni [α(35 Ni)];
also the average α-phase composition at this point is 38 wt% Ni [α(38
Ni)].
Nonequilibrium solidification finally reaches completion at point eʹ
(~1205 oC ). The composition of the last α phase to solidify at this point is
about 31 wt% Ni; the average composition of the α phase at complete
solidification is 35 wt% Ni. The inset at point fʹ shows the microstructure
of the totally solid material.
The degree of displacement of the nonequilibrium solidus curve from
the equilibrium one will depend on rate of cooling. The slower the
cooling rate, the smaller this displacement; that is, the difference between
the equilibrium solidus and average solid composition is lower.
Furthermore, if the diffusion rate in the solid phase is increased, this
displacement will be diminished.
There are some important consequences for isomorphous alloys that
have solidified under nonequilibrium conditions. As discussed above, the
distribution of the two elements within the grains is nonuniform, a
phenomenon termed segregation; that is, concentration gradients are
established across the grains that are represented by the insets of Figure
6.4. The center of each grain, which is the first part to freeze, is rich in the
high-melting element (e.g., nickel for this Cu–Ni system), whereas the
concentration of the low-melting element increases with position from
this region to the grain boundary.

University of Anbar Assist prof.
College of science 2018 - 2019 Dr. Mohammed Ghazi
Dept. Of physic MATERIALS SCIENCE Chapter (6)
23
6-10- Mechanical Properties of Isomorphous Alloys
We shall now briefly explore how the mechanical properties of solid
isomorphous alloys are affected by composition as other structural
variables (e.g., grain size) are held constant. For all temperatures and
compositions below the melting temperature of the lowest-melting
component, only a single solid phase will exist. Therefore, each
component will experience solid-solution strengthening, or an increase in
strength and hardness by additions of the other component. This effect is
demonstrated in Figure 6.5a as tensile strength versus composition for the
copper–nickel system at room temperature; at some intermediate
composition, the curve necessarily passes through a maximum. Plotted in
Figure 6.5b is the ductility (%EL)–composition behavior, which is just
the opposite of tensile strength; that is, ductility decreases with additions
of the second component, and the curve exhibits a minimum.
Figure 6.5 For the copper–nickel system, (a) tensile strength versus
composition, and (b) ductility (%EL) versus composition
at room temperature. A solid solution exists over all
compositions for this system.

University of Anbar Assist prof.
College of science 2018 - 2019 Dr. Mohammed Ghazi
Dept. Of physic MATERIALS SCIENCE Chapter (6)
24
6-11- Binary Eutectic system
Another type of common and relatively simple phase diagram found
for binary alloys is shown in Figure 6.6 for the copper–silver system; this
is known as a binary eutectic phase diagram. A number of features of this
phase diagram are important and worth noting. First, three single-phase
regions are found on the diagram: α, β, and liquid. The α phase is a solid
solution rich in copper; it has silver as the solute component and an FCC
crystal structure. The β phase solid solution also has an FCC structure,
but copper is the solute. Pure copper and pure silver are also considered
to be α and β phases, respectively.
Figure 6.6 The copper–silver phase diagram.

University of Anbar Assist prof.
College of science 2018 - 2019 Dr. Mohammed Ghazi
Dept. Of physic MATERIALS SCIENCE Chapter (6)
25
Thus, the solubility in each of these solid phases is limited, in that at
any temperature below line BEG only a limited concentration of silver
will dissolve in copper (for the α phase), and similarly for copper in silver
(for the β phase). The solubility limit for the α phase corresponds to the
boundary line, labeled CBA, between the α/( α + β) and α/( α + L) phase
regions; it increases with temperature to a maximum [8.0 wt% Ag at 779
oC(1434
oF)] at point B, and decreases back to zero at the melting
temperature of pure copper, point A [1085 oC(1985
oF)]. At temperatures
below 779 oC(1434
oF), the solid solubility limit line separating the α and
α + β phase regions is termed a solvus line; the boundary AB between the
α and α + L fields is the solidus line, as indicated in Figure 6.6. For the β
phase, both solvus and solidus lines also exist, HG and GF, respectively,
as shown. The maximum solubility of copper in the β phase, point G (8.8
wt% Cu), also occurs at 779 oC(1434
oF). This horizontal line BEG,
which is parallel to the composition axis and extends between these
maximum solubility positions, may also be considered a solidus line; it
represents the lowest temperature at which a liquid phase may exist for
any copper–silver alloy that is at equilibrium.
There are also three two-phase regions found for the copper–silver
system (Figure 6.6): α + L, β + L and α + β. The α and β phase solid
solutions coexist for all compositions and temperatures within the α + β
phase field; the α + liquid and β + liquid phases also coexist in their
respective phase regions. Furthermore, compositions and relative
amounts for the phases may be determined using tie lines and the lever
rule as outlined previously.
As silver is added to copper, the temperature at which the alloys
become totally liquid decreases along the liquidus line, line AE; thus, the
melting temperature of copper is lowered by silver additions. The same
University of Anbar Assist prof.
College of science 2018 - 2019 Dr. Mohammed Ghazi
Dept. Of physic MATERIALS SCIENCE Chapter (6)
26
may be said for silver: the introduction of copper reduces the temperature
of complete melting along the other liquidus line, FE. These liquidus
lines meet at the point E on the phase diagram, through which also passes
the horizontal isotherm line BEG. Point E is called an invariant point,
which is designated by the composition and temperature for the copper–
silver system; the values of CE and TE are 71.9 wt% Ag and 779 oC (1434
oF), respectively.
An important reaction occurs for an alloy of composition CE as it
changes temperature in passing through TE this reaction may be written as
follows:
Or, upon cooling, a liquid phase is transformed into the two solid α
and β phases at the temperature TE, the opposite reaction occurs upon
heating. This is called a eutectic reaction (eutectic means easily melted),
and CE and TE represent the eutectic composition and temperature,
respectively; CαE and CβE are the respective compositions of the α and β
phases at TE. Thus, for the copper–silver system, the eutectic reaction,
may be written as follows:
Often, the horizontal solidus line at TE is called the eutectic isotherm.
On occasion, low-melting-temperature alloys are prepared having
near-eutectic compositions. A familiar example is the 60–40 solder,
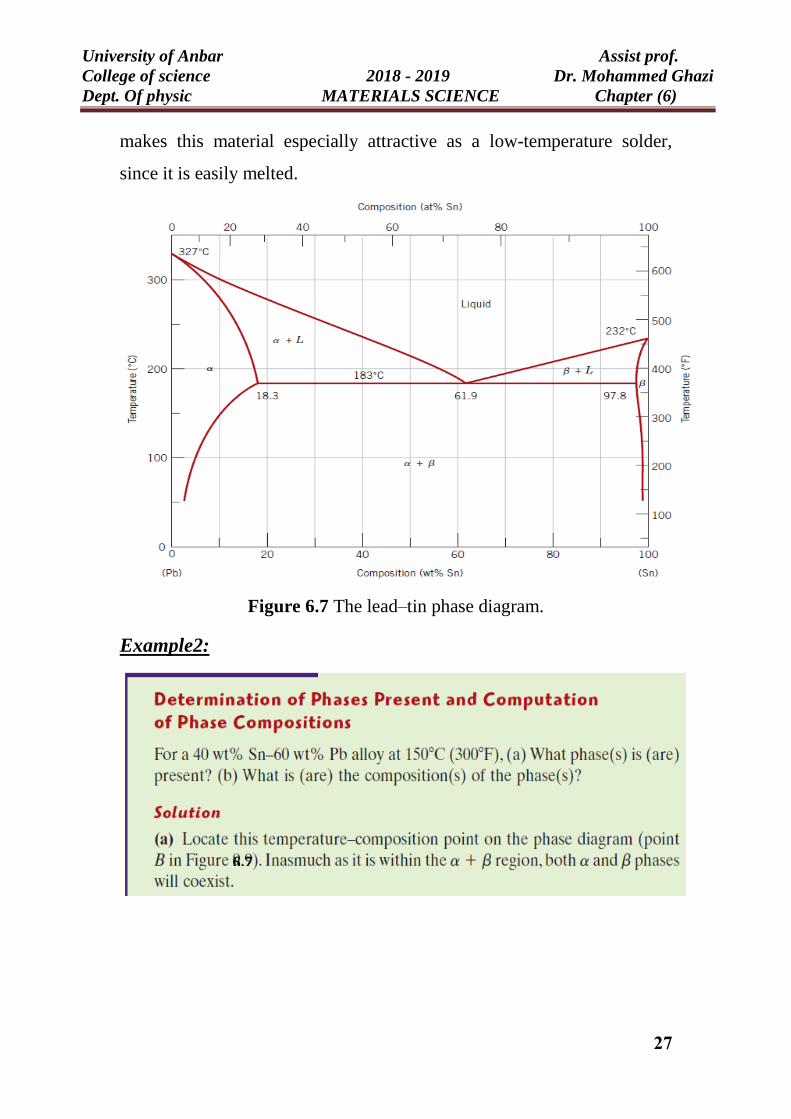
containing 60 wt% Sn and 40 wt% Pb. Figure 6.7 indicates that an alloy
of this composition is completely molten at about 185 oC (365
oF), which
University of Anbar Assist prof.
College of science 2018 - 2019 Dr. Mohammed Ghazi
Dept. Of physic MATERIALS SCIENCE Chapter (6)
27
makes this material especially attractive as a low-temperature solder,
since it is easily melted.
Figure 6.7 The lead–tin phase diagram.
Example2:
6.7

University of Anbar Assist prof.
College of science 2018 - 2019 Dr. Mohammed Ghazi
Dept. Of physic MATERIALS SCIENCE Chapter (6)
28

University of Anbar Assist prof.
College of science 2018 - 2019 Dr. Mohammed Ghazi
Dept. Of physic MATERIALS SCIENCE Chapter (6)
29
Example 3:

University of Anbar Assist prof.
College of science 2018 - 2019 Dr. Mohammed Ghazi
Dept. Of physic MATERIALS SCIENCE Chapter (6)
30
Example 4: From the phase diagram for the NiO-MgO binary system [Figure 6-8],
describe a composition that can melt at 2600°C but will not melt when
placed into service at 2300°C.
Figure 6-8 The equilibrium phase diagrams for the Cu-Ni
and NiO-MgO systems.
Solution:
The material must have a liquidus temperature below 2600°C, but a
solidus temperature above 2300°C. The NiO-MgO phase diagram [Figure
6-8] permits us to choose an appropriate composition.
To identify a composition with a liquidus temperature below 2600°C,
there must be less than 60 mol% MgO in the refractory. To identify a
composition with a solidus temperature above 2300°C, there must be at
least 50 mol% MgO present. Consequently, we can use any composition
between 50 mol% MgO and 60 mol% MgO.
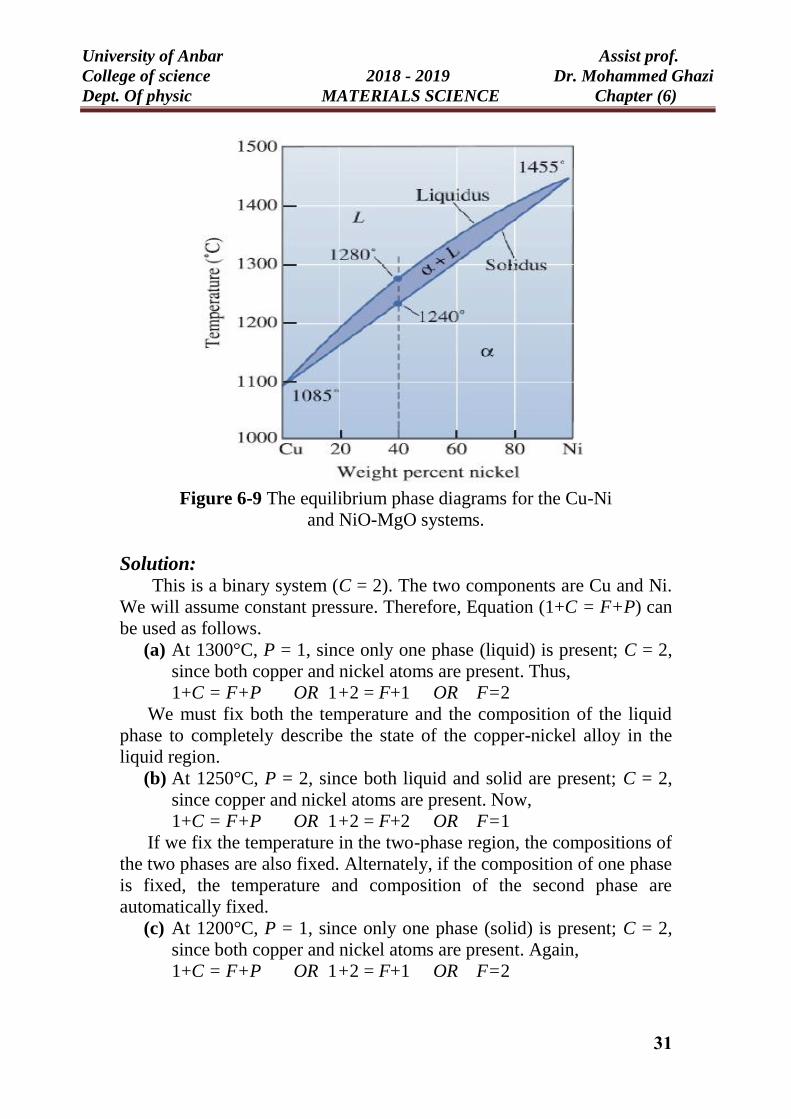
Example 5: Determine the degrees of freedom in a Cu-40% Ni alloy at (a) 1300°C,
(b) 1250°C, and (c) 1200°C. Use Figure 6-9.
University of Anbar Assist prof.
College of science 2018 - 2019 Dr. Mohammed Ghazi
Dept. Of physic MATERIALS SCIENCE Chapter (6)
31
Figure 6-9 The equilibrium phase diagrams for the Cu-Ni
and NiO-MgO systems.
Solution: This is a binary system (C = 2). The two components are Cu and Ni.
We will assume constant pressure. Therefore, Equation (1+C = F+P) can
be used as follows.
(a) At 1300°C, P = 1, since only one phase (liquid) is present; C = 2,
since both copper and nickel atoms are present. Thus,
1+C = F+P OR 1+2 = F+1 OR F=2
We must fix both the temperature and the composition of the liquid
phase to completely describe the state of the copper-nickel alloy in the
liquid region.
(b) At 1250°C, P = 2, since both liquid and solid are present; C = 2,
since copper and nickel atoms are present. Now,
1+C = F+P OR 1+2 = F+2 OR F=1
If we fix the temperature in the two-phase region, the compositions of
the two phases are also fixed. Alternately, if the composition of one phase
is fixed, the temperature and composition of the second phase are
automatically fixed.
(c) At 1200°C, P = 1, since only one phase (solid) is present; C = 2,
since both copper and nickel atoms are present. Again,
1+C = F+P OR 1+2 = F+1 OR F=2
University of Anbar Assist prof.
College of science 2018 - 2019 Dr. Mohammed Ghazi
Dept. Of physic MATERIALS SCIENCE Chapter (6)
32
and we must fix both temperature and composition to completely describe
the state of the solid.
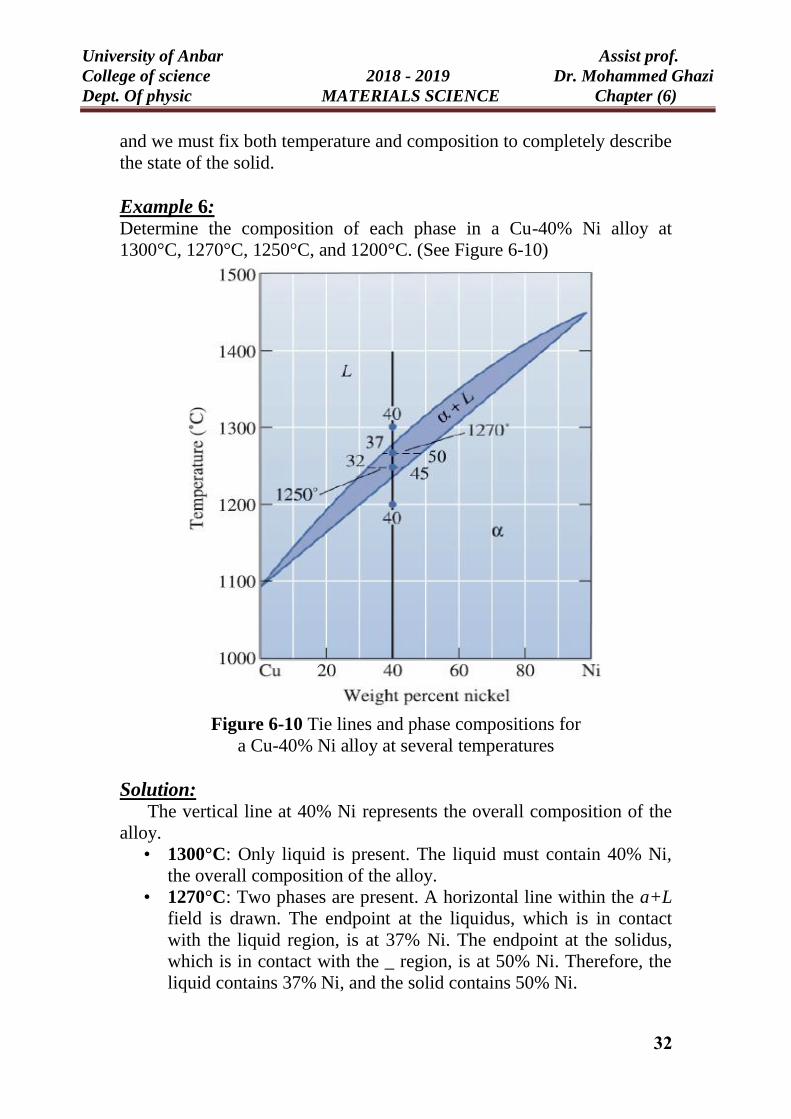
Example 6: Determine the composition of each phase in a Cu-40% Ni alloy at
1300°C, 1270°C, 1250°C, and 1200°C. (See Figure 6-10)
Figure 6-10 Tie lines and phase compositions for
a Cu-40% Ni alloy at several temperatures
Solution: The vertical line at 40% Ni represents the overall composition of the
alloy.
• 1300°C: Only liquid is present. The liquid must contain 40% Ni,
the overall composition of the alloy.
• 1270°C: Two phases are present. A horizontal line within the a+L
field is drawn. The endpoint at the liquidus, which is in contact
with the liquid region, is at 37% Ni. The endpoint at the solidus,
which is in contact with the _ region, is at 50% Ni. Therefore, the
liquid contains 37% Ni, and the solid contains 50% Ni.
University of Anbar Assist prof.
College of science 2018 - 2019 Dr. Mohammed Ghazi
Dept. Of physic MATERIALS SCIENCE Chapter (6)
33
• 1250°C: Again two phases are present. The tie line drawn at this
temperature show that the liquid contains 32% Ni, and the solid
contains 45% Ni.
• 1200°C: Only solid a is present, so the solid must contain 40% Ni.
In Example 6, we find that, in the two-phase region, solid a contains more
nickel and the liquid L contains more copper than the overall composition
of the alloy. Generally, the higher melting point element (in this case,
nickel) is concentrated in the first solid that forms.
Example 7:
Determine the amount of each phase in the Cu-40% Ni alloy shown in
Figure 6-10 at 1300°C, 1270°C, 1250°C, and 1200°C.
Solution
Note that at each temperature, we can determine the composition of
the phases in equilibrium from the ends of the tie line drawn at that
temperature.