University of Alberta · PDF file2.2.4. Chemical Analysis ..... 44 2.2.5. Statistical Analyses...
113
University of Alberta Feeding Value of Triticale-Based Dry Distillers‘ Grains plus Solubles in the Diets of Growing Lambs by Lisa Ellen McKeown A thesis submitted to the Faculty of Graduate Studies and Research in partial fulfillment of the requirements for the degree of Master of Science in Animal Science Department of Agricultural, Food and Nutritional Science ©Lisa Ellen McKeown Spring 2010 Edmonton, Alberta Permission is hereby granted to the University of Alberta Libraries to reproduce single copies of this thesis and to lend or sell such copies for private, scholarly or scientific research purposes only. Where the thesis is converted to, or otherwise made available in digital form, the University of Alberta will advise potential users of the thesis of these terms. The author reserves all other publication and other rights in association with the copyright in the thesis and, except as herein before provided, neither the thesis nor any substantial portion thereof may be printed or otherwise reproduced in any material form whatsoever without the author's prior written permission.
-
Upload
phungquynh -
Category
Documents
-
view
219 -
download
3
Transcript of University of Alberta · PDF file2.2.4. Chemical Analysis ..... 44 2.2.5. Statistical Analyses...

University of Alberta
Feeding Value of Triticale-Based Dry Distillers‘ Grains plus Solubles in the
Diets of Growing Lambs
by
Lisa Ellen McKeown
A thesis submitted to the Faculty of Graduate Studies and Research
in partial fulfillment of the requirements for the degree of
Master of Science
in
Animal Science
Department of Agricultural, Food and Nutritional Science
©Lisa Ellen McKeown
Spring 2010
Edmonton, Alberta
Permission is hereby granted to the University of Alberta Libraries to reproduce single copies of this thesis
and to lend or sell such copies for private, scholarly or scientific research purposes only. Where the thesis is
converted to, or otherwise made available in digital form, the University of Alberta will advise potential users
of the thesis of these terms.
The author reserves all other publication and other rights in association with the copyright in the thesis and,
except as herein before provided, neither the thesis nor any substantial portion thereof may be printed or
otherwise reproduced in any material form whatsoever without the author's prior written permission.

EXAMINING COMMITTEE
Dr. Masahito Oba, Department of Agricultural, Food and Nutritional Science,
University of Alberta
Dr. Tim A. McAllister, Agriculture and Agri-Food Canada
Dr. Erasmus Okine, Department of Agricultural, Food and Nutritional Science,
University of Alberta
Dr. John J. McKinnon, Department of Animal and Poultry Science, University of
Saskatchewan

ABSTRACT
Nutrient profiles of distillers‘ grains are primarily affected by the type of
grain used for ethanol production, but the feeding value of triticale-based dry
distillers‘ grains plus solubles (TDDGS) has not been extensively studied. The
first study showed that, compared to 20% corn- or wheat-based distillers‘ grains
diets, 20% TDDGS diet increased cis-9 trans-11 linoleic acid concentration in
carcass fat without affecting growth performance of lambs. In the second study,
lamb growth performance was not affected by the addition of up to 60% TDDGS
in the diet, but the risk of urinary calculi increased at higher inclusion levels.
Lambs fed 20% TDDGS had higher cold carcass weights and grade rules than
lambs fed 40 or 60% TDDGS. Increasing TDDGS decreased diet digestibility,
and increased nitrogen and phosphorus excretion. In conclusion, TDDGS can be
used in diets for growing ruminants, and its utilization efficiency may be
optimized at 20% dietary inclusion.

ACKNOWLDGEMENTS
I would like to extend my sincere thank you to my committee members,
Dr.‘s Masahito Oba, Tim McAllister, Alex Chaves and Erasmus Okine for their
help, guidance and support throughout my Masters program. I truly enjoyed
working (and networking) with you and I have learned a lot!
I would also like to thank Stephanie Briand and Frederic Perez for their
help throughout the study, as well as Greg Penner, Lucia Holtshausen, and
Katherine Jakober – Grammar Guru, for enlightening me with their knowledge.
Thank you to all of the people who helped me in the lab and at the barn.
Specifically, Wendi Smart, Bev Farr, Bonnie Tovell, Clarence Gilbertson, Darrell
Vedres, Zhong Xu, David Rolland, Maolong He, Ashley Stronks, Anelia Reiz and
Catarina Owen for their help in the lab and Brian Egland, Brant Baker, Nick
Cushman and Ken Smith in the sheep barn for their help with and care of the
lambs.
I would also like to thank the following people for their the support,
encouragement and ‗good times‘: Brittany Dyck, Laura Clark, Catarina Owen,
Anelia Reiz, Charla and Greg Penner, Shuzhi Zhang, Kris Wierenga, Tam
Nguyen, Krysty Munns, Reka Silasi, Guillaume Desrousseaux, Alessandro
Mazzenga, Pamela Lussier and Parasto Mirzagha. I also learned a lot from all of
you and you guys made the last two years a very enjoyable experience!
Lastly, thank you to my parents, Carol and Bill McKeown, and my
brother, Kent for your love and support.

TABLE OF CONTENTS
1.0. LITERATURE REVIEW ................................................................................ 1
1.1. Introduction .................................................................................................. 1
1.2. Production of Distillers‘ Grains ................................................................... 2
1.2.1. Overview of the Ethanol Process ........................................................... 2
1.2.2. Types of Distillers‘ Grains..................................................................... 5
1.2.3. Sources of Variation in Distillers‘ Grains ............................................. 6
1.2.4. Controversies of Ethanol Production ..................................................... 9
1.3. Use of Distillers‘ Grains as a Feedstuff for Ruminants ............................. 11
1.3.1. Nutritional Profile of Distillers‘ Grains ............................................... 12
1.3.2. Fermentation Characteristics of Distillers‘ Grains .............................. 16
1.3.3. Dry Matter Intake ................................................................................ 19
1.3.4. Average Daily Gain ............................................................................. 20
1.3.5. Feed Efficiency .................................................................................... 23
1.3.6. Carcass Characteristics ........................................................................ 25
1.3.7. Meat Quality ........................................................................................ 27
1.4. Conclusion .................................................................................................. 30
1.5. Literature Cited .......................................................................................... 31
2.0. EFFECTS OF CORN-, WHEAT- OR TRITICALE DRY DISTILLERS‘
GRAINS PLUS SOLUBLES ON IN VITRO FERMENTATION, GROWTH
PERFORMANCE AND CARCASS TRAITS OF LAMBS ................................ 38
2.1. Introduction ................................................................................................ 38
2.2. Materials and Methods ............................................................................... 39
2.2.1. Experimental Design and Dietary Treatments ..................................... 39
2.2.2. In Vitro Incubation .............................................................................. 41
2.2.3. Data and Sample Collection ................................................................ 43
2.2.4. Chemical Analysis ............................................................................... 44
2.2.5. Statistical Analyses .............................................................................. 46
2.3. Results ........................................................................................................ 47
2.3.1. In Vitro Incubations ............................................................................. 47

2.3.2. Growth Performance and Carcass Characteristics ............................... 48
2.4. Discussion .................................................................................................. 53
2.4.1. Carcass Traits....................................................................................... 55
2.4.2. Fatty Acid Composition ....................................................................... 55
2.5. Conclusion .................................................................................................. 57
2.6. Literature Cited .......................................................................................... 58
3.0. EFFECTS OF REPLACING BARLEY GRAIN WITH TRITICALE-BASED
DRIED DISTILLERS‘ GRAINS PLUS SOLUBLES ON NUTRIENT
DIGESTIBILITY, LAMB GROWTH PERFORMANCE AND CARCASS
TRAITS ................................................................................................................. 63
3.1. Introduction ................................................................................................ 63
3.2. Materials and Methods ............................................................................... 65
3.2.1. Dietary Treatments .............................................................................. 65
3.2.2. Growth Study ....................................................................................... 67
3.2.3. Metabolism Study ................................................................................ 68
3.2.4. Chemical Analyses .............................................................................. 70
3.2.5. Statistical Analyses .............................................................................. 71
3.3. Results ........................................................................................................ 73
3.3.1. Growth Study ....................................................................................... 73
3.3.2 Metabolism Study ................................................................................. 76
3.4. Discussion .................................................................................................. 78
3.4.1. Growth Performance ............................................................................ 78
3.4.2. Carcass Traits....................................................................................... 81
3.4.3. Protein Metabolism .............................................................................. 81
3.4.4. Fatty Acid Composition ....................................................................... 83
3.4.5. Occurrence of Urinary Calculi............................................................. 84
3.4.6. Phosphorus Excretion .......................................................................... 85
3.5. Conclusion .................................................................................................. 85
3.6. Literature Cited .......................................................................................... 86
4.0. GENERAL DISCUSSION ............................................................................ 91
4.1. Summary of Findings ................................................................................. 91

4.2. Future Research .......................................................................................... 93
4.3. General Conclusion and Industry Perspective ........................................... 98
4.4. Literature Cited ........................................................................................ 100
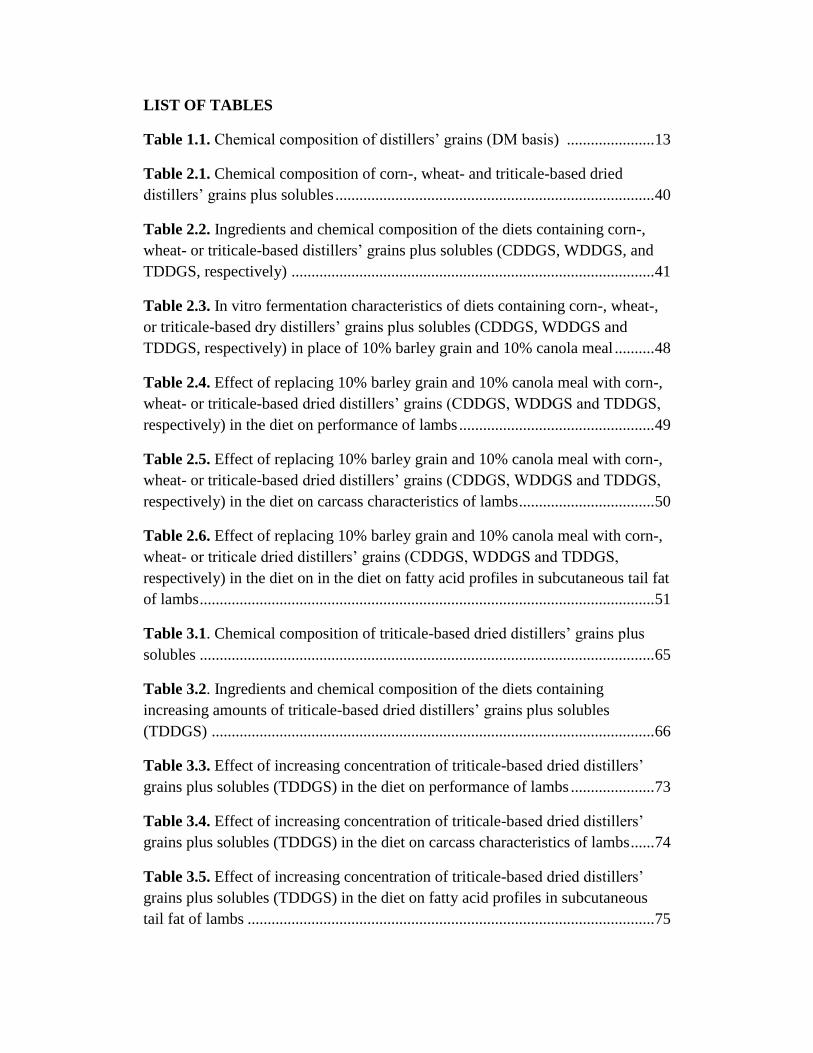
LIST OF TABLES
Table 1.1. Chemical composition of distillers‘ grains (DM basis) ...................... 13
Table 2.1. Chemical composition of corn-, wheat- and triticale-based dried
distillers‘ grains plus solubles ................................................................................ 40
Table 2.2. Ingredients and chemical composition of the diets containing corn-,
wheat- or triticale-based distillers‘ grains plus solubles (CDDGS, WDDGS, and
TDDGS, respectively) ........................................................................................... 41
Table 2.3. In vitro fermentation characteristics of diets containing corn-, wheat-,
or triticale-based dry distillers‘ grains plus solubles (CDDGS, WDDGS and
TDDGS, respectively) in place of 10% barley grain and 10% canola meal .......... 48
Table 2.4. Effect of replacing 10% barley grain and 10% canola meal with corn-,
wheat- or triticale-based dried distillers‘ grains (CDDGS, WDDGS and TDDGS,
respectively) in the diet on performance of lambs ................................................. 49
Table 2.5. Effect of replacing 10% barley grain and 10% canola meal with corn-,
wheat- or triticale-based dried distillers‘ grains (CDDGS, WDDGS and TDDGS,
respectively) in the diet on carcass characteristics of lambs .................................. 50
Table 2.6. Effect of replacing 10% barley grain and 10% canola meal with corn-,
wheat- or triticale dried distillers‘ grains (CDDGS, WDDGS and TDDGS,
respectively) in the diet on in the diet on fatty acid profiles in subcutaneous tail fat
of lambs .................................................................................................................. 51
Table 3.1. Chemical composition of triticale-based dried distillers‘ grains plus
solubles .................................................................................................................. 65
Table 3.2. Ingredients and chemical composition of the diets containing
increasing amounts of triticale-based dried distillers‘ grains plus solubles
(TDDGS) ............................................................................................................... 66
Table 3.3. Effect of increasing concentration of triticale-based dried distillers‘
grains plus solubles (TDDGS) in the diet on performance of lambs ..................... 73
Table 3.4. Effect of increasing concentration of triticale-based dried distillers‘
grains plus solubles (TDDGS) in the diet on carcass characteristics of lambs ...... 74
Table 3.5. Effect of increasing concentration of triticale-based dried distillers‘
grains plus solubles (TDDGS) in the diet on fatty acid profiles in subcutaneous
tail fat of lambs ...................................................................................................... 75

Table 3.6. Effect of increasing concentration of triticale-based dried distillers‘
grains plus solubles (TDDGS) in the diet on nutrient digestibility in lambs ......... 77
Table 3.7. Effect of increasing concentration of triticale-based dried distillers‘
grains plus solubles (TDDGS) in the diet on nutrient excretion by lambs ............ 78

LIST OF FIGURES
Figure 1.1. Overview of the dry grinding and wet milling process (adapted from
Bothast and Schlicher 2005) .................................................................................... 3
Figure 1.2. Overview of ethanol fermentation and co-product production (adapted
from Husky Energy 2009 and CFIA 2009) .............................................................. 5

LIST OF ABBREVIATIONS
ADF Acid detergent fibre
ADG Average daily gain
CDDG Corn-based dry distillers‘ grains
CDDGS Corn-based dry distillers‘ grains plus solubles
CLA Conjugated linoleic acid
CP Crude protein
DDG Dry distillers‘ grains
DDGS Dry distillers‘ grains plus solubles
DM Dry matter
DMI Dry matter intake
EE Ether extract
FAME Fatty acid methyl esters
FE Feed efficiency
IVDMD In vitro dry matter digestibility
MUFA Mono-unsaturated fatty acid
NDF Neutral detergent fibre
NEg Net energy of gain
PUFA Poly-unsaturated fatty acid
SFA Saturated fatty acid
SMY Saleable meat yield
TDDGS Triticale-based dry distillers‘ grains plus solubles
TS Thin stillage
TWDG Triticale-based wet distillers‘ grains
VFA Volatile fatty acid
WDDGS Wheat-based dry distillers‘ grains plus solubles

WDG Wet distillers‘ grains
WDGS Wet distillers‘ grains plus solubles
WWDG Wheat-based wet distillers‘ grains

1
1.0. LITERATURE REVIEW
1.1. Introduction
Distillers‘ grains are a co-product of the fuel ethanol industry. Using
ethanol for fuel is not a new idea. Henry Fords‘ Model T, built in 1908, was
designed to run on ethanol (Solomon et al. 2007), and information on feeding
distillers‘ grains can be found in ‗Feeds and Feeding‘ by Morrison, published in
1957. However, concerns over foreign oil dependency and environmental issues
have re-kindled interest in the ethanol industry. Currently, the Canadian
Environmental Protection Act (1999) has mandated that gasoline will have an
average annual renewable fuel content of at least 5% by 2010 (Environment
Canada, 2008). Presently, Canada has the capacity to produce ~1000 million liters
per year and ~400 million liters per year of ethanol from corn and wheat
feedstock, respectively, with provisions to produce another ~ 300 million liters
per year (Canadian Renewable Fuels Association, 2009). The differences in
feedstock used for ethanol production are a reflection of geographical climate. For
example, corn is the primary substrate for ethanol production in eastern United
States and Canada (Beliveau and McKinnon 2008), but the cooler climate in
western Canada is unsuitable for growing corn, so wheat is the primary feedstock
utilized for ethanol production, even though the starch content is lower (Lan et al.
2008; Alberta Agriculture and Rural Development 2007). On average, 2.5-3.0 kg
of grain is needed to produce 1 L of ethanol, depending on the starch content of
the grain (O‘Connor 2007). The removal of the starch effectively concentrates the

2
remaining components of the grain, resulting in a co-product that is approximately
three-fold higher in concentrations of crude protein (CP), fat, fibre and minerals
(Klopfenstein et al. 2008). As a result, distillers‘ grains are being utilized as both
an energy and protein source in the beef and dairy industries and to a lesser extent
by the swine and poultry industries.
The objective of this chapter is to provide a comprehensive review of the
production and nutritional properties of corn-, wheat-, and triticale-based
distillers‘ grains. The effect of feeding these distillers‘ grains on beef cattle and
sheep growth performance and carcass traits will also be discussed.
1.2. Production of Distillers’ Grains
1.2.1. Overview of the Ethanol Process
There are several steps in the ethanol manufacturing process. After the
grain is received at the processing plant, the grains must be pre-processed either
by wet milling or dry grinding. The wet milling process separates the germ, fibre,
protein and starch components of the grain by first soaking the whole grain in a
weak sulfurous acid solution, then separating the components based on
differences in density and particle size into dried germ, corn gluten feed, corn
gluten meal and starch (Figure 1.1.; Rausch and Belyea 2006). This process is
primarily used to make corn starch-based sweeteners, but the starch can also be
fermented to produce ethanol (Keim 1984). If ethanol is produced, the resulting
co-product is referred to as distillers‘ solubles (Rausch and Belyea 2006).

3
Extensive research has been conducted with feed co-products from the wet
milling process however; it will not be discussed further in this paper.
Figure 1.1. Overview of the dry grinding and wet milling process (adapted from
Bothast and Schlicher 2005).
The dry grinding process does not fractionate the grain, thus less
equipment is needed in the ethanol plant and only one co-product is produced.
Once the grain is received in the plant, it is ground into a fine powder using either
a hammer or roller mill (Figure 1.1.; Rausch and Belyea 2006). Water and α-
amylase are then added to the powder at a ratio of 50-L water : 0.001-kg α-
amylase : 10-kg corn, and the mixture is heated to a temperature between 120-
150oC (Pimentel 2003; O‘Connor 2007). Heat is needed to solubilize all of the
starch granules, and α-amylase hydrolyzes the starch by cleaving α-1,4-glycosidic

4
bonds to prevent aggregation of the long starch molecules when the mixture is
cooled (Keim 1983; Vihinen and Mäntsälä 1989 as cited by Fitter et al. 2001).
The next step is termed saccharification and is a 3-d process carried out at a
temperature between 60-65oC and pH of 4.0-4.5 (Keim 1983). In this step,
glucoamylase is added to the mixture to release glucose monomers from the non-
reducing end of the carbohydrate chains. Sulfuric acid is also added to acidify the
mixture, with the sulfur interacting with minerals to form salts that are within the
distillers‘ grains fraction (O‘Connor 2007). After the completion of pre-
processing, yeast (Saccharomyces cerevisiae) is added to convert the glucose
monomers into ethanol and carbon dioxide. Urea is also added as a non-protein
nitrogen source because the yeast cells are incapable of degrading protein in the
grain (Belyea et al. 2004). Fermentation can be undertaken as individual batches,
in a cascade series or in individual tanks with continuous supply and discharge
(Keim 1983), and is typically carried out at ~32oC for 40 to 75 h (CFIA 2009).
Throughout the fermentation process, heat, vitamins, and new yeast cells are
produced (Fron et al. 1996). Ethanol is then distilled off using distillation
columns, a stripping column and a molecular sieve to remove any remaining
water molecules (Rausch and Belyea 2006). The ethanol is then denatured and
ready to be blended with gasoline. The CO2 produced is either released to the
atmosphere or collected to be used in the beverage industry. The remaining
substrate, now referred to as whole stillage, is ready to be processed as the
distillers‘ co-product.

5
1.2.2. Types of Distillers’ Grains
Distillers‘ grains exist in many different forms (Figure 1.2.). Once the
ethanol is distilled off, the remaining slurry is referred to as whole or spent
stillage. It is a mixture of particulate material from the grain, yeast cells,
chemicals added during the production process and cellular metabolites and
vitamins (Fron et al. 1996; Liu 2008). Whole stillage can be subjected to either
pressing or centrifugation to separate the liquid fraction from the solid fraction
(Larson et al. 1993). The solid fraction is referred to as wet distillers‘ grains
(WDG). Wet distillers‘ grains can be marketed as is, but due to the high costs of
shipping and problems with spoilage, its use as feed is generally restricted to
Figure 1.2. Overview of ethanol fermentation and co-product production
(adapted from Husky Energy 2009 and CFIA 2009).
6
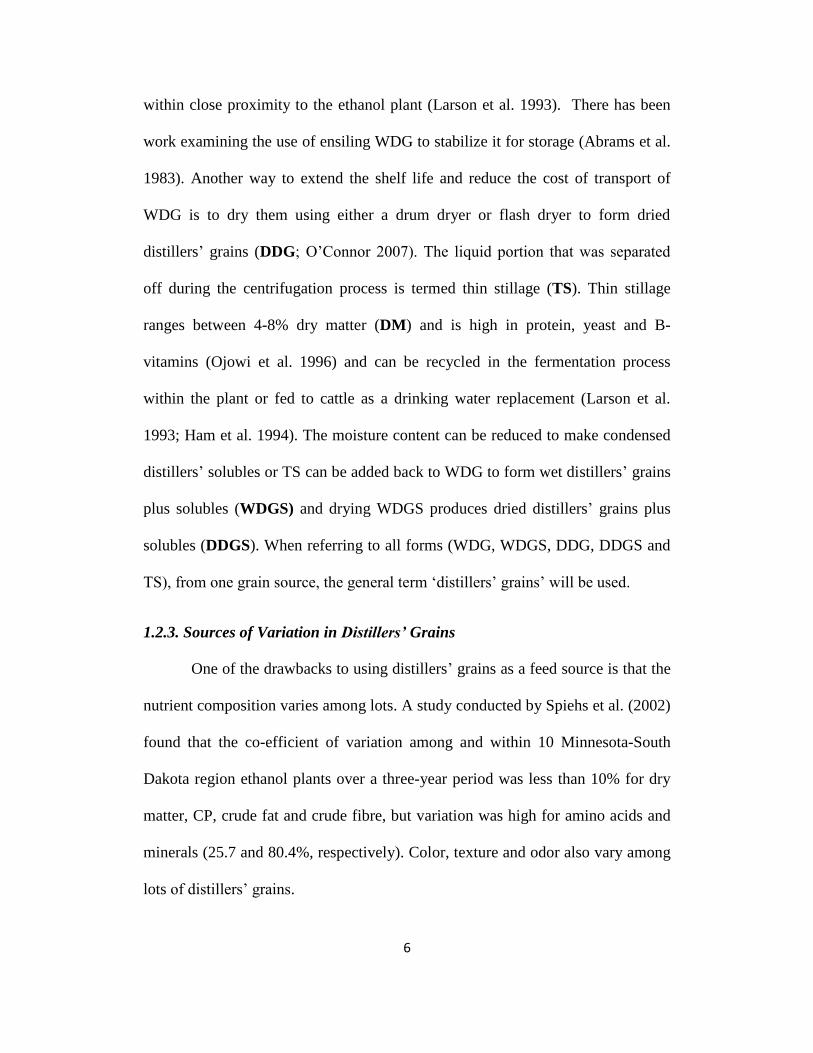
within close proximity to the ethanol plant (Larson et al. 1993). There has been
work examining the use of ensiling WDG to stabilize it for storage (Abrams et al.
1983). Another way to extend the shelf life and reduce the cost of transport of
WDG is to dry them using either a drum dryer or flash dryer to form dried
distillers‘ grains (DDG; O‘Connor 2007). The liquid portion that was separated
off during the centrifugation process is termed thin stillage (TS). Thin stillage
ranges between 4-8% dry matter (DM) and is high in protein, yeast and B-
vitamins (Ojowi et al. 1996) and can be recycled in the fermentation process
within the plant or fed to cattle as a drinking water replacement (Larson et al.
1993; Ham et al. 1994). The moisture content can be reduced to make condensed
distillers‘ solubles or TS can be added back to WDG to form wet distillers‘ grains
plus solubles (WDGS) and drying WDGS produces dried distillers‘ grains plus
solubles (DDGS). When referring to all forms (WDG, WDGS, DDG, DDGS and
TS), from one grain source, the general term ‗distillers‘ grains‘ will be used.
1.2.3. Sources of Variation in Distillers’ Grains
One of the drawbacks to using distillers‘ grains as a feed source is that the
nutrient composition varies among lots. A study conducted by Spiehs et al. (2002)
found that the co-efficient of variation among and within 10 Minnesota-South
Dakota region ethanol plants over a three-year period was less than 10% for dry
matter, CP, crude fat and crude fibre, but variation was high for amino acids and
minerals (25.7 and 80.4%, respectively). Color, texture and odor also vary among
lots of distillers‘ grains.

7
A large part of the nutrient variation is attributed to the feedstock used for
ethanol production. Ethanol can be produced from a variety of grains including
sorghum, corn, barley, wheat or triticale depending on geographic region, supply,
or price. The inherent differences among the grains, such as wheat having a higher
protein content than corn, are present in the distillers‘ grains produced. Within the
same grain type, nutrient profiles may differ among different cultivars, which
affect the composition of the distillers‘ grains. Wu et al. (1984) found that
distillers‘ grains produced from soft wheat were lower in protein compared to
those made from hard wheat, which reflected the typical difference in protein
quantity between the two types of wheat. Furthermore, different varieties vary in
nutrient composition. For example, within the hard wheat classification, the
variety Superb has a 1% lower protein content compared to 5602HR (McKenzie
et al. 2008), which could make a difference in CP content of the resulting
distillers‘ grains due to the concentrating effect of starch removal during ethanol
production. There are also structural differences in the starch-protein matrix
among hybrids of corn, which will affect efficiency of ethanol fermentation and
the amount of starch present in the resulting distillers‘ grains (Murthy et al. 2009).
Abiotic factors also affect the nutrient profile of the crop. The same crop
variety will grow differently depending on the growing environment and different
management factors. Gene expression controls every step of metabolism within
the cell through the manufacturing of enzymes, and is differentially regulated by
the environment (Stern et al. 2007). Altenbach et al. (2003) found that wheat
(Butte 86) grown under various temperature, fertilizer and water management

8
regimes had CP contents ranging from 9.8 to 20.0%. Nutrient profiles of the soil
vary depending on geographic location, crop rotation and fertilization, which in
turn affect nutrient uptake and assimilation by the plant (Davidson 1940).
The other main sources of nutrient variation in distillers‘ grains arise from
the ethanol plant itself. Although Broin and Associates (Sioux Falls, SD) market
distillers‘ grains that are consistent in nutrient content under the brand name
Dakota Gold in 10 mid-west United States ethanol plants, this consistency is not
typically seen in most ethanol plants (Stein et al. 2006). The first source of
variation is the nature of the grains; ethanol plants receive mainly non-food grade
grains depending on supply and market price (Husky Energy 2009). Thus, the
mixture of grains being fermented in a single batch can vary from 100% of a
single grain type to any mixture or ratio of the grains the ethanol plant has
received (Iwanchysko et al. 1999). Also, chemicals used throughout the
fermentation process for pH adjustments and tank cleaning are not always added
in the same proportions. These chemicals ultimately end up as minerals in the
distillers‘ grains (Wu et al. 1984; O‘Connor 2007) and can cause the co-efficient
of variation in sodium, calcium and sulfur content among batches to be as high as
179% (Belyea et al. 1989). Exposure of the fermentation slurry to the copper and
iron tanks and pipes also has the potential to alter the copper and iron content of
the distillers‘ grains. Belyea et al. (1989) found that the co-efficient of variation
for copper and iron content of DDGS varied by 51 and 20%, respectively, over a
10-d period from one ethanol plant. The ethanol plant may be also designed to
recycle yeast cells after centrifugation, which increases ethanol plant productivity

9
while reducing costs, but also affects the amount of yeast remaining in the
distillers‘ grains (Maiorella et al. 1984). Because yeast contains high
concentrations of most amino acids and they cannot degrade any protein from the
feedstock, the amount of yeast added back to the distillers‘ grains will greatly
affect the protein content of the distillers‘ grains (Belyea et al. 2004). The drying
process also affects the quality, color and odor of the distillers‘ grains. Currently,
there are two types of dryers: rotary drum dryers and flash dryers which are
usually operated between 350-400oC (O‘Connor 2007). A major difference
between the two dryers is that grains in a flash dryer are only exposed to the heat
for a few seconds, whereas the rotary drum takes 3-4 minutes to dry the grains.
Another problem with the drying process is that sometimes dryers are operated
above their capacity to increase throughput of grains, which is advantageous from
the view point of ethanol production, but to accomplish this, a higher temperature
must be used, which ultimately decreases the quality of the distillers‘ grains being
produced (O‘Connor 2007).
1.2.4. Controversies of Ethanol Production
Although there are positive aspects to the fuel ethanol industry, the use of
grain for ethanol production is being criticized. The basis behind fuel ethanol
production is to decrease the dependence on foreign oil and to decrease CO2
emissions (Solomon et al. 2007), but fossil fuels are utilized in planting,
harvesting, and transporting crops. In addition, CO2 is produced when building
ethanol plants (Wheals et al. 1999). There is also concern that increasing the
number of acres planted with corn in order to produce ethanol (Simpson et al.
10
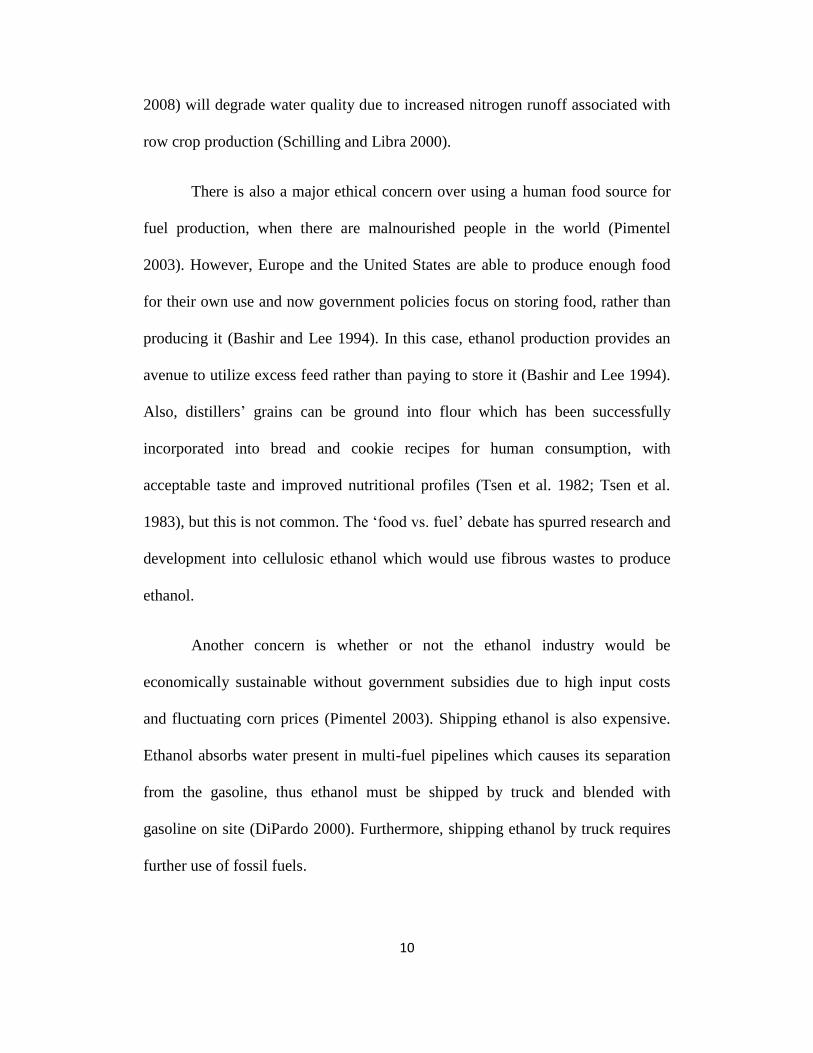
2008) will degrade water quality due to increased nitrogen runoff associated with
row crop production (Schilling and Libra 2000).
There is also a major ethical concern over using a human food source for
fuel production, when there are malnourished people in the world (Pimentel
2003). However, Europe and the United States are able to produce enough food
for their own use and now government policies focus on storing food, rather than
producing it (Bashir and Lee 1994). In this case, ethanol production provides an
avenue to utilize excess feed rather than paying to store it (Bashir and Lee 1994).
Also, distillers‘ grains can be ground into flour which has been successfully
incorporated into bread and cookie recipes for human consumption, with
acceptable taste and improved nutritional profiles (Tsen et al. 1982; Tsen et al.
1983), but this is not common. The ‗food vs. fuel‘ debate has spurred research and
development into cellulosic ethanol which would use fibrous wastes to produce
ethanol.
Another concern is whether or not the ethanol industry would be
economically sustainable without government subsidies due to high input costs
and fluctuating corn prices (Pimentel 2003). Shipping ethanol is also expensive.
Ethanol absorbs water present in multi-fuel pipelines which causes its separation
from the gasoline, thus ethanol must be shipped by truck and blended with
gasoline on site (DiPardo 2000). Furthermore, shipping ethanol by truck requires
further use of fossil fuels.
11
Despite the drawbacks of ethanol production, fuel ethanol is still being
produced throughout the world and distillers‘ grains continue to be produced as
the co-product. While distillers‘ grains can be used as fertilizer or a combustion
energy source, their use as feed is the most profitable (Lory et al. 2008).
Therefore, the use of distillers‘ grain as feed for livestock warrants further
investigation.
1.3. Use of Distillers’ Grains as a Feedstuff for Ruminants
With the expansion of the ethanol industry, distillers‘ grains have been
increasingly incorporated into ruminant diets. As of 2007, a survey of feeding
recommendations from consulting feedlot nutritionists done throughout the
United States found that 83% of the nutritionists‘ clients were using co-products
in their rations (Vasconcelos and Galyean 2007). Of the co-products used, wet
and dry distillers‘ grains from corn, sorghum or a mixture of both were the
primary co-products used. Dietary inclusion rate ranged from 5-50% (DM basis)
with 20% being the most common inclusion rate (Vasconcelos and Galyean
2007). Typically, distillers‘ grains are used as a protein source when added at 6-
15% of the diet and as an energy source when included at > 15% of the diet DM
(Klopfenstein 2008). Because of the high protein and phosphorus content of
distillers‘ grains, these nutrients are supplied in excess when distillers‘ grains are
used as an energy source in the diet (Klopfenstein 2008). Some regions in the
United States utilize distillers‘ grains to such an extent that research examining
the effects of distillers‘ grains in feedlot rations often includes distillers‘ grains in
12
their control diet to represent typical feedlot rations in the area (Homm et al.
2008).
Most of the work with distillers‘ grains has focused on corn-based
distillers‘ grains. Recently, there has been an increase in the amount of work
being conducted with wheat-based distillers‘ grains, but to date there has been
little work done with triticale-based distillers‘ grains.
1.3.1. Nutritional Profile of Distillers’ Grains
The nutrient composition of distillers‘ grains varies depending on the type
of grain used for ethanol fermentation and the form that they are fed in. Corn-
based DDGS (CDDGS) is typically ~90% DM (Table 1.1.; Lodge et al. 1997;
Spiehs et al. 2002; NRC 2007). The CP content is ~30% (DM basis) and neutral
detergent fibre (NDF) and acid detergent fibre (ADF) contents average ~46 and
19%, respectively (Lodge et al. 1997; Spiehs et al. 2002; NRC 2007). The ether
extract (EE) content is high, typically around 10%, due to the high oil content of
corn grain. Based on the analysis of Peter et al. (2000) and Al-Suwaiegh et al.
(2002), nutrient profiles of corn-based DDG (CDDG) closely resemble that of
CDDGS (generally, within 2%). Corn-based WDG (CWDG) contains
approximately one third of the DM content of CDDGS. On a DM basis, CWDG
contain similar amounts of CP and NDF, but are ~5% higher in ADF and ~2%
higher in EE when compared to CDDGS (Larson et al. 1993; Lodge et al. 1997;
Al-Suwaiegh et al. 2002). Corn-based TS is only ~6% DM, and on a DM basis is

13
Table 1.1. Chemical composition of distillers’ grains (DM basis)
Component
Itemz
DM
(%)
CP
(%)
NDF
(%)
ADF
(%)
Ether Extract
(%)
Corn-based DDGS
Spiehs et al. 2002y
88.9 30.2 44.5 16.2 10.9
Lodge et al. 1997
92.2 29.2 51.3 — 11.4
NRC 2007
90.0 29.0 42.0 21.0 10.5
Corn-based DDG
Peter et al. 2000
87.1 29.4 45.2 12.9 —
Al-Suwaiegh et al. 2002
93.0 28.9 42.3 25.5 14.0
NRC 2007
91.0 29.0 42.0 21.0 10.5
Corn-based WDG
Larson et al. 1993
31.4 25.0 39.4 — 13.7
Al-Suwaiegh et al. 2002
35.5 30.5 42.6 25.3 14.5
Lodge et al. 1997
31.3 29.6 51.9 — 13.7
NRC 2007
36.0 29.0 41.0 21.0 10.5
Corn-based TS
Larson et al. 1993
5.0 16.8 11.7 — 8.1
NRC 2007
7.0 22.0 21.0 10.0 8.1
Wheat-based DDGS
Boila and Ingalls 1994x
96.3 43.6 36.1 15.6 —
Beliveau and McKinnon 2008w 93.9 37.2 46.5 13.2 5.0
Gibb et al. 2008
91.6 45.8 28.9 19.5 4.6
McKinnon and Walker 2008
90.3 38.6 54.1 13.1 6.2
Wheat-based WDG
Mustafa et al. 2000
— 27.5 73.9 21.6 4.4
Ojowi et al. 1997
29.4 26.4 74.9 24.1 6.6
Wheat-based TS
Iwanchysko et al. 1999
6.3 46.6 38.4 2.0 6.9
Fisher et al. 1999v
6.7 40.1 36.3 7.5 7.6
Mustafa et al. 2000
— 36.6 35.2 8.5 5.9
Triticale-based DDGS
Greter et al. 2008
87.4 30.5 36.5 15.7 10.1
Triticale-based WDG
Mustafa et al. 2000
— 29.8 71.2 21.1 6.6
Triticale-based TS
Mustafa et al. 2000 — 39.7 31.6 7.2 6.1
zDDGS = dry distillers' grains with solubles; DDG = dry distillers' grain; WDG = wet
distillers' grains; WDDGS = wet distillers' grains with solubles; TS = thin stillage. yAverage of 10 new Minnesota and South Dakota ethanol plants.
xSample DG3 - 100% wheat-based DDGS.
wAverage of three batches.
vAverage of TS used in growing and finishing period.

14
considerably lower in CP, NDF, ADF and EE, averaging 19, 16, 10 and 8%,
respectively when compared to CDDGS (Larson et al. 1993; NRC 2007).
The DM content of wheat-based DDGS (WDDGS) is typically ~93%
(Boila and Ingalls 1994; Beliveau and McKinnon 2008; Gibb et al. 2008;
McKinnon and Walker 2008). Crude protein content of WDDGS is approximately
40%, ~10% higher than CDDGS. The NDF content of WDDGS from the four
studies ranged from 28.9 to 54.1% (DM basis), but the ADF content was more
consistent, averaging ~15%. Ether extract content is only ~5% which is only
about half the EE content of CDDGS, due to inherent differences between wheat
and corn grains. Wheat-based WDG (WWDG) are ~30% DM. Compared to
WDDGS, WWDG only have about half of the CP content and almost twice the
NDF content (Ojowi et al. 1997; Mustafa et al. 2000). Acid detergent fibre is ~5%
higher in WWDG and EE contents are similar to WDDGS. Wheat-based TS is
only ~6% DM, and on a DM basis, closely resembles the nutrient profile of
WDDGS, except that the ADF content is only ~20% of that in WDDGS
(Iwanchysko et al. 1999; Mustafa et al. 2000).
The chemical composition data on triticale-based distillers‘ grains are
somewhat limited. Triticale-based DDGS (TDDGS) is approximately 87% DM
(Table 1.1.; Greter et al. 2008). The CP and EE contents of TDDGS are similar to
CDDGS at ~31 and ~10%, respectively. Greter et al. (2008) reported NDF and
ADF values of 36.5 and 15.7%, respectively. The CP and ADF content of
triticale-based WDG (TWDG) are similar to both WWDG and CWDG at 29.8
15
and 21.1%, respectively (Mustafa et al. 2000). The NDF and EE content of
TWDG is similar to WWDG, but is approximately 30% higher in NDF and 7%
lower in EE compared to CWDG (Mustafa et al. 2000). The composition of
triticale-based TS is similar to wheat-based TS, averaging 39.7, 31.6, 7.2 and
6.1% for CP, NDF, ADF and EE, respectively (Mustafa et al. 2000).
Despite the removal of starch from the grain during ethanol fermentation,
the fermentation process is not 100% efficient and some starch does remain in the
distillers‘ grains. Stein et al. (2006) sampled CDDGS from 10 ethanol plants in
the mid-west United States and found that the average starch content was 6.5%
DM. Similar results were found by Greter et al. (2008) in TDDGS, which
contained 7.6% starch (DM basis). However, the starch content reported by
Mustafa et al. (2000) was considerably lower at 2.4 and 2.7% for WWDG and
TWDG, respectively.
The mineral content of distillers‘ grains is also high due to the
concentrating effect of starch removal. In particular, the phosphorus content of
distillers‘ grains is typically very high, whereas the calcium content is low. The
calcium content, regardless of whether corn, wheat or triticale is used as
feedstock, typically ranges from 0.10 to 0.19% (DM basis; Rust et al. 1990; Gibb
et al. 2008; Greter et al. 2008; McKinnon and Walker 2008). Phosphorus values
are 4-8 times higher than the calcium content, ranging from 0.67-1.07% (DM) and
averaging 0.87% DM (Rust et al. 1990; Gibb et al. 2008; Greter et al. 2008;
McKinnon and Walker 2008). The imbalanced Ca:P ratio means that a calcium

16
supplement may need to be added when formulating the diet to maintain the Ca:P
ratio of 2:1. The excess phosphorus in the diet also raises an environmental
concern as runoff from manure can accumulate in water bodies leading to
eutrophication (Rausch and Belyea 2006).
Distillers‘ grains can also be high in sulfur. The average sulfur content of
CDDGS from 10 different ethanol plants ranged from 0.33-0.74% (Spiehs et al.
2002). Gibb et al. (2008) found that WDDGS contained 0.48% sulfur (DM basis).
Incorporating a high proportion (> 50% diet DM) of distillers‘ grains, high in
sulfur, into the diet can result in polioencephalomalacia (Buckner et al. 2008).
It must also be noted that these are only general nutrient values for
distillers‘ grains. As discussed earlier, distillers‘ grains can be highly variable in
their nutrient composition. Some of this variability is demonstrated by the large
range of the NDF content in WDDGS (Boila and Ingalls 1994; Beliveau and
McKinnon 2008; Gibb et al. 2008; McKinnon and Walker 2008). Thus, it is
important to analyze distillers‘ grains on a regular basis and adjust the rations as
needed.
1.3.2. Fermentation Characteristics of Distillers’ Grains
Different fermentation characteristics of various feedstuffs alter the site
and extent of digestion, and thus, affect animal performance. Some feeds are good
for microbial growth, while others by-pass the rumen and are digested in the small
intestine. The CP content of CDDG is relatively unavailable in the rumen. Two
studies using CDDG with similar CP content found that only 40% (Batajoo and
17
Shaver 1998) and 58% of the CP (Peter et al. 2000) was degraded in the rumen.
Mustafa et al. (2000) and Ojowi et al. (1997) found that the ruminal CP
digestibility of WWDG were 45 and 69%, respectively. The 96 h in situ ruminal
CP degradability of TWDG was 51.2%, which is similar to WWDG (Mustafa et
al. 2000). The low ruminal CP availability to rumen microbes for DDG may be
due to the formation of Maillard reaction products and thus, approximately half of
the CP ingested reaches the small intestine (Batajoo and Shaver 1998). An in vitro
study found the extent of NDF digestion in CDDG was 57.2% (Bhatti and Firkins
1995). However, an in situ study found that extent of NDF digestion in the rumen
was 87.8 and 86.4% for CDDG and WDDGS, respectively (Al-Suwaiegh et al.
2002). The 96 h in situ effective rumen degradability of WDDGS NDF was 46%,
which is lower than CDDGS (Ojowi et al. 1997; Mustafa et al. 2000). For TWDG,
NDF degradability was 43.9%, similar to WWDG (Mustafa et al. 2000). The high
NDF degradability found by Al-Suwaiegh et al. (2002) may be due to high rumen
pH providing an optimum environment for fibrolytic activity (Grant 1994). In
addition, distillers‘ grains NDF is potentially highly digestible.
Interestingly, Fron et al. (1996) found that rumen fluid collected from
cattle fed corn-based TS had a two-fold higher in vitro lactic acid disappearance
than that from cattle fed dry-rolled corn. Fron et al. (1996) found a direct
correlation between the number of culturable lactilytic bacteria and the in vitro
rate of lactic acid disappearance, and as lactate was metabolized, the
concentration of butyrate and propionate tended to increase. Therefore, it was
suggested that feeding distillers‘ co-products enhanced lactic acid utilization by

18
increasing the relative numbers of lactilytic bacteria, thus reducing the risk of
lactic acidosis.
The primary volatile fatty acids (VFA) produced in the rumen are acetate,
propionate and butyrate. The efficiencies of converting hexose to acetate,
propionate and butyrate are 62, 109, and 78%, respectively (Chalupa 1977). The
inefficiencies of converting hexose to acetate or butyrate are attributed to the
production of two moles of CO2 per mole of hexose, which is subsequently
converted to and lost as methane (Baldwin and Allison, 1983). No carbon is lost
when one mole of hexose is converted to two moles of propionate, thus animals
are able to utilize more feed energy for growth (Potter et al. 1976). Although VFA
profiles are not well documented for diets containing WDDGS, much work has
been done with CDDGS. Kleinschmit et al. (2006) found that total VFA
decreased from 65.6 to 53.8 mM when CDDGS was included at 20% of the diet,
replacing soybean meal and ground shelled corn in dairy rations. However, there
was no difference in the proportion of acetate and propionate produced. Anderson
et al. (2006) found that including CDDGS at 10 or 20% DM replacing soybean
meal and ground corn had no effect on total VFA production or proportions of
acetate and propionate. Inclusion of CDDGS at 18.5% of dietary DM, in place of
soybean meal and dry shelled corn in a dairy ration also did not affect total VFA
concentration (Sasikala-Appukuttan et al. 2008). However, the molar proportion
of acetate was 1.0% lower and propionate was 2.05% higher compared to the
control (Sasikala-Appukuttan et al. 2008). On the other hand, feeding 20%
CDDGS in place of cornstarch to beef cattle increased total VFA concentration, as

19
well as resulting in a higher proportion of acetate and a lower proportion of
propionate (Peter et al. 2000).
1.3.3. Dry Matter Intake
Generally, distillers‘ grains are a palatable feedstuff for ruminant animals.
Although Schauer et al. (2005) suggested that beyond 20% inclusion diet
palatability may decrease, this does not appear to be the case. Buckner et al.
(2008) fed up to 40% CDDGS in place of dry-rolled corn in a finishing diet and
found no differences in dry matter intake (DMI), while Ham et al. (1994) found a
tendency for DMI to be higher for finishing cattle fed CDDGS at 40% of dietary
DM compared to cattle fed dry-rolled corn. When a cracked corn diet was
supplemented with 15% CWDG, there was no difference in DMI compared to
cattle fed diets supplemented with 15% modified corn fibre and 23% dried corn
gluten feed (Peter et al. 2000). Rust et al. (1990) conducted an experiment
examining the effect of replacing drinking water with corn-based TS, or soaking
dry-rolled corn in corn-based TS before adding it to the total mixed ration.
Compared to the basal diet and drinking water there was no difference in total
DMI or total moisture intake between treatments (Rust et al. 1990). Similarly,
when CDDGS have been fed to sheep at 40% of the diet DM in place of dry-
rolled corn (Lodge et al. 1997) or 23% of the diet DM in place of a mixture of
13% corn and 10.2% soybean meal (Huls et al. 2006), DMI was not affected.
Distillers‘ grains derived from wheat also appear to be palatable to cattle.
Beliveau and McKinnon (2008) replaced increasing amounts of dry-rolled barley

20
with WDDGS up to 23% of the diet DM in finishing cattle diets; and reported no
differences in DMI. However, Gibb et al. (2008) found that as WDDGS was
increased from 0 to 60% of the diet DM in place of steam-rolled barley, intake
was 1.22 kg higher for cattle fed 60% WDDGS compared to those not receiving
WDDGS in the diet. When WWDG were fed to beef cattle at 13.4% of the diet
DM during the growing period and 4.7% of the diet DM in the finishing period,
no difference in DMI was found compared to the barley-based control diet (Ojowi
et al. 1997). When wheat-based TS was supplied from 0 to 6.7% DM in the water
source, there was also no difference in total DMI, but the DMI of the basal diet
decreased as TS increased (Fisher et al. 1999).
There have been few studies evaluating triticale-based distillers‘ grains as
a feed stuff. Wierenga et al. (2009) found no difference in DMI when up to 30%
TDDGS was added to the diet in place of 10% barley silage and 20% dry-rolled
barley grain. Another study using dairy cows found no difference in DMI between
diets containing either 21.4% TDDGS or 21.3% CDDGS on a DM basis. These
studies indicate that palatability should not be a problem with TDDGS.
1.3.4. Average Daily Gain
Feeding corn-based distillers‘ grains to finishing cattle generally improves
average daily gain (ADG). Ham et al. (1994) found that adding CDDGS to the
diets of finishing steers at 40% of dietary DM or a combination of CWDG+TS at
40% of dietary DM improved ADG from 1.46 kg d-1
in cattle fed the dry-rolled
corn diet, to an average of 1.69 kg d-1
. Larson et al. (1993) also found that ADG

21
increased quadratically when a mixture of CWDG and TS in a ratio of 1:1.7 was
added to a dry-rolled corn based diet at 0, 5.2, 12.6 or 40% of dietary DM,
replacing soybean meal and urea, and a portion of the corn for the 40% inclusion
level. Average daily gain increased from 1.65 kg d-1
and reached a plateau at 1.76
for the 12.6 and 40% inclusion of CWDG+TS, respectively (Larson et al. 1993).
Replacing 0, 25, or 50% high moisture corn with CWDG in a diet for finishing
steers also increased ADG by 0.12 kg d-1
as CWDG was increased from 0 to 50%
of diet DM (Firkins et al. 1985). Results from Al-Suwaiegh et al. (2002) also
support these findings; replacing dry-rolled corn with CWDG at 30% of dietary
DM in a diet for finishing steers increased ADG by 0.15 kg d-1
. In a cracked
corn-based diet, weanling heifers fed 15% CDDGS out performed those fed other
corn by-products (Peter et al. 2000). Peter et al. (2000) found that heifers fed
CDDGS and dried corn gluten feed had 39 and 29% higher ADG, respectively
compared to heifers fed modified corn fibre.
The aforementioned studies demonstrated that feeding corn-based
distillers‘ grains can improve ADG, and further work has been conducted to
investigate how much and how often corn-based distillers‘ can be fed to optimize
ADG. Buckner et al. (2008) carried out an experiment to find the optimal rate of
CDDGS inclusion in a finishing steer trial. Dry-rolled corn was replaced by
CDDGS at 0, 10, 20, 30 or 40% of the diet DM, and a quadratic response was
found where cattle fed 20% CDDGS had the highest ADG of 1.68 kg d-1
(Buckner
et al. 2008). When calculated mathematically, the optimum dietary inclusion of
CDDGS to maximize ADG was 23.5% (Buckner et al. 2008). Homm et al. (2008)

22
reported that ADG linearly increased from 1.51 to 1.61 kg d-1
as the number of
days on a 40% CDDGS diet increased before cattle were switch to a high
moisture corn finishing ration. Similarly, Loy et al. (2008) found that the more
frequent CDDGS feeding (daily vs. 3 times per week) in place of dry-rolled corn
to heifers given ad libitum access to grass hay increased ADG (0.62 vs. 0.56 kg d-
1 for daily and thrice weekly supplementation, respectively).
Contrary to the reported increases in ADG for finishing cattle fed corn-
based distillers‘ grains, the same results have not been found for sheep fed corn-
based distillers‘ grains or for finishing cattle fed wheat-based distillers‘ grains.
Replacing 40% dry-rolled corn (Lodge et al. 1997) or a mixture of 10.2% soybean
meal and 13.0% corn (Huls et al. 2006) with CDDGS did not result in any
differences in ADG for wethers. Schauer et al. (2005) examined the effect of
replacing barley grain with 0, 10 or 20% CDDGS and found no linear or quadratic
effects on ADG for wethers. Similarly, both Beliveau and McKinnon (2008) and
Gibb et al. (2008) found no differences in ADG for finishing steers and heifers fed
WDDGS. Beliveau and McKinnon (2008) replaced up to 23% barley grain with
WDDGS and found that ADG across treatments averaged 1.85 kg d-1
and when
Gibb et al. (2008) replaced up to 60% barley grain with WDDGS, ADG averaged
1.54 kg d-1
across all treatments. Feeding WWDG also did not affect ADG when
supplementing a barley-based concentrate at 4.7% (DM) in a diet for finishing
steers (Ojowi et al. 1997).

23
The higher ADG for cattle fed corn-based distillers‘ grains is attributed to
the higher energy content of the distillers‘ grains compared to corn. Ham et al.
(1994) found that the net energy of gain (NEg) of CWDG+TS was 39% higher
and NEg of CDDGS was 21% higher than the NEg calculated for dry-rolled corn.
However, while fat increases the NEg, Al-Suwaiegh et al. (2002) found that the
lipid content of CWDG only accounted for 4.7% of the 11.7% improvement in the
NEg compared to the dry-rolled corn diet. Contrarily, Gibb et al. (2008) found
that adding increasing amounts of WDDGS decreased the NEg of the diets.
1.3.5. Feed Efficiency
Feeding distillers‘ grains causes variable responses in feed efficiency
(FE). Some studies have found that feeding distillers‘ grains improves FE,
whereas others found that FE tended to decrease, or is not affected. Feeding
CWDGS in place of dry-rolled corn at 30% of the diet DM resulted in almost 11%
higher FE in steers (Al-Suwaiegh et al. 2002). Similarly, Ham et al. (1994) found
a 9% increase in FE for steers fed CDDGS and a 16% increase in FE for steers fed
CWDG+TS compared to cattle finished on a dry-rolled corn diet. It was
speculated that the improved FE for cattle fed WDG may be due to clumping,
causing larger particle sizes, which may decrease rate of passage from the rumen
and increase NDF digestion (Ham et al. 1994). This idea was supported by a
decreased rate of passage and increased NDF digestion when water was added to
CDDGS before feeding (Ham et al. 1994). Firkins et al. (1985) also found a
tendency for FE to increase linearly as WDG were fed at 0, 25, or 50% in a high
moisture corn-based ration; steers fed 50% WDG in place of high moisture corn
24
had a 10% higher FE compared to those fed 0% WDG diet. Both Buckner et al.
(2008) and Larson et al. (1993) found a quadratic response for FE when fed up to
40% CDDGW and CWDG+TS, respectively. Buckner et al. (2008) found that
steers fed CDDGS at 20% of dietary DM had the highest FE. Larson et al. (1993)
found that FE improved and reached a plateau at 40% of WDG+TS dietary
inclusion. They attributed improved FE to additional energy from ethanol present
in the WDG+TS. Ethanol is high in gross energy and is rapidly converted to
acetate in the rumen and utilized for lipogenesis. However, in a study conducted
by Ham et al. (1994) supplementing sheep with 0, 5 or 10% ethanol linearly
decreased FE from 0.177 to 0.167 (gain:feed). Compared to heifers supplemented
with modified corn fibre in a cracked-corn based diet, heifers fed CDDG in place
of corn starch at 20% of dietary DM were close to 30% more efficient (Peter et al.
2000). Improvements in FE have also been attributed to a higher rumen
undegradable protein content for distillers‘ grains, so more feed protein reaches
the small intestine and is absorbed and utilized more efficiently for growth
(Firkins et al. 1985). It is also postulated that due to the removal of starch from
the grain, rumen pH increases, which provides a more favorable environment for
fibre digestion and reduces the risk of acidosis.
Some studies have found that FE is not affected by the addition of
distillers‘ grains to the diet. In studies with sheep, Lodge et al. (1997) found no
difference in FE in sheep fed 40% CDDGS compared to those fed dry-rolled corn.
Similarly, when CDDGS was fed to sheep at 22.9% of the diet DM, in place of a
mixture of soybean meal and corn (Huls et al. 2006) or up to 20% of the diet DM
25
in place of barley grain (Schauer et al. 2005), FE was not affected. Ojowi et al.
(1997) also found no effect on FE when DDG was added to the finishing diet of
steers at 4.7% of the diet DM. However, Ojowi et al. (1997) and Huls et al. (2006)
had formulated their diets to be isonitrogenous and isocaloric. When WDDGS
replaced barley grain up to 23% of the diet DM, FE was not affected (Beliveau
and McKinnon 2008), but Gibb et al. (2008) noted that FE decreased by almost
6% for steers fed 60% WDDGS compared to those fed 0% WDDGS. McKinnon
and Walker (2008) also found no additional growth response or improvement of
FE for backgrounding cattle fed 50% WDDGS to those fed 25% WDDGS. This
was probably because the protein requirements of cattle were met at the 25% diet
inclusion of WDDGS, and there is no additional benefit in growth performance by
the further increase in dietary protein content for the 50% WDDGS diet. It could
also be due to the energetic cost associated with detoxifying excess nitrogen to
urea (McBride and Kelly 1990) although, based on animal performance and DM
digestibility, Gibb et al. (2008) noted that the energetic cost of nitrogen excretion
was not evident when heifers were fed up to 60% WDDGS.
1.3.6. Carcass Characteristics
Generally, carcass traits are not affected by the addition of distillers‘
grains to the diet. Ham et al. (1994) observed no differences in liver abscess score,
fat thickness, yield grade and quality grades of cattle fed CDDGS or CWDG+TS
at 40% of dietary DM as compared to cattle fed a dry-rolled corn diet. Similarly,
Larson et al. (1993) found no effect of feeding CWDG+TS to yearling steers on
fat thickness, liver abscess, or quality grade compared to steers fed dry-rolled corn

26
diet supplemented with urea and soybean meal. Buckner et al. (2008) did find a
quadratic trend for hot carcass weight at slaughter; steers fed 20% CDDGS in
place of dry-rolled corn were 11 kg heavier compared to the other treatments (0-
40% dietary inclusion of CDDGS). Al-Suwaiegh et al. (2002) also noted that hot
carcass weights were heavier, fat cover was thicker, and yield grade tended to be
higher for steers fed CWDG compared to cattle fed dry-rolled corn. In spite of this
finding, Al-Suwaiegh et al. (2002) attributed the differences in carcass traits to a
similar number of days on feed. No other differences in carcass composition were
noted in these two studies (Buckner et al. 2008; Al-Suwaiegh et al. 2002).
When wethers were fed a 22.9% CDDGS diet, their back fat was 1 mm
thinner compared to the control animals fed 10.2% soybean meal and 13% corn
(Huls et al. 2006). The other carcass traits including hot carcass weight,
longissimus dorsi muscle area, and USDA yield grade were not different.
Replacing 0, 10 or 20% barley grain in wether diets with CDDGS also did not
affect carcass traits including fat and body wall thickness or ribeye area (Schauer
et al. 2005).
Feeding wheat-based distillers‘ grains does not consistently affect carcass
characteristics. Similar to the study by Buckner et al. (2008), back fat thickness
was highest for heifers fed WDDGS substituted for barley grain at 20% dietary
DM and meat yield tended to decrease with higher inclusion rates of WDDGS (up
to 60%, diet DM; Gibb et al. 2008). However, feeding WDDGS up to 60% diet
DM did not affect carcass weight, dressing percentage or ribeye area. Likewise,
27
Beliveau and McKinnon (2008) and Ojowi et al. (1997) found no effect on
carcass characteristics when feeding WDDGS up to 23% and WWDG at 4.7%
DM in finishing diets, respectively. When increasing the wheat-based TS up to
6.7% in the drinking water for finishing steers, dressing percentage and carcass fat
thickness tended to increase, but carcass weight or longissimus dorsi muscle area
were not different compared to finishing steers receiving 0, 2, or 4% TS in their
drinking water (Fisher et al. 1999).
1.3.7. Meat Quality
Several studies have examined the retail and eating properties of cooked
beef from cattle fed distillers‘ grains. The appearance in the retail display is an
important attribute for consumer purchases. Color is an important attribute, with
the majority (72%) of consumers preferring steaks with a bright, cherry red color
(Killinger et al. 2004). Marbling, fat, appearance, and palatability are also
important selection criteria, but consumers looking for lean meat prefer lower
marbling and those looking for highly palatable beef (i.e. lots of flavor and juice)
prefer steaks with higher marbling (Killinger et al. 2004). Jenschke et al. (2007)
found that quality of steaks from yearling steers fed diets including up to 25%
CWDG in place of a mixture of high moisture and dry-rolled corn was not
affected by treatment, but that juiciness and tenderness and occurrence of off-
flavors were higher in carcasses which received a higher grade and there was a
lower occurrence of perceived connective tissue. Cattle fed CWDGS had a greater
number of steaks that had a higher USDA grade (Jenschke et al. 2007). Liver-like
off-flavors were lowest in steaks from cattle fed 30 and 50% CWDG, therefore,

28
CWDG were not responsible for the liver-like off flavors (Jenschke et al. 2007).
Roeber et al. (2005) set up an experiment to compare finishing Holstein steer diets
containing up to 50% of WDG and CDDG in place of whole or cracked corn.
Similar to the findings of Jenschke et al. (2007) tenderness and palatability of
cooked beef were not affected by addition of either CWDG or CDDG to the diet,
but the retail display properties varied among treatments. Steaks from animals fed
the 25% CDDG diet had the greatest number of visually unacceptable steaks,
which would be most likely discounted for quick sale (Roeber et al. 2005).
Feeding diets containing 40 and 50% CWDG or CDDG resulted in steaks that
were not as red, which made them visually less acceptable. It was concluded from
this study that including 10-25% CWDG or CDDG would prolong shelf life and
palatability of the cooked beef (Roeber et al. 2005). Gill et al. (2008) also
conducted a study comparing meat from finishing beef steers fed CWDGS and
CDDGS at 15% of dietary DM to that from steers fed sorghum-based distillers‘
grains and a steam flaked corn control diet. It was reported that regardless of
distiller grain type, steaks were lighter and less red compared to the cattle fed
steam flaked corn (Gill et al. 2008). There were no differences for juiciness or
flavor, although steaks from steers fed corn distillers‘ grains were more tender
compared to those fed sorghum distillers‘ grains (Gill et al. 2008). Feeding
WWDG at 13.4 % of dietary DM and 4.7% of dietary DM in backgrounding and
finishing diets, respectively, did not affect steak palatability and they were
considered typical of unseasoned cooked beef done to a medium degree of
doneness. Steaks from all treatments were similar in tenderness, juiciness,

29
contained very little perceivable connective tissue; flavor intensity and flavor
desirability were similar (Shand et al. 1998). Aldai et al. (2009) compared steaks
from steers fed CDDGS and WDDGS replacing barley grain at 20 or 40% of the
diet DM. The appearance of steaks in the retail display did not differ among
treatments (Aldai et al. 2009). Unlike Roeber et al. (2005) who found no
difference in tenderness, Aldai et al. (2009) found that steaks from cattle fed
CDDGS had higher tenderness scores and less perceived connective tissue than
cattle fed either WDDGS or the barley grain diet. Also, steaks from cattle fed a
20% CDDGS diet rated better than those from animals fed a 40% CDDGS diet.
Meat samples from the different dietary treatments did not differ in off-flavor
intensity or juiciness (Aldai et al. 2009).
The fatty acids, cis 9, trans 11-conjugated linoleic acid (CLA) and its
precursor, trans 11-18:1 have been associated with anti-carcinogenic properties
(Ha et al. 1990). Interestingly, Dugan et al. (2008) found that subcutaneous fat
from finishing heifers fed 0, 20, 40 or 60% WDDGS, had increased
concentrations of cis 9, trans 11-CLA and trans 11-18:1 and decreased
concentrations of trans 10-18:1 which has been associated with increased
coronary heart disease in humans (Hodgson et al. 1996). Gill et al. (2008) found
no treatment effect, compared to a steam flaked corn control diet, on trans 11-
18:1 concentrations when either CWDGS or CDDGS were added at 15 % diet
DM. Dugan et al. (2008) and Gill et al. (2008) also noted that the concentrations
of saturated fatty acids (SFA) were not affected by addition of WDDGS or corn-
based distillers‘ grains to the diet. However, Shand et al. (1998) found that cattle
30
fed WWDG had a slightly higher concentration of saturated fat in the muscle
compared to control cattle.
1.4. Conclusion
As ethanol production increases, so will the amount of distillers‘ grains
produced as they are a co-product. Geographic location of the ethanol plants and
the price of grain determine the type of grain used as feedstock for ethanol
production. The type of grain used, its nutritive properties, and different
processing techniques used in ethanol production alter the nutritional properties of
the resulting distillers‘ grains. Whether or not the distillers‘ grains are fed as
WDG or DDG, and with or without solubles also affects the nutritive values of
distillers‘ grains and thus growth performance of ruminant animals.
Currently, there have been no feeding trials done to assess the feeding
value of TDDGS compared to that of CDDGS or WDDGS as a replacement for
barley grain. In addition, due to environmental concerns about nitrogen and
phosphorus pollution, the amount of nitrogen and phosphorus excretion should be
examined and quantified for diets containing TDDGS.

31
1.5. Literature Cited
Abrams, S. M., Klopfenstein, T. J., Stock, R. A., Britton, R. A. and Nelson,
M. L. 1983. Preservation of wet distillers grains and its value as a protein source
for growing ruminants. J. Anim. Sci. 57: 729-738.
Alberta Agriculture and Rural Development. 2007. [Online] Available:
http://www1.agric.gov.ab.ca [2007 July 16].
Aldai, N., Aalhus, J. L., Dugan, M. E. R., Robertson, W. M., McAllister, T.
A., Walter, L. J. and McKinnon, J. J. 2009. Comparison of wheat- versus corn-
based dried distillers‘ grains with solubles on meat quality of feedlot cattle. Meat
Science. Submitted.
Al-Suwaiegh, S., Fanning, K. C., Grant, R. J., Milton, C. T. and Klopfenstein,
T. J. 2002. Utilization of distillers grains from the fermentation of sorghum or
corn in diets for finishing beef and lactating dairy cattle. J. Anim. Sci. 80: 1105-
1111.
Altenbach, S. B., DuPont, F. M., Kothari, K. M., Chan, R., Johnson, E. L.
and Lieu, D. 2003. Temperature, water and fertilizer influence the timing of key
events during grain development in a US spring wheat. J. of Cereal Sci. 37: 9-20.
Anderson, J. L., Schingoethe, D. J., Kalscheur, K. F. and Hippen, A. R. 2006.
Evaluation of dried and wet distillers grains included at two concentrations in the
diets of lactating dairy cows. J. Dairy Sci. 89: 3133-3142.
Baldwin, R. L. and Allison, M. J. 1983. Rumen metabolism. J. Anim. Sci. 57:
461-477.
Bashir, S. and Lee, S. 1994. Fuel ethanol production from agricultural
lignocellulosic feedstocks – a review. Fuel Science and Technology Int‘l. 12:
1427-1473.
Batajoo, K. K. and Shaver, R. D. 1998. In situ dry matter, crude protein, and
starch degradabilities of selected grains and by-product feeds. Anim. Feed Sci.
and Technol. 71: 165-176.
Beliveau, R. M. and McKinnon, J. J. 2008. Effect of graded levels of wheat-
based dried distillers‘ grains with solubles on performance and carcass
characteristics of feedlot steers. Can. J. Anim. Sci. 88: 677-684.
Belyea, R. L., Steevens, B. J., Restrepo, R. J. and Clubb, A. P. 1989. Variation
in composition of by-product feeds. J. Dairy Sci. 72: 2339-2345.
Belyea, R. L., Rausch, K. D. and Tumbleson, M. E. 2004. Composition of corn
and distillers dried grains with solubles from dry grind ethanol processing.
Bioresource Technology 94: 293-298.

32
Bhatti, S. A. and Firkins, J. L. 1995. Kinetics of hydration and functional
specific gravity of fibrous feed by-products. J. Anim. Sci. 73: 1449-1458.
Boila, R. J. and Ingalls, J. R. 1994. The ruminal degradation of dry matter,
nitrogen and amino acids in wheat-based distillers‘ dried grains in sacco. Anim.
Feed Sci. and Technol. 48: 57-72.
Bothast, R. J. and Schlicher, M. A. 2005. Biotechnological processes for
conversion of corn into ethanol. Appl. Microbiol. Biotechnol. 67: 19-25.
Buckner, C. D., Mader, T. L., Erickson, G. E., Colgan, S. L., Mark, D. R.,
Bremer, V. R., Karges, K. K. and Gibson, M. L. 2008. Evaluation of dry
distillers grains plus solubles inclusion on performance and economics of
finishing beef steers. The Professional Animal Scientist 24: 404-410.
Canadian Food Inspection Agency. 2009. Regulatory guidance: ethanol
distillers‘ grains for livestock feed. [Online] Available:
http://www.inspection.gc.ca/ [2009 Oct 12].
Canadian Renewable Fuels Association. 2009. [Online] Available:
http://greenfuels.org/. [2009 Aug. 24].
Chalupa, W. 1977. Manipulating rumen fermentation. J. Anim. Sci. 46: 585-599.
Davidson, W. B. 1940. Selenium Poisoning. Canadian Journal of Comparative
Medicine 4: 19-25.
DiPardo, J. 2000. Outlook for biomass ethanol production and demand. Energy
Information Administration, US Department of Energy, Washington, D. C.
Dugan, M. E. R., Aldai, N., Gibb, D. J., McAllister, T. A., Rolland, D. C. and
Kramer, J. K. G. 2008. Substituting dried distillers‘ grains from wheat for rolled
barley in finisher diets improves the trans-18:1 composition in beef fat. In
Proceedings 54th
International Congress of Meat Science and Technology
(Session 2B: Human Nutrition Challenges), 10-15 August 2008, Cape Town,
South Africa.
Environment Canada. 2008. A climate change plan for the purposes of the
Kyoto Accord Implementation Act. [Online] Available: http://www.ec.gc.ca/ [21
Aug 2009.
Firkins, J. L., Berger, L. L. and Fahey Jr., G. C. 1985. Evaluation of wet and
dry distillers grains and wet and dry corn gluten feeds for ruminants. J. Anim. Sci.
60: 847-860.
Fisher, D. J., McKinnon, J. J., Mustafa, A. F., Christensen, D. A. and
McCartney, D. 1999. Evaluation of wheat-based thin stillage as a water source
for growing and finishing beef cattle. J. Anim. Sci. 77: 2810-2816.

33
Fitter, J., Herrmann, R., Dencher, N. A., Blume, A. and Hauss, T. 2001. Activity and stability of a thermostable α-amylase compared to its mesophilic
homologue: mechanisms of thermal adaptation. Biochemistry 40: 10723-10731.
Fron, M., Madeira, H., Richards, C. and Morrison, M. 1996. The impact of
feeding condensed distillers byproducts on rumen microbiology and metabolism.
Anim. Feed Sci. and Technol. 61: 235-245.
Gibb, D. J., Hao, X. and McAllister, T. A. 2008. Effect of dried distillers‘ grains
from wheat on diet digestibility and performance of feedlot cattle. J. Anim. Sci.
88: 659-665.
Gill, R. K., VanOverbeke, D. L., Depenbusch, B., Drouillard, J. S. and
DiCostanzo, A. 2008. Impact of beef cattle diets containing corn or sorghum
distillers grains on beef color, fatty acid profiles, and sensory attributes. J. Anim.
Sci. 86: 923-935.
Grant, R. J. 1994. Influence of corn and sorghum starch on the in vitro kinetics
of forage fiber digestion. J. Dairy Sci. 77: 1563-1569.
Greter, A. M., Penner, G. B., Davis, E. C. and Oba, M. 2008. Effects of
replacing corn dry distillers‘ grains with triticale dry distillers‘ grains on lactation
performance and plasma metabolites of dairy cows. Can. J. Anim. Sci. 88: 129-
132.
Ha, Y. L., Storkson, J. and Pariza, M. W. 1990. Inhibition of benzo(a)pyrene-
induced mouse forestomach neoplasia by conjugated dienoic derivatives of
linoleic acid. Cancer Res. 50: 1097–1101.
Ham, G. A., Stock, R. A., Klopfenstein, T. J., Larson, E. M., Shain, D. H. and
Huffman, R. P. 1994. Wet corn distillers byproducts compared with dried corn
distillers grains with solubles as a source of protein and energy for ruminants. J.
Anim. Sci. 72: 3246-3257.
Hodgson, J. M., Wahlqvist, M. L., Boxall, J. A. and Balazs, N. D. 1996. Platelet trans fatty acids in relation to angiographically assessed coronary artery
disease. Atherosclerosis 120: 147–154.
Homm, J. W., Berger, L. L., Forster Jr., L. A. and Nash, T. G. 2008. Optimizing the length of feeding an elevated level of dried distillers grains plus
solubles-soybean hull diet to feedlot cattle. The Professional Animal Scientist 24:
328-333.
Huls, T. J., Bartosh, A. J., Daniel, J. A., Zelinsky, R. D., Held, J. and Wertz-
Lutz, A. E. 2006. Efficacy of dried distiller‘s grains with solubles as a
replacement for soybean meal and a portion of the corn in a finishing lamb diet.
Sheep and Goat Research Journal 21: 30-34.

34
Husky Energy. 2009. [Online] Available: http://www.huskyenergy.com/. [2009
Sept. 2].
Iwanchysko, P., McKinnon, J. J., Mustafa, A. F., Christensen, D. A. and
McCartney, D. 1999. Feeding value of wheat-based thin stillage: in vitro protein
degradability and effects on ruminal fermentation. J. Anim. Sci. 77: 2817-2823.
Jenschke, B. E., James, J. M., Vander Pol, K. J., Klopfenstein, T. J. and
Calkins, C. R. 2007. Wet distillers grains plus solubles do not increase liver-like
off-flavors in cooked beef from yearling steers. J. Muscle Foods 18: 341-348.
Keim, C. 1983. Technology and economics of fermentation alcohol – an update.
Enzyme Microb. Technol. 5: 103-114.
Killinger, K. M., Calkins, C. R., Umberger, W. J., Feuz, D. M. and Eskridge,
K. M. 2004. Consumer visual preference and value for beef steaks differing in
marbling level and color. J. Anim. Sci. 82: 3288-3293.
Kleinschmit, D. H., Schingoethe, D. J., Kalscheur, K. F and Hippen, A. R.
2006. Evaluation of various sources of corn dried distillers grains plus solubles for
lactating dairy cattle. J. Dairy Sci. 89: 4784-4794.
Klopfenstein, T. J., Erickson, G. E. and Bremer, V. R. 2008. Board-invited
review: use of distillers by-products in the beef cattle feeding industry. J. Anim.
Sci. 86: 1223-1231.
Lan, Y., Opapeju, F. O. and Nyachoti, C. M. 2008. True ileal protein and
amino acid digestibilities in wheat dried distillers‘ grains with solubles fed to
finishing pigs. Anim. Feed Sci. Technol. 140: 155–163.
Larson, E. M., Stock, R. A., Klopfenstein, T. J., Sindt, M. H. and Huffman,
R. P. 1993. Feeding value of wet distillers byproducts for finishing ruminants. J.
Anim. Sci. 71: 2228-2236.
Liu, K. 2008. Particle size distribution of distillers dried grains with solubles
(DDGS) and relationships to compositional and color properties. Bioresource
Technology 99: 8421-8428.
Lodge, S. L., Stock, R. A., Klopfenstein, T. J., Shain, D. H. and Herold, D. W.
1997. Evaluation of wet distillers composite for finishing ruminants. J. Anim. Sci.
75: 44–50.
Lory, J. A., Massey, R. E., Fulhage, C. D., Shannon, M. C., Belyea, R. L. and
Zulovich, J. M. 2008. Comparing the feed, fertilizer, and fuel value of distiller‘s
grains. Online. Crop Management doi:10.1094/CM-2008-0428-01-RV.

35
Loy, T. W., Klopfenstein, T. J., Erickson, G. E., Macken, C. N. and
MacDonald, J. C. 2008. Effect of supplemental energy source and frequency on
growing calf performance. J. Anim. Sci. 86: 3504-3510.
Maiorella, B. L., Blanch, H. W. and Wilke, C. R. 1984. Economic evaluation of
alternative ethanol fermentation processes. Biotechnology and Bioengineering 26:
1003-1025.
McBride, B. W. and Kelly, J. M. 1990. Energy cost of absorption and
metabolism in the ruminant gastrointestinal tract and liver: A review. J. Anim.
Sci. 68: 2997-3010.
McKenzie, R., Andreiuk, R. and McLelland, M. 2008. High protein wheat
production. Agdex 112/20-4 [Online] Available: http://www1.agric.gov.ab.ca
[2009 Sept 29].
McKinnon, J. J. and Walker, A. M. 2008. Comparison of wheat-based dried
distillers‘ grain with solubles to barley as an energy source for backgrounding
cattle. Can. J. Anim. Sci. 88: 721-724.
Morrison, F. B. 1957. Feeds and feeding. 22nd
ed. The Morrison Publishing
Company, Ithaca, NY.
Murthy, G. S., Sall, E. D., Metz, S. G., Foster, G. and Singh, V. 2009. Evaluation of a dry corn fractionation process for ethanol production with
different hybrids. Industrial Crops and Products 29: 67-72.
Mustafa, A. F., McKinnon, J. J., Ingledew, M. W. and Christensen, D. A.
2000. The nutritive value for ruminants of thin stillage and distillers‘ grains
derived from wheat, rye, triticale and barley. J. Sci. Food and Agric. 80: 607-613.
National Research Council. 2007. Nutrient requirements of small ruminants. 7th
ed. National Academy of Science, Washington, DC.
O’Connor, D. 2007. The impact of changes in the ethanol production process on
the nutritional value of distillers grain. In Proceedings 28th
Western Nutrition
Conference, 25-27 Sept 2007, Saskatoon, SK.
Ojowi, M., McKinnon, J. J., Mustafa, A. and Christensen, D. A. 1997. Evaluation of wheat-based wet distillers‘ grains for feedlot cattle. Can. J. Anim.
Sci. 77: 447-454.
Peter, C. M., Faulkner, D. B., Merchen, N. R., Parrett, D. F., Nash, T. G. and
Dahlquist, J. M. 2000. The effects of corn milling coproducts on growth
performance and diet digestibility by beef cattle. J. Anim. Sci. 78: 1-6.
Pimentel, D. 2003. Ethanol fuels: energy balance, economics, and environmental
impacts are negative. Natural Resources Research 12: 127-133.

36
Potter, E. L., Cooley, C. O., Richardson, L. F., Raun, A. P. and Rathmacher,
R. P. 1976. Effect of monensin on performance of cattle fed forage. J. Anim. Sci.
43: 665-669.
Rausch, K. D. and Belyea, R. L. 2006. The future of co-products from corn
processing. Appl. Biochem. Biotechnol. 128: 47–86.
Roeber, D. L., Gill, R. K. and DiCostanzo, A. 2005. Meat quality responses to
feeding distiller‘s grains to finishing Holstein steers. J. Anim. Sci. 83: 2455-2460.
Rust, S. R., Newbold, J. R. and Metz, K. W. 1990. Evaluation of condensed
distillers‘ solubles as an energy source for finishing cattle. J. Anim. Sci. 68: 186-
192.
Sasikala-Appukuttan, A. K., Schingoethe, D. J., Hippen, A. R., Kalscheur, K.
F., Karges, K. and Gibson, M. L. 2008. The feeding value of corn distillers
solubles for lactating dairy cows. J. Dairy Sci. 91: 279-287.
Schauer, C. S., Anderson, L. P., Stecher, D. M., Pearson, D. and Drolc, D.
2005. Influence of dried distillers grains on feedlot performance and carcass
characteristics of finishing lambs. 46th
Annual Sheep and Beef Day, North Dakota
State University. 46: 31–33.
Schilling, K. E. and Libra, R. D. 2000. The relationship of nitrate concentrations
in streams to row crop land use in Iowa. J. Environ. Qual. 29: 1846-1851.
Shand, P. J., McKinnon, J. J. and Christensen, D. A. 1998. Eating quality of
beef from animals fed wet brewers‘ grains and wheat-based distillers‘ grains. Can.
J. Anim. Sci. 78: 143-146.
Simpson, T. W., Sharpley, A. N., Howarth, R. W., Paerl, H. W. and Mankin,
K. R. 2008. The new gold rush: fueling ethanol production while protecting water
quality. J. Environ. Qual. 37: 318-324.
Solomon, B. D., Barnes, J. R. and Halvorsen, K. E. 2007. Grain and cellulosic
ethanol: history, economics, and energy policy. Biomass and Bioenergy 31: 416-
425.
Spiehs, M. J., Whitney, M. H. and Shurson, G. C. 2002. Nutrient database for
distiller‘s dried grains with solubles produced from new ethanol plants in
Minnesota and South Dakota. J. Anim. Sci. 80: 2639-2645.
Stein, H. H., Gibson, M. L., Pedersen, C. and Boersma, M. G. 2006. Amino
acid and energy digestibility in ten samples of distillers grains with solubles fed to
growing pigs. J. Anim. Sci. 84: 853–860.
37
Stern, K. R., Jansky, S. and Bidlack, J. E. 2007. Introductory plant biology. 9th
ed. McGraw-Hill Higher Education, New York, NY.
Tsen, C. C., Eyestone, W. and Weber, J. L. 1982. Evaluation of the quality of
cookies supplemented with distillers‘ dried grain flours. J. Food Sci. 47: 684-685.
Tsen, C. C., Weber, J. L. and Eyestone, W. 1983. Evaluation of distillers‘ dried
grain flour as a bread ingredient. Cereal Chem. 60: 295-297.
Vasconcelos, J. T. and Galyean, M. L. 2007. Nutritional recommendations of
feedlot consulting nutritionists: the 2007 Texas Tech University survey. J. Anim.
Sci. 85: 2772-2781.
Wheals, A. E., Basso, L. C., Alves, D. M. G. and Amorin, H. V. 1999. Fuel
ethanol after 25 years. Trends in Biotechnol. 17: 482-487.
Wierenga, K. T., McAllister, T. A., Gibb, D. J., Okine, E. K., Beauchemin, K.
A. and Oba, M. 2009. Evaluating triticale dried distillers grains as a forage
substitute in feedlot finishing diets. 30th
Western Nutrition Conference 23-24 Sept
2009 Winnipeg, MB.
Wu, Y. V., Sexson, K. R. and Lagoda, A. A. 1984. Protein-rich residue from
wheat alcohol distillation: Fractionation and characterization. Cereal Chem. 61:
423-427.
38
2.0. EFFECTS OF CORN-, WHEAT- OR TRITICALE DRY DISTILLERS’
GRAINS PLUS SOLUBLES ON IN VITRO FERMENTATION, GROWTH
PERFORMANCE AND CARCASS TRAITS OF LAMBS1
2.1. Introduction
Inclusion of dry distillers‘ grains plus solubles in ruminant diets has
increased in conjunction with expansion of the ethanol industry. Corn-based
DDGS is primarily produced in eastern Canada and the United States (Beliveau
and McKinnon 2008), but the cooler climate in western Canada is not suitable for
growing corn grain (Boila and Ingalls, 1994). Thus, the western Canadian ethanol
industry generally utilizes wheat, which contributes to about one-third of
Canada‘s total ethanol production (Gibb et al. 2008). Triticale, a cross between
wheat and rye, also has potential to be used as a substrate for bio-ethanol
production as ethanol yield from triticale is similar to wheat (Wang et al. 1997).
Extensive research has been conducted to examine the feeding value of
corn distillers‘ grains. Including corn distillers‘ grains in the diets of feedlot cattle
at up to 40% of dietary DM improved FE (Ham et al. 1994; Larson et al. 1993;
Al-Suwaiegh et al. 2002). Wheat-based DDGS fed at up to 60% of dietary DM
has increased (McKinnon and Walker 2008), decreased (Gibb et al. 2008), or had
no effect (Beliveau and McKinnon 2008) on FE in feedlot cattle. In general,
incorporating corn- or wheat-based distillers‘ grains into diets has not affected
carcass quality (Larson et al. 1993; Ham et al. 1994; Beliveau and McKinnon
1 A version of this chapter has been accepted for publication. McKeown, L. E., Chaves, A. V.,
Oba, M., Dugan, M. E. R., Okine, E. and McAllister, T. A. 2009. Can. J. Anim. Sci.

39
2008), although increased back fat thickness has been reported in some studies
(Al-Suwaiegh et al. 2002; Gibb et al. 2008). In vitro and in situ studies suggest
that the nutrient degradability of TDDGS is similar to WDDGS (Mustafa et al.
2000). However, no feeding trials have been conducted to compare the feeding
value of TDDGS to that of WDDGS or CDDGS for beef cattle.
The current study was conducted to examine the effects of feeding
CDDGS, WDDGS or TDDGS in place of a mixture of barley grain and canola
meal at 20% of dietary DM on in vitro fermentation, growth performance and
carcass characteristics of lambs.
2.2. Materials and Methods
This experiment was conducted between June 2007 and August 2007 at
the Agriculture and Agri-Food Canada Lethbridge Research Centre (Lethbridge,
AB, Canada). All animals were cared for in accordance with the guidelines of the
Canadian Council on Animal Care (1993).
2.2.1. Experimental Design and Dietary Treatments
For this study, CDDGS was obtained from an ethanol plant in South
Dakota, TDDGS was produced at Alberta Distillers Ltd. (Calgary, AB) and
WDDGS was produced at Husky Energy Inc. (Lloydminster, SK). For
compositional analysis (Table 2.1.), two representative samples of each DDGS
type were collected from the storage bins, immediately before diet ingredients
were combined for pelleting.

40
Table 2.1. Chemical composition of corn-, wheat- and triticale-
based dried distillers’ grains plus solubles
Distillers‘ grains plus solubles type
Item Corn
(n = 2)
Wheat
(n = 2)
Triticale
(n = 2)
Dry matter (%) 88.8 91.5 89.3
Organic matter (% DM) 95.6 94.7 95.6
Neutral detergent fibre (% DM) 32.9 28.0 29.6
Acid detergent fibre (% DM) 15.5 16.3 13.7
Crude protein (% DM) 32.6 43.0 30.7
Ether extract (% DM) 5.7 4.4 5.4
Four experimental diets were prepared in single lots of sufficient quantity
for the entire study. The control diet consisted of 55.9% milled barley grain,
16.0% sunflower hulls, 11.5% beet pulp, 10.0% canola meal, 2.5% beet molasses
and 4.1% vitamin and minerals on a DM basis (Table 2.2.). Treatment diets
contained 20% CDDGS, TDDGS or WDDGS on a DM basis, as a direct
replacement of 10% barley grain and 10% canola meal. All diets were formulated
to meet or exceed NRC requirements for growing lambs (NRC 2007) and were
fed as a pelleted total mixed ration.
Sixty Canadian Arcott ram lambs were weaned at 49 ± 4 d onto a lamb
grower ration for a 14-d transition period, then were assigned to receive one of
four experimental diets (n = 15) commencing at 63 ± 4 d of age, at an average live
weight of 22.6 ± 0.6 kg. Lambs were housed in individual pens (0.97 m × 2.82 m)
bedded with straw, and had free access to water. Feed was delivered once daily in
quantities to meet ad libitum intake.
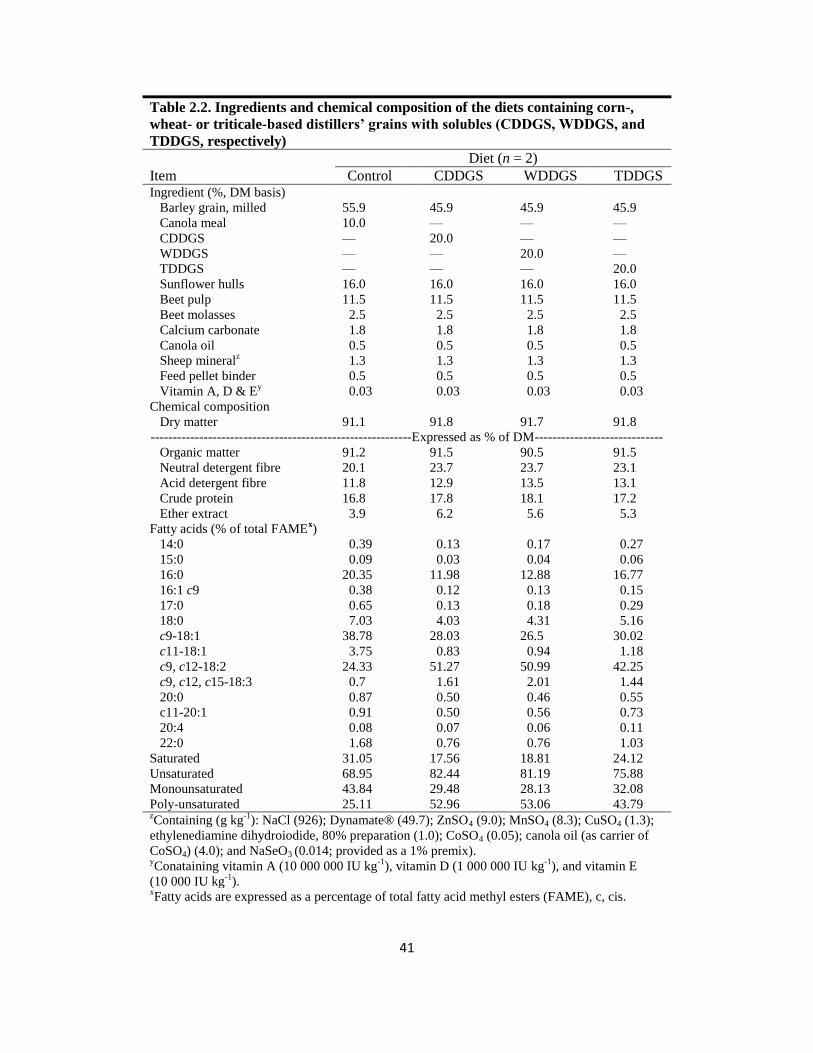
41
Table 2.2. Ingredients and chemical composition of the diets containing corn-,
wheat- or triticale-based distillers’ grains with solubles (CDDGS, WDDGS, and
TDDGS, respectively)
Diet (n = 2)
Item Control CDDGS WDDGS TDDGS Ingredient (%, DM basis)
Barley grain, milled 55.9 45.9 45.9 45.9
Canola meal 10.0 — — —
CDDGS — 20.0 — —
WDDGS — — 20.0 —
TDDGS — — — 20.0
Sunflower hulls 16.0 16.0 16.0 16.0
Beet pulp 11.5 11.5 11.5 11.5
Beet molasses 2.5 2.5 2.5 2.5
Calcium carbonate 1.8 1.8 1.8 1.8
Canola oil 0.5 0.5 0.5 0.5
Sheep mineralz 1.3 1.3 1.3 1.3
Feed pellet binder 0.5 0.5 0.5 0.5
Vitamin A, D & Ey 0.03 0.03 0.03 0.03
Chemical composition
Dry matter 91.1 91.8 91.7 91.8
-----------------------------------------------------------Expressed as % of DM-----------------------------
Organic matter 91.2 91.5 90.5 91.5
Neutral detergent fibre 20.1 23.7 23.7 23.1
Acid detergent fibre 11.8 12.9 13.5 13.1
Crude protein 16.8 17.8 18.1 17.2
Ether extract 3.9 6.2 5.6 5.3
Fatty acids (% of total FAMEx)
14:0 0.39 0.13 0.17 0.27
15:0 0.09 0.03 0.04 0.06
16:0 20.35 11.98 12.88 16.77
16:1 c9 0.38 0.12 0.13 0.15
17:0 0.65 0.13 0.18 0.29
18:0 7.03 4.03 4.31 5.16
c9-18:1 38.78 28.03 26.5 30.02
c11-18:1 3.75 0.83 0.94 1.18
c9, c12-18:2 24.33 51.27 50.99 42.25
c9, c12, c15-18:3 0.7 1.61 2.01 1.44
20:0 0.87 0.50 0.46 0.55
c11-20:1 0.91 0.50 0.56 0.73
20:4 0.08 0.07 0.06 0.11
22:0 1.68 0.76 0.76 1.03
Saturated 31.05 17.56 18.81 24.12
Unsaturated 68.95 82.44 81.19 75.88
Monounsaturated 43.84 29.48 28.13 32.08
Poly-unsaturated 25.11 52.96 53.06 43.79 zContaining (g kg
-1): NaCl (926); Dynamate® (49.7); ZnSO4 (9.0); MnSO4 (8.3); CuSO4 (1.3);
ethylenediamine dihydroiodide, 80% preparation (1.0); CoSO4 (0.05); canola oil (as carrier of
CoSO4) (4.0); and NaSeO3 (0.014; provided as a 1% premix). yConataining vitamin A (10 000 000 IU kg
-1), vitamin D (1 000 000 IU kg
-1), and vitamin E
(10 000 IU kg-1
). xFatty acids are expressed as a percentage of total fatty acid methyl esters (FAME), c, cis.

42
2.2.2. In Vitro Incubation
Inoculum for the in vitro incubations was prepared from ruminal contents
of three ruminally cannulated Holstein cows. The cows had ad libitum access to a
diet that consisted of 38.3% barley silage, 56.0% concentrate and 5.7% chopped
alfalfa/grass hay on a DM basis.
Ruminal contents were collected from the ventral sac and mid-dorsal feed
mat of each cow 2 h after the morning feeding. The ruminal contents were
combined and squeezed through two layers of cheesecloth into an insulated
container and transported 0.5 km back to the laboratory, where pH was recorded.
Prior to the incubations, the pelleted diets described above were each
ground to pass through a 4-mm screen, and single diets were weighed in 0.5-g
quantities into 120-mL amber serum bottles (six bottles per diet). Bottles were
pre-warmed to 39ºC and flushed with CO2. Filtered ruminal content was
combined with three volumes of buffer solution (Menke et al. 1979) that had been
pre-warmed to 39ºC under CO2. Inoculum was dispensed (40-mL quantities)
under CO2 to each serum bottle. Bottles were sealed immediately and placed on a
rotary shaker (Lab-line Instruments Inc. Melrose Park, IL) at 150 rpm in a
cabinet-style incubator (Forma Scientific, Marietta, OH) at 39ºC. Six bottles
containing no substrate were also prepared as blanks to correct for gas, ammonia
and VFA production that originated solely from the inoculum.
After 3, 6, 12 and 24 h of incubation, total gas production was determined
for six replicates of each treatment and the six control bottles using a water
43
displacement technique (Fedorak and Hrudey 1983). After 24-h of incubation, pH
was measured, and 1.5-mL duplicate samples were collected to determine
concentrations of VFA and ammonia. Samples for VFA analysis were preserved
in 300 µL of 25% (wt/vol) metaphosphoric acid, and those for ammonia analysis
were mixed with 200 µL of 65% (wt/vol) trichloroacetic acid. All samples were
stored at -20°C until analyzed. Contents remaining in the serum bottles were
transferred to pre-weighed centrifuge tubes. After centrifugation, pellets were
washed with ethanol, re-centrifuged and dried for determination of in vitro dry
matter digestibility (IVDMD).
For in vitro incubation, VFA concentrations were quantified using gas
chromatography (Hewlett Packard 5890, Agilent Technologies, Mississauga, ON)
with crotonic acid as the internal standard. Ammonia concentration from in vitro
samples were analyzed by the phenol hypochlorite method (Weatherburn 1967).
2.2.3. Data and Sample Collection
The amount of feed offered was recorded daily. Orts were weighed weekly
to determine DMI. For each lamb, DMI was calculated from the linear regression
between cumulative DMI and week, and the slope was divided by 7 to obtain
daily DMI. Feed samples from each diet were collected daily and composited by
month. Lambs were weighed weekly, and ADG was calculated as the linear
regression between body weight and week for each lamb. The regression values
for DMI and ADG were used to calculate FE (as feed consumed divided by
ADG).
44
Once live weights of > 45 kg had been attained by approx. 60% of the
lambs, the 11 heaviest individuals in each treatment group were shipped in one
load (average live weight 48.1 ± 3.7 kg) to a commercial abattoir (Sunterra Meats,
Innisfail, AB). Within 5 min of exsanguination, a 2-3 g fat sample was collected
from the base of the tail, kept on ice, and transported back to the lab where they
were snap frozen in liquid nitrogen and stored at -80 ºC until analyzed for fatty
acid profiles. Hot carcass weights were measured. Muscle scores were determined
for the shoulder, loin and hind leg on a scale of 1 to 5 in which 1 = extremely poor
and 5 = extremely good. Grade rule (i.e., body wall thickness) was determined
from the total tissue depth of the lamb carcass over the 12-13th
rib at 11 cm from
the carcass midline. Saleable meat yield (SMY) was determined from proximal
cuts including shortcut semi boneless leg, sirloin, chine off rack, loin short cut,
square shoulder and front shank; each trimmed to ≤ 0.64 cm subcutaneous fat as
per commercial standards (Chaves et al. 2008).
2.2.4. Chemical Analysis
The DM concentration of the composited feed samples was determined by
oven-drying at 135 ºC for 2 h followed by hot weighing (AOAC, 1995; method
930.15), and OM was determined by ashing samples at 550 ºC for 5 h. To
determine CP (nitrogen × 6.25), feed samples were ground to a fine powder using
a ball grinder (Mixer Mill MM200, Retsch inc., Newtown, PA). Nitrogen was
quantified by flash combustion with gas chromatography and thermal
conductivity detection (Nitrogen Analyzer 1500 series, Carlo Erba Instruments,
Milan Italy). Neutral detergent fibre was determined according to Van Soest et al.
45
(1991) using heat-stable α-amylase and sodium sulfite. Acid detergent fiber was
determined according to the procedure of AOAC (1995, method 973.18). Crude
fat content was determined by extraction with ether (method 920.39; AOAC,
1990) using a Goldfisch Fat Extractor (Laconco Corporation, Kansas City, MO).
Fatty acid methyl esters (FAME) were prepared according to a combined
base/acid methylation method of Kramer et al. (1997) with modifications (He et
al. 2009). The FAME were then quantified using gas chromatography (Hewlett
Packard GC System 6890N; Mississauga, ON), and flame ionization detection as
described by He et al. (2009), but modified so that samples were loaded on to the
column via 1 μL splitless injections.
Adipose tissue samples were freeze-dried and methylated with sodium
methoxide, and the FAME were analyzed using gas liquid chromatography and
silver ion high performance liquid chromatography as described by Cruz-
Hernandez et al. (2004) with minor modifications as two complementary gas
liquid chromatography temperature programs were used for trans-18:1 analysis
(Dugan et al. 2007; Kramer et al. 2008). Reference standards are described by
Aldai et al. (2008). The trans-18:1 and CLA isomers not included in the standard
mixtures were identified by their retention times and elution orders as reported
previously (Dugan et al. 2007).

46
2.2.5. Statistical Analyses
2.2.5.1. Growth Study
Growth performance and carcass trait data were analyzed as a completely
randomized design using the proc MIXED procedure of SAS (SAS Inc., 2009
SAS Online Doc® 9.1.3. Cary, NC, USA). The model included treatment as a
fixed effect, lamb as a random effect, and residual error as the error term. One
lamb from the control treatment was removed from the statistical analysis for
carcass trait data because it was condemned at slaughter for reasons unrelated to
treatment. Least square means were separated using the Bonferroni t-test.
Significance was declared at P ≤ 0.05 and a tendency was declared at 0.05 < P ≤
0.10.
2.2.5.2. In Vitro Incubation
All in vitro data were analyzed as a completely randomized design using
the proc MIXED procedure of SAS (SAS Inc., 2009 SAS Online Doc® 9.1.3.
Cary, NC, USA), with individual vial as an experimental unit. The model
included treatment as a fixed effect, and residual error was used as the error term.
Measurements conducted at each time point were analyzed independently. Least
square means were separated using the Bonferroni t-test. Significance was
declared at P ≤ 0.05 and a tendency was declared at 0.05 < P ≤ 0.10.

47
2.3. Results
2.3.1. In Vitro Incubations
Inclusion of CDDGS, WDDGS or TDDGS in the diets did not affect (P =
0.12) in vitro pH, which averaged 6.5 ± 0.05 across treatments (Table 2.3.).
Ammonia concentration at 24 h was approximately 60% higher (P < 0.05)
for the WDDGS diet compared to the CDDGS and TDDGS diets, but did not
differ from that of the control diet. Gas production among the four diets varied
over time. Total gas production was higher (P < 0.05) from the control diet than
from WDDGS and CDDGS diets, with TDDGS intermediate. In vitro dry matter
digestibility was lower (P < 0.05) for the WDDGS diet compared to the other
diets. Although total VFA concentrations did not differ (P = 0.14) among the four
diets (averaging 67.3 ± 0.72 mM), the proportion of individual VFA differed
among treatments. Concentration of acetate was higher (P < 0.05) in incubations
with WDDGS than with TDDGS, and neither of these diets differed from control
or CDDGS. Propionate accumulation was lower (P < 0.05) with WDDGS than the
other DDGS diets, and numerically lower than with control diet. These factors
resulted in higher (P < 0.05) acetate:propionate ratios with WDDGS and control
than with CDDGS or TDDGS. Butyrate production was higher (P < 0.05) with
TDDGS and control than with CDDGS and WDDGS.

48
Table 2.3. In vitro fermentation characteristics of diets containing corn-, wheat-,
or triticale-based dry distillers’ grains plus solubles (CDDGS, WDDGS and
TDDGS, respectively) in place of 10% barley grain and 10% canola meal
Experimental dietz
Itemy
Control CDDGS WDDGS TDDGS SEM P
value
pH 6.5 6.5 6.5 6.4 0.05 0.12
Ammonia (mM) 7.7ab 6.1b 9.9a 6.3b 0.72 <0.01
Gas production (mL
g DM incubated-1
)
3 h 41.6c 43.2bc 48.7a 46.6ab 0.53 <0.01
6 h 63.0a 59.6b 56.7c 58.6bc 0.27 <0.01
12 h 54.6a 48.5b 45.7c 49.8b 0.41 <0.01
24 h 51.3a 46.8b 49.5a 50.5a 0.25 <0.01
Total gas
production 210.6a 198.1b 200.6b 205.5ab 0.99 <0.01
IVDMDx (%) 77.7a 76.8a 72.9b 78.2a 1.38 0.05
Corrected total VFA
production (mM) 68.75 66.65 66.54 67.3 0.72 0.14
Volatile fatty acids
(molar %)
Acetate 62.21ab 62.41ab 62.85a 61.85b 0.186 0.01
Propionate 19.27b 20.00a 19.05b 19.94a 0.077 <0.01
Butyrate 13.33a 12.77b 12.85b 13.33a 0.105 <0.01
Isobutyrate 1.05a 0.94b 0.96b 0.93b 0.010 <0.01
Isovalerate 1.67a 1.60ab 1.61ab 1.53b 0.019 <0.01
Valerate 2.05b 1.89c 2.26a 2.00b 0.020 <0.01
Caproic 0.42a 0.39b 0.43a 0.41ab 0.009 0.04
Acetate:Propionate 3.23a 3.12b 3.30a 3.10b 0.020 <0.01
Total VFA
concentration (mM)w 68.75 66.65 66.54 67.3 0.72 0.14
zIn each case, DDGS replaced 10% barley grain and 10% canola meal in the control
diet. yAll measurements were conducted after 24 h of incubation, except gas production as
indicated. xIVDMD: In vitro dry matter digestibility.
wTotal VFA concentrations were corrected using values measured in the substrate-free
controls (i.e., production solely from the inoculum).
a,b: Within a row, means lacking a common letter differ (P < 0.05).

49
2.3.2. Growth Performance and Carcass Characteristics
Including CDDGS, WDDGS or TDDGS in the diets did not affect (P ≥
0.05) DMI or ADG, which averaged 1.45 kg d-1
and 0.39 kg, respectively (Table
2.4.). Numerically greater intake and slower gain by lambs fed WDDGS led to
their having less efficient (P < 0.05) gain compared to those fed the control and
CDDGS diets.
Table 2.4. Effect of replacing 10% barley grain and 10% canola meal with corn-,
wheat- or triticale-based dried distillers’ grains plus solubles (CDDGS, WDDGS
and TDDGS, respectively) in the diet on performance of lambs
Experimental diet
Control
(n = 15)
CDDGS
(n = 15)
WDDGS
(n = 15)
TDDGS
(n = 15) SEM P value
Dry matter
intake (kg d-1
) 1.39 1.47 1.51 1.43 0.057 0.52
Average daily
gain (kg d-1
) 0.38 0.40 0.37 0.39 0.015 0.51
Feed
efficiency
(feed:gain) 3.65b 3.63b 4.08a 3.71ab 0.109 0.02
a,b: Within a row, means lacking a common letter differ (P < 0.05).
Feeding DDGS did not affect (P ≥ 0.39) carcass traits (hot carcass weight,
body wall thickness, or muscle scores of the leg, shoulder and loin (Table 2.5.).
Saleable meat yield and the weights of individual cuts of meat were not affected
by treatment (P ≥ 0.26) except for front shank (P = 0.02). The front shanks of
lambs fed control and CDDGS diets were heavier (P < 0.05) than those of lambs
fed WDDGS and TDDGS.
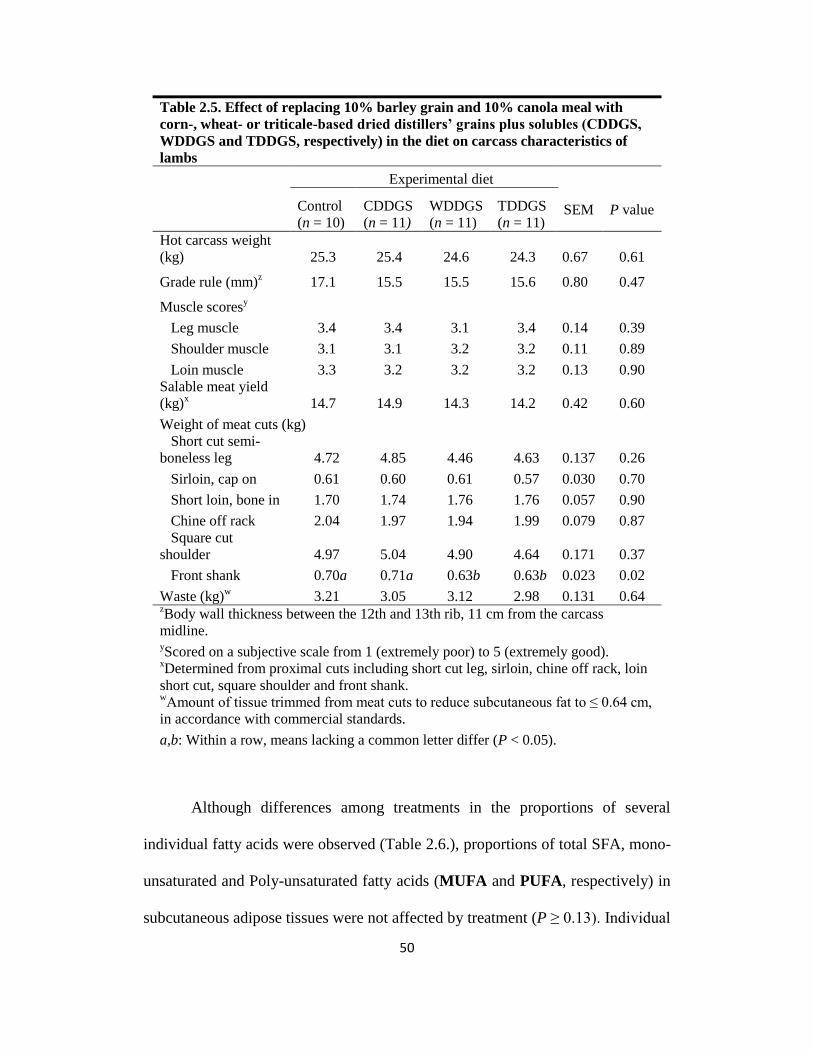
50
Table 2.5. Effect of replacing 10% barley grain and 10% canola meal with
corn-, wheat- or triticale-based dried distillers’ grains plus solubles (CDDGS,
WDDGS and TDDGS, respectively) in the diet on carcass characteristics of
lambs
Experimental diet
Control
(n = 10)
CDDGS
(n = 11)
WDDGS
(n = 11)
TDDGS
(n = 11) SEM P value
Hot carcass weight
(kg) 25.3 25.4 24.6 24.3 0.67 0.61
Grade rule (mm)z 17.1 15.5 15.5 15.6 0.80 0.47
Muscle scoresy
Leg muscle 3.4 3.4 3.1 3.4 0.14 0.39
Shoulder muscle 3.1 3.1 3.2 3.2 0.11 0.89
Loin muscle 3.3 3.2 3.2 3.2 0.13 0.90
Salable meat yield
(kg)x 14.7 14.9 14.3 14.2 0.42 0.60
Weight of meat cuts (kg)
Short cut semi-
boneless leg 4.72 4.85 4.46 4.63 0.137 0.26
Sirloin, cap on 0.61 0.60 0.61 0.57 0.030 0.70
Short loin, bone in 1.70 1.74 1.76 1.76 0.057 0.90
Chine off rack 2.04 1.97 1.94 1.99 0.079 0.87
Square cut
shoulder 4.97 5.04 4.90 4.64 0.171 0.37
Front shank 0.70a 0.71a 0.63b 0.63b 0.023 0.02
Waste (kg)w 3.21 3.05 3.12 2.98 0.131 0.64
zBody wall thickness between the 12th and 13th rib, 11 cm from the carcass
midline. yScored on a subjective scale from 1 (extremely poor) to 5 (extremely good).
xDetermined from proximal cuts including short cut leg, sirloin, chine off rack, loin
short cut, square shoulder and front shank. wAmount of tissue trimmed from meat cuts to reduce subcutaneous fat to ≤ 0.64 cm,
in accordance with commercial standards.
a,b: Within a row, means lacking a common letter differ (P < 0.05).
Although differences among treatments in the proportions of several
individual fatty acids were observed (Table 2.6.), proportions of total SFA, mono-
unsaturated and Poly-unsaturated fatty acids (MUFA and PUFA, respectively) in
subcutaneous adipose tissues were not affected by treatment (P ≥ 0.13). Individual
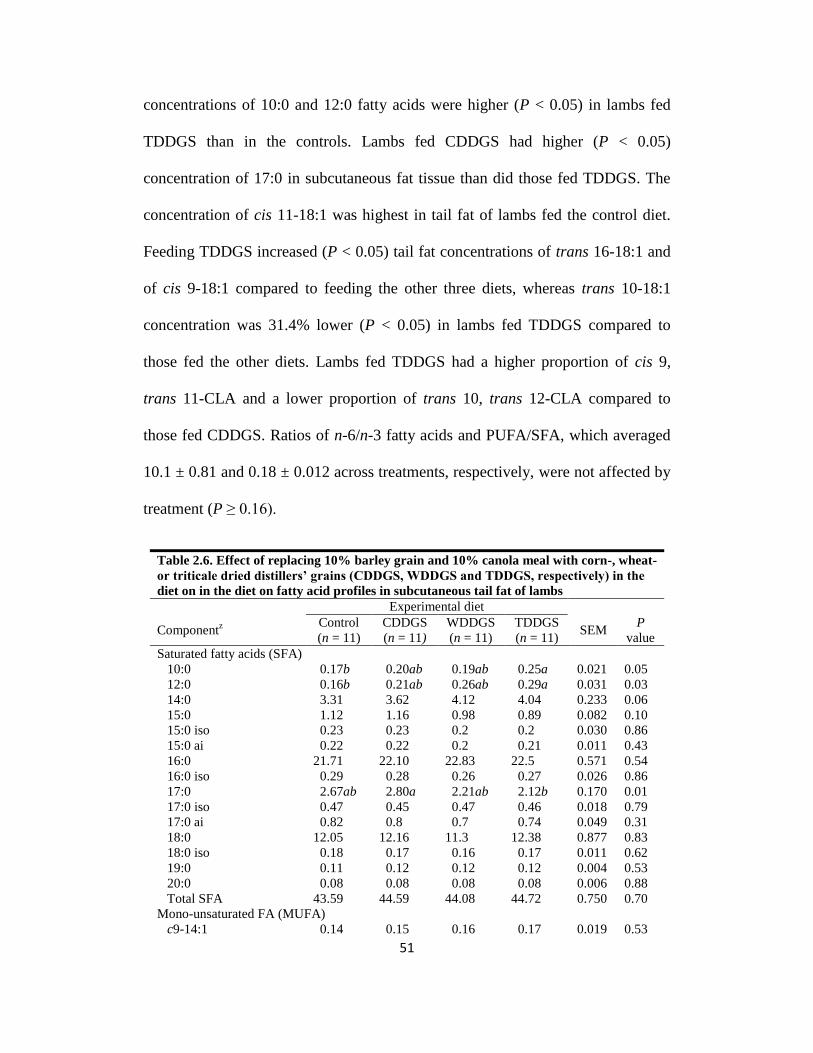
51
concentrations of 10:0 and 12:0 fatty acids were higher (P < 0.05) in lambs fed
TDDGS than in the controls. Lambs fed CDDGS had higher (P < 0.05)
concentration of 17:0 in subcutaneous fat tissue than did those fed TDDGS. The
concentration of cis 11-18:1 was highest in tail fat of lambs fed the control diet.
Feeding TDDGS increased (P < 0.05) tail fat concentrations of trans 16-18:1 and
of cis 9-18:1 compared to feeding the other three diets, whereas trans 10-18:1
concentration was 31.4% lower (P < 0.05) in lambs fed TDDGS compared to
those fed the other diets. Lambs fed TDDGS had a higher proportion of cis 9,
trans 11-CLA and a lower proportion of trans 10, trans 12-CLA compared to
those fed CDDGS. Ratios of n-6/n-3 fatty acids and PUFA/SFA, which averaged
10.1 ± 0.81 and 0.18 ± 0.012 across treatments, respectively, were not affected by
treatment (P ≥ 0.16).
Table 2.6. Effect of replacing 10% barley grain and 10% canola meal with corn-, wheat-
or triticale dried distillers’ grains (CDDGS, WDDGS and TDDGS, respectively) in the
diet on in the diet on fatty acid profiles in subcutaneous tail fat of lambs
Experimental diet
Componentz
Control
(n = 11)
CDDGS
(n = 11)
WDDGS
(n = 11)
TDDGS
(n = 11) SEM
P
value
Saturated fatty acids (SFA) 10:0 0.17b 0.20ab 0.19ab 0.25a 0.021 0.05
12:0 0.16b 0.21ab 0.26ab 0.29a 0.031 0.03
14:0 3.31 3.62 4.12 4.04 0.233 0.06
15:0 1.12 1.16 0.98 0.89 0.082 0.10
15:0 iso 0.23 0.23 0.2 0.2 0.030 0.86
15:0 ai 0.22 0.22 0.2 0.21 0.011 0.43
16:0 21.71 22.10 22.83 22.5 0.571 0.54
16:0 iso 0.29 0.28 0.26 0.27 0.026 0.86
17:0 2.67ab 2.80a 2.21ab 2.12b 0.170 0.01
17:0 iso 0.47 0.45 0.47 0.46 0.018 0.79
17:0 ai 0.82 0.8 0.7 0.74 0.049 0.31
18:0 12.05 12.16 11.3 12.38 0.877 0.83
18:0 iso 0.18 0.17 0.16 0.17 0.011 0.62
19:0 0.11 0.12 0.12 0.12 0.004 0.53
20:0 0.08 0.08 0.08 0.08 0.006 0.88
Total SFA 43.59 44.59 44.08 44.72 0.750 0.70
Mono-unsaturated FA (MUFA)
c9-14:1 0.14 0.15 0.16 0.17 0.019 0.53

52
Table 2.6. Con’t. Effect of replacing 10% barley grain and 10% canola meal with corn-,
wheat- or triticale dried distillers’ grains (CDDGS, WDDGS and TDDGS, respectively)
in the diet on in the diet on fatty acid profiles in subcutaneous tail fat of lambs
Experimental diet
Componentz
Control
(n = 11)
CDDGS
(n = 11)
WDDGS
(n = 11)
TDDGS
(n = 11) SEM
P
value
c7-16:1 0.37 0.35 0.36 0.38 0.012 0.42
c9-16:1 1.48 1.46 1.6 1.73 0.114 0.32
c9-17:1 1.22 1.24 1.05 1.09 0.124 0.61
c9-18:1 29.67b 29.73b 29.55b 32.94a 0.914 0.03
c11-18:1 1.15a 0.99ab 0.95b 0.90b 0.050 0.01
c12-18:1 0.34 0.42 0.45 0.4 0.061 0.62
c13-18:1 0.11 0.11 0.11 0.11 0.008 0.90
c14-18:1 0.04 0.05 0.04 0.05 0.004 0.57
t6, t8-18:1 0.55 0.72 0.72 0.57 0.070 0.19
t9-18:1 0.52 0.66 0.66 0.55 0.055 0.16
t10-18:1 8.96a 8.91a 9.01a 6.15b 0.829 0.05
t11-18:1 1.94 1.04 1.20 1.23 0.368 0.33
t12-18:1 0.26 0.29 0.28 0.32 0.039 0.75
t13, t14-18:1 0.41 0.42 0.42 0.45 0.059 0.98
t15-18:1 0.13 0.09 0.11 0.14 0.015 0.07
t16-18:1 0.06b 0.07b 0.06b 0.10a 0.011 0.05
t11-20:1 0.21 0.20 0.20 0.17 0.009 0.07
Total MUFA 47.44 46.79 46.81 47.31 0.671 0.87
Conjugated linoleic acid (CLA) c9, t11-CLA 0.39ab 0.35b 0.41ab 0.50a 0.035 0.04
t7,c9-CLA 0.19 0.22 0.22 0.19 0.017 0.42
t8, c10-CLA 0.02 0.02 0.02 0.02 0.001 0.79
t9, c11-CLA 0.12 0.10 0.10 0.09 0.013 0.27
t10, c12-CLA 0.12ab 0.13a 0.13a 0.09b 0.012 0.03
t11, c13-CLA 0.01 0.01 0.01 0.01 0.001 0.21
Total CLA 0.86 0.84 0.90 0.90 0.048 0.76
Poly-unsaturated FA (PUFA) 18:2 n-6 6.57 6.29 6.60 5.47 0.351 0.10
20:2 n-6 0.07 0.06 0.06 0.05 0.004 0.17
20:3 n-6 0.05 0.04 0.04 0.04 0.003 0.16
20:4 n-6 0.17 0.15 0.18 0.15 0.010 0.09
22:4 n-6 0.05 0.05 0.04 0.04 0.005 0.39
18:3 n-3 0.49 0.49 0.54 0.59 0.048 0.37
20:5 n-3 0.02 0.02 0.01 0.01 0.003 0.29
22:5 n-3 0.11 0.10 0.11 0.11 0.010 0.80
22.6 n-3 0.02 0.02 0.03 0.02 0.004 0.26
Total PUFA 7.53 7.22 7.62 6.47 0.370 0.13
PUFA/SFA 0.19 0.18 0.19 0.16 0.012 0.16
n-6 / n-3 10.88 10.65 10.25 8.70 0.807 0.23 zFatty acids are expressed as a percentage of total fatty acid methyl esters, c, cis; t, trans; ai,
anteiso.
53
2.4. Discussion
Similar to our findings, previous research feeding sheep 22.9% CDDGS in
place of a mixture of soybean meal and corn (Huls et al. 2006) and 40% CDDGS
in place of dry rolled corn (Lodge et al. 1997) found no effect of CDDGS on FE.
The less efficient gains for lambs fed WDDGS compared to those fed the control
diet differs from previous studies in which feed efficiencies were unaffected when
finishing cattle were fed up to 23% WDDGS (Beliveau and McKinnon 2008) or
were improved when backgrounding steers were fed 25% WDDGS (McKinnon
and Walker 2008). McKeown et al. (2009) reported that feed efficiencies were not
affected when lambs were fed increasing amounts of TDDGS up to 60% of diet
DM.
Poorer FE of lambs fed WDDGS compared to those fed CDDGS may
have been attributable in part to the higher EE content of the CDDGS diet. In a
more detailed study, Ham et al. (1994) found greater energy availability for
growth in diets containing distillers‘ co-products with higher fat content compared
with dry-rolled corn. Previous in vitro work in which ground grass hay substrate
was amended with up to 10% corn oil determined that propionate concentration
was increased, with no change in acetate concentration, which led to a decrease in
the acetate to propionate ratio (Jenkins 1987). The corn oil present in CDDGS
may be one explanation for the increased propionate production from the
fermentation of CDDGS.

54
The efficiencies of converting hexose to acetate, propionate and butyrate
are 62%, 109% and 78%, respectively, due to carbon losses as CO2 in the
production of acetate and butyrate (Chalupa, 1977). This is further supported by
the lower total gas production from the CDDGS diet compared to other dietary
treatments. Factors other than EE content could also be involved in improving FE,
however, given that feed conversion ratios of lambs fed the control diet were
similar to those fed the CDDGS diet, even though the EE content was lowest for
the control diet.
Although Jenkins (1987) observed depressed fibre digestibility in response
to corn oil supplementation, IVDMD in the present study was not reduced for the
CDDGS diet, nor was total VFA production, indicating that the greater fat content
of the CDDGS diet did not negatively affect microbial fermentation. However, the
lower acetate:propionate ratio associated with the CDDGS diet compared to the
control and the WDDGS diets may indicate that fibre digestion was reduced
(Getachew et al. 2004).
Greater ammonia concentration for the WDDGS treatment compared to
the CDDGS treatment indicated that protein degradability may differ among diets,
which possibly led to the inefficient gains for lambs fed the WDDGS diet
compared to those fed the CDDGS diet. There is a large variation among ethanol
plants as to the amount of TS, commonly referred to as solubles (Rust et al. 1990),
that are added back to the distillers‘ grains (Spiehs et al. 2002). The CP in wheat
TS is rapidly degraded (Iwanchysko et al. 1999) and rapid degradation of protein
55
leads to an increase in ammonia production (McDonald 1948). Increased
ammonia concentration may result in nitrogen being utilized less efficiently for
bacterial protein production, thus reducing the amount of metabolizable protein
available to the animal (McDonald 1952). In addition, animals require additional
energy to detoxify absorbed ammonia via urea synthesis (McBride and Kelly
1990). Lower IVDMD for the WDDGS diet would have also contributed to lower
feed efficiencies.
2.4.1. Carcass Traits
Our findings that feeding CDDGS, WDDGS or TDDGS did not affect
carcass traits, with the exception of the front shank, are in agreement with results
found by Beliveau and McKinnon (2008) who fed finishing cattle up to 23%
WDDGS and Ham et al. (1994) who fed 40% CDDGS to finishing cattle.
Similarly, McKeown et al. (2009) reported hot carcass weight and SMY were not
affected by inclusion of up to 60% of TDDGS in lamb diets. No differences in hot
carcass weights among the diets are consistent with no treatment effect on ADG.
Although front shanks were heavier for lambs fed the control and CDDGS diets,
the difference was not enough to affect overall SMY.
2.4.2. Fatty Acid Composition
Overall, the diets fed in the present experiment led to relatively high levels
of trans 10-18:1. This trans isomer has been linked to an increased risk for
coronary heart disease in humans (Hodgson et al. 1996). The high levels of trans
10-18:1 likely relate to a lack of dietary forage (Palmquist et al. 2004) which

56
created a rumen environment unsuitable for growth of the bacteria that
biohydrogenate PUFA using the trans 11-18:1 pathway (Klieve et al. 2003).
Feeding TDDGS produced some improvement in the trans-18:1 composition,
however, with lambs fed TDDGS fed lambs yielding lower tail fat trans 10-18:1
concentrations (P = 0.05) than did those fed any of the other three diets.
Moreover, the concentration of cis 9, trans 11-CLA, the fatty acid associated with
anti-carcinogenic properties (Ha et al. 1990), was slightly increased by feeding
TDDGS, although there was no difference in the amount of its precursor, trans
11-18:1.
Our results from feeding WDDGS contrast those from an earlier study in
which feeding up to 60% WDDGS to finishing cattle decreased the concentration
of trans 10-18:1 and increased the concentration of cis 9, trans 11-CLA (Dugan et
al. 2008). In the present study, however, feeding TDDGS did produce these
results. These results suggest that adding higher levels of TDDGS to lamb diets
may have a positive impact on the fatty acid profile of carcass fat. However, the
PUFA/SFA ratios in lamb carcass fat were not affected by diet and were similar to
the PUFA/SFA ratios reported by Enser et al. (1996), which are below 0.7. A ratio
greater than 0.7 is recommended by health advisors to reduce the risk of heart
disease or cancer (Raes et al. 2004; Wood et al. 2003). The n-6/n-3 fatty acid ratio
was also not affected by diet, but was more than twice that of the ratio (4.0 or
less) recommended to reduce the onset of coronary heart disease and stroke
(Connor 2000; Wood et al. 2003).

57
Proportions of total SFA, MUFA and PUFA are within 5% of those found
by Webb and Casey (1995) in wethers. Elevation of PUFA in adipose tissue can
alter the shelf life and flavor of the meat (Wood et al. 2003). As there were no
differences in the concentration of PUFA, they would not be expected to alter the
shelf life or flavor of the meat harvested from lambs in this study. Shand et al.
(1998) and Jenschke et al. (2007) fed 13.4% wet wheat distillers‘ grain or up to
50% wet corn distillers‘ grains in the diet of beef cattle, respectively, and did not
find diet effects on tenderness, juiciness, or flavor of the meat. The higher
concentration of 17:0 in subcutaneous tissue for lambs fed CDDGS is also
indicative of a higher energy feed diet (Casey and Webb 1995).
2.5. Conclusion
This study indicates that feeding up to 20% of CDDGS, WDDGS or
TDDGS in place of a mixture of barley grain and canola meal does not adversely
affect DMI, ADG, or carcass traits of lambs. Feeding WDDGS to lambs may
decrease feed conversion ratio (feed:gain), and feeding TDDGS may improve the
fatty acid profile of the meat possibly increasing the human health properties of
lamb.
58
2.6. Literature Cited
Aldai, N., Dugan, M. E. R., Kramer, J. K. G., Mir, P. S. and McAllister, T. A.
2008. Nonionophore antibiotics do not affect the trans-18:1 and conjugated
linoleic acid composition in beef adipose tissue. J. Anim. Sci. 86: 3522-3532.
Al-Suwaiegh, S., Fanning, K. C., Grant, R. J., Milton, C. T. and Klopfenstein,
T. J. 2002. Utilization of distillers grains from the fermentation of sorghum or
corn in diets for finishing beef and lactating dairy cattle. J. Anim. Sci. 80: 1105-
1111.
Association of Official Analytical Chemists. 1990. Official methods of analysis.
15th
ed. AOAC, Arlington, VA.
Association of Official Analytical Chemists. 1995. Official methods of analysis.
16th
ed. AOAC, Gaithersburg, MD.
Beliveau, R. M. and McKinnon, J. J. 2008. Effect of graded levels of wheat-
based dried distillers‘ grains with solubles on performance and carcass
characteristics of feedlot steers. Can. J. Anim. Sci. 88: 677-684.
Boila, R. J. and Ingalls, J. R. 1994. The ruminal degradation of dry matter,
nitrogen and amino acids in wheat-based distillers‘ dried grains in sacco. Anim.
Feed Sci. and Technol. 48: 57-72.
Canadian Council of Animal Care. 1993. Guide to the care and use of
experimental animals. Vol. 1. 2nd
ed. E. D. Olfert, B. M. Cross, and A. A.
McWilliam, eds. CCAC, Ottawa, ON.
Casey, N. H. and Webb, E. C. 1995. Influence of dietary energy levels and form
of diet on composition of fatty acids in subcutaneous adipose tissue of wethers.
Small Ruminant Research 18: 125-132.
Chalupa, W. 1977. Manipulating rumen fermentation. J. Anim. Sci. 46: 585-599.
Chaves, A. V., Stanford, K., Dugan, M. E. R., Gibson, L. L., McAllister, T.
A., Van Herk, F. and Benchaar, C. 2008. Effects of cinnamaldehyde, garlic and
juniper berry essential oils on rumen fermentation, blood metabolites, growth
performance, and carcass characteristics of growing lambs. Livestock Science
117: 215-224.
Connor, W. E. 2000. Importance of n-3 fatty acids in health and disease. Am. J.
Clin. Nutr. 71S: 171S-175S.

59
Cruz-Hernandez, C., Deng, Z., Zhou, J., Hill, A. R., Yurawecz, M. P.,
Delmonte, P., Mossoba, M. M., Dugan, M. E. R. and Kramer, J. K. G. 2004.
Methods to analyze conjugated linoleic acids (CLA) and trans 18:1 isomers in
dairy fats using a combination of GC, silver ion TLC-GC, and silver ion HPLC. J.
AOAC Int. 87: 545–560.
Dugan, M. E. R., Kramer, J. K. G., Robertson, W. M., Meadus, W. J., Aldai,
N. and Rolland, D. C. 2007. Comparing subcutaneous adipose tissue in beef and
muskox with emphasis on trans 18:1 and conjugated linoleic acids. Lipids 42:
509–518.
Dugan, M. E. R., Aldai, N., Gibb, D. J., McAllister, T. A., Rolland, D. C. and
Kramer, J. K. G. 2008. Substituting dried distillers‘ grains from wheat for rolled
barley in finisher diets improves the trans-18:1 composition in beef fat. In
Proceedings 54th
International Congress of Meat Science and Technology
(Session 2B: Human Nutrition Challenges), 10-15 August 2008, Cape Town,
South Africa.
Enser, M., Hallett, K., Hewitt, B., Fursey, G. A. J. and Wood, J. D. 1996.
Fatty acid content and composition of English beef, lamb and pork at retail. Meat
Sci. 42: 443–456.
Fedorak, P. M. and Hrudey, S. E. 1983. A simple apparatus for measuring gas
production by methanogenic cultures in serum bottles. Environ. Technol. Lett. 4:
425-432.
Getachew, G., Robinson, P. H., DePeters, E. J. and Taylor, S. J. 2004.
Relationships between chemical composition, dry matter degradation and in vitro
gas production of several ruminant feeds. Anim. Feed Sci. and Technol. 111: 57-
71.
Gibb, D. J., Hao, X. and McAllister, T. A. 2008. Effect of dried distillers‘ grains
from wheat on diet digestibility and performance of feedlot cattle. J. Anim. Sci.
88: 659-665.
Ha, Y. L., Storkson, J. and Pariza, M. W. 1990. Inhibition of benzo(a)pyrene-
induced mouse forestomach neoplasia by conjugated dienoic derivatives of
linoleic acid. Cancer Res. 50: 1097-1101.
Ham, G. A., Stock, R. A., Klopfenstein, T. J., Larson, E. M., Shain, D. H. and
Huffman, R. P. 1994. Wet corn distillers byproducts compared with dried corn
distillers grains with solubles as a source of protein and energy for ruminants. J.
Anim. Sci. 72: 3246-3257.

60
He, M. L., Wang, Y., You, J. S., Mir, P. S. and McAllister, T. A. 2009. Effect
of a seaweed extract on fatty acid accumulation and glycerol-3-phosphate
dehydrogenase activity in 3T3-L1 adipocytes. Lipids 44: 125-132.
Hodgson, J. M., Wahlqvist, M. L., Boxall, J. A. and Balazs, N. D. 1996.
Platelet trans fatty acids in relation to angiographically assessed coronary artery
disease. Atherosclerosis 120: 147–154.
Huls, T. J., Bartosh, A. J., Daniel, J. A., Zelinsky, R. D., Held, J. and Wertz-
Lutz, A. E. 2006. Efficacy of dried distiller‘s grains with solubles as a
replacement for soybean meal and a portion of the corn in a finishing lamb diet.
Sheep and Goat Research Journal 21: 30-34.
Iwanchysko, P., McKinnon, J. J., Mustafa, A. F., Christensen, D. A. and
McCartney, D. 1999. Feeding value of wheat-based thin stillage: in vitro protein
degradability and effects on ruminal fermentation. J. Anim. Sci. 77: 2817-2823.
Jenkins, T. C. 1987. Effect of fats and fatty acid combinations on ruminal
fermentation in semi-continuous in vitro cultures. J. Anim. Sci. 64: 1526-1532.
Jenschke, B. E., James, J. M., Vander Pol, K. J., Klopfenstein, T. J. and
Calkins, C. R. 2007. Wet distillers grains plus solubles do not increase liver-like
off-flavors in cooked beef from yearling steers. J. Muscle Foods 18: 341-348.
Klieve, A. V., Hennessy, D., Ouwerkerk, D., Forster, R. J., Mackie, R. I. and
Attwood, G. T. 2003. Establishing populations of Megasphaera elsdenii YE 34
and Butyrivibrio fibrisolvens YE 44 in the rumen of cattle fed high grain diets. J
Appl. Microbiol. 95: 621-630.
Kramer, J. K. G., Fellner V., Dugan, M. E. R., Sauer, F. D., Mossoba, M. M.
and Yurawecz, M. P. 1997. Evaluating acid and base catalyst in the methylation
of milk and rumen fatty acids with special emphasis on conjugated dienes and
total trans fatty acids. Lipids 32: 1219-1228.
Kramer, J. K. G., Hernandez, M., Cruz-Hernandez, C., Kraft, J. and Dugan,
M. E. R. 2008. Combining results of two GC separations partly achieves
determination of all cis and trans 16:1, 18:1, 18:2, 18:3 and CLA isomers of milk
fat as demonstrated using Ag-ion SPE fractionation. Lipids 43: 259–273.
Larson, E. M., Stock, R. A., Klopfenstein, T. J., Sindt, M. H. and Huffman,
R. P. 1993. Feeding value of wet distillers byproducts for finishing ruminants. J.
Anim. Sci. 71: 2228-2236.

61
Lodge, S. L., Stock, R. A., Klopfenstein, T. J., Shain, D. H. and Herold, D. W.
1997. Evaluation of wet distillers composite for finishing ruminants. J. Anim. Sci.
75: 44–50.
McBride, B. W. and Kelly, J. M. 1990. Energy cost of absorption and
metabolism in the ruminant gastrointestinal tract and liver: A review. J. Anim.
Sci. 68: 2997-3010.
McDonald, I. W. 1948. The absorption of ammonia from the rumen of the sheep.
Biochem. J. 42: 584-587.
McDonald, I. W. 1952. The role of ammonia in ruminal digestion of protein.
Biochem. J. 51: 86-90.
McKeown, L. E., Chaves, A. V., Oba, M., Dugan, M. E. R., Okine, E. and
McAllister, T. A. 2009. Effects of replacing barley grain with triticale-based
dried distillers grains with solubles on nutrient digestibility, lamb growth
performance and carcass traits. Can. J. Anim. Sci. Submitted.
McKinnon, J. J. and Walker, A. M. 2008. Comparison of wheat-based dried
distillers‘ grain with solubles to barley as an energy source for backgrounding
cattle. Can. J. Anim. Sci. 88: 721-724.
Menke, K. H., Raab, A., Salewski, A., Steingass, D., Fritz, D. and Schneider,
W. 1979. The estimation of the digestibility and metabolizable energy content of
ruminant feedingstuffs from the gas production when they are incubated with
rumen liquor in vitro. J. Agric. Sci. (Camb.) 93: 217-222.
Mustafa, A. F., McKinnon, J. J., Ingledew, M. W. and Christensen, D. A.
2000. The nutritive value for ruminants of thin stillage and distillers‘ grains
derived from wheat, rye, triticale and barley. J. Sci. Food Agric. 80: 607–613.
National Research Council. 2007. Nutrient requirements of small ruminants. 7th
ed. National Academy of Science, Washington, DC.
Palmquist, D. L., St-Pierre, N. and McClure, K. E. 2004. Tissue fatty acid
profiles can be used to quantify endogenous rumenic acid synthesis in lambs. J.
Nutr. 134: 2407-2414.
Raes, K., De Smet, S. and Demeyer, D. 2004. Effects of dietary fatty acids on
incorporation of long chain polyunsaturated fatty acids and conjugated linoleic
acid in lamb, beef and pork: a review. Anim. Feed Sci. Technol. 113: 199–221.

62
Rust, S. R., Newbold, J. R. and Metz, K. W. 1990. Evaluation of condensed
distillers‘ solubles as an energy source for finishing cattle. J. Anim. Sci. 68: 186-
192.
SAS Institute, Inc. 2009. SAS Online DOC® 9.1.3. SAS Institute, Inc., Cary,
NC.
Shand, P. J., McKinnon, J. J. and Christensen, D. A. 1998. Eating quality of
beef from animals fed wet brewers‘ grains and wheat-based distillers‘ grains. Can.
J. Anim. Sci. 78: 143-146.
Spiehs, M. J., Whitney, M. H. and Shurson, G. C. 2002. Nutrient database for
distiller‘s dried grains with solubles produced from new ethanol plants in
Minnesota and South Dakota. J. Anim. Sci. 80: 2639-2645.
Van Soest, P. J., Robertson, J. B. and Lewis, B. A. 1991. Methods for dietary
fiber, neutral detergent fiber, and non-starch polysaccharides in relation to animal
nutrition. J. Dairy Sci. 74: 3583–3597.
Wang, S., Thomas, K. C., Ingledew, W. M., Sosulski, K. and Sosulski, F. W.
1997. Rye and triticale as feedstock for fuel ethanol production. Cereal Chem. 74:
621-625.
Weatherburn, M. W. 1967. Phenol-hypochlorite reaction for determination of
ammonia. Anal. Chem. 39: 971-974.
Webb, E. C. and Casey, N. H. 1995. Genetic differences in fatty acid
composition of subcutaneous adipose tissue in Dorper and SA Mutton Merino
wethers at different live weights. Small Ruminant Research 18: 81-88.
Wood, J. D., Richardson, R. I., Nute, G. R., Fisher, A. V., Campo, M. M.,
Kasapidou, E., Sheard, P. R. and Enser, M. 2003. Effects of fatty acids on meat
quality: a review. Meat Sci. 66: 21–32.

63
3.0. EFFECTS OF REPLACING BARLEY GRAIN WITH TRITICALE-
BASED DRIED DISTILLERS’ GRAINS PLUS SOLUBLES ON
NUTRIENT DIGESTIBILITY, LAMB GROWTH PERFORMANCE AND
CARCASS TRAITS2
3.1. Introduction
Distillers‘ grains are a co-product of ethanol production, and the use of
DDGS in livestock feed is increasing as the ethanol industry expands. In eastern
Canada and the United States, corn is utilized extensively for ethanol production
(Beliveau and McKinnon 2008). However, in western Canada, the cooler climate
is unfavorable for growing corn (Boila and Ingalls 1994) and consequently, wheat
plays a more prominent role in ethanol production (Lan et al. 2008). Triticale, a
cross between wheat and rye, is another potential substrate for ethanol production,
as its fermentation efficiencies are similar to those of wheat (Wang et al. 1999).
Compared to wheat, triticale has many desirable properties as a potential
biorefinery crop, such as its ability to grow in water-deficient soils (Giunta and
Motzo 2004), lower susceptibility to Fusarium culmorum (Miedaner et al. 2001),
and high grain yield (Rosenberger et al. 2002).
Numerous feeding trials have been conducted with CDDGS and to a lesser
extent with WDDGS. Previous experiments have reported increased FE when
beef cattle were fed finishing diets with CDDGS included at up to 40% in place of
dry rolled corn (Larson et al. 1993; Ham et al. 1994; Al-Suwaiegh et al. 2002).
2 A version of this chapter has been accepted for publication. McKeown, L. E., Chaves, A. V.,
Oba, M., Dugan, M. E. R., Okine, E. and McAllister, T. A. 2009. Can. J. Anim. Sci.
64
Feed efficiency has generally remained the same or been improved when the
proportion of WDDGS is less than 50% DM in growing (McKinnon and Walker
2008) or finishing (Beliveau and McKinnon 2008) diets for beef cattle, but it may
decline when DDGS is included at 60% DM or higher (Gibb et al. 2008). In
general, distillers‘ grains are used as a protein source when included at 6 to 15%
of diet DM and as an energy source when included above 15% diet DM
(Klopfenstein 2001). However, distillers‘ grains are high in both protein and
phosphorus, thus these nutrients are supplied in excess when DDGS are included
as an energy source in the diet (Klopfenstein et al. 2008). Given the higher
concentrations of nitrogen and phosphorus in distillers‘ grains compared with
more traditional feed ingredients, concerns over including them in significant
quantities in diets for cattle, also arise with regard to the potential negative effects
of these excess nutrients on the environment and the consequent increase in
manure disposal costs (Rausch and Belyea 2006).
Currently, very little research has been conducted with TDDGS. Mustafa
et al. (2000) found that in vitro and in situ degradabilities of TDDGS were
comparable to those of WDDGS, but there is no information on the effects of
feeding TDDGS on growth performance of ruminants. The objective of this study
was to determine the effects of replacing barley grain with TDDGS at 0, 20, 40 or
60% of dietary DM on feed intake, growth, nutrient digestibility and carcass traits
of growing lambs.

65
3.2. Materials and Methods
This experiment was conducted between November 2007 and March 2008
at the Lethbridge Research Centre (Lethbridge, AB, Canada). All animals were
cared for in accordance with the guidelines of the Canadian Council on Animal
Care (1993).
3.2.1. Dietary Treatments
One lot of TDDGS was purchased from Alberta Distillers Limited
(Calgary, AB) and used in both experiments (Table 3.1.). The control diet
Table 3.1. Chemical composition of triticale-based
dried distillers’ grains plus solubles
Item % (DM basis)
(n = 2)
Dry matter 89.3
Neutral detergent fibrez 29.6
Acid detergent fibre 13.7
Crude protein 30.7
Ether extract 5.4
Ash 4.4
Organic matter 95.6
Minerals
Calcium 0.07
Phosphorus 0.78
Sodium 0.01
Potassium 0.99
Sulfur 0.32
Magnesium 0.33 zValue not corrected for N.
consisted of (DM basis) 72.5% barley grain, 10% beet pulp, 9.0% sunflower hulls,
3.0% alfalfa meal, 2.5% molasses, 1.2% calcium carbonate, 0.03% mineral
vitamin pre-mix, 1.4% salt, and 0.4% feed pellet binder (Table 3.2.). Treatment

66
Table 3.2. Ingredients and chemical composition of the diets containing increasing amounts of
triticale-based dried distillers’ grains plus solubles (TDDGS)
Diet
Item Control 20% TDDGS 40% TDDGS 60% TDDGS
Ingredient (%, DM)
Barley grain, milled 72.5 52.2 31.9 11.3
TDDGS 0.0 20.0 40.0 60.0
Beet pulp 10.0 10.0 10.0 10.0
Sunflower hulls 9.0 9.0 9.0 9.0
Alfalfa meal 3.0 3.0 3.0 3.0
Molasses 2.5 2.5 2.5 2.5
Calcium carbonate 1.125 1.45 1.80 2.30
Sheep mineralz 1.35 1.35 1.35 1.35
Vitamin mixy 0.025 0.025 0.025 0.025
Feed pellet binder 0.4 0.4 0.4 0.4
Chemical composition
DM (%) 97.3 97.1 96.6 95.8
---------------------------------------------------------Expressed as % of DM----------------------------------------
NDF 22.2 26.5 27.7 30.6
ADF 11.8 14.3 15.5 17.7
CP 13.0 17.0 20.7 24.5
Starch 41.1 30.6 22.0 13.3
Ether extract 2.5 4.3 5.3 6.8
Ash 7.6 7.6 8.0 9.1
Calcium 0.9 0.9 0.9 1.1
Phosphorus 0.2 0.4 0.5 0.6
Sodium 0.8 0.7 0.6 0.7
Potassium 0.6 0.7 0.9 1.0
Sulfur 0.2 0.2 0.3 0.3
Magnesium 0.2 0.2 0.3 0.3
Fatty acids (% of total FAMEx)
14:0 0.41 0.23 0.12 0.09
15:0 0.09 0.06 0.04 0.04
16:0 24.1 18.1 14.4 13.6
16:1 c9 0.18 0.15 0.14 0.14
17:0 0.20 0.43 0.05 0.12
18:0 7.63 4.57 2.81 2.52
18:1 c9 30.4 26.8 23.4 23.5
18:1 c11 1.33 1.04 0.74 0.61
18:2 c9, c12 30.7 44.7 54.2 55.3
18:3 c9, c12, c15 1.30 1.99 2.82 2.90
20:0 0.64 0.43 0.31 0.29
20:1 t11 1.31 0.66 0.50 0.46
20:4 0.60 0.28 0.21 0.17
22:0 1.08 0.66 0.31 0.25
Saturated 34.2 24.4 18.0 16.9
Unsaturated 65.8 75.6 82.0 83.1
Mono-unsaturated 33.2 28.6 24.8 24.7
Poly-unsaturated 32.7 47.0 57.2 58.3 zContaining (g kg–1): NaCl (926); Dynamate® (49.7); ZnSO4 (9.0); MnSO4 (8.3); CuSO4 (1.3); ethylenediamine
dihydroiodide, 80% preparation (1.0); CoSO4 (0.05); canola oil (as carrier of CoSO4) (4.0); and Na2SeO3 (0.014;
provided as a 1% premix). yContaining vitamin A (10 000 000 IU kg–1), vitamin D (1 000 000 IU kg–1), and vitamin E (10 000 IU kg–1). xFAME: Fatty acid methyl esters.

67
diets included 20, 40 or 60% TDDGS, which was substituted on a DM basis for
barley grain (Table 3.2.). To maintain the Ca:P ratio at 2:1 or above, calcium
carbonate content was increased as dietary TDDGS content increased (from
1.13% in control diet to 2.30% in the 60% TDDGS diet). All diets were
completely pelleted. For analysis, feed samples from the growth trial were
collected daily and composited by month; those from the metabolic trial were
collected daily and composited for each 5-d collection period.
3.2.2. Growth Study
3.2.2.1. Animals and Experimental Design
Sixty Canadian Arcott lambs (26.6 ± 3.6 kg average body weight ± SD),
were weaned at 84 ± 3 days of age, stratified by body weight and randomly
assigned to one of the four treatment groups, with feeding of experimental diets
commencing at 14 wk of age. Lambs were housed in individual pens (0.97 m ×
2.82 m) bedded with straw, fed at 0900 h daily, and weighed weekly. All lambs
had ad libitum access to water and cobalt-iodized salt blocks throughout the study.
Feed deliveries were recorded daily, and orts were weighed weekly for
determination of weekly DMI. Daily dry matter intake of each lamb was
estimated by summing the weekly intake for each lamb over the experimental
period and dividing by the number of days on feed. Average daily gain of each
lamb over the experimental period was calculated by regression body weight
against time. Feed conversion was calculated as feed:gain.
68
3.2.2.2. Slaughter and Sample Collection
At a live weight of ≥ 50 kg, lambs were slaughtered at a commercial
abattoir (Sunterra Meats Ltd., Innisfail, AB). At slaughter, a fat sample (2-3 g)
from the base of the tail was collected from each lamb. The samples were kept on
ice and transported back to the lab where they were snap-frozen in liquid nitrogen
and stored at –80 ºC until analyzed for fatty acids. Hot and cold carcass weights
were determined. Saleable meat yield was estimated from proximal cuts including
short cut semi-boneless leg, sirloin, chine off rack, loin short cut, square shoulder
and front shank; with each cut trimmed to ≤0.64 cm subcutaneous fat as per
commercial standards (Chaves et al. 2008). Muscle scores were determined for
the shoulder, loin and hind leg on a scale of 1 to 5, with 1 being very poor and 5
being very good. Body wall thickness was estimated as grade rule measurement,
i.e., total tissue depth of the lamb carcass over the 12-13th
rib, 11 cm from the
carcass midline.
3.2.3. Metabolism Study
3.2.3.1 Animals and Experimental Design
Twelve Canadian Arcott ram lambs (196 ± 4 days of age; initial BW 49.7
± 2.0 kg) were used in a metabolism study designed as a replicated 4 × 4 Latin
Square (n = 3). The same four diets used in the growth experiment were fed in
four periods, each comprising 21 d. For the first 14 d of each period, the lambs
were housed in individual pens (0.97 m × 2.82 m) and provided with free access
to feed and water. Feed was delivered at 0900 h daily. For determination of daily

69
DMI, orts were collected and weighed each day prior to feeding. Immediately
prior to feeding on d 15, the lambs were fitted with strap-on canvas fecal
collection bags and moved into individual metabolism crates. Feed offered in the
crates was restricted to 90% of the ad libitum intake determined over the
preceding 4 d, but lambs had free access to water. The lambs were allowed 2 d to
adapt to the metabolism crates before total fecal and urine collections (for 5 d)
commenced on d 17. On the morning of d 22, fecal bags were removed and lambs
were returned to the floor pens.
3.2.3.2. Sample Collection
Urine was filtered through wire mesh and collected into a plastic container
beneath each metabolism crate. Urine pH was maintained at ≤ 2 through daily
additions of 4 N sulfuric acid to each container. Total urine volume was recorded
daily, with acid volumes subtracted from daily totals. Each day, a 10% aliquot of
urine was filtered through one layer of cheesecloth, and added to 5-d composite
samples stored at –20°C for each lamb in each period.
The canvas fecal collection bags were lined with a pre-weighed plastic bag
which was changed daily at 0900 h. Feces collected each day were weighed,
mixed thoroughly by hand and duplicate subsamples representing 10% of daily
fecal production from each lamb were retained. Samples from each lamb were
combined over the 5-d period and stored at –20°C until analyzed. One of the
duplicates was used for wet analysis and the other for dry analysis.
70
3.2.4. Chemical Analyses
Analytical DM was determined by oven-drying at 135 ºC for 2 h followed
by hot weighing (AOAC, 1990; method 930.15) and organic matter was
determined by ashing at 550 ºC for 5 h. To determine CP (nitrogen × 6.25),
samples were ground using a ball grinder (Mixer Mill MM200, Retsch Inc.,
Newtown, PA). Nitrogen was quantified by flash combustion with gas
chromatography and thermal conductivity detection (Nitrogen Analyzer 1500
series, Carlo Erba Instruments, Milan, Italy). Ammonia concentration in urine
samples was analyzed by the phenol hypochlorite method (Weatherburn 1967).
Total phosphorus, calcium, sulfur, magnesium, sodium and potassium were
determined for dried feed and fecal samples using nitric acid digestion prior to
analysis with inductively coupled plasma mass spectrometry (Method 3050B;
EPA 1996). Water extractable phosphorus was determined by mixing the wet
equivalent of 1 g DM of feces with 200 mL of H2O, shaking for 1 h followed by
centrifugation (Kleinman et al. 2005) and analysis by inductively coupled plasma
mass spectrometry. Neutral detergent fibre was determined according to Van
Soest et al. (1991) with heat-stable α-amylase and sodium sulfite included. Acid
detergent fibre was determined according to the procedure of AOAC (1990,
method 973.18). Crude fat content was determined by extraction with ether
(method 920.39; AOAC, 1990) using a Goldfisch Fat Extractor (Laconco
Corporation, Kansas City, MO).
From each treatment group, five of the tail fat samples collected at
slaughter were selected randomly and freeze-dried. Fatty acids were methylated
71
with sodium methoxide and the FAME were analyzed using gas liquid
chromatography and silver ion high performance liquid chromatography (Ag+-
HPLC) as outline by Cruz-Hernandez et al. (2004). However, two complementary
gas liquid chromatography temperature programs were used for trans-18:1
analysis (Dugan et al 2007; Kramer et al. 2008); for the identification of FAME
by gas liquid chromatography, reference standard 463 from Nu-Chek Prep Inc.
(Elysian, MN) was used. Branched-chain FAME were identified by using gas
liquid chromatography reference standard BC-Mix1 (Applied Science, State
College, PA). Reference standards were BC-Mix1 (Applied Science, State
College, PA) for branched-chain FAME, and UC-59M (Nu-Chek Prep Inc.,
Elysian, MN), for CLA. The trans-18:1 and CLA isomers not included in the
standard mixtures were identified by their retention times and elution orders as
reported previously (Dugan et al. 2007).
3.2.5. Statistical Analyses
3.2.5.1. Growth Study
Growth performance data, slaughter traits and fatty acid profiles were
analyzed as a completely randomized design using the Proc Mixed procedure of
SAS (SAS Inc., 2009 SAS OnlineDoc® 9.1.3. Cary, NC) with individual lamb as
the experimental unit. The model included the random effect of lamb and the
fixed effect of treatment and the residual error was used as the error term. One
lamb from the 40% TDDGS diet and one from the 60% TDDGS diet were
removed from the growth performance data due to the development of urinary
72
calculi. A second lamb from the 40% TDDGS treatment was removed from the
carcass trait data because it was condemned at slaughter for reasons unrelated to
treatment. Planned orthogonal contrasts were made to determine linear and
quadratic effects of feeding increasing amount of TDDGS in the diets of lambs.
Significance was declared at P ≤ 0.05 and a tendency was reported if 0.05 < P ≤
0.10.
3.2.5.2. Metabolism Study
Dry matter intake, digestibility data and nutrient excretion were analyzed
as a replicated 4 × 4 Latin Square design accounting for the effect of carryover,
using the MIXED model of SAS (SAS Inc., 2009 SAS OnlineDoc® 9.1.3. Cary,
NC). One lamb in period 3 (20% TDDGS) and two additional lambs (Control and
60% TDDGS) in period 4 exhibited symptoms of urinary calculi, and therefore
were excluded from all statistical analyses. Another lamb in period 3 (60%
TDDGS) was treated for urinary calculi using ammonium chloride, hence data
from this individual were excluded from all analysis related to nitrogen
metabolism. The model included the random effect of period and lamb nested
within square and the fixed effects of treatment and residuals from period 1, 2 and
3. Planned orthogonal contrasts were made to determine linear and quadratic
effects of feeding increasing amount of TDDGS in the diets of lambs.
Significance was declared at P ≤ 0.05 and a tendency was reported if 0.05 < P ≤
0.10.

73
3.3. Results
3.3.1. Growth Study
Dietary TDDGS level did not affect DMI, ADG or FE, which averaged
1.29 ± 0.04 kg d–1
, 0.29 ± 0.01 kg d-1
and 4.58 ± 0.19, respectively (Table 3.3.).
Table 3.3. Effect of increasing concentration of triticale-based dried distillers’ grains
plus solubles (TDDGS) in the diet on performance of lambs
Experimental diet (TDDGS content) P value
Control
(n = 15)
20%
(n = 15)
40%
(n = 14)
60%
(n = 14) SEM Linear Quadratic
Dry matter
intake (kg d–1
) 1.20 1.35 1.28 1.33 0.04 0.12 0.22
Average daily
gain (kg) 0.27 0.31 0.28 0.29 0.01 0.95 0.22
Feed
efficiency
(feed:gain) 4.48 4.41 4.61 4.81 0.19 0.14 0.48
No linear or quadratic effects on hot carcass weight (26.0 ± 0.4 kg; Table 3.4.)
were observed, but cold carcass weight and grade rule responded quadratically (P
= 0.04) to increasing levels of TDDGS. There were no effects of TDDGS on
carcass shrink, muscle scores of the leg, shoulder or loin, SMY, or on weights of
individual cuts of meat.
The proportion of cis 18:2 n-6 in subcutaneous tail fat increased linearly
(P = 0.04) with dietary TDDGS level (Table 3.5.). Similarly, trans 10, cis 12-
CLA also increased with TDDGS (linear; P = 0.02), from 0.06 to 0.11% of total
fatty acids. In contrast, no linear or quadratic TDDGS effects were observed for
proportions of cis9, trans11-CLA, trans11-18:1 or t10-18:1. Proportions of total
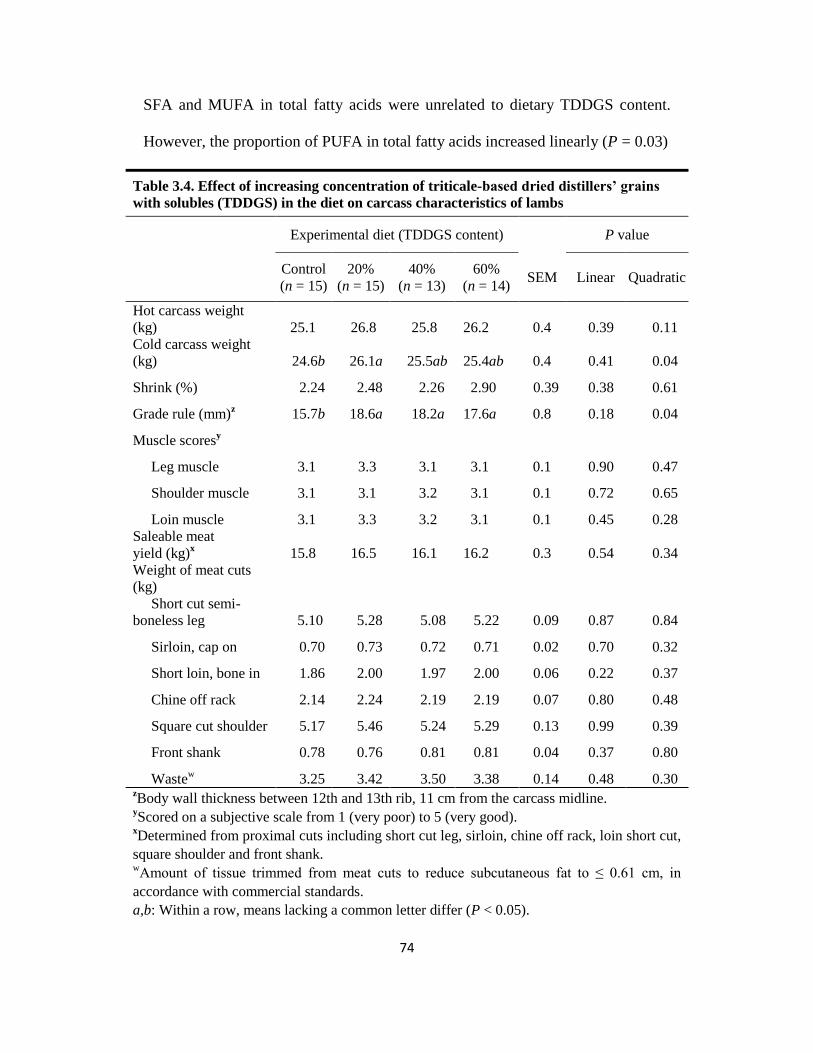
74
SFA and MUFA in total fatty acids were unrelated to dietary TDDGS content.
However, the proportion of PUFA in total fatty acids increased linearly (P = 0.03)
Table 3.4. Effect of increasing concentration of triticale-based dried distillers’ grains
with solubles (TDDGS) in the diet on carcass characteristics of lambs
Experimental diet (TDDGS content) P value
Control
(n = 15)
20%
(n = 15)
40%
(n = 13)
60%
(n = 14) SEM Linear Quadratic
Hot carcass weight
(kg) 25.1 26.8 25.8 26.2 0.4 0.39 0.11
Cold carcass weight
(kg) 24.6b 26.1a 25.5ab 25.4ab 0.4 0.41 0.04
Shrink (%) 2.24 2.48 2.26 2.90 0.39 0.38 0.61
Grade rule (mm)z 15.7b 18.6a 18.2a 17.6a 0.8 0.18 0.04
Muscle scoresy
Leg muscle 3.1 3.3 3.1 3.1 0.1 0.90 0.47
Shoulder muscle 3.1 3.1 3.2 3.1 0.1 0.72 0.65
Loin muscle 3.1 3.3 3.2 3.1 0.1 0.45 0.28
Saleable meat
yield (kg)x 15.8 16.5 16.1 16.2 0.3 0.54 0.34
Weight of meat cuts
(kg)
Short cut semi-
boneless leg
5.10 5.28 5.08 5.22 0.09 0.87 0.84
Sirloin, cap on 0.70 0.73 0.72 0.71 0.02 0.70 0.32
Short loin, bone in 1.86 2.00 1.97 2.00 0.06 0.22 0.37
Chine off rack 2.14 2.24 2.19 2.19 0.07 0.80 0.48
Square cut shoulder 5.17 5.46 5.24 5.29 0.13 0.99 0.39
Front shank 0.78 0.76 0.81 0.81 0.04 0.37 0.80
Wastew 3.25 3.42 3.50 3.38 0.14 0.48 0.30
zBody wall thickness between 12th and 13th rib, 11 cm from the carcass midline.
yScored on a subjective scale from 1 (very poor) to 5 (very good).
xDetermined from proximal cuts including short cut leg, sirloin, chine off rack, loin short cut,
square shoulder and front shank. wAmount of tissue trimmed from meat cuts to reduce subcutaneous fat to ≤ 0.61 cm, in
accordance with commercial standards.
a,b: Within a row, means lacking a common letter differ (P < 0.05).
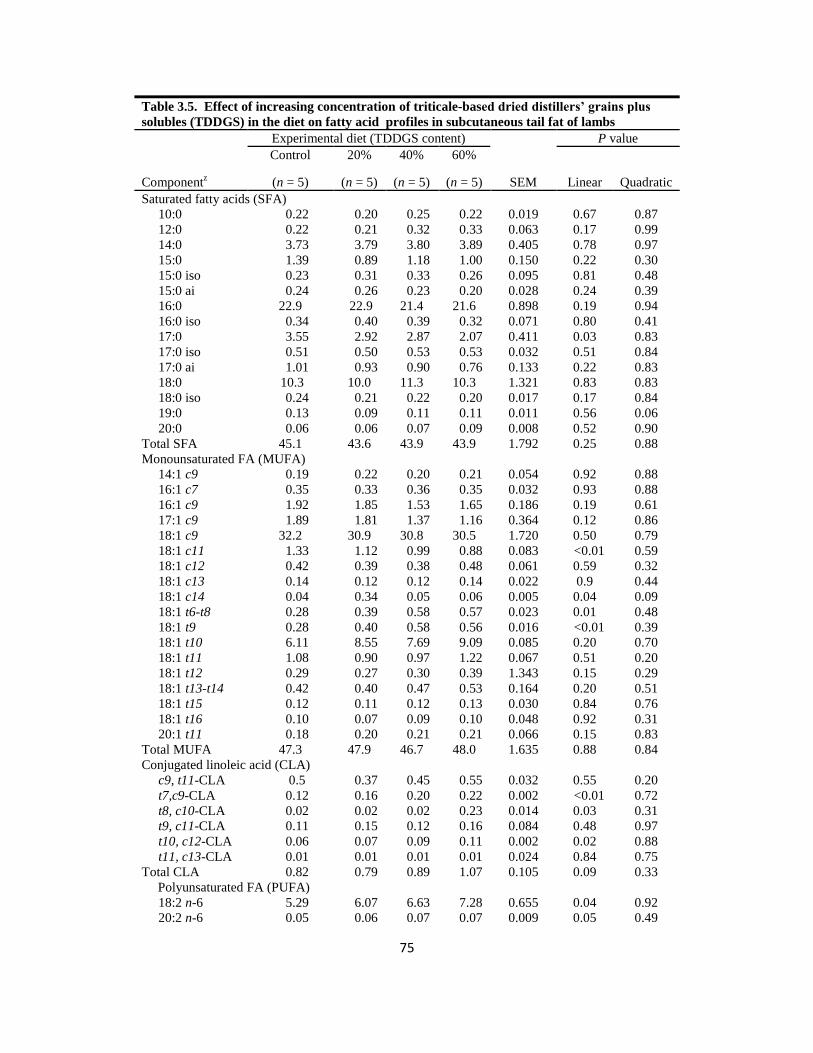
75
Table 3.5. Effect of increasing concentration of triticale-based dried distillers’ grains plus
solubles (TDDGS) in the diet on fatty acid profiles in subcutaneous tail fat of lambs
Experimental diet (TDDGS content)
P value
Componentz
Control 20% 40% 60%
SEM Linear Quadratic (n = 5) (n = 5) (n = 5) (n = 5)
Saturated fatty acids (SFA)
10:0 0.22 0.20 0.25 0.22 0.019 0.67 0.87
12:0 0.22 0.21 0.32 0.33 0.063 0.17 0.99
14:0 3.73 3.79 3.80 3.89 0.405 0.78 0.97
15:0 1.39 0.89 1.18 1.00 0.150 0.22 0.30
15:0 iso 0.23 0.31 0.33 0.26 0.095 0.81 0.48
15:0 ai 0.24 0.26 0.23 0.20 0.028 0.24 0.39
16:0 22.9 22.9 21.4 21.6 0.898 0.19 0.94
16:0 iso 0.34 0.40 0.39 0.32 0.071 0.80 0.41
17:0 3.55 2.92 2.87 2.07 0.411 0.03 0.83
17:0 iso 0.51 0.50 0.53 0.53 0.032 0.51 0.84
17:0 ai 1.01 0.93 0.90 0.76 0.133 0.22 0.83
18:0 10.3 10.0 11.3 10.3 1.321 0.83 0.83
18:0 iso 0.24 0.21 0.22 0.20 0.017 0.17 0.84
19:0 0.13 0.09 0.11 0.11 0.011 0.56 0.06
20:0 0.06 0.06 0.07 0.09 0.008 0.52 0.90
Total SFA 45.1 43.6 43.9 43.9 1.792 0.25 0.88
Monounsaturated FA (MUFA)
14:1 c9 0.19 0.22 0.20 0.21 0.054 0.92 0.88
16:1 c7 0.35 0.33 0.36 0.35 0.032 0.93 0.88
16:1 c9 1.92 1.85 1.53 1.65 0.186 0.19 0.61
17:1 c9 1.89 1.81 1.37 1.16 0.364 0.12 0.86
18:1 c9 32.2 30.9 30.8 30.5 1.720 0.50 0.79
18:1 c11 1.33 1.12 0.99 0.88 0.083 <0.01 0.59
18:1 c12 0.42 0.39 0.38 0.48 0.061 0.59 0.32
18:1 c13 0.14 0.12 0.12 0.14 0.022 0.9 0.44
18:1 c14 0.04 0.34 0.05 0.06 0.005 0.04 0.09
18:1 t6-t8 0.28 0.39 0.58 0.57 0.023 0.01 0.48
18:1 t9 0.28 0.40 0.58 0.56 0.016 <0.01 0.39
18:1 t10 6.11 8.55 7.69 9.09 0.085 0.20 0.70
18:1 t11 1.08 0.90 0.97 1.22 0.067 0.51 0.20
18:1 t12 0.29 0.27 0.30 0.39 1.343 0.15 0.29
18:1 t13-t14 0.42 0.40 0.47 0.53 0.164 0.20 0.51
18:1 t15 0.12 0.11 0.12 0.13 0.030 0.84 0.76
18:1 t16 0.10 0.07 0.09 0.10 0.048 0.92 0.31
20:1 t11 0.18 0.20 0.21 0.21 0.066 0.15 0.83
Total MUFA 47.3 47.9 46.7 48.0 1.635 0.88 0.84
Conjugated linoleic acid (CLA)
c9, t11-CLA 0.5 0.37 0.45 0.55 0.032 0.55 0.20
t7,c9-CLA 0.12 0.16 0.20 0.22 0.002 <0.01 0.72
t8, c10-CLA 0.02 0.02 0.02 0.23 0.014 0.03 0.31
t9, c11-CLA 0.11 0.15 0.12 0.16 0.084 0.48 0.97
t10, c12-CLA 0.06 0.07 0.09 0.11 0.002 0.02 0.88
t11, c13-CLA 0.01 0.01 0.01 0.01 0.024 0.84 0.75
Total CLA 0.82 0.79 0.89 1.07 0.105 0.09 0.33
Polyunsaturated FA (PUFA)
18:2 n-6 5.29 6.07 6.63 7.28 0.655 0.04 0.92
20:2 n-6 0.05 0.06 0.07 0.07 0.009 0.05 0.49
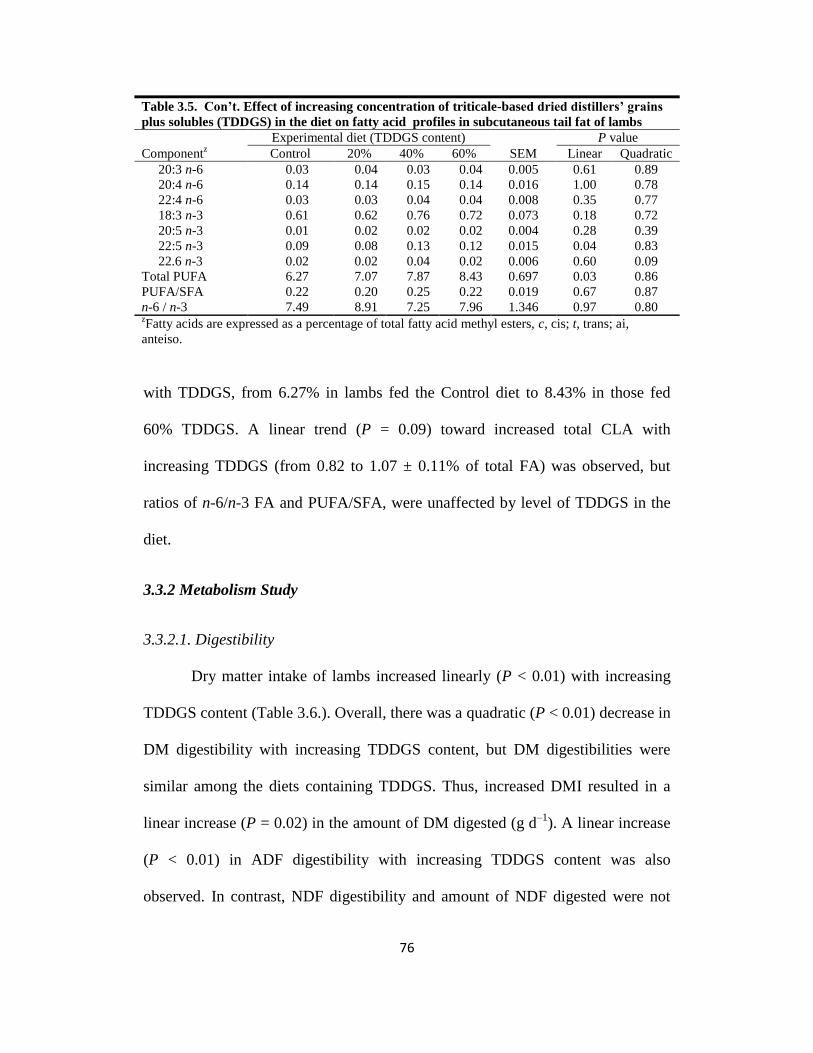
76
Table 3.5. Con’t. Effect of increasing concentration of triticale-based dried distillers’ grains
plus solubles (TDDGS) in the diet on fatty acid profiles in subcutaneous tail fat of lambs
Experimental diet (TDDGS content)
P value
Componentz Control 20% 40% 60% SEM Linear Quadratic
20:3 n-6 0.03 0.04 0.03 0.04 0.005 0.61 0.89
20:4 n-6 0.14 0.14 0.15 0.14 0.016 1.00 0.78
22:4 n-6 0.03 0.03 0.04 0.04 0.008 0.35 0.77
18:3 n-3 0.61 0.62 0.76 0.72 0.073 0.18 0.72
20:5 n-3 0.01 0.02 0.02 0.02 0.004 0.28 0.39
22:5 n-3 0.09 0.08 0.13 0.12 0.015 0.04 0.83
22.6 n-3 0.02 0.02 0.04 0.02 0.006 0.60 0.09
Total PUFA 6.27 7.07 7.87 8.43 0.697 0.03 0.86
PUFA/SFA 0.22 0.20 0.25 0.22 0.019 0.67 0.87
n-6 / n-3 7.49 8.91 7.25 7.96 1.346 0.97 0.80 zFatty acids are expressed as a percentage of total fatty acid methyl esters, c, cis; t, trans; ai,
anteiso.
with TDDGS, from 6.27% in lambs fed the Control diet to 8.43% in those fed
60% TDDGS. A linear trend (P = 0.09) toward increased total CLA with
increasing TDDGS (from 0.82 to 1.07 ± 0.11% of total FA) was observed, but
ratios of n-6/n-3 FA and PUFA/SFA, were unaffected by level of TDDGS in the
diet.
3.3.2 Metabolism Study
3.3.2.1. Digestibility
Dry matter intake of lambs increased linearly (P < 0.01) with increasing
TDDGS content (Table 3.6.). Overall, there was a quadratic (P < 0.01) decrease in
DM digestibility with increasing TDDGS content, but DM digestibilities were
similar among the diets containing TDDGS. Thus, increased DMI resulted in a
linear increase (P = 0.02) in the amount of DM digested (g d–1
). A linear increase
(P < 0.01) in ADF digestibility with increasing TDDGS content was also
observed. In contrast, NDF digestibility and amount of NDF digested were not
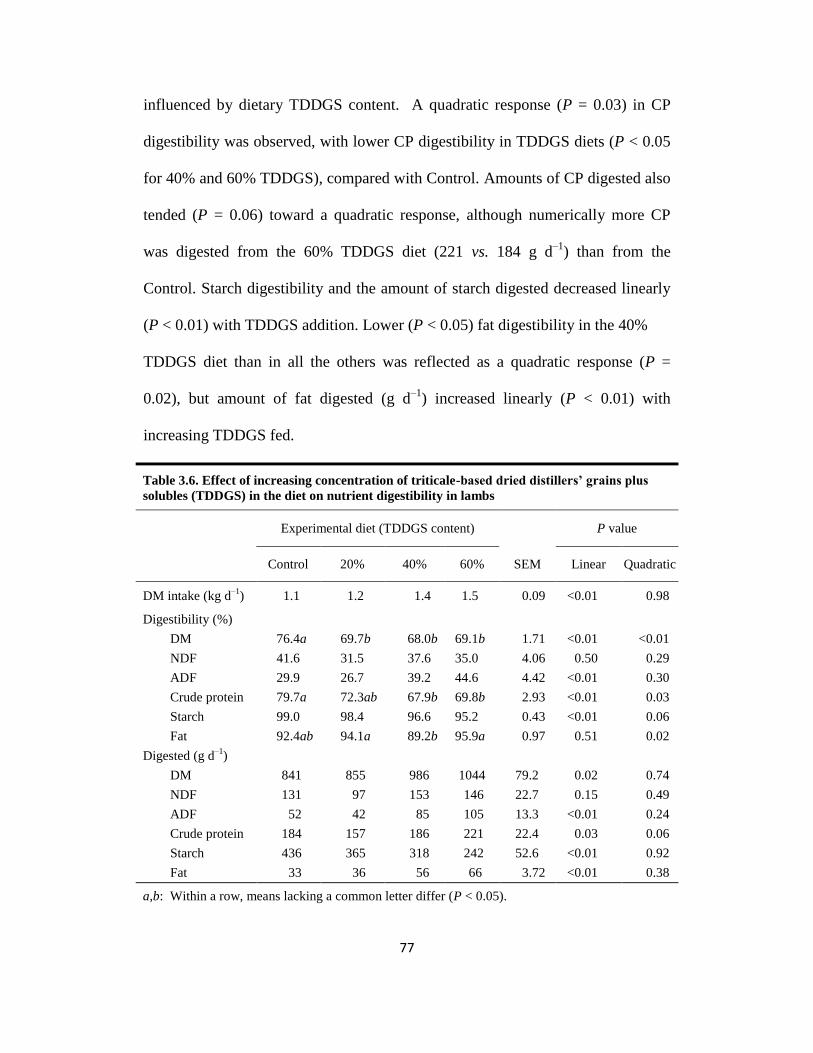
77
influenced by dietary TDDGS content. A quadratic response (P = 0.03) in CP
digestibility was observed, with lower CP digestibility in TDDGS diets (P < 0.05
for 40% and 60% TDDGS), compared with Control. Amounts of CP digested also
tended (P = 0.06) toward a quadratic response, although numerically more CP
was digested from the 60% TDDGS diet (221 vs. 184 g d–1
) than from the
Control. Starch digestibility and the amount of starch digested decreased linearly
(P < 0.01) with TDDGS addition. Lower (P < 0.05) fat digestibility in the 40%
TDDGS diet than in all the others was reflected as a quadratic response (P =
0.02), but amount of fat digested (g d–1
) increased linearly (P < 0.01) with
increasing TDDGS fed.
Table 3.6. Effect of increasing concentration of triticale-based dried distillers’ grains plus
solubles (TDDGS) in the diet on nutrient digestibility in lambs
Experimental diet (TDDGS content) P value
Control 20% 40% 60% SEM Linear Quadratic
DM intake (kg d–1
) 1.1 1.2 1.4 1.5 0.09 <0.01 0.98
Digestibility (%)
DM 76.4a 69.7b 68.0b 69.1b 1.71 <0.01 <0.01
NDF 41.6 31.5 37.6 35.0 4.06 0.50 0.29
ADF 29.9 26.7 39.2 44.6 4.42 <0.01 0.30
Crude protein 79.7a 72.3ab 67.9b 69.8b 2.93 <0.01 0.03
Starch 99.0 98.4 96.6 95.2 0.43 <0.01 0.06
Fat 92.4ab 94.1a 89.2b 95.9a 0.97 0.51 0.02
Digested (g d–1
)
DM 841 855 986 1044 79.2 0.02 0.74
NDF 131 97 153 146 22.7 0.15 0.49
ADF 52 42 85 105 13.3 <0.01 0.24
Crude protein 184 157 186 221 22.4 0.03 0.06
Starch 436 365 318 242 52.6 <0.01 0.92
Fat 33 36 56 66 3.72 <0.01 0.38
a,b: Within a row, means lacking a common letter differ (P < 0.05).
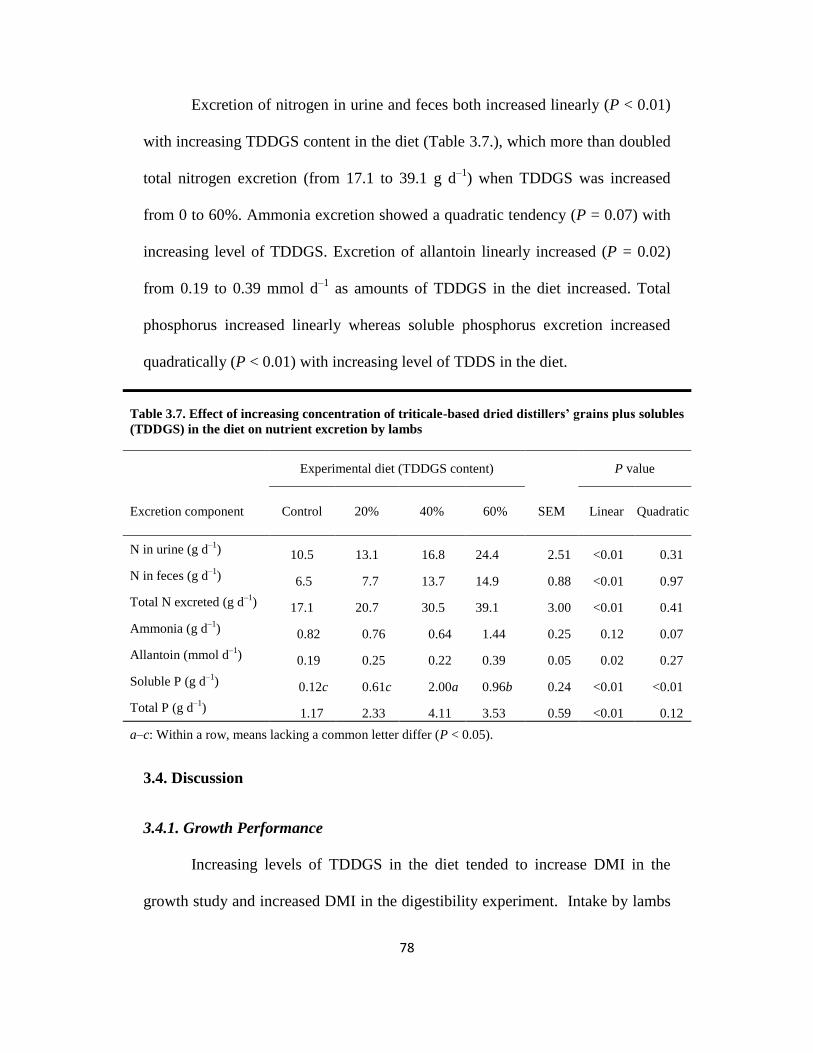
78
Excretion of nitrogen in urine and feces both increased linearly (P < 0.01)
with increasing TDDGS content in the diet (Table 3.7.), which more than doubled
total nitrogen excretion (from 17.1 to 39.1 g d–1
) when TDDGS was increased
from 0 to 60%. Ammonia excretion showed a quadratic tendency (P = 0.07) with
increasing level of TDDGS. Excretion of allantoin linearly increased (P = 0.02)
from 0.19 to 0.39 mmol d–1
as amounts of TDDGS in the diet increased. Total
phosphorus increased linearly whereas soluble phosphorus excretion increased
quadratically (P < 0.01) with increasing level of TDDS in the diet.
Table 3.7. Effect of increasing concentration of triticale-based dried distillers’ grains plus solubles
(TDDGS) in the diet on nutrient excretion by lambs
Experimental diet (TDDGS content) P value
Excretion component Control 20% 40% 60% SEM Linear Quadratic
N in urine (g d–1
) 10.5 13.1 16.8 24.4 2.51 <0.01 0.31
N in feces (g d–1
) 6.5 7.7 13.7 14.9 0.88 <0.01 0.97
Total N excreted (g d–1
) 17.1 20.7 30.5 39.1 3.00 <0.01 0.41
Ammonia (g d–1
) 0.82 0.76 0.64 1.44 0.25 0.12 0.07
Allantoin (mmol d–1
) 0.19 0.25 0.22 0.39 0.05 0.02 0.27
Soluble P (g d–1
) 0.12c 0.61c 2.00a 0.96b 0.24 <0.01 <0.01
Total P (g d–1
) 1.17 2.33 4.11 3.53 0.59 <0.01 0.12
a–c: Within a row, means lacking a common letter differ (P < 0.05).
3.4. Discussion
3.4.1. Growth Performance
Increasing levels of TDDGS in the diet tended to increase DMI in the
growth study and increased DMI in the digestibility experiment. Intake by lambs
79
fed 40% TDDGS in the present study was similar to that of lambs fed diets
containing 40% CDDGS substituted for dry-rolled corn (Lodge et al. 1997).
Others have found that dietary inclusion of CDDGS up to 40% DM (Buckner et
al. 2008) and WDDGS up to 60% DM (Gibb et al. 2008) did not alter DMI of
beef cattle. Although palatability of TDGGS did not appear to be a factor in the
present study, Schauer et al. (2005) proposed that palatability issues may reduce
the intake of CDDGS when it exceeds more than 20% of the diet. Palatability of
DDGS may be reduced when excessive heat is applied during the drying process,
resulting in DDGS of dark brown color due to the formation of Maillard products
(Cromwell et al. 1993). The TDDGS used in our study was a golden color and
exhibited no signs of heat damage.
The lack of effect of TDDGS on ADG by the lambs in this study was
consistent with other reports in which rates of gain by lambs (n = 15) fed 40%
CDDGS did not differ from lambs fed dry-rolled corn (Lodge et al. 1997), and in
which gain by lambs (n = 40) fed 22.9% CDDGS in place of the soybean meal
(10.2%) plus 13% of the corn in the control diet was unaffected by diet (Huls et
al. 2006). Average daily gain by lambs in these two trials was similar to ADG of
lambs in the current study. In contrast to findings with lambs, CDDGS has been
shown to increase ADG when fed to cattle. A trend toward a quadratic response
in ADG was observed by Buckner et al. (2008) when steers were fed CDDGS in
place of dry-rolled corn at 0, 10, 20, 30 or 40% of diet DM, with ADG highest at
20% CDDGS. Other researchers have reported that replacing dry-rolled corn with

80
CDDGS at 30% (Al-Suwaiegh et al. 2002) or 40% (Ham et al. 1994) of diet DM
increased ADG of finishing cattle.
The observation that dietary TDDGS did not affect FE in the present study
was consistent with earlier reports of studies in which CDDGS (Huls et al. 2006)
or CWDGS (Lodge et al. 1997) were fed to lambs, in which no effects on FE were
observed. Diets formulated by Huls et al. (2006), were balanced to be
isonitrogenous and isoenergetic with the control diet, thus comparable gain was
not unexpected.
As with observations of ADG, several studies have found that feeding
corn- or wheat-based distillers‘ grains to cattle improves FE, even though this is
not seen in lambs. Firkins et al. (1985) fed 132 steers diets containing 0, 25 or
50% CWDGS replacing a mixture of 4.2% soybean meal and high moisture corn,
and found FE improved by 1.2 and 9.9%, respectively. Similarly, Ham et al.
(1994) found that FE was improved by 8.7% when steers were fed 40% CDDGS
for 99 d compared to those fed only dry-rolled corn. However, cattle fed CDDGS
were 7.8% less efficient than steers fed CWDGS, which suggests that the feeding
value of DDGS is reduced by the drying process.
The higher oil content of CDDGS as compared to TDDGS and WDDGS
likely contributes to improved FE as oil contains about three times the energy of
corn grain. However, Al-Suwaiegh et al. (2002) found that lipid content of wet
corn distillers‘ grains accounted for only 4.7% of the 11.7% improvement in NEg
and suggested that yeast by-products in DDGS contained unidentified nutrients
that contributed to the improved performance. Mustafa et al. (2000) found that the

81
ether extract content of TDDGS was 2.2% higher than WDDGS. In the present
trial, the ether extract content of the TDDGS was similar to or only slightly lower
than other previously reported values for WDDGS (Beliveau and McKinnon
2008; McKinnon and Walker 2008). It appears that TDDGS can be used in diets
in place of barley grain at levels up to 60% with no adverse effects on growth
performance.
3.4.2. Carcass Traits
The quadratic response in cold carcass weight and grade rule
measurements associated with increasing levels of TDDGS is consistent with the
observations of Gibb et al. (2008) who reported a quadratic response in back fat
thickness in cattle fed WDDGS at 0, 20, 40 and 60%. A higher grade rule
measurement indicates a fatter carcass (Stanford et al. 1998), which is associated
with reduced shrink either as a consequence of reduced water content of fat
compared to muscle, or through the effectiveness of adipose tissue serving as a
moisture barrier (Smith and Carpenter 1973). Overall, there were no differences in
the weight of individual cuts of meat, indicating that TDDGS can be included in
lamb diets without adversely affecting SMY.
3.4.3. Protein Metabolism
As the amount of TDDGS in the diet increased, so did the amount of
protein supplied to the lambs and the amount of nitrogen excreted in urine and
feces. This was to such an extent that even though the digestibility of the protein
decreased with increasing TDDGS, the amount of protein digested increased. In
82
our study, urinary and fecal nitrogen excretion was lowest in lambs fed the control
diet and linearly increased in both fractions as more TDDGS was added to the
diet. Others have reported that addition of 23% CDDGS to lamb diets did not
alter urine or fecal nitrogen excretion as compared to a diet in which the majority
of protein in the diet was supplied by soybean meal (Waller et al. 1980).
However, unlike in our study, diets in this study were balanced to be
isonitrogenous (12%) and to not exceed the protein requirements of lambs. Our
objective was to examine the extent to which TDDGS could be used to replace
barley grain as an energy source in the diet. Consequently, at the highest level of
TDDGS the diet exceeded the protein requirements of the lambs by at least 8
percentage units, leading to a dramatic increase in nitrogen excretion.
Furthermore, allantoin excretion also linearly increased with TDDGS, suggesting
that heightened microbial protein synthesis may have also contributed to higher
levels of absorbed protein and nitrogen excretion. Allantoin is an end production
of the degradation of nucleotides that arise primarily from microbial cells (Pérez
et al. 1998). Undoubtedly, increased metabolizable energy would be required for
the liver to synthesize urea from the heightened levels of ammonia absorbed from
the intestinal tract due to the excessive levels of CP in the diet. However, in our
study, partitioning of this energy towards urea synthesis was not sufficiently high
to adversely affect the growth of lambs even when TDDGS comprised 60% of the
dietary DM. However, it is clear that the practice of including this high of level
of TDDGS in lamb diets will result in a considerable increase in the excretion of
nitrogen into the environment.
83
3.4.4. Fatty Acid Composition
The fatty acid trans 10-18:1 has been linked to increased coronary heart
disease in humans (Hodgson et al. 1996). In the present study, adding TDDGS to
the diets did not affect the concentration of trans 10-18:1 in subcutaneous fat of
lambs, nor did it affect the concentrations of cis 9, trans 11-CLA or its precursor,
trans 11-18:1, which has been associated with anti-carcinogenic properties (Ha et
al. 1990). These results are contrary to Dugan et al. (2008) who found that trans
10-18:1 decreased and cis 9, trans 11-CLA and t11-18:1 increased when cattle
were fed increasing levels of WDDGS up to 60% of diet DM. The level of trans
10-18:1 was, however, the most variable of the fatty acid among individual cattle
and the limited number of observations may have precluded the finding of a
significant increase with increasing WDDGS. In the present study, the level of
the immediate precursor to trans 10-18:1; trans 10, cis 12-CLA did linearly
increase with increasing TDDGS in the diet.
As TDDGS had more PUFA than barley grain, the PUFA content of the
diet also increased with increasing TDDGS, a factor that also likely accounted for
the higher level of PUFA in the subcutaneous fat of lambs fed TDDGS.
However, the PUFA/SFA ratios in lamb carcass fat were not affected by dietary
TDDGS in this study, but in each treatment group, the ratios were considerably
higher than the PUFA/SFA ratio reported for lamb adipose tissue by Enser et al.
(1996), possibly because these researchers examined a less complete fatty acid
profile. Even at the elevated level, however, the ratios are still below the > 0.7
ratio recommended by health advisors (Raes et al. 2004). The n-6/n-3 fatty acid

84
ratio was also unaffected by inclusion of TDDGS in the diet and was lower than
the recommended ratio of < 4 (Wood et al. 2003).
Elevation of PUFA in adipose tissue can alter the shelf life and flavor of
the meat (Wood et al. 2003). In the present study, however, increases in PUFA
were relatively modest, thus they would not be expected to have significantly
altered the shelf life or flavor of the meat harvested from these lambs. Shand et al.
(1998) found that including 13.4% WWDG in a diet for beef cattle did not affect
tenderness, juiciness or flavor of beef. Subjective retail display properties of
steaks over a 6-d period were also unaffected when cattle were fed 15% corn- or
sorghum-based distillers‘ grains in place of steam-flaked corn (Gill et al. 2008).
3.4.5. Occurrence of Urinary Calculi
Taking into account the high phosphorus content of the TDDGS, diets
were formulated to include sufficient calcium carbonate to maintain Ca:P ratios
above 2:1 in an effort to avoid urinary calculi (Vipperman et al. 1968). This
approach was obviously not fully successful, as there were six cases of urinary
calculi over the course of the growth and metabolism trials. Pelleting the diets to
reduce sorting of the ingredients may have contributed to the occurrence of
urinary calculi, in that pelleting can reduce mastication (Hay 1990; Huls et al.
2006) and saliva production and increase the amount of phosphorus excreted in
the urine, which may also increase the risk of urinary calculi (Khorasani et al.
1997). Increasing dietary allocation of TDDGS also increased the potassium
content of the diet, which can also reduce the solubility of phosphorus in the urine
(Vipperman et al. 1968). These factors plus observations of calculi in lambs
85
suggests that feeding excess amounts of TDDGS may increase the risk of urinary
calculi in lambs.
3.4.6. Phosphorus Excretion
The high concentration of phosphorus in distillers‘ grains results in
increased fecal excretion of this nutrient as dietary DDGS increases. Even at 20%
TDDGS, the diet in this study exceeded recommended dietary phosphorus
requirements for growing lambs (NRC, 2007). Interestingly, excretion of soluble
phosphorus was related quadratically to increasing dietary TDDGS. Possibly, the
higher calcium content of the 60% TDDGS diet led to increased phosphorus in the
insoluble fraction of feces (Chapuis-Lardy et al. 2004). Increasing fecal excretion
of phosphorus, especially the soluble fraction, by increasing the amount of
TDDGS in the diet could pose an environmental concern. Phosphorus applied to
the land can be lost due to run off and accumulate in water bodies resulting in
eutrophication (Rausch and Belyea 2006).
3.5. Conclusion
This study indicates that TDDGS can be included at up to 60% in diets for
lambs with no detrimental effects on growth, feed intake or FE. However, feeding
TDDGS increases nitrogen and phosphorus excretion, and at higher levels, may
increase the incidence of urinary calculi in lambs. On the basis of these
observations, it is recommended that caution be exercised when including
TDDGS at levels greater than 20% in diets for lambs.

86
3.6. Literature Cited
Al-Suwaiegh, S., Fanning, K. C., Grant, R. J., Milton, C. T. and Klopfenstein,
T. J. 2002. Utilization of distillers grains from the fermentation of sorghum or
corn in diets for finishing beef and lactating dairy cattle. J. Anim. Sci. 80: 1105–
1111.
Association of Official Analytical Chemists. 1990. Official methods of analysis.
15th
ed. AOAC, Arlington, VA.
Association of Official Analytical Chemists. 1995. Official methods of analysis.
16th
ed. AOAC, Gaithersburg, MD.
Beliveau, R. M. and McKinnon, J. J. 2008. Effect of graded levels of wheat-
based dried distillers‘ grains with solubles on performance and carcass
characteristics of feedlot steers. Can. J. Anim. Sci. 88: 677–684.
Boila, R. J. and Ingalls, J. R. 1994. The ruminal degradation of dry matter,
nitrogen and amino acids in wheat-based distillers‘ dried grains in sacco. Anim.
Feed Sci. Technol. 48: 57–72.
Buckner, C. D., Mader, T. L., Erickson, G. E., Colgan, S. L., Mark, D. R.,
Bremer, V. R., Karges, K. K. and Gibson, M. L. 2008. Evaluation of dry
distillers grains plus solubles inclusion on performance and economics of
finishing beef steers. The Professional Animal Scientist 24: 404–410.
Canadian Council on Animal Care. 1993. Guide to the care and use of
experimental animals. Vol. 1. 2nd
ed. E. D. Olfert, B. M. Cross, and A. A.
McWilliam, eds. Canadian Council on Animal Care, Ottawa, ON.
Chapuis-Lardy, L., Fiorini, J., Toth, J. and Dou, Z. 2004. Phosphorus
concentration and solubility in dairy feces: Variability and affecting factors. J.
Dairy Sci. 87: 4334–4341.
Chaves, A. V., Stanford, K., Dugan, M. E. R., Gibson, L. L., McAllister, T.
A., Van Herk, F. and Benchaar, C. 2008. Effects of cinnamaldehyde, garlic and
juniper berry essential oils on rumen fermentation, blood metabolites, growth
performance, and carcass characteristics of growing lambs. Livest. Sci. 117: 215–
224.
Cromwell, G. L., Herkelman, K. L., and Stahly, T. S. 1993. Physical, chemical,
and nutritional characteristics of distillers dried grains with solubles for chicks
and pigs. J. Anim. Sci. 71: 679–686.

87
Cruz-Hernandez, C., Deng, Z., Zhou, J., Hill, A. R., Yurawecz, M. P.,
Delmonte, P., Mossoba, M. M., Dugan, M. E. R. and Kramer, J. K. G. 2004. Methods to analyze conjugated linoleic acids (CLA) and trans 18:1 isomers in
dairy fats using a combination of GC, silver ion TLC-GC, and silver ion HPLC. J.
AOAC Int. 87: 545–560.
Dugan, M. E. R., Kramer, J. K. G., Robertson, W. M., Meadus, W. J., Aldai,
N. and Rolland, D. C. 2007. Comparing subcutaneous adipose tissue in beef and
muskox with emphasis on trans 18:1 and conjugated linoleic acids. Lipids 42:
509–518.
Dugan, M. E. R., Aldai, N., Gibb, D. J., McAllister, T. A., Rolland, D. C. and
Kramer, J. K. G. 2008. Substituting dried distillers‘ grains from wheat for rolled
barley in finisher diets improves the trans-18:1 composition in beef fat. In
Proceedings 54th
International Congress of Meat Science and Technology
(Session 2B: Human Nutrition Challenges), 10-15 August 2008, Cape Town,
South Africa.
Enser, M., Hallett, K., Hewitt, B., Fursey, G. A. J. and Wood, J. D. 1996.
Fatty acid content and composition of English beef, lamb and pork at retail. Meat
Sci. 42: 443–456.
Environmental Protection Agency. 1996. Acid digestion of sediments, sludges,
and soils. 2nd
ed.
Firkins, J. L., Berger, L. L. and Fahey, G. C. 1985. Evaluation of wet and dry
distillers grains and wet and dry corn gluten feeds for ruminants. J. Anim. Sci. 60:
847–860.
Gibb, D. J., Hao, X. and McAllister, T. A. 2008. Effect of dried distillers‘ grains
from wheat on diet digestibility and performance of feedlot cattle. Can. J. Anim.
Sci. 88: 659–665.
Gill, R. K., VanOverbeke, D. L., Depenbusch, B., Drouilaard, J. S. and
DiCostanzo, A. 2008. Impact of beef cattle diets containing corn or sorghum
distillers grains on beef color, fatty acid profiles, and sensory attributes. J. Anim.
Sci. 86: 923–935.
Giunta, F. and Motzo, R. 2004. Sowing rate and cultivar affect total biomass and
grain yield of spring triticale (× Triticosecale Wittmack) grown in a
Mediterranean-type environment. Field Crops Res. 87: 179–193.
Ha, Y. L., Storkson, J. and Pariza, M. W. 1990. Inhibition of benzo(a)pyrene-
induced mouse forestomach neoplasia by conjugated dienoic derivatives of
linoleic acid. Cancer Res. 50: 1097–1101.
88
Ham, G. A., Stock, R. A., Klopfenstein, T. J., Larson, E. M., Shain, D. H. and
Huffman, R. P. 1994. Wet corn distillers byproducts compared with dried corn
distillers grains with soluble as a source of protein and energy for ruminants. J.
Anim. Sci. 72: 3246–3257.
Hay, L. 1990. Prevention and treatment of urolithiasis in sheep. In Practice 12:
87–91.
Hodgson, J. M., Wahlqvist, M. L., Boxall, J. A. and Balazs, N. D. 1996. Platelet trans fatty acids in relation to angiographically assessed coronary artery
disease. Atherosclerosis 120: 147–154.
Huls, T. J., Bartosh, A. J., Daniel, J. A., Zelinsky, R. D., Held, J. and Wertz-
Lutz, A. E. 2006. Efficacy of dried distiller‘s grains with solubles as a
replacement for soybean meal and a portion of the corn in a finishing lamb diet.
Sheep Goat Res. J. 21: 30–34.
Khorasani, G., Janzen, R., McGill, W. and Kennelly, J. 1997. Site and extent
of mineral absorption in lactating cows fed whole-crop cereal grain silage or
alfalfa silage. J. Anim. Sci. 75: 239–248.
Kleinman, P. J. A., Wolf, A. M., Sharpley, A. N., Beegle, D. B. and Saporito,
L. S. 2005. Survey of water-extractable phosphorus in livestock manures. Soil
Sci. Soc. Am. J. 69: 701–708.
Klopfenstein, T. J. 2001. Distillers grains for beef cattle. Pages 1 – 9 in Proc.
National Corn Growers Association Ethanol Co-products Workshop ―DDGS:
Issues to Opportunities‖ Nov. 7, 2001, Lincoln, NE.
Klopfenstein, T. J., Erickson, G. E. and Bremer, V. R. 2008. Board invited
review: Use of distillers by-products in the beef cattle feeding industry. J. Anim.
Sci. 86: 1223–1231.
Kramer, J. K. G., Hernandez, M., Cruz-Hernandez, C., Kraft, J. and Dugan,
M. E. R. 2008. Combining results of two GC separations partly achieves
determination of all cis and trans 16:1, 18:1, 18:2, 18:3 and CLA isomers of milk
fat as demonstrated using Ag-ion SPE fractionation. Lipids 43: 259–273.
Lan, Y., Opapeju, F. O. and Nyachoti, C. M. 2008. True ileal protein and
amino acid digestibilities in wheat dried distillers‘ grains with soluble fed to
finishing pigs. Anim. Feed Sci. Technol. 140: 155–163.

89
Larson, E. M., Stock, R. A., Klopfenstein, T. J., Sindt, M. H. and Huffman,
R. P. 1993. Feeding value of wet distillers byproducts for finishing ruminants. J.
Anim. Sci. 71: 2228–2236.
Lodge, S. L., Stock, R. A., Klopfenstein, T. J., Shain, D. H. and Herold, D. W.
1997. Evaluation of wet distillers composite for finishing ruminants. J. Anim. Sci.
75: 44–50.
McKinnon, J. J. and Walker, A. M. 2008. Comparison of wheat-based dried
distillers‘ grain with solubles to barley as an energy source for backgrounding
cattle. Can. J. Anim. Sci. 88: 721–724.
Miedaner, T., Reinbrecht, C., Lauber, U., Schollenberger, M. and Gieger, H.
H. 2001. Effects of genotype and genotype–environment interaction on
deoxynivalenol accumulation and resistance to Fusarium head blight in rye,
triticale, and wheat. Plant Breed. 120: 97–105.
Mustafa, A. F., McKinnon, J. J., Ingledew, M. W. and Christensen, D. A.
2000. The nutritive value for ruminants of thin stillage and distillers‘ grains
derived from wheat, rye, triticale and barley. J. Sci. Food Agric. 80: 607–613.
Nakamura, T., Klopfenstein, T. J., Gibb, D. J. and Britton, R. A. 1994. Growth efficiency and digestibility of heated protein fed to growing ruminants. J.
Anim. Sci. 72: 774–782.
National Research Council. 2007. Nutrient requirements of small ruminants. 7th
ed. National Academy of Science, Washington, DC.
Pérez, J. F., Balcells, J., Cebrián, J. A. and Martín-Orúe, S. M. 1998. Excretion of endogenous and exogenous purine derivatives in sheep: effect of
increased concentrate intake. Br. J. Nutr. 79: 237–240.
Raes, K., De Smet, S. and Demeyer, D. 2004. Effects of dietary fatty acids on
incorporation of long chain polyunsaturated fatty acids and conjugated linoleic
acid in lamb, beef and pork: a review. Anim. Feed Sci. Technol. 113: 199–221.
Rausch, K. D. and Belyea, R. L. 2006. The future of co-products from corn
processing. Appl. Biochem. Biotechnol. 128: 47–86.
Rosenberger, A., Kaul, H. P., Senn, T. and Aufhammer, W. 2002. Costs of
bio-ethanol production from winter cereals: the effect of growing conditions and
crops production intensity levels. Indust. Crops Products 15: 91–102.
Schauer, C. S., Anderson, L. P., Stecher, D. M., Pearson, D. and Drolc, D.
2005. Influence of dried distillers grains on feedlot performance and carcass
90
characteristics of finishing lambs. 46th
Annual Sheep and Beef Day, North Dakota
State University. 46: 31–33.
Shand, P. J., McKinnon, J. J. and Christensen, D. A. 1998. Eating quality of
beef from animals fed wet brewers‘ grains and wheat-based wet distillers‘ grains.
Can. J. Anim. Sci. 78: 143–146.
Smith, G. C. and Carpenter, Z. L. 1973. Postmortem shrinkage of lamb
carcasses. J. Anim. Sci. 36: 862–867.
Stanford, K., Jones, S. D. M. and Price, M. A. 1998. Methods of predicting
lamb carcass composition: A review. Small Rum. Res. 29: 241–254.
Stein, H. H., Gibson, M. L., Pedersen, C. and Boersma, M. G. 2006. Amino
acid and energy digestibility in ten samples of distillers grains with solubles fed to
growing pigs. J. Anim. Sci. 84: 853–860.
Van Soest, P. J., Robertson, J. B. and Lewis, B. A. 1991. Methods for dietary
fiber, neutral detergent fiber, and non-starch polysaccharides in relation to animal
nutrition. J. Dairy Sci. 74: 3583–3597.
Vipperman, P., Preston, R., Kintner, L. and Pfander, W. 1968. Role of
calcium in the nutritional etiology of a metabolic disorder in ruminants fed a high
grain ration. J. Nutr. 97: 449–462.
Waller, J., Klopfenstein, T. and Poos, M. 1980. Distillers feeds as protein
sources for growing ruminants. J. Anim. Sci. 51: 1154–1167.
Wang, S., Thomas, K. C., Sosulski, K., Ingledew, W. M. and Sosulski, F. W.
1999. Grain pearling and very high gravity (VHG) fermentation technologies for
fuel alcohol production from rye and triticale. Process Biochem. 34: 421–428.
Weatherburn, M. W. 1967. Phenol-hypochlorite reaction for determination of
ammonia. Anal. Chem. 39: 971–974.
Wood, J. D., Richardson, R. I., Nute, G. R., Fisher, A. V., Campo, M. M.,
Kasapidou, E., Sheard, P. R. and Enser, M. 2003. Effects of fatty acids on meat
quality: a review. Meat Sci. 66: 21–32.

91
4.0. GENERAL DISCUSSION
4.1. Summary of Findings
Two studies were conducted to evaluate the feeding value of CDDGS,
WDDGS and TDDGS in lamb diets. The first experiment compared growth
performance and carcass traits of 60 ram lambs fed 20% (DM basis) CDDGS,
WDDGS or TDDGS in place of 10% barley grain and 10% canola meal (Control
diet), as well as examining the in vitro fermentation characteristics of the four
diets. Lambs fed WDDGS exhibited less efficient gain compared to lambs fed the
other three diets, but there was no effect of treatment on ADG or DMI. The
decreased FE for lambs fed WDDGS was attributed to higher ammonia and
acetate production and lower propionate production during in vitro fermentation.
Adding distillers‘ grains to the diets did not affect carcass traits, with the
exception of the individual cut weight of the front shank. Front shanks were
heavier for lambs fed the Control and CDDGS diets compared to those fed
WDDGS or TDDGS, but overall SMY was not affected by treatment.
Interestingly, lambs fed TDDGS had numerically lower concentrations of trans
10-18:1; a fatty acid associated with coronary heart disease, and higher
concentrations of cis 9, trans 11-18:2-CLA, a fatty acid with anti-carcinogenic
effects, compared to lambs fed the other three diets. It was concluded that 20%
CDDGS, WDDGS or TDDGS could replace a mixture of barley grain and canola
meal without adversely affecting DMI, ADG or carcass characteristics of lambs.

92
Addition of 20% TDDGS may possibly improve the fatty acid profile of the meat
of lambs.
The second study was conducted to determine how much TDDGS could
be added to lamb diets. When 60 lambs were fed diets containing TDDGS in
place of barley grain at 0, 20, 40 or 60% of the diet, there was no treatment effect
on DMI, ADG or FE. However, one lamb fed 40% TDDGS and one fed the 60%
TDDGS diet succumbed to urinary calculi. At slaughter, cold carcass weight and
grade rule responded quadratically, peaking at 20% TDDGS inclusion, but carcass
traits were otherwise not affected by addition of TDDGS to the diet. In this study,
concentrations of trans 10-18:1 and cis 9, trans 11-CLA were not affected by the
addition of TDDGS to the diet. To determine the treatment effect on nutrient
digestibility, 12 ram lambs were used in a 4 × 4 replicated Latin square design.
Dry matter intake increased linearly with increasing TDDGS in the diet, however
apparent total tract digestibility of DM, CP and fat responded quadratically. Dry
matter digestibility was highest for control animals compared to all three TDDGS
diets, CP digestibility was lowest for 40 and 60% TDDGS, and fat digestibility
was lowest for lambs fed 40% TDDGS. Apparent starch digestibility decreased
and ADF digestibility in the total tract increased linearly, but there was no
treatment effect on NDF digestibility. In addition, because distillers‘ grains are
high in protein and P, as more TDDGS was added to the diet, total nitrogen and
phosphorus excretion increased linearly. From this experiment it was concluded
that although up to 60% TDDGS could be fed to lambs without affecting growth
performance or SMY, due to increased nitrogen and phosphorus excretion to the

93
environment and risk of lambs developing urinary calculi, it was recommended
that inclusion of TDDGS not exceed 20-30% of dietary DM.
4.2. Future Research
Although these studies provided us with valuable information on the feed
value of TDDGS, further research is warranted in some areas. Firstly, we did not
evaluate the effect of substituting barley grain with distillers‘ grains on ruminal
acidosis, a common problem leading to reduced performance of feedlot cattle.
Distillers‘ grains are typically high in fibre and low in starch, which could reduce
the risk of acidosis even though the particle size of this feedstuff is small. In the
second experiment, as TDDGS increased in the diets, DMI tended to increase,
which may be attributable to a reduction in sub-clinical acidosis due to the lower
starch content of complete diets that contained TDDGS (Firkins et al. 1985). A
reduction in rumen pH often reduces feed intake or causes a fluctuation in feed
intake, and reduces FE. Feed efficiency tended to be lower as TDDGS in the diet
increased in this study, but this is most likely explained by the increase in DMI
with no change in ADG. Unfortunately, changes in DMI and FE could not be
attributed to possible changes in rumen pH, because neither rumen pH nor feeding
behavior was evaluated in this study. Furthermore, the lambs in this experiment
were bedded on straw. While it is likely that all animals, regardless of treatment,
consumed some straw (Kertz 2007), the amount of straw consumption and its
effects on rumen pH are unknown. It could be speculated that lambs fed the
Control diet consumed more straw to offset any occurrence of acidosis, which
would confound any effect of diet on rumen pH. Also, as pelleted diets were used

94
there was no negative control treatment providing traditional long stem fibre, so
as a result it is hard to determine if feed intake for the Control treatment was
depressed due to low fibre intake and subsequent sub-clinical acidosis (Huls et al.
2006). Data on liver abscess scores at slaughter could have also provided possible
insight into the occurrence of acidosis.
Secondly, feeding trials should be conducted with finishing cattle to verify
the results found with lambs. While sheep are a good model for beef cattle, there
are some differences between the two species. There was some discrepancy in the
literature pertaining to the results of ADG between sheep and beef cattle. While
results in this study are consistent with previous research that found no
differences in ADG for sheep fed CDDGS (Lodge et al. 1997; Huls et al. 2006),
ADG is generally improved when corn-based distillers‘ grains are added to
finishing feedlot cattle diets up to 40% of the dietary DM (Al-Suwaiegh et al.
2002; Ham et al. 1994). Also, disease susceptibility may be different between the
two species. It was recommended from this study that TDDGS not exceed 40% of
DM inclusion due to the possible risk of urolithiasis. However, there have been no
reported cases of urinary calculi in cattle fed up to 60% distillers‘ grains, although
cases of polioencephalomalacia have been reported. Buckner et al. (2008)
reported 6 cases of polioencephalomalacia when 40 feedlot cattle were fed 50%
CDDGS for 22 d. One possible explanation for the occurrence of urolithiasis in
sheep is that their narrow urinary tract is prone to obstruction from urinary calculi
(Church 1988), whereas the cow may have a wider urinary tract that is less prone
to obstruction. Wool is also high in sulfur, indicating a higher sulfur requirement

95
for wool sheep compared to hair sheep (NRC 2007). As cattle do not have wool, it
is expected that there are differences in sulfur metabolism between the two
species which may explain the susceptibility of cattle to polioencephalomalacia.
Distillers‘ grains are a highly variable co-product due to differences
among grain type and ethanol plants. Because there is such a large variation in the
nutrient profiles among different lots of distillers‘ grains, regardless of grain type,
it is important to analyze the nutrient profiles of the distillers‘ grains prior to
feeding (Spiehs et al. 2002). Differences in the nutrient composition among lots of
distillers‘ grains may expose animals to toxic levels of some minerals. For
example, high phosphorus and potassium content of the diets in this study may
have promoted the occurrence of urolithiasis (Vipperman et al. 1968) when higher
levels of TDDGS were included in the diet. Also, in the study by Buckner et al.
(2008), the sulfur content of the 50% CDDGS diet exceeded the toxic level for
beef cattle and resulted in polioencephalomalacia.
The retail display, tenderness and palatability qualities of the meat would
have also been worthwhile to investigate. Feeding WWDG at 13.4% of the diet
DM (Shand et al. 1998) or CWDG at 50% of the diet DM (Jenschke et al. 2007)
did not affect tenderness, juiciness or flavor of the meat. Roeber et al. (2005)
compared steaks from steers fed CWDG and CDDG up to 50% of the diet, and
found that steaks from cows fed 25% CDDG had a greater number of visually
unacceptable steaks in the retail display and thus were likely to be discounted for
quick sale. As both WDG and DDG increased to 40 and 50% of dietary DM

96
inclusion, steaks were not as red and were considered visually less acceptable
compared to steaks from steers fed distillers‘ grains at 10 and 25% of the diet.
However, neither form of distillers‘ grain influenced tenderness or palatability of
the meat. Thus, Roeber et al. (2005) concluded that including distillers‘ grains at
10 – 25% of diet DM was optimal to maintain the shelf life of meat, without
affecting its palatability after cooking. Currently, there have been no studies
examining the effect of including up to 60% DDGS, or using TDDGS on the
eating quality of beef. It would be also interesting to evaluate the meat from
animals fed dry distillers‘ grains because Roeber et al. (2005) found differences
between wet and DDG. Triticale grain, silage or distillers‘ grains are not
commonly fed to feedlot cattle, which may also affect sensory and palatability
properties.
The fatty acid profiles of subcutaneous fat tissues were altered by the
addition of TDDGS to the diet. However, this fat can be easily removed prior to
human consumption, so the analysis of the intramuscular fatty acids may have
been more meaningful to the health conscience consumer (Raes et al. 2004). In
addition, we analyzed five fat samples per treatment for fatty acid profile in the
second experiment and we did not detect a significant treatment effect. The lack
of a treatment effect on fatty acid profiles may be attributed to insufficient
experimental units for each treatment, and more samples per treatment to increase
statistical power would be warranted for future studies.

97
Future research must also account for the dynamic nature of the ethanol
industry as it becomes more efficient and addresses consumer concerns such as
whether or not we should be using food for fuel. Grains that are developed
specifically for ethanol production will be selected for carbohydrate content.
Greater carbohydrate content would decrease the amount of grain needed to
produce the same amount of ethanol, but selection for carbohydrate content may
negatively affect protein quantity and/or quality (Rosenberger et al. 2002). Also,
fractionating the grains prior to fermentation will also alter the quality of co-
products from the ethanol industry. Fractionation would separate the parts of the
grain into the bran, germ and endosperm, as a means of increasing the efficiency
of ethanol production and diversifying the co-products produced in an effort to tap
additional markets and add value to the overall production process. In this case,
bran could become another ruminant feed but would also have the potential to be
included in human food or used to replace natural gas as a fuel source in ethanol
plants. Germ could also be fed as an oil source to cattle as well as being used for
the production of bio-diesel and cooking oil. The distillers‘ grains produced after
these fractionation processes would be a more uniform product, lower in oil and
fibre content, and potentially more suitable for the swine industry (Watkins 2008).
To address the ethical issue of converting human food to fuel, research is
also being conducted in the area of cellulosic ethanol production. For this
approach, ethanol would be fermented from fibrous materials such as (but not
limited to) straw, dirty diapers, or garbage (Motavalli 2009). In addition to
ethanol, cellulosic ethanol production will yield lignin, which will most likely be

98
burned to produce energy for the ethanol plant, ultimately resulting in the
production of ash (Lynd 1996). Although there are no co-product feeds directly
produced in these scenarios, using ash as fertilizer may impact nutrient profiles of
crops fed to livestock. Also, it is possible to produce ethanol from algae, which
yields ethanol and leftover proteins that can potentially be fed to livestock, and its
feeding values require investigation (Bullis 2007).
As the ethanol industry continues to grow and evolve, it will present many
new research opportunities. Addressing the suggestions made above in future
research will be important to ensure that the livestock industry utilizes co-
products effectively in order to maximize production and reduce costs.
4.3. General Conclusion and Industry Perspective
Distillers‘ grains are not a new feed ingredient, but the growing ethanol
industry has resulted in more extensive use of distillers‘ grains as a feed
ingredient. Thus, assessment of their feeding value for ruminants is important.
The objective of these two studies were to a) determine the effect of replacing a
mixture of canola meal and barley grain with CDDGS, WDDGS or TDDGS at
20% dietary DM on in vitro ruminal fermentation, lamb growth performance and
carcass traits and b) to determine the effect of replacing barley grain with TDDGS
at 0, 20, 40 or 60% of dietary DM on nutrient digestibility, growth and carcass
traits of lambs. Results from this study suggest that distillers‘ grains resulting
from using corn, wheat or triticale for ethanol production can be included at up to
20% of diet DM without negatively affecting growth performance or carcass traits

99
of lambs. The second study also suggests that inclusion of TDDGS up to 60% of
diet DM to replace barley grain, will not negatively affect growth, FE, intake or
SMY, but will increase the occurrence of urinary calculi as well as increased
nitrogen and phosphorus excretion to the environment.
The results of these studies indicate that distillers‘ grains can be
incorporated into ruminant rations, and provide additional feed options allowing
producers to formulate diets at lower cost. But, due to the variation in nutrient
profiles of various batches of distillers‘ grains, it is important to analyze the
distillers‘ grains produced locally and formulate diets accordingly. Other factors,
such as water quality also need to be considered. For example, areas with high
sulfur content in the water may not benefit from using distillers‘ grains as they are
also high in sulfur which can lead to polioencephalomalacia (Gould et al. 2002).
As the ethanol industry continues to become more efficient and environmentally
sustainable, future research will be needed to optimize feeding strategies of these
new co-products.

100
4.4. Literature Cited
Al-Suwaiegh, S., Fanning, K. C., Grant, R. J., Milton, C. T. and Klopfenstein,
T. J. 2002. Utilization of distillers‘ grains from the fermentation of sorghum or
corn in diets for finishing beef and lactating dairy cattle. J. Anim. Sci. 80: 1105-
1111.
Buckner, C. D., Mader, T. L., Erickson, G. E., Colgan, S. L., Mark, D. R.,
Bremer, V. R., Karges, K. K. and Gibson, M. L. 2008. Evaluation of dry
distillers grains plus solubles inclusion on performance and economics of
finishing beef steers. The Professional Animal Scientist. 24: 404–410.
Bullis, K. 2007. Algae-based fuels set to bloom. Technology Review. [Online]
www.technologyreview.com. [2009 Sept. 4].
Church, D. 1988. The ruminant animal digestive physiology and nutrition.
Prentice-Hall Illionois 523-528.
Firkins, J. L., Berger, L. L. and Fahey Jr., G. C. 1985. Evaluation of wet and
dry distillers grains and wet and dry corn gluten feeds for ruminants. J. Anim. Sci.
60: 847-860.
Gould, D. H., Dargatz, D. A., Garry, F. B., Hamar, D. W. and Ross, P. F.
2002. Potentially hazardous sulfur conditions of beef cattle ranches in the United
States. J. Am. Vet. Med. Assoc. 221: 673-677.
Ham, G. A., Stock, R. A., Klopfenstein, T. J., Larson, E. M., Shain, D. H. and
Huffman, R. P. 1994. Wet corn distillers byproducts compared with dried corn
distillers grains with solubles as a source of protein and energy for ruminants. J.
Anim. Sci. 72: 3246-3257.
Huls, T. J., Bartosh, A. J., Daniel, J. A., Zelinsky, R. D., Held, J. and Wertz-
Lutz, A. E. 2006. Efficacy of dried distiller‘s grains with solubles as a
replacement for soybean meal and a portion of the corn in a finishing lamb diet.
Sheep and Goat Research Journal. 21: 30-34.
Jenschke, B. E., James, J. M., Vander Pol, K. J., Klopfenstein, T. J. and
Calkins, C. R. 2007. Wet distillers grains plus solubles do not increase liver-like
off-flavors in cooked beef from yearling steers. J. of Muscle Foods 18: 341-348.
Kertz, A. F. 2007. Letter to the editor: pelleted calf starter with straw access can
confound results: a comment on Bach et al. (2007). J. Dairy Sci. 90: 435.
Lodge, S. L., Stock, R. A., Klopfenstein, T. J., Shain, D. H. and Herold, D. W.
1997. Evaluation of wet distillers composite for finishing ruminants. J. Anim. Sci.
75: 44–50.
101
Lynd, L. R. 1996. Overview and evaluation of fuel ethanol from cellulosic
biomass: technology, economics, the environment, and policy. Annu. Rev. Energy
Environ. 21: 403-465.
Motavalli, J. 2009. To make ethanol, start with sawdust, chocolate and used
diapers. [Online] http://bioenergy.checkbiotech.org. [2009 Aug 19].
National Research Council. 2007. Nutrient requirements of small ruminants. 7th
ed. National Academy of Science, Washington, DC.
Raes, K., De Smet, S. and Demeyer, D. 2004. Effects of dietary fatty acids on
incorporation of long chain polyunsaturated fatty acids and conjugated linoleic
acid in lamb, beef and pork: a review. Anim. Feed Sci. Technol. 113: 199–221.
Roeber, D. L., Gill, R. K. and DiCostanzo, A. 2005. Meat quality responses to
feeding distiller‘s grains to finishing Holstein steers. J. Anim. Sci. 83: 2455-2460.
Rosenberger, A., Kaul, H. P., Senn, T. and Aufhammer, W. 2002. Costs of
bio-ethanol production from winter cereals: the effect of growing conditions and
crops production intensity levels. Indust. Crops Products 15: 91–102.
Shand, P. J., McKinnon, J. J. and Christensen, D. A. 1998. Eating quality of
beef from animals fed wet brewers‘ grains and wheat-based wet distillers‘ grains.
Can. J. Anim. Sci. 78: 143–146.
Spiehs, M. J., Whitney, M. H. and Shurson, G. C. 2002. Nutrient database for
distiller‘s dried grains with solubles produced from new ethanol plants in
Minnesota and South Dakota. J. Anim. Sci. 80: 2639-2645.
Vipperman, P., Preston, R., Kintner, L. and Pfander, W. 1968. Role of
calcium in the nutritional etiology of a metabolic disorder in ruminants fed a high
grain ration. J. Nutrition 97: 449-462.
Watkins, A. 2008. Can fractionation remedy the effect of high corn prices?
Biofuels Canada. [Online] http://biofuelsmagazine.ca. [2009 Aug. 18].