Univariate analysis of dichotomous or ordinal data from twin pairs: A simulation study comparing...
12
Genetic Epidemiology 13:79-90 (1996) Univariate Analysis of Dichotomous or Ordinal Data From Twin Pairs: A Simulation Study Comparing Structural Equation Modeling and Logistic Regression Viswanathan Ramakrishnan, Joanne M. Meyer, Jack Goldberg, and William G. Henderson Division of Epidemiology- Biostatistics, University of Illinois-Chicago, School of Public Health, Chicago (KR., J.G.), and Vietnam Era Twin Registry (VR., J.G., W.G.H.) and VA Center for Cooperative Studies in Health Services (VR., J.G., W. G. H.), VA Medical Center, Hines; Department of Human Genetics, Medical College of Virginia- Virginia Commonwealth University, Richmond (J. M.M.) The univariate analysis of categorical twin data can be performed using either structural equation modeling (SEM) or logistic regression. This paper presents a comparison between these two methods using a simulation study. Dichotomous and ordinal (three category) twin data are simulated under two different sample sizes (1,000 and 2,000 twin pairs) and according to different additive genetic and common environmental models of phenotypic variation. The two methods are found to be generally comparable in their ability to detect a “correct” model under the specifications of the simulation. Both methods lack power to detect the right model for dichotomous data when the additive genetic effect is low (between 10 and 20%) or medium (between 30 and 40%); the ordinal data simulations produce similar results except for the additive genetic model with medium or high heritability. Neither method could adequately detect a correct model that included a modest common environmental effect (20%) even when the additive genetic effect was large and the sample size included 2,000 twin pairs. The SEM method was found to have better power than logistic regression when there is a medium (30%) or high (50%) additive genetic effect and a modest common environmental effect. Conversely, logistic regression performed better than SEM in correctly detecting additive genetic effects with simulated ordinal data (for both 1,000 and 2,000 pairs) Received for publication January 3, 1995; revision accepted July 10, 1995 Address reprint requests to Dr. Viswanathan Ramakrishnan, University of Illinois-Chicago, School of Public Health, 2121 W Taylor (M/C 922), Chicago, IL 60612. 0 1996 Wiley-Liss, Inc. in the United States of America. *This article is a US Government work and, as such, is in the public domain
-
Upload
viswanathan-ramakrishnan -
Category
Documents
-
view
218 -
download
5
Transcript of Univariate analysis of dichotomous or ordinal data from twin pairs: A simulation study comparing...
Genetic Epidemiology 13:79-90 (1996)
Univariate Analysis of Dichotomous or Ordinal Data From Twin Pairs: A Simulation Study Comparing Structural Equation Modeling and Logistic Regression
Viswanathan Ramakrishnan, Joanne M. Meyer, Jack Goldberg, and William G. Henderson
Division of Epidemiology- Biostatistics, University of Illinois-Chicago, School of Public Health, Chicago (KR., J.G.), and Vietnam Era Twin Registry (VR., J.G., W.G.H.) and VA Center for Cooperative Studies in Health Services (VR., J.G., W. G. H.), VA Medical Center, Hines; Department of Human Genetics, Medical College of Virginia- Virginia Commonwealth University, Richmond (J. M. M.)
The univariate analysis of categorical twin data can be performed using either structural equation modeling (SEM) or logistic regression. This paper presents a comparison between these two methods using a simulation study. Dichotomous and ordinal (three category) twin data are simulated under two different sample sizes (1,000 and 2,000 twin pairs) and according to different additive genetic and common environmental models of phenotypic variation. The two methods are found to be generally comparable in their ability to detect a “correct” model under the specifications of the simulation. Both methods lack power to detect the right model for dichotomous data when the additive genetic effect is low (between 10 and 20%) or medium (between 30 and 40%); the ordinal data simulations produce similar results except for the additive genetic model with medium or high heritability. Neither method could adequately detect a correct model that included a modest common environmental effect (20%) even when the additive genetic effect was large and the sample size included 2,000 twin pairs. The SEM method was found to have better power than logistic regression when there is a medium (30%) or high (50%) additive genetic effect and a modest common environmental effect. Conversely, logistic regression performed better than SEM in correctly detecting additive genetic effects with simulated ordinal data (for both 1,000 and 2,000 pairs)
Received for publication January 3, 1995; revision accepted July 10, 1995
Address reprint requests to Dr. Viswanathan Ramakrishnan, University of Illinois-Chicago, School of Public Health, 2121 W Taylor (M/C 922), Chicago, IL 60612.
0 1996 Wiley-Liss, Inc. in the United States of America.
*This article is a US Government work and, as such, is in the public domain
80 Ramakrishnan et al.
that did not contain modest common environmental effects; in this case the SEM method incorrectly detected a common environmental effect that was not present. 0 1996 Wiley-Liss, Inc.*
Key words: twins, statistical methods, genetic modeling
INTRODUCTION
Data from twins have proved to be extremely valuable for studying genetic influ- ences on human disease, psychopathology, behavior, and anthropometric traits. Con- temporary methods for analyzing twin data employ structural equation modeling or linear and logistic regression techniques to estimate, and evaluate the significance of, genetic and environmental contributions to the variance of a trait [Neale and Cardon, 1992; DeFries and Fulker, 1985; Kendler et al., 1993; Sham et al., 19941.
Several standard computer packages, such as LISREL-VII [Joreskog and Sor- bom, 19891 or Mx [Neale, 19941, can be used to apply structural equation models to variance-covariance matrices derived from monozygotic (MZ) and dizygotic (DZ) twin data. This method is particularly well suited for continuously distributed data. However, structural equation modeling (SEM) methodology can be extended to di- chotomous and ordinal twin data by substituting the tetrachoric or polychoric corre- lation matrix [Pearson, 190 11 for the variance-covariance matrix [Neale and Cardon, 19921. When this is done, the correlations derived from categorical variables are not sufficient statistics and their use in SEM methodology is dependent upon the assump- tion of an underlying continuous liability distribution that is bivariate normal. That is, it is assumed that categories are formed by imposing thresholds on a continuous liability distribution [Falconer, 1965; Reich et al., 19721.
As an alternative to the SEM methodology for categorical variables, an approach based on the comparison of MZ and DZ twin odds ratios derived from a logistic re- gression model has been proposed [Ramakrishnan et al. 1992; Sham et al., 19941. The SEM and logistic regression approaches to dichotomous and ordinal data are not identical, and each method has strengths and limitations. The major advantage of the SEM method is that, once the correlations are estimated, the established theory for continuous variables applies. Estimates of trait heritability are easily obtained. The methodology can also be extended to bivariate and multivariate data. The principal weakness of the SEM method is the assumption of bivariate normality of the under- lying liability distribution. This assumption, even though it proves to be reasonable in many applications, is untestable for dichotomous variables. For ordinal variables (with >2 categories) a test of bivariate normality is typically performed [Neale and Cardon, 19921. However, the appropriateness of this test is questionable, since it as- sesses the symmetry of the contingency table cross-classifying the phenotypes of twins rather than bivariate normality per se.
Two advantages of the logistic regression approach are that it is easily imple- mented in most available statistical software and it does not require the assumption of bivariate normality. This assumption may not hold if, e.g., environmental variation and allelic differences at one or two genetic loci determine an individual’s liability to disorder. There are no statistical assumptions required for the logistic regression of dichotomous outcomes. For ordinal outcomes, only the assumption of “proportional odds” is required and this can be verified by a score test [McCullagh, 19801. A lim-
Comparison of SEM and Logistic Regression 81
itation of the logistic regression approach is that estimates of heritability can only be derived from the regression parameters with difficulty [Sham et a1.,1994]. Fur- ther, the logistic regression method is difficult to extend to situations where two or more outcomes are observed and complex hypotheses regarding heritability are to be simultaneously tested.
Although other reports have considered the power of weighted least squares or maximum likelihood model-fitting approaches to twin data to resolve variation in continuous and categorical traits [Eaves, 1969, 1972; Martin et al., 1978; Neale et al., 19941, the purpose of this article is to use simulation studies to compare the SEM method with logistic regression for analyzing categorical twin data. Data have been simulated under familial aggregation models with a range of additive genetic influ- ences, with or without the influence of common family environment. The specific as- pects on which the methods will be compared are the detection of the correct model and the performance of the tests for bivariate normality and proportional odds.
MATERIALS AND METHODS
For the purpose of describing the methods a few definitions are essential. We have adopted a notation commonly used in structural models for twin data [Neale and Cardon, 19921. A denotes an additive genetic effect on the phenotype; C a fam- ily or common environmental effect; and E an individual environmental effect which includes random error. Although genetic dominance and epistasis may also be impor- tant influences on trait variance, they have not been considered in the current study. As derived under quantitative genetic theory, additive genetic effects correlate 1 .O in MZ twins and 0.5 in DZ twins. Thus, if any characteristic is purely due to addi- tive genetic and individual environmental effects (AE) , the correlation between MZ twins is expected to be twice that of the DZ twins. If the characteristic is influenced by the family and individual environment (CE), the correlation between MZ twins is expected to be equal to the correlation between DZ twins. If the characteristic re- flects additive genetic, common environmental, and individual environmental effects (ACE), the correlation between MZ twins is less than twice (but greater than) the cor- relation between DZ twins. SEM or logistic regression methods attempt to identify which of the three models above, AE, CE, or ACE, fits the data adequately.
SEM Method for Twin Data The SEM method applied to continuous twin data fits AE, CE, or ACE models
to the variance-covariance matrices of MZ and DZ pairs by the method of maximum likelihood. Alternative models are then compared using a likelihood ratio test or rel- ative fit indices (such as Akaike’s Information Criterion [Akaike, 19871) to identify the set of parameters which explains the data best.
When applied to categorical data, the SEM method derives weighted least squares estimates of phenotypic variance components by fitting models to tetrachoric or polychoric twin correlations, with asymptotic standard errors used as weights. The correlations which are estimated are those between the liabilities of the twins, assumed to be distributed as a standard bivariate normal. Since the liabilities are un- observable, the parameters of the latent distribution are estimated by the observed proportion of cell frequencies of an m X m table formed by certain unknown thresh-
82 Ramakrishnan et al.
olds (which are also estimated) corresponding to the m categories. For detailed theoretical and computational discussions of tetrachoric and polychoric correlations, see Tallis [1962], Olsson [1969], and Johnson and Kotz [1972].
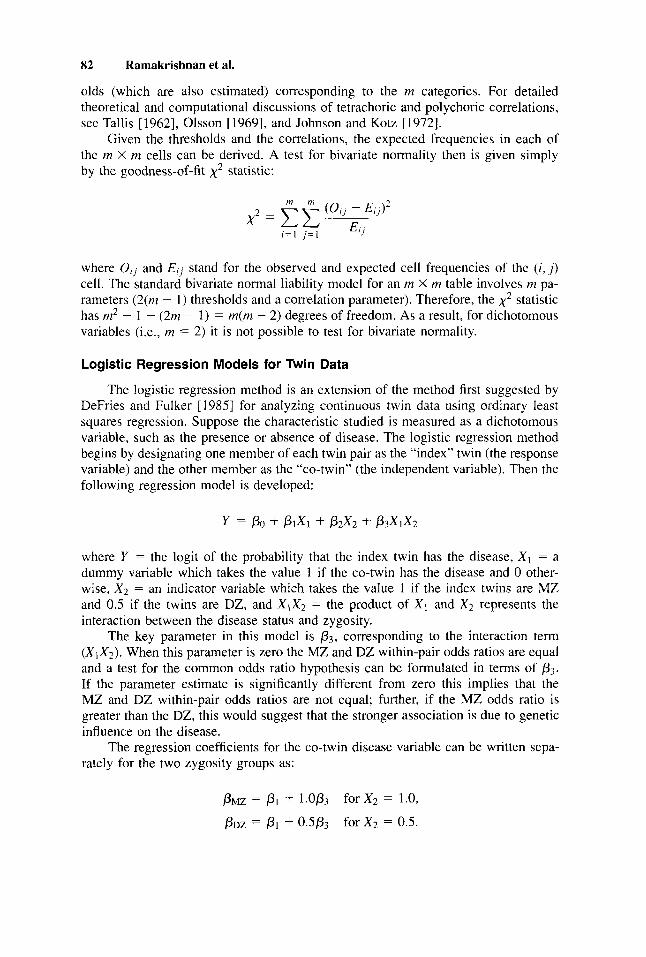
Given the thresholds and the correlations, the expected frequencies in each of the rn X m cells can be derived. A test for bivariate normality then is given simply by the goodness-of-fit x2 statistic:
where Olj and Eij stand for the observed and expected cell frequencies of the ( i , j ) cell. The standard bivariate normal liability model for an rn X m table involves m pa- rameters (2(m - l ) thresholds and a correlation parameter). Therefore, the x 2 statistic has rn2 - 1 - (2rn - 1) = m(rn - 2) degrees of freedom. As a result, for dichotomous variables (i.e., m = 2) it is not possible to test for bivariate normality.
Logistic Regression Models for Twin Data
The logistic regression method is an extension of the method first suggested by DeFries and Fulker [ 19851 for analyzing continuous twin data using ordinary least squares regression. Suppose the characteristic studied is measured as a dichotomous variable, such as the presence or absence of disease. The logistic regression method begins by designating one member of each twin pair as the “index” twin (the response variable) and the other member as the “co-twin” (the independent variable). Then the following regression model is developed:
y = Po + PIX1 + p2x2 +- P 3 X l X 2
where Y = the logit of the probability that the index twin has the disease, X I = a dummy variable which takes the value 1 if the co-twin has the disease and 0 other- wise, X 2 = an indicator variable which takes the value I if the index twins are MZ and 0.5 if the twins are DZ, and X l X 2 = the product of X I and X 2 represents the interaction between the disease status and zygosity.
The key parameter in this model is P 3 , corresponding to the interaction term ( X l X 2 ) . When this parameter is zero the MZ and DZ within-pair odds ratios are equal and a test for the common odds ratio hypothesis can be formulated in terms of P3.
If the parameter estimate is significantly different from zero this implies that the MZ and DZ within-pair odds ratios are not equal; further, if the MZ odds ratio is greater than the DZ, this would suggest that the stronger association is due to genetic influence on the disease.
The regression coefficients for the co-twin disease variable can be written sepa- rately for the two zygosity groups as:
Comparison of SEM and Logistic Regression 83
The parameters PMZ and PDZ represent the log odds ratios that estimate the disease associations for the MZ twins and DZ twins, respectively. In terms of these two parameters an AE model represents PMZ = 2 P D Z (i.e., P3 > 0, = 0), a CE model represents &Z = PDZ = P > 0 (Lee, P 3 = 0, > 0), and an ACE model represents PDZ (i.e., PMZ < 2 P ~ z (i.e., P3 > 0, P I > 0). Model selection to identify the best fitting model is based on a single degree of freedom Wald x2 tests of the appropriate parameters.
This method can be extended to polychotomous variables under the assumption of proportional odds. Proportional odds essentially means that if the m X m table is collapsed in different ways to obtain different 2 X 2 tables, the odds ratios from these tables are equal. Therefore, under the proportional odds model a single odds ratio for the m X m table provides an estimate of the association between the twins. This model, similar to the liability-threshold model used in the SEM method, oper- ates under the assumption that the categories are arbitrary boundaries classifying an underlying continuous distribution. The difference is that for the proportional odds case, the continuous distributional form is unspecified, whereas it is specified to be a standard bivariate normal distribution for the tetrachoric and polychoric correlations.
The test of proportional odds is obtained by comparing the fit under this model with a more general model. Since there is only one odds ratio for a 2 X 2 table, the assumption of proportional odds holds perfectly for dichotomous variables and hence a test need not be performed. For higher dimensions (m X m) a test known as the “score test for proportional odds” was proposed by McCullagh [1980] and is available in most statistical packages.
Simulation Study
The functional relationship between the odds ratio and the tetrachoric correlation is fairly complicated. (However, the relationship between approximations of the tetra- choric correlation and the odds ratio is more tractable and has been studied [Pearson, 1901, 1903; Yule, 1897; Castellan, 1966; Camp, 19311). This makes analytic com- parisons of the tests, using statistical concepts such as asymptotic relative efficiency, mathematically intractable. Therefore, a simulation study was performed to compare the SEM method with the logistic regression method.
Simulation Parameters
Sets of 2 X 2 and 3 X 3 tables which cross-classify the phenotype of twin 1 with that of twin 2 were simulated for pairs of MZ and DZ twins by imposing thresholds on random deviations generated from standardized bivariate normal distributions (us- ing an IMSL Inc. [ 19871 subroutine). Simulation sets (comprised of 200 replications) varied according to:
1. Placement of thresholds a. For the dichotomous case, 10% of the population was “affected.” b. For the ordinal case, two thresholds formed groups comprised of 45%,
45%, and 10% of the population.
a. 1,000 twin pairs (500 MZ and 500 DZ). b. 2,000 twin pairs (1,000 MZ and 1,000 DZ).
2. Number of twin pairs
84 Ramakrishnan et al.
3. Genetic and environmental model for phenotypic variation a. Phenotypic variation due to additive genetic and unique environmental in-
b. Phenotypic variation due to additive genetic, common environmental, and fluences (an AE model).
unique environmental influences (an ACE model).
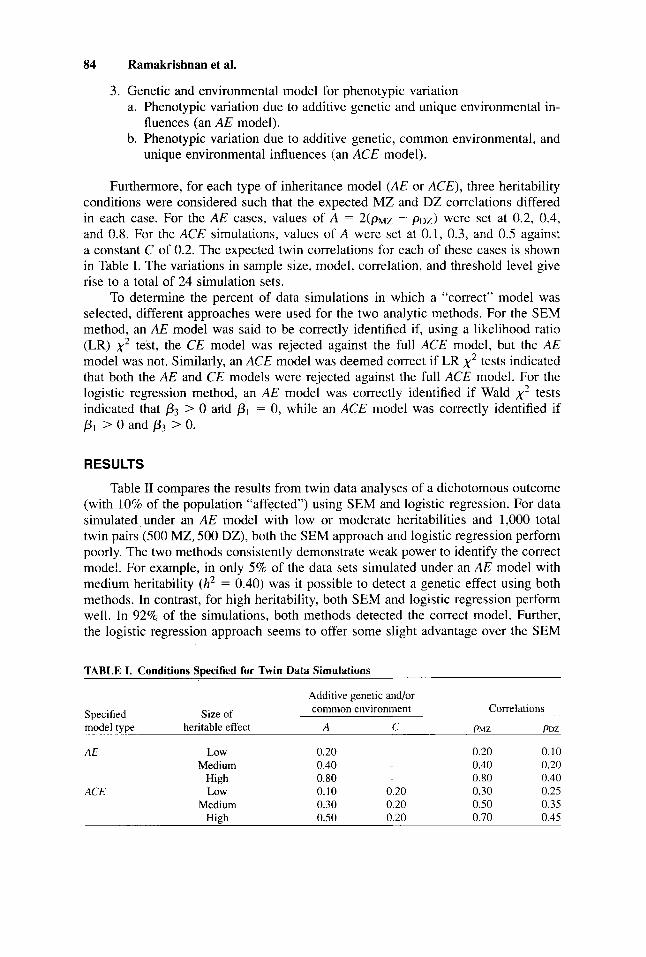
Furthermore, for each type of inheritance model (AE or ACE), three heritability conditions were considered such that the expected MZ and DZ correlations differed in each case. For the AE cases, values of A = 2 ( p ~ ~ -- ~ D Z ) were set at 0.2, 0.4, and 0.8. For the ACE simulations, values of A were set at 0.1, 0.3, and 0.5 against a constant C of 0.2. The expected twin correlations for each of these cases is shown in Table I. The variations in sample size, model, correlation, and threshold level give rise to a total of 24 simulation sets.
To determine the percent of data simulations in which a “correct” model was selected, different approaches were used for the two analytic methods. For the SEM method, an AE model was said to be correctly identified if, using a likelihood ratio (LR) x 2 test, the CE model was rejected against the full ACE model, but the AE model was not. Similarly, an ACE model was deemed correct if LR x2 tests indicated that both the AE and CE models were rejected against the full ACE model. For the logistic regression method, an AE model was correctly identified if Wald x2 tests indicated that p3 > 0 arid p, = 0, while an ACE model was correctly identified if p1 > 0 and p3 > 0.
RESULTS
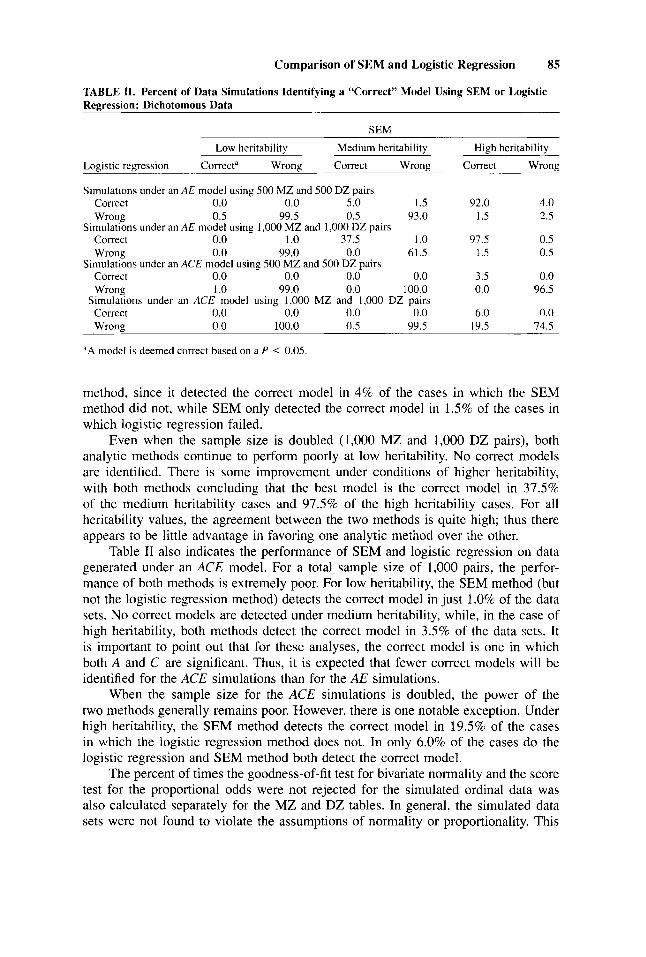
Table I1 compares the results from twin data analyses of a dichotomous outcome (with 10% of the population “affected’) using SEM and logistic regression. For data simulated under an AE model with low or moderate heritabilities and 1,000 total twin pairs (500 MZ, 500 DZ), both the SEM approach and logistic regression perform poorly. The two methods consistently demonstrate weak power to identify the correct mode!. For example, in only 5% of the data sets simulated under an AE model with medium heritability (A2 = 0.40) was it possible to detect a genetic effect using both methods. In contrast, for high heritability, both SEM and logistic regression perform well. In 92% of the simulations, both methods detected the correct model. Further, the logistic regression approach seems to offer some slight advantage over the SEM
TABLE I. Conditions Specified for Twin Data Simulations
Additive genetic and/or common environment Correlations Specified Size of
model type heritable effect A C PMZ poz
AE Low 0.20 - 0.20 0.10 Medium 0.40 - 0.40 0.20
High 0.80 - 0.80 0.40 ACE Low 0.10 0.20 0.30 0.25
Medium 0.30 0.20 0.50 0.35 High 0.50 0.20 0.70 0.45
Comparison of SEM and Logistic Regression 85
TABLE 11. Percent of Data Simulations Identifying a “Correct” Model Using SEM or Logistic Regression: Dichotomous Data
SEM
Low heritability Medium heritability
Logistic regression Correcta Wrong Correct Wrong
Simulations under an AE model using 500 MZ and 500 DZ pairs Correct 0.0 0.0 5.0 1.5 Wrong 0.5 99.5 0.5 93.0
Correct 0.0 1 .O 31.5 1 .0 Wrong 0.0 99.0 0.0 61.5
Correct 0.0 0.0 0.0 0.0 Wrong 1 .0 99.0 0.0 100.0
Simulations under an ACE model using 1,000 MZ and 1,000 DZ pairs Correct 0.0 0.0 0.0 0.0 Wrong 0.0 100.0 0.5 99.5
Simulations under an AE model using 1.000 MZ and 1,000 DZ pairs
Simulations under an ACE model using 500 MZ and 500 DZ pairs
High heritability
Correct Wrong
92.0 4.0 1.5 2.5
91.5 0.5 1.5 0.5
3.5 0.0 0.0 96.5
6.0 0.0 19.5 14.5
aA model is deemed correct based on a P < 0.05.
method, since it detected the correct model in 4% of the cases in which the SEM method did not, while SEM only detected the correct model in 1.5% of the cases in which logistic regression failed.
Even when the sample size is doubled (1,000 MZ and 1,000 DZ pairs), both analytic methods continue to perform poorly at low heritability. No correct models are identified. There is some improvement under conditions of higher heritability, with both methods concluding that the best model is the correct model in 37.5% of the medium heritability cases and 97.5% of the high heritability cases. For all heritability values, the agreement between the two methods is quite high; thus there appears to be little advantage in favoring one analytic method over the other.
Table I1 also indicates the performance of SEM and logistic regression on data generated under an ACE model. For a total sample size of 1,000 pairs, the perfor- mance of both methods is extremely poor. For low heritability, the SEM method (but not the logistic regression method) detects the correct model in just 1 .O% of the data sets. No correct models are detected under medium heritability, while, in the case of high heritability, both methods detect the correct model in 3.5% of the data sets. It is important to point out that for these analyses, the correct model is one in which both A and C are significant. Thus, it is expected that fewer correct models will be identified for the ACE simulations than for the AE simulations.
When the sample size for the ACE simulations is doubled, the power of the two methods generally remains poor. However, there is one notable exception. Under high heritability, the SEM method detects the correct model in 19.5% of the cases in which the logistic regression method does not. In only 6.0% of the cases do the logistic regression and SEM method both detect the correct model.
The percent of times the goodness-of-fit test for bivariate normality and the score test for the proportional odds were not rejected for the simulated ordinal data was also calculated separately for the MZ and DZ tables. In general, the simulated data sets were not found to violate the assumptions of normality or proportionality. This
86 Ramakrishnan et al.
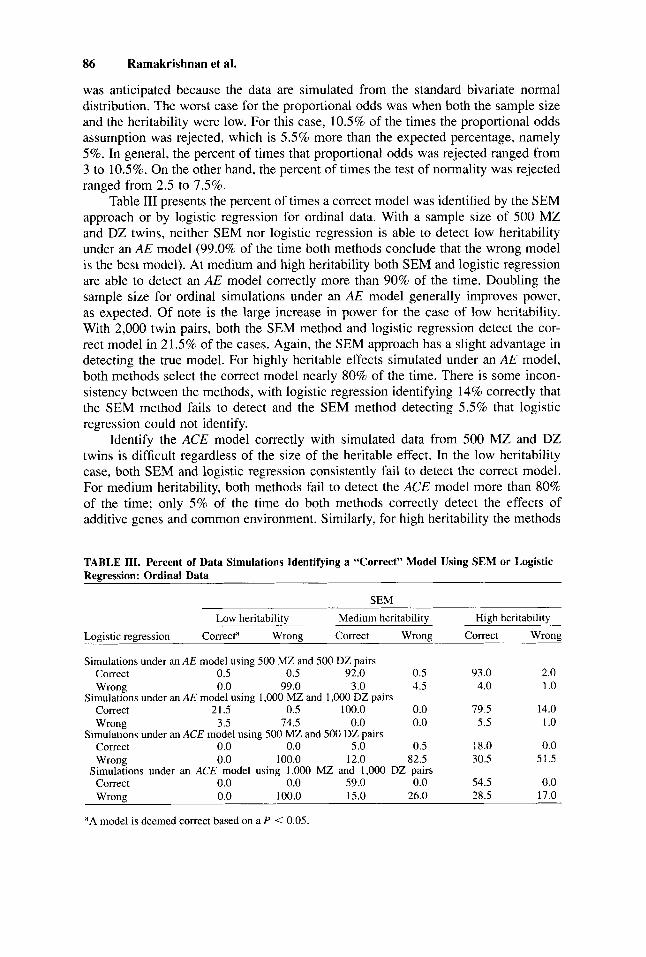
was anticipated because the data are simulated from the standard bivariate normal distribution. The worst case for the proportional odds was when both the sample size and the heritability were low. For this case, 10.5% of the times the proportional odds assumption was rejected, which is 5.5% more than the expected percentage, namely 5%. In general, the percent of times that proportional odds was rejected ranged from 3 to 10.5%. On the other hand, the percent of times the test of normality was rejected ranged from 2.5 to 7.5%.
Table 111 presents the percent of times a correct model was identified by the SEM approach or by logistic regression for ordinal data. With a sample size of 500 MZ and DZ twins, neither SEM nor logistic regression is able to detect low heritability under an AE model (99.0% of the time both methods conclude that the wrong model is the best model). At medium and high heritability both SEM and logistic regression are able to detect an A E model correctly more than 90% of the time. Doubling the sample size for ordinal simulations under an AE model generally improves power, as expected. Of note is the large increase in power for the case of low heritability. With 2,000 twin pairs, both the SEM method and logistic regression detect the cor- rect model in 21.5% of the cases. Again, the SEM approach has a slight advantage in detecting the true model. For highly heritable effects simulated under an A E model, both methods select the correct model nearly 80% of the time. There is some incon- sistency between the methods, with logistic regression identifying 14% correctly that the SEM method fails to detect and the SEM method detecting 5.5% that logistic regression could not identify.
Identify the ACE model correctly with simulated data from 500 MZ and DZ twins is difficult regardless of the size of the heritable effect. In the low heritability case, both SEM and logistic regression consistently fail to detect the correct model. For medium heritability, both methods fail to detect the ACE model more than 80% of the time; only 5 % of the time do both methods correctly detect the effects of additive genes and common environment. Similarly, for high heritability the methods
TABLE 111. Percent of Data Simulations Identifying a “Correct” Model Using SEM or Logistic Regression: Ordinal Data
SEM Low heritability Medium heritability High heritability
Logistic regression Correcta Wrong Correct Wrong Correct Wrong
Simulations under an AE model using 500 MZ and 500 DZ pairs Correct 0.5 0.5 92.0 0.5 93.0 2.0 Wrong 0.0 99.0 3.0 4.5 4.0 1 .o
Wrong 3.5 74.5 0.0 0.0 5.5 1 .o Correct 0.0 0.0 5.0 0.5 18.0 0.0 Wrong 0.0 100.0 12.0 82.5 30.5 51.5
Correct 0.0 0.0 59.0 0.0 54.5 0.0 Wrong 0.0 100.0 15.0 26.0 28.5 17.0
Simulations under an AE model using 1,000 MZ and 1,000 DZ pairs Correct 21.5 0.5 100.0 0.0 79.5 14.0
Simulations under an ACE model using 500 MZ and 500 DZ pairs
Simulations under an ACE model using 1,000 MZ and 1,000 DZ pairs
aA model is deemed correct based on a P < 0.05.
Comparison of SEM and Logistic Regression 87
are concordant more than 50% of the time for detecting the wrong model. In both the medium and high heritability ACE simulations there are inconsistencies between SEM and logistic regression, with considerably better performance observed for the SEM approach.
The poor performance of both methods to detect an ACE model with low heri- tability is not improved even when the sample size is doubled to 1,000 MZ and DZ pairs; the methods accept the wrong model 100% of the time. Greater improvement is found with medium heritability, where 59.0% of the time both methods detect the correct model, and in an additional 15% of the data sets, the SEM methods concluded that the correct model is the true model. With a highly heritable outcome, SEM and logistic regression again perform moderately well, with both methods identifying the correct model 54.5% of the time, and the SEM method identifying the correct model in an additional 28.5% of the simulated data sets. Overall, the power of the ordinal data sets compares favorably to that of the dichotomous data sets. The differences are especially apparent for AE models with medium heritability and ACE models with high heritability.
DISCUSSION
The purpose of this paper was to use simulated data to compare two differ- ent methods that are commonly used in the analysis of dichotomous and ordinal twin data. The SEM method, by assuming that there is a specific underlying liability model that is distributed bivariate normal, would be expected to possess better power char- acteristics. On the other hand, since the tetrachoric correlation estimate might not have similar large sample properties as the Pearson correlation coefficient, one might also expect the power to be reduced. The logistic regression method uses only the ob- served information for dichotomous data (i.e., sufficient statistics) and consequently may be less powerful without the assumption of bivariate normality.
The simulations were conducted using two different sample sizes (1,000 and 2,000 pairs) and a condition prevalence of 10% for the dichotomous data. Other val- ues for these parameters could have been used; however, the sample sizes selected are those that are currently feasible using twin registries from the Nordic countries, the United States, and Australia. Using smaller samples would produce even worse power than we observed (for both the SEM and logistic regression methods). The 10% prevalence figure was selected to be "representative" of many physical and psychiatric conditions. Increasing the prevalence toward 50% will naturally increase power but diminished the real-world applicability of our results since most serious medical and psychiatric disorders occur at lower prevalences. As expected, we also observed increased power in both methods for the three level ordinal classification compared to the dichotomous grouping. This trend is likely to persist as the number of categories increases, provided the categories are formed appropriately so that the proportionality of the odds for the logistic regression method and the assumption of the threshold model for the SEM model are preserved.
In general, the results of our SEM simulation studies agree closely with those of Neale et al. [1994], who fit similar genetic models to generated twin data and used non-central x2 statistics to compute the power of rejecting specific hypotheses. Further, we have shown that the SEM and logistic regression approaches to analyzing
88 Ramakrishnan et al.
dichotomous and ordinal twin data are, in some cases, comparable. The two methods are consistent in lacking the power to detect the right model when the additive genetic effect is low or medium. The optimum situation seems to be the dichotomous case of the AE model with a high genetic effect and a sample size of 2,000. The ACE model is the hardest to detect. For the ACE model the SEM and logistic regression methods were found to have reasonable power to detect the medium and high additive genetic effects, especially when the sample size is larger. However, they often did not have the power to detect the small common environmental effect and hence led to a wrong model. Further, when the additive genetic effect is low the two methods detected the common environmental effect but failed to detect the additive genetic effect. This once again led to a wrong model.
A few important differences between the SEM and logistic regression methods did emerge. The SEM method has higher power than logistic regression in detecting the ACE model correctly when the additive genetic effect is high for a sample size equal to 1,000 and when it is medium or high for a sample size equal to 2,000. On the other hand, the logistic regression method performs better in detecting the AE model for the ordinal case. The SEM method tended to over-fit in these cases, detecting a small common environmental effect which is not present. This basically supports the suggestion that the SEM method by imposing the additional assumption of bivariate normality has an unrealistically higher power, even if this assumption is appropriate in the simulations. It might be interesting to see how the SEM method would perform if the tables were simulated under a non-normal distribution.
In summary, the simulation study illustrates the extremely low power the two methods have for dichotomous data for all ACE models and AE models with low and medium heritability. Likewise, low power is observed for ordinal data for ACE models, except when the sample size is 2,000 with medium and high heritability; AE models with low and medium heritability also have low power even with samples of 1,000 and 2,000 pairs. This underscores the importance of needing very large samples (such as those available from twin registries) when performing a genetic analysis of categorical outcomes. However, for continuous variables there seems to be adequate power to perform the twin analyses with much smaller sample sizes [Martin et al., 19781.
The power to identify the correct model was used here as the criterion for com- paring SEM and logistic regression since, in practice, fitting the correct model is the main goal. However, comparisons on individual tests showed that when the heritabil- ity is high or medium the lack of power occurs generally in detecting the common environmental effect in the ACE models. Similarly, the dichotomous tables generated for the simulations specified a threshold that would produce a 90%/10% division for the proportion of non-diseased to diseased. As this threshold is moved closer to 50%/50%, the power improves (results not shown) but the extent of agreement be- tween the two methods remained the same.
Improvements to either method might be possible. For instance, in the logistic regression approach the number of discordant pairs are not constrained to be equal. However, one would expect that the number of pairs where the index twin has the disease but not the co-twin, especially since the labels are assigned randomly. Incor- porating this aspect in the analysis would allow for an additional degree of freedom in the 2 X 2 case. This might also facilitate a test of normality under the dichotomous case. These will be discussed in a subsequent publication.
Comparison of SEM and Logistic Regression 89
ACKNOWLEDGMENTS
We thank the VET Registry Advisory Committee: Theodore Colton, Sc.D., Walter Nance, M.D., Ph.D., Ralph S. Paffenbarger, Jr., M.D., Dr. P.H., Myrna M. Weissman, Ph.D., Roger R. Williams, M.D., Alexander Beam, M.D. (past), and Gary Chase, Ph.D. (past); the Hines VA Center for Cooperative Studies in Health Services: Director, Vietnam Era Twin Registry, William G. Henderson, Ph.D.; Registry Coordi- nator, Mary Ellen Vitek; Programmer, Kenneth Bukowski; Registry Assistant, Mary Biondic; Administrative Officer, Dee Cavello; the VA Central Office, Department of Veterans Affairs, Health Services Research and Development Service: Director, Daniel Deykin, M.D.; Deputy Director, Shirley Meehan, M.B.A., Ph.D.; Cooperative Studies in Health Services: Program Manager, Charles Welch 111, Ph.D.; Adminis- trative Officer, Janet Gold; and the University of Illinois, School of Public Health, Division of Biostatistics: Programmer, Hsao-Ting Chiu.
REFERENCES
Akaike H (1987): Factor analysis and AIC. Psychometrika 52:317-332. Camp BH (1931): “The Mathematical Parts of Elementary Statistics.” New York: D.C. Heath. Castellan NJ (1966): On the estimation of the tetrachoric correlation coefficient. Psychometrika 3 1 :67-73. DeFries JC, Fulker DW (1985): Multiple regression analysis of twin data. Behav Genet 15:467-473. Eaves LJ (1969): The genetic analysis of continuous variation: A comparison of experimental designs
Eaves LJ (1972): Computer simulation of sample size and experimental design in human psychogenetics.
Falconer DS (1965): The inheritance of liability to diseases estimated from the incidence among relatives.
IMSL Inc. (1987): “IMSL User’s Manual. Version 1.0.” Houston: IMSL, Inc. Johnson NL, Kotz S (1972): “Distributions in Statistics: Continuous Multivariate Distributions.” New York:
Joreskog KG, Sorbom D (1989): “LISREL 7: A Guide to the Program and Applications. 2nd Ed.” Chicago:
Kendler KS, Neale MC, Kessler RC, Heath AC, Eaves LJ (1993): A twin study of recent life events and
Martin NG, Eaves LJ, Kearsey MJ, Davies P (1978): The power of the classical twin study. Heredity
McCullagh P (1980): Regression models for ordinal data. J R Stat Soc B42:109-142. Neale MC (1994): “MX: Statistical Modeling.” Department of Psychiatry, Medical College of Virginia-
Virginia Commonwealth University. Neale MC, Cardon LR (1992): “Methodology for Genetic Studies of Twins and Families.” Dordrecht, The
Netherlands: Kluwer Academic Press. Neale MC, Eaves LJ, Kendler KS (1994): The power of the classical twin study to resolve variation in
threshold traits. Behav Genet 24(3):239-258. Olsson U (1969): Maximum likelihood estimation of the polychoric correlation coefficient. Psychometrika
44:443-460. Pearson K (1901): Mathematical contributions to the theory of evolution. VII. On the correlation of
characters not quantitatively measurable. Philos Trans R SOC Lon Ser A 195: 1-47. Pearson K (1903): Mathematical contributions to the theory of evolution. XI. On the influence of natural
selection on the variability and correlation of organs. Philos Trans R Soc Lon Ser A 200: 1-66. Ramakrishnan V, Goldberg J, Henderson WG, Eisen SA, True W, Lyons MH, Tsuang MT (1992): Ele-
mentary methods for the analysis of dichotomous outcomes in unselected sample of twins. Genet Epidemiol9:273-287.
Reich T, James JW, Morris CA (1972): The use of multiple thresholds in determining the mode of transmission of semi-continuous traits. Ann Hum Genet Lond 36: 163-183.
applicable to human data. Br J Math Stat Psychol 22:131-147.
Psychol Bull 77: 144-152.
Ann Hum Genet 29:51-75.
John Wiley & Sons.
SPSS, Inc.
difficulties: The genetics of the environment. Arch Gen Psychiatry 50:789-796.
40:97-1 16.

90 Ramakrishnan et al.
Sham PC, Walters EE, Neale MC, Heath AC, MacLean CJ, Kendler KS (1994): Logistic regression analysis of twin data: Estimation of parameters of the multifactorial liability-threshold model. Behav Genet
Tallis GM (1962): The maximum likelihood estimation of correlations from contingency tables. Biometrika
Yule GU (1897): On the theory of correlation. J R Stat SOC Ser A 609124354.
24:229-238.
18:342-353.