UNITED STATESd18rn0p25nwr6d.cloudfront.net/CIK-0000777491/52f530a8-ae08-4ca8... · UNITED STATES...
116
Table of Contents UNITED STATES SECURITIES AND EXCHANGE COMMISSION Washington, DC 20549 Form 10 ‑ K (MARK ONE) ☒ ANNUAL REPORT PURSUANT TO SECTION 13 OR 15(d) OF THE SECURITIES EXCHANGE ACT OF 1934 FOR THE FISCAL YEAR ENDED DECEMBER 30, 2016 OR ☐ TRANSITION REPORT PURSUANT TO SECTION 13 OR 15(d) OF THE SECURITIES EXCHANGE ACT OF 1934 FOR THE TRANSITION PERIOD FROM TO Commission File Number 000 ‑ 27261 CH2M HILL Companies, Ltd. (Exact name of registrant as specified in its charter) Delaware 93‑‑ 0549963 (State or other jurisdiction of incorporation or organization) (I.R.S. Employer Identification Number) 9191 South Jamaica Street, Englewood, CO 80112‑‑ 5946 (Address of principal executive offices) (Zip Code) (303) 771 ‑ 0900 (Registrant’s telephone number, including area code) Securities registered pursuant to Section 12(b) of the Act: None Securities registered pursuant to Section 12(g) of the Act: Common Stock, par value $0.01 per share Indicate by check mark if the registrant is a well‑known seasoned issuer, as defined in Rule 405 of the Securities Act. Yes ☐ No ☒ Indicate by check mark if the registrant is not required to file reports pursuant to Section 13 or Section 15(d) of the Act. Yes ☐ No ☒ Indicate by check mark whether the registrant (1) has filed all reports required to be filed by Section 13 or 15(d) of the Securities Exchange Act of 1934 during the preceding 12 months (or for such shorter period that the registrant was required to file such reports), and (2) has been subject to such filing requirements for the past 90 days. Yes ☒ No ☐ Indicate by checkmark whether the registrant has submitted electronically and posted on its corporate Website, if any, every Interactive Data File required to be submitted and posted pursuant to Rule 405 of Regulation S‑T (§232.405 of this chapter) during the preceding 12 months (or for such shorter period that the registrant was required to submit and post such files). Yes ☒ No ☐ Indicate by check mark if disclosure of delinquent filers pursuant to Item 405 of Regulation S‑K (§229.405 of this chapter) is not contained herein, and will not be contained, to the best of registrant’s knowledge, in definitive proxy or information statements incorporated by reference in Part III of this Form 10‑K or any amendment to this Form 10‑K. ☒ Indicate by check mark whether the registrant is a large accelerated filer, an accelerated filer, a non‑accelerated filer, or a smaller reporting company. See definitions of “large accelerated filer,” “accelerated filer,” and “smaller reporting company” in Rule 12b‑2 of the Exchange Act. Large accelerated filer ☐ Accelerated filer ☐ Non‑accelerated filer ☒ (Do not check if a smaller reporting company) Smaller reporting company ☐ Indicate by check mark whether the registrant is a shell company (as defined in Rule 12b‑2 of the Exchange Act). Yes ☐ No ☒ The aggregate value of common stock held by non‑affiliates computed by reference to the price as of June 24, 2016 was $1,547,956,264. As of March 3, 2017, there were 24,783,086 shares of the registrant’s common stock outstanding. DOCUMENTS INCORPORATED BY REFERENCE Information required by Items 10, 11, 12, 13 and 14 of Part III of this Form 10‑K are incorporated by reference from the CH2M definitive proxy statement for its 2017 Annual Meeting of Stockholders to be held on June 5, 2017 .
Transcript of UNITED STATESd18rn0p25nwr6d.cloudfront.net/CIK-0000777491/52f530a8-ae08-4ca8... · UNITED STATES...

Table of Contents
UNITED STATES
SECURITIES AND EXCHANGE COMMISSIONWashington, DC 20549
Form 10‑‑K
(MARK ONE) ☒ ANNUAL REPORT PURSUANT TO SECTION 13 OR 15(d) OF THE SECURITIES EXCHANGE ACT OF 1934
FOR THE FISCAL YEAR ENDED DECEMBER 30, 2016
OR
☐ TRANSITION REPORT PURSUANT TO SECTION 13 OR 15(d) OF THE SECURITIES EXCHANGE ACT OF 1934
FOR THE TRANSITION PERIOD FROM TO
Commission File Number 000‑‑27261
CH2M HILL Companies, Ltd.(Exact name of registrant as specified in its charter)
Delaware 93‑‑0549963(State or other jurisdiction of incorporation or organization) (I.R.S. Employer Identification Number)
9191 South Jamaica Street, Englewood, CO 80112‑‑5946
(Address of principal executive offices) (Zip Code)
(303) 771‑‑0900(Registrant’s telephone number, including area code)
Securities registered pursuant to Section 12(b) of the Act: NoneSecurities registered pursuant to Section 12(g) of the Act:
Common Stock, par value $0.01 per share
Indicate by check mark if the registrant is a well‑known seasoned issuer, as defined in Rule 405 of the Securities Act. Yes ☐ No ☒
Indicate by check mark if the registrant is not required to file reports pursuant to Section 13 or Section 15(d) of the Act. Yes ☐ No ☒Indicate by check mark whether the registrant (1) has filed all reports required to be filed by Section 13 or 15(d) of the Securities Exchange Act of 1934 during
the preceding 12 months (or for such shorter period that the registrant was required to file such reports), and (2) has been subject to such filing requirements for the past90 days. Yes ☒ No ☐
Indicate by checkmark whether the registrant has submitted electronically and posted on its corporate Website, if any, every Interactive Data File required to besubmitted and posted pursuant to Rule 405 of Regulation S‑T (§232.405 of this chapter) during the preceding 12 months (or for such shorter period that the registrant wasrequired to submit and post such files). Yes ☒ No ☐
Indicate by check mark if disclosure of delinquent filers pursuant to Item 405 of Regulation S‑K (§229.405 of this chapter) is not contained herein, and will notbe contained, to the best of registrant’s knowledge, in definitive proxy or information statements incorporated by reference in Part III of this Form 10‑K or anyamendment to this Form 10‑K. ☒
Indicate by check mark whether the registrant is a large accelerated filer, an accelerated filer, a non‑accelerated filer, or a smaller reporting company. Seedefinitions of “large accelerated filer,” “accelerated filer,” and “smaller reporting company” in Rule 12b‑2 of the Exchange Act.
reporting company)
Large accelerated filer ☐ Accelerated filer ☐ Non‑accelerated filer ☒(Do not check if a smaller
reporting company)
Smaller reporting company ☐
Indicate by check mark whether the registrant is a shell company (as defined in Rule 12b‑2 of the Exchange Act). Yes ☐ No ☒
The aggregate value of common stock held by non‑affiliates computed by reference to the price as of June 24, 2016 was $1,547,956,264.
As of March 3, 2017, there were 24,783,086 shares of the registrant’s common stock outstanding.DOCUMENTS INCORPORATED BY REFERENCE
Information required by Items 10, 11, 12, 13 and 14 of Part III of this Form 10‑K are incorporated by reference from the CH2M definitive proxy statement forits 2017 Annual Meeting of Stockholders to be held on June 5, 2017 .

Table of Contents
CH2M HILL COMPANIES, LTD. AND SUBSIDIARIES
ANNUAL REPORT ON FORM 10‑‑K
TABLE OF CONTENTS
-
Page PART I. Item 1. Business 4 Item 1A. Risk Factors 12 Item 1B. Unresolved Staff Comments 31 Item 2. Properties 31 Item 3. Legal Proceedings 32 Item 4. Mine Safety Disclosures 33 PART II. Item 5.
Market for Registrant’s Common Equity, Related Stockholder Matters and Issuer Purchases of EquitySecurities 33
Item 6. Selected Financial Data 41 Item 7. Management’s Discussion and Analysis of Financial Condition and Results of Operations 42 Item 7A. Quantitative and Qualitative Disclosures About Market Risk 56 Item 8. Financial Statements and Supplementary Data 56 Item 9. Changes in and Disagreements With Accountants on Accounting and Financial Disclosure 57 Item 9A. Controls and Procedures 57 Item 9B. Other Information 58 PART III. Item 10. Directors, Executive Officers and Corporate Governance 59 Item 11. Executive Compensation 59 Item 12. Security Ownership of Certain Beneficial Owners and Management and Related Stockholder Matters 59 Item 13. Certain Relationships and Related Transactions, and Director Independence 59 Item 14. Principal Accounting Fees and Services 59 PART IV. Item 15. Exhibits and Financial Statement Schedules 60 Item 16. Form 10-K Summary 106 SIGNATURES
2

Table of Contents
Cautionary Note Regarding Forward Looking Statements
This Form 10‑K contains various “forward looking statements” within the meaning of Section 27A of the Securities Act of 1933, asamended, and Section 21E of the Securities Exchange Act of 1934, as amended. Forward‑ looking statements represent the Company’sexpectations and beliefs concerning future events, based on information available to the Company on the date of the filing of this Form 10‑K,and are subject to various risks and uncertainties. Such forward looking statements are and will be subject to many risks and uncertaintiesrelating to our operations and business environment that may cause actual results to differ materially from any future results expressed orimplied in such forward looking statements. Given these risks and uncertainties, readers are cautioned not to place undue reliance on suchforward-looking statements. Words such as “believes,” “anticipates,” “expects,” “will,” “plans” and similar expressions are intended toidentify forward looking statements. Additionally, forward looking statements include statements that do not relate solely to historical facts,such as statements which identify uncertainties or trends, discuss the possible future effects of current known trends or uncertainties, or whichindicate that the future effects of known trends or uncertainties cannot be predicted, guaranteed or assured. We undertake no obligation topublicly update or revise any forward looking statements, whether as a result of new information, future events, changed circumstances orotherwise, except as required by applicable law. Factors that could cause actual results to differ materially from those referenced in theforward‑looking statements are listed in Item 1A, Risk Factors.
3
Table of Contents
PART I
Item 1. Busines s
Description of the Business
CH2M HILL Companies, Ltd. and subsidiaries (“We”, “Our”, “CH2M” or the “Company”) is a large employee‑controlledprofessional engineering services firm, founded in 1946, providing engineering, construction, consulting, design, design‑build, procurement,engineering‑procurement‑construction (“EPC”), operations and maintenance, program management and technical services to United States(“U.S.”) federal, state, municipal and local government agencies, national governments, as well as private industry and utilities, around theworld. A substantial portion of our professional fees are derived from projects that are funded directly or indirectly by government entities. Wehave approximately 20,000 employees worldwide inclusive of craft and hourly employees as well as employees in our consolidated jointventures.
Our strategy is to deliver valued solutions to our chosen clients in selective geographies that align to our core service capabilities. Wedifferentiate through client centricity, our focused approach to developing and delivering innovative solutions, and the values and culture of ourfirm that are embedded in how we serve our clients and communities. Since our founding in 1946, CH2M has grown through organic growthwhich has been augmented with acquisitions that expand our portfolio of services and geographic reach to further enhance our value propositionto our clients. Webelievethisstrategyresultsindeeplong-termclientrelationships,rewardinggrowthopportunitiesforouremployeesandprofitablegrowthforourstockholderslong-term.Below is a discussion of our significant developments and key acquisitions occurring over thepast five years.
Preferred Stock Issuance
On June 24, 2015, the Company sold and issued an aggregate of 3,214,400 shares of Series A Preferred Stock for an aggregatepurchase price of $200.0 million in a private placement to a subsidiary owned by investment funds affiliated with Apollo Global Management,LLC (together with its subsidiaries, “Apollo”). The sale occurred in connection with the initial closing pursuant to the Subscription Agreemententered into by the Company and Apollo on May 27, 2015 (“Subscription Agreement”). On April 11, 2016, the Company sold and issued anadditional 1,607,200 shares of Series A Preferred Stock for an aggregate purchase price of approximately $100.0 million in a second closing toApollo pursuant to the conditions of the Subscription Agreement.
Restructuring
During the third quarter of 2016, the Company began a process to review the structure and resources within its business segments andformulate a restructuring plan to more fully align global operations with the Company’s client-centric strategy, including a simplifiedorganization structure and streamlined delivery model to achieve higher levels of profitable growth (“2016 Restructuring Plan”). Therestructuring activities include such items as workforce reductions and facilities consolidations. We expect the 2016 Restructuring Plan to becompleted in the first half of 2017.
In September 2014, the Company commenced certain restructuring activities in order to achieve important business objectives,including reducing overhead costs, improving efficiency, and reducing risk (“2014 Restructuring Plan”). These restructuring activities, whichcontinued into 2015, included such items as a voluntary retirement program, workforce reductions, facilities consolidations and closures, andevaluation of certain lines of business. The restructuring activities under the 2014 Restructuring Plan were substantially complete as ofDecember 25, 2015.
Halcrow Pension Scheme Restructuring
On October 4, 2016, Halcrow Group Limited (“HGL”), a subsidiary of CH2M, effected a transaction to restructure the benefitsprovided to members of the Halcrow Pension Scheme (“HPS”), a defined benefit plan sponsored by HGL, by providing each member with theoption to transfer his or her benefits in the HPS to a new pension scheme, which is also sponsored by HGL (“HPS2”). Alternatively, membershad the option to remain in the HPS which will enter the Pension Protection Fund (“PPF”) under a regulated apportionment arrangement. Thenew scheme, HPS2, provides benefits that are better than the compensation that would otherwise be paid by the PPF if a member chose to jointhe PPF rather than the HPS2. The PPF was created by the United Kingdom Pensions Act 2004 to provide compensation to members of eligibledefined benefit pension schemes when an employer of the scheme can no longer support the pension scheme. A member that transferred to theHPS2 will receive substantially similar benefits to those
4

Table of Contents
in the HPS, except that annual increases and revaluation of benefits are reduced to statutory levels. A pension scheme member of the HPS thatelected to transfer to the new scheme also received a one-time uplift to benefits of either 1.0% or 2.5%. The Pension Regulator, which is theUnited Kingdom’s executive body that regulates work-based pension schemes, and the PPF provided necessary regulatory approvals for thetransaction to restructure the HPS benefits.
As a result of the transaction described above, HGL ceased to have any further obligations to the HPS on October 4, 2016. Allmembers who consented to transfer to HPS2 were transferred on October 5, 2016. Members who agreed to transfer to the new scheme accountfor 96.6% of the HPS’ liabilities and a broadly equivalent proportion of the HPS’ assets have transferred to the new scheme, as well as 20% ofHGL’s equity issued as part of the transaction. As a result of the restructured benefits for those members transferring to the HPS2, the projectedbenefit obligation was reduced by $362.3 million. Those members who remained in the HPS began the process of transferring to the PPFduring the fourth quarter of 2016 along with the assets that remain in the HPS, as well as 5% of HGL’s equity issued as part of the transaction,resulting in a settlement of $28.4 million and an actuarial gain of $16.2 million within the projected benefit obligation. We did not incur a gainor loss on settlement as a result of the transaction as the settlement cost related to the members who remained in HPS was less than the serviceand interest cost components of net periodic pension expense for 2016.
Additionally, in connection with the transaction, CH2M issued a £50.0 million, approximately $65.0 million, parent company
guarantee to support HPS2 and funded £80.0 million, approximately $104.0 million, to be allocated between HPS2 and the PPF based on theproportion of the HPS’ members that transferred to HPS2.
Acquisitions
On April 4, 2014, we acquired certain assets and liabilities of TERA Environmental Consultants (“TERA”). TERA was an employee-owned environmental consulting firm headquartered in Canada specializing in environmental assessment, planning, siting, permitting, licensing,and related services for the pipeline, electrical transmission, and oil and gas industries. Additionally, on September 6, 2016, we acquired acontrolling interest in one of our joint ventures which primarily operates within our water business and urban environments and sports business.
Our Clients, Key Segments, and Geographic Areas
In the first quarter of 2016, we implemented certain organizational changes, including the reorganization of our internal reportingstructure to better facilitate our strategy for growth and operational efficiency. In connection with this refinement, we discontinued our formerIndustrial and Urban Environments (“IUE”) business group as a standalone unit, and we combined its industrial and advanced technologybusiness with our Oil, Gas and Chemicals business group to form the Energy and Industrial business group. Additionally, our urbanenvironments and sports business which was formerly within IUE was combined with our Water business group. Our Power EPC businesscontinues to be monitored as a separate operating segment as we exit the fixed-price Power EPC business. As a result of this reorganization, weidentified our four business groups, which include Energy and Industrial, Environment and Nuclear, Transportation, and Water, as well as ourPower EPC business as reportable operating segments. The following discussion describes our business in the context of our reportablesegments, and any prior year amounts have been revised to conform to the current year presentation.
During the third quarter of 2016, the Company began the process of assessing and modifying its current operating structure to morefully align global operations with the Company’s client-centric strategy and to streamline its delivery model to achieve higher levels ofprofitable growth. The transformation is currently in process and is expected to be fully communicated and operational in the first quarter of2017. We expect to revise our segments in 2017 as a result of the modified operating structure.
Clients
We provide services to a broad range of U.S. domestic and international clients, including federal, state, municipal and localgovernment agencies, national governments, as well as private industry and utilities. We perform services as the prime contractor, asubcontractor, or through joint ventures or partnership agreements with other service providers. The demand for our services generally comesfrom capital spending decisions made by our clients.
5
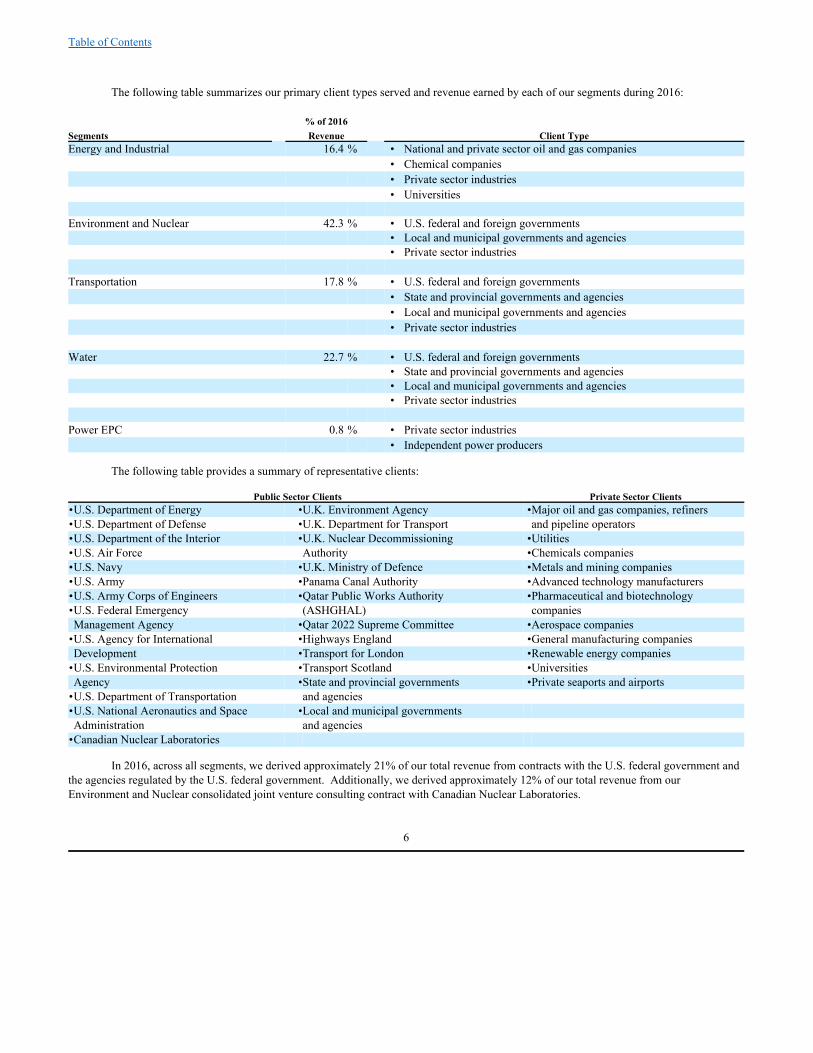
Table of Contents
The following table summarizes our primary client types served and revenue earned by each of our segments during 2016:
% of 2016 Segments Revenue Client TypeEnergy and Industrial 16.4 % • National and private sector oil and gas companies • Chemical companies • Private sector industries • Universities Environment and Nuclear 42.3 % • U.S. federal and foreign governments • Local and municipal governments and agencies • Private sector industries Transportation 17.8 % • U.S. federal and foreign governments • State and provincial governments and agencies • Local and municipal governments and agencies • Private sector industries Water 22.7 % • U.S. federal and foreign governments • State and provincial governments and agencies • Local and municipal governments and agencies • Private sector industries Power EPC 0.8 % • Private sector industries • Independent power producers
The following table provides a summary of representative clients:
Public Sector Clients Private Sector Clients•U.S. Department of Energy •U.K. Environment Agency •Major oil and gas companies, refiners•U.S. Department of Defense •U.K. Department for Transport and pipeline operators•U.S. Department of the Interior •U.K. Nuclear Decommissioning •Utilities•U.S. Air Force Authority •Chemicals companies•U.S. Navy •U.K. Ministry of Defence •Metals and mining companies•U.S. Army •Panama Canal Authority •Advanced technology manufacturers•U.S. Army Corps of Engineers •Qatar Public Works Authority •Pharmaceutical and biotechnology•U.S. Federal Emergency (ASHGHAL) companies Management Agency •Qatar 2022 Supreme Committee •Aerospace companies•U.S. Agency for International •Highways England •General manufacturing companies Development •Transport for London •Renewable energy companies•U.S. Environmental Protection •Transport Scotland •Universities Agency •State and provincial governments •Private seaports and airports•U.S. Department of Transportation and agencies •U.S. National Aeronautics and Space •Local and municipal governments Administration and agencies •Canadian Nuclear Laboratories
In 2016, across all segments, we derived approximately 21% of our total revenue from contracts with the U.S. federal government andthe agencies regulated by the U.S. federal government. Additionally, we derived approximately 12% of our total revenue from ourEnvironment and Nuclear consolidated joint venture consulting contract with Canadian Nuclear Laboratories.
6
Table of Contents
Key Segments
The following is a description of each of our key segments, which consist of our four business groups and our Power EPC business,and the services we provide. Operating information by segment is set forth in Note 17 - Segment Information of the Notes to ConsolidatedFinancial Statements in Item 15 of this Annual Report on Form 10‑K.
Energy and Industrial
Our Energy and Industrial business group is comprised of our oil and gas business, our chemical business, and our industrial andadvanced technology business, which provides the following portfolio of services: consulting, planning, design, engineering, design‑build,operations and maintenance, construction management, construction, and program management. Our Energy and Industrial business groupperforms the majority of its work for major international oil, gas and chemicals companies, national oil companies, private sectormanufacturing, and technology industries.
Within our oil and gas business, we serve the upstream, pipelines and terminals, and refining sectors of the oil and gas industry. Forthe upstream sector, we perform engineering, modular fabrication, erection, construction, and operations and maintenance services for oil andgas fields. We deliver compression and dehydration facilities, drilling and well support services, enhanced oil recovery infrastructure, fielddevelopment, fleet support, natural gas gathering and processing, conventional oil production, sulfur recovery, acid gas treating, and heavy oil-and steam‑assisted gravity drainage facilities. In our pipelines and terminals sector, we focus on infrastructure projects that gather, store, andtransport oil, natural gas, refined products, carbon dioxide, and other related hydrocarbons, liquids, and gases. These projects include pipelines,compression, pump stations, metering, tank farms, terminals, and related facilities for midstream (wellhead to central processing) anddownstream (cross‑country transportation) systems. Within our refining sector, we provide conceptual and preliminary engineering, front‑endand detail design, procurement, construction, and operations and maintenance services. Our refining experience includes technology evaluationand feasibility studies; design and construction of refinery units, terminals, pipelines, pump stations, and cogeneration facilities; design,fabrication, and installation of modules and pipe racks; turnarounds and revamps; effluent treatment; refinery conversion to heavy crude oilprocessing; and process safety management. Our oil and gas business serves clients in the U.S., Canada, Mexico, South America, the MiddleEast, and Russia.
Within our chemicals business, we serve various sectors of the industry, including petrochemicals and derivatives, inorganics,specialties, and agricultural chemicals. We have substantial experience in polysilicon, chemicals from alternative feedstock, bioprocess, alkalisand chlorine, pigments and coating, monomers and polymers, resins and plastics, and synthetic performance fibers. This group also serves thebiofuels market where we specialize in advanced fuel sources for biofuels development in the United States, Canada, and Latin America. Ourchemicals business serves clients in North and South America, and the Middle East.
In our industrial and advanced technology business, we provide program management, consulting, planning, design, and constructionmanagement services to clients in the following manufacturing industries: semiconductor, wafers, nanotechnology, photo voltaic, data centers,flat panel displays, automotive, aerospace and aviation, food and beverage, building materials, metals and consumer products. Our clientstypically require integrated design and construction services for complex manufacturing systems, including clean rooms, ultrapure water andwastewater systems, chemical and gas systems and production tools. We also provide specialized consulting services to optimize the operatingefficiency and return on investment for complex manufacturing facilities. We leverage our strategic business planning capabilities to helpclients structure and plan their high‑volume manufacturing projects, and to provide follow‑on design and construction services. Our industrialand advanced technology business serves clients in the U.S., Asia, Mexico, South America, Europe, and the Middle East.
Environment and Nuclear
The Environment and Nuclear business group is comprised of three end-market businesses: environmental services, governmentfacilities design and operations services, and nuclear engineering and consulting services. Common to all three end-market businesses are fullservice decontamination, remediation, waste management, design‑build delivery, operations and maintenance management, constructionmanagement and program management capabilities. Our Environment and Nuclear business group performs the majority of CH2M’s projectswith the U.S. federal government and agencies regulated by the U.S. federal government as well as executes a consolidated joint ventureconsulting contract with Canadian Nuclear Laboratories.
7

Table of Contents
Our environmental services business is based upon advanced technology focused on the global sustainability principles of protectinghuman health, preserving the environment, and restoring impacted natural resources. We achieve this mission by offering services throughvarious global practices which include the following: site remediation and revitalization, sustainability consulting, geospatial and environmentaldata management, threat reduction management, munitions response, environmental health and safety compliance, planning and permitting,integrated waste solutions, and environmental engineering. Clients include a broad spectrum of U.S. and state government agencies anddepartments, international public and government clients, and private sector clients. A key differentiator for our services remains ourinnovation and complex problem solving capacities found within and among these global practices. Additionally, a differentiator with both ourgovernment and multinational clients is local project delivery with a global footprint. We are able to effectively and consistently deploy oursystems and processes (especially safety, environmental compliance, and project management) throughout the world with minimal deviation,while addressing the unique local stakeholder and regulatory needs of each client and project.
Our government facilities design and operations services business has historically planned, designed, constructed, operated andmaintained various categories of facilities, installations, and infrastructure at all types of government and military locations. We continue tooffer contingency and logistics, planning and consulting, energy efficiency consulting, engineering and design, design‑build, operations andmaintenance, and program management services to U.S. Department of Defense and other U.S. government agencies.
Our nuclear engineering and consulting services business is comprised of three secondary markets: nuclear remediation anddecommissioning (liabilities management), nuclear power, and national defense. We specialize in the management of complex nuclearprograms and projects around the world. Our experience includes managing and operating nuclear facilities and providing innovative and time-sensitive cleanup and environmental remediation for commercial and government facilities and sites worldwide. We provide programmanagement and program advisory services to national defense and commercial nuclear clients, as well as planning, permitting, and licensing ofnew nuclear energy generating stations. The U.S. Department of Energy and the U.K. Nuclear Decommissioning Authority are our primaryliabilities management clients. However, we have also decommissioned reactors for utilities and research reactors for universities, and we haveworked in the commercial nuclear power sector in countries outside the U.S., including the United Arab Emirates.
Transportation
Our Transportation business group provides horizontal and vertical infrastructure development services for the aviation, highway andbridge, ports and maritime, and transit and rail market sectors. Working with public and private clients around the world, our services supporturbanization and population growth; the safe and efficient movement of people and goods; serviceability of aging infrastructure; resourceextraction; infrastructure resilience to climatic change/dramatic weather events; and signature infrastructure to stimulate regional economicgrowth. We offer a broad portfolio of services, including procurement and technical advisory, transportation planning, environmental studiesand documentation, design engineering, design for design-build, project/program management, construction management, and operations andasset management services. Our Transportation business group performs the majority of our projects for the U.S. federal and internationalgovernments as well as local and municipal transport agencies.
In the aviation sector, we deliver airside and landside services to commercial, general aviation and military airports. For ourmunicipal, state and national government highway and bridge sector clients, we specialize in motorways, freeways and complex interchanges;toll roads/HOT/HOV lanes; highway structures and footbridges; signature bridges and major crossings; highway tunnels; and bike andpedestrian facilities. In the ports and maritime sector, we serve port operators, port authorities, government and private sector clientsdeveloping containerized and cargo terminals; general cargo and break-bulk terminals; petrochemical, energy and mining marine facilities;government and military facilities; intermodal facilities; ferry terminals; urban waterfronts; and cruise line terminals. Our transit and railservices for municipal agencies, national governments and freight operators encompasses high-speed rail; metros and urban transit; commuterrail; light rail, trolleys and streetcars; bus rapid transit; freight rail; and intermodal facilities. Our Transportation business group deliversprojects throughout Asia, Australia, Europe, India, Latin America, South America, the Middle East, and North America.
8

Table of Contents
Water
Our Water business group is comprised of our water business and our urban environments and sports business. Our Water businessgroup performs the majority of our projects with U.S. state and local and international public and government clients, and also supports clientsin the utility, industrial, government, energy, agricultural, and sports sectors.
Our water business provides integrated, sustainable solutions serving the wastewater, drinking water, industrial water, conveyance andstorage, water resources and ecosystem management, and intelligent water solutions industries. Our services include consulting, design andengineering, program management, design build, and operations and maintenance. The integration of our industrial water and operations andmanagement capabilities positions us to serve our clients across all markets and delivery platforms in the geographies in which we focus. Ourbroad portfolio of water solutions help clients address the complex challenges created by extreme climate events, population growth, aginginfrastructure, water supply uncertainty, regulatory changes, and increasing demand. We also work with clients to identify solutions for waterand energy conservation, and to reevaluate processes to achieve cost savings and reduce environmental impacts. We also focus our capabilitieson market drivers such as drought and water scarcity, aging and decaying infrastructure, global climate resiliency, energy water needs andregulatory requirements. Our Water business group delivers projects throughout Asia, Australia, Europe, India, Latin America, South America,the Middle East, and North America.
Our urban environments and sports business delivers large, complex urban projects and programs around the world with focus on thefollowing services: master planning and consulting, economic development planning, project development, land development, programmanagement and community operations. Our urban environments and sports business serves clients in the U.S., South America, Asia, theMiddle East, and Europe.
Power EPC
In our Power EPC segment, we have historically designed and built power generation facilities that produced energy from natural gas,coal, solar, wind, biomass, and geothermal sources. Our portfolio previously included combined‑cycle, simple‑cycle, coal/integratedgasification, clean air, alternative/waste fuels, transmission and cogeneration projects. We also provided services to repower, upgrade, andmodify existing plants to improve performance, reliability and achieve clean air standards.
During the first quarter of 2014, we shifted our focus away from pursuing and contracting fixed-price power EPC projects, and later in2014, in connection with our restructuring activities, we elected to exit the fixed-price power EPC business. We are in the process of closingout our remaining contracted fixed-price power EPC projects. The Company continues to pursue and deliver power-related consulting projectsunder our Energy and Industrial, Water and Environment and Nuclear business groups.
Geographic Areas
We provide services to clients located in numerous countries across the globe. Internally, we divide our operations into six geographicregions: Asia Pacific; Canada; Europe; Central and South America; Middle East, North Africa, and India; and the United States. Although themajority of our consolidated revenue is generated from our domestic operations, we provide services in numerous countries, including Canadawhich accounted for 17% of our total consolidated revenue in 2016 and was primarily related to operations within our Environment and Nuclearsegment. The United Kingdom accounted for 10%, 11% and 10% of our total consolidated revenue in 2016, 2015 and 2014, respectively. TotalU.S. and international revenue for the years ended were as follows:
December 30, December 25, December 31,($ in thousands) 2016 2015 2014U.S. $ 3,304,752 $ 3,589,928 $ 3,806,935International 1,931,192 1,771,577 1,606,534
Total $ 5,235,944 $ 5,361,505 $ 5,413,469
9

Table of Contents
The fixed assets to support our business operations and our clients are located both domestically and internationally. Total U.S. andinternational net property, plant and equipment for the years ended were as follows:
December 30, December 25, December 31,($ in thousands) 2016 2015 2014U.S. $ 225,929 $ 179,436 $ 215,689International 22,503 24,230 42,471
Total $ 248,432 $ 203,666 $ 258,160
Competition
The market for design, consulting, engineering, construction, design‑build, EPC, operations and maintenance, and programmanagement services is highly competitive, fragmented, consolidating and to some extent becoming commoditized. We compete primarilywith large multinational firms and also with smaller firms on contracts within the private industry, national, and state and local governmentsectors. In addition, some of our clients, including government agencies, occasionally utilize their own internal resources to perform design,engineering and construction services where we might have been the service provider.
Numerous mergers and acquisitions in the engineering services industry have resulted in a group of large firms that offer a fullcomplement of single‑source services including studies, designs, construction, design‑build, EPC, operation and maintenance and in someinstances, facility ownership. Included in the current trend is movement towards larger program and contract awards and longer‑term contractperiods for a full suite of services, (e.g., 5 to 20 year full‑service contracts). These larger, longer, more comprehensive contracts requiresubstantially greater financial and human capital than in the past. We believe we can compete effectively for these full service programs.
To our knowledge, no single company or group of companies currently dominates any significant portion of the engineering servicesmarkets. As such, the industry is highly fragmented. Competition in the engineering services industry is based on quality of performance,reputation, expertise, price, technology, customer relationships, range of service offerings and domestic and international geographicdeployment capabilities.
Backlog
Backlog represents the total dollar amount of revenue we expect to earn as a result of performing work under contracts that have beenawarded. Our backlog also reflects the future activities related to consolidated joint ventures. Many of our contracts require us to provideservices that span over a number of fiscal years. U.S. government agencies operate under annual fiscal appropriations by the U.S. Congress andfund various federal contracts only on an incremental basis. The same is true of many state, local and foreign contracts. Our policy is toinclude in backlog the full contract award, whether funded or unfunded. Unexercised options under any contract are not included in ourbacklog. In accordance with industry practice, substantially all of our contracts are subject to cancellation, termination, or suspension at thediscretion of the client.
The following table provides backlog revenue by segment for the years ended December 30, 2016 and December 25, 2015:
($ in millions) 2016 2015Energy and Industrial $ 558 $ 819Environment and Nuclear 4,528 5,844Transportation 888 913Water 2,198 2,562Power EPC 135 181
Total backlog revenue $ 8,307 $ 10,319
The decrease in our backlog revenue as of December 30, 2016 as compared to December 25, 2015 was primarily related to therealization of revenue in 2016 as operations on a large nuclear project in a consolidated Canadian joint venture began late in2015. Additionally, several large design-build-operate water projects approached completion in 2016. The majority of our current backlog willbe performed in 2017 and 2018.
10
Table of Contents
EXECUTIVE OFFICERS OF CH2M
The executive officers of CH2M are listed below, along with their ages, tenure as officer and business background for at least the lastfive years.
Ryan L. Beckman. Age 47. Mr. Beckman is Vice President, Chief Accounting Officer and Controller of CH2M since March 1, 2015. Hepreviously served as Assistant Controller from May 2004 to February 2015. PriortojoiningCH2M,Mr.BeckmanservedinvariousauditingpositionswithErnst&YoungLLPfromSeptember1991toMay2004.
Lisa Glatch. Age 54. Ms. Glatch is the Executive Vice President of Growth and Sales of CH2M since November 2016 and was the ExecutiveVice President of Client Solutions and Sales of CH2M from April 2014 to November 2016. She previously served as Senior Vice President ofGlobal Sales and Vice President of Denver Operations Upstream Oil and Gas Region for Jacobs Engineering Group Inc. (engineering company)from April 2012 through March 2014. From 1986 to 2010, Ms. Glatch was with Fluor Corporation (engineering company) serving in variouscapacities from 1986 through 2010 including the Senior Vice President of Energy and Chemicals from 2009 to 2010. Ms. Glatch is a memberof the Board of Directors of CH2M.
Shelette M. Gustafson. Age 52. Ms. Gustafson is the Chief Human Resources Officer of CH2M since January 2016. She joined CH2M in2007 as a Human Resources Director and served as the Vice President, Global Human Resources Delivery from 2011 to 2015. Ms. Gustafsoncame to CH2M from McDATA Corporation (technology company) where she was Director Human Resources from 2002 to 2007.
Jacqueline C. Hinman. Age 55. Ms. Hinman is the Chairman of the Board of Directors of CH2M since September 2014 and has been thePresident and Chief Executive Officer of CH2M since January 2014. She previously served as the Senior Vice President and President of theInternational Division of CH2M from 2012 to 2014, the President of the Facilities and Infrastructure Division from 2011 until 2012, and theVice President, Major Programs and Executive Director for Mergers and Acquisitions between 2009 and 2010.
Gary L. McArthur. Age 56. Mr. McArthur is the Executive Vice President and Chief Financial Officer of CH2M since August 2014. Prior tojoining CH2M, he served as the Chief Financial Officer of Harris Corporation (international communications and information technologycompany) since 2006, and in various other financial positions since 1997.
Thomas M. McCoy. Age 66. Mr. McCoy is the Executive Vice President, General Counsel and Corporate Secretary of CH2M sinceSeptember 2014. Prior to joining CH2M, he was a partner in the law firm of O’Melveny & Myers since 2011 and from 1977 to 1995. From1995 through 2010, Mr. McCoy served first as the Senior Vice President, General Counsel and Secretary of Advance Micro Devices, Inc.(semiconductor company) and then as the Executive Vice President, Chief Legal and Administrative Officer of Advanced Micro Devices, Inc.
Gregory T. McIntyre. Age 58. Mr. McIntyre is the President of the State & Local Governments Client Sector of CH2M since November 2016and was the President of the Global Business Groups from January 1, 2015 to November 2016. He previously was the Corporate Vice Presidentand Global Market President, Water Business Group in 2014 and 2015, concurrently with the President, Global Business Groups role. Hepreviously served as the Managing Director of CH2M’s International Infrastructure business from 2012 to 2014. Prior to that role, Mr. McIntyreserved as the Managing Director of Halcrow (engineering company), acquired by CH2M in 2011, and a member of its board of directors, andoversaw the integration of the Halcrow operations into CH2M. He was the Deputy Program Manager and CH2M Managing Director for CLMDelivery Partner, the delivery partner to the Olympic Delivery Authority for the London 2012 Olympics and Paralympic Games, between 2010and 2011. Mr. McIntyre is a member of the Board of Directors of CH2M.
Carlo Orsenigo. Age 56. Mr. Orsenigo is the Executive Vice President for Global Project Services of CH2M since November 2016 and was theRegional Managing Director for Latin America from January 2016 to November 2016. Prior to that, he was the Regional Energy Manager inLatin America from December 2012 to January 2016 and the Mexico Country Manager beginning in January 2011. Mr. Orsenigo joined CH2Min August 2010.
Terry Ruhl. Age 50. Mr. Ruhl is the President of the National Governments Client Sector of CH2M since November 2016 and was thePresident of the Transportation Business Group from July 2012 to November 2016. Prior to that, he served as the Senior Vice President of theTransportation Business Group and Director of Consulting and International Operations from June 2009 to July 2012, the Global Market SectorDirector from June 2008 to June 2009 and the Aviation Market Sector Director from August 2006 to June
11
Table of Contents
2008. Mr. Ruhl’s tenure with CH2M spans twenty-four years. Mr. Ruhl is a member of the Board of Directors of CH2M.
Matthew Sutton. Age 57. Mr. Sutton is the President of the Private Client Sector of CH2M since November 2016 and was the President of theEnvironment and Nuclear Business Group from March 2016 to November 2016. He previously served as President of Aecom’s (engineeringcompany) environmental business from 2011 to 2016 and as Executive Vice President and Director of Operations of Arcadis (engineeringcompany) from 2008 to 2011.
There are no family relationships among the executive officers or directors of CH2M. The executive officers are elected by the Boardof Directors each year and hold office until the organizational meeting of the Board in the next subsequent year and until his or her successor ischosen or until his or her earlier death, resignation or removal.
Available Information
For information regarding our company, including free copies of filings with the Securities and Exchange Commission (“SEC”),please visit our web site at ir.ch2m.com. The SEC filings, which include our Annual Reports on Form 10‑K, Quarterly Reports on Form 10‑Q,and Current Reports on Form 8‑K are made available as soon as practicable after they are filed with the SEC. The information on our website isnot, and shall not be deemed to be, a part hereof or incorporated into this or any of our other filings with the SEC.
Item 1A. Risk Factor s
You should carefully consider the following factors and other information contained in this Annual Report on Form 10‑‑K before decidingto invest in our common stock.
Risks Related to Our Business
The restatement of our previously issued financial statements may lead to additional expenses, risks and uncertainties and could have amaterial adverse effect on our business, results of operation and financial condition.
As discussed in an amendment to our Form 10-K for the fiscal year ended December 25, 2015 as filed with the Securities ExchangeCommission on January 19, 2017, we previously restated our unaudited consolidated financial statements as of and for the quarterly periodsended June 26, 2015, September 25, 2015 and December 25, 2015. As a result of these restatements, we have become subject to a number ofadditional costs and risks, including unanticipated costs for accounting and legal fees in connection with or related to the restatement and theremediation of our ineffective disclosure controls and procedures and material weakness in internal control over financial reporting. In addition,the attention of our management team has been diverted by these efforts. We could be subject to additional stockholder, governmental, or otheractions in connection with the restatement or other matters. Any such proceedings will, regardless of the outcome, consume management’s timeand attention and may result in additional legal, accounting, insurance and other costs. If we do not prevail in any such proceedings, we couldbe required to pay substantial damages and settlement costs. In addition, the restatement and related matters could impair our reputation orcould cause our counterparties to lose confidence in us. Each of these occurrences could have a material adverse effect on our business, resultsof operations and financial condition.
We have identified a material weakness in our internal control over financial reporting and our disclosure controls and procedures whichcould result in additional material misstatements in our consolidated financial statements.
Our management is responsible for establishing and maintaining adequate disclosure controls and procedures and internal control overour financial reporting. As disclosed in an amendment to our Form 10-K for the fiscal year ended December 25, 2015, management identified amaterial weakness in our internal control over financial reporting and determined our disclosure controls and procedures were not effective as ofDecember 25, 2015. A material weakness is a deficiency, or a combination of deficiencies, in internal control over financial reporting, such thatthere is a reasonable possibility that a material misstatement of our annual or interim consolidated financial statements will not be prevented ordetected on a timely basis. As disclosed in Item 9A of this Annual Report on Form 10-K, we determined that this previously identified materialweakness continues to affect our internal control over financial reporting and, as a result of such material weakness, our disclosure controls andprocedures were not effective as of December 30, 2016.
We have developed a remediation plan to address the material weakness in internal control over financial reporting and
12

Table of Contents
ineffective disclosure controls and procedures. If our remedial measures are not effectively designed or implemented, we may not be able toaccurately and timely report our financial results, which could materially and adversely affect our business, results of operations, and financialcondition, require us to expend significant resources to correct the weaknesses or deficiencies, harm our reputation, impact our ability to requestthe issuance of new loan advances under our Third Amendment to our Amended and Restated Credit Agreement (“Amended CreditAgreement”) or otherwise cause a decline in investor confidence. As a result, our business could decline or our ability to fund ongoingoperations could be adversely affected, which would adversely affect our liquidity and results of operations.
Project losses and other adverse operating results can constrain our cash flow and liquidity, which could reduce our ability to win newbusiness or materially and adversely affect our business and results of operations, and our strategic initiatives may not be successful.
We have experienced project losses and other adverse operating results in recent periods - such as a charge to operations of$121.3 million, $93.6 million, and $38.7 million for the years ended December 30, 2016, December 25, 2015 and December 31, 2014,respectively, for estimated cost growth on a fixed-price contract to design and construct roadway improvements on an expressway in thesouthwestern United States and a charge to operations of $301.5 million and $280.0 million for the years ended December 30, 2016 andDecember 31, 2014, respectively, for estimated costs growth identified for our consolidated Australian joint venture project - which hasconstrained our cash flow and liquidity. If we sustain additional project losses or other adverse operating results in the future, or if cash flowand liquidity continue to be constrained, we may have a reduced ability to win new business, which could materially and adversely affect ourbusiness, results of operations, cash flows and financial position.
We may not be able to recover all or a portion of our project losses, and we could be found liable to the client or general contractor, inconnection with a fixed-price EPC project that was terminated in early 2017.
Prior to 2017, through a consolidated joint venture partnership with an Australian construction contractor, we were involved in aconsortium with a major U.S. power plant equipment supplier engaged in a fixed-price EPC project with a general contractor to engineer,procure, construct and start-up a combined cycle power plant to supply power to a large liquefied natural gas facility in Australia. The jointventure experienced project losses resulting in a charge to operations of $301.5 million and $280.0 million for the years ended December 30,2016 and December 31, 2014, respectively, of which our portion of the loss was $154.1 million and $140.0 million, respectively. In 2015, theconsortium reached agreement with the client to settle certain claims to recover costs and extend the amount of time allowed to completeinterim delivery milestones for the project. During the second quarter of 2016, however, the client advised that it would be unable to meet itsobligations in line with the revised program schedule. As a result, the project experienced delays and was expected to incur additional futuredelays resulting in increases in the total estimated costs to complete. On January 24, 2017, the consortium terminated the fixed-price EPCcontract with the general contractor. The consortium expects to file arbitration claims against the general contractor, and anticipates that thegeneral contractor will file claims against the consortium or its members.
We expect the arbitration process to be lengthy and at this time we are unable to predict the timing of resolution or the outcome ofdisputes. The ultimate outcome of the dispute will depend upon contested issues of fact and law. We cannot currently predict whether we willrealize any recoveries from the general contractor or the amount of any recoveries that we may ultimately receive. Moreover, we cannotcurrently predict whether either or both our consolidated joint venture partnership or the consortium will be held liable to the general contractoror the amount of any such liability should it occur. The timing and amount of any recoveries or liabilities is currently unknown and will besubject to negotiations, arbitration or other formal dispute-resolution processes and could be materially adverse to our results of operations, cashflow and financial condition.
If we are unable to continue to access credit or raise capital on acceptable terms, our business may be adversely affected.
Our primary sources of liquidity are cash flows from operations and borrowings under our Amended Credit Agreement. Our primaryuses of cash are working capital, stock repurchases primarily in our internal market, capital expenditures, and acquisitions. Cash flows fromoperations primarily result from earnings on our operations and changes in our working capital. Earnings from our operations and our workingcapital requirements can vary significantly from period to period based primarily on the mix of our projects underway and the percentage ofproject work completed during the period. For example, cash used in operations for the year ended December 30, 2016 was $245.5 million. While we manage cash requirements for working capital needs, unpredictability in cash collections and payments has required us in the past andmay require us in the future to borrow on our Amended Credit Agreement from time to time to meet the needs of our operations.
13
Table of Contents
Our borrowing capacity under the Third Amendment to our Amended Credit Agreement is limited by a maximum consolidatedleverage ratio, which is based on a multiple of our adjusted earnings before interest, taxes, depreciation and amortization, and other outstandingobligations of the Company. Moreover, the Certificate of Designation for our Series A Preferred Stock (the “Certificate of Designation”) limitsour ability to incur additional debt under certain circumstances without the consent of the holders of at least a majority of the then outstandingshares of our Series A Preferred Stock. As of December 30, 2016, the remaining unused borrowing capacity under the Amended CreditAgreement was approximately $107.4 million. While we believe our borrowing capacity is sufficient to fund our near-term operations andcapital requirements, due to liquidity constraints we expect to continue to limit our discretionary cash outlays to repurchase stock offered forsale on our internal market. See Item 1A. Risk Factors – Risks Related to Our Internal Market .
The Amended Credit Agreement and the Certificate of Designation may contain covenants that limit or restrict our operations and requirethat we comply with certain financial ratios.
The Amended Credit Agreement contains customary affirmative and negative covenants, some of which limit or restrict our operationsincluding our ability to incur additional indebtedness and other obligations, grant liens to secure obligations, make investments, merge orconsolidate and dispose of assets, subject to certain customary exceptions. These restrictions could limit our ability to plan for or react tomarket or economic conditions or meet capital needs or otherwise restrict our activities or business plans, and could adversely affect our abilityto finance our operations, acquisitions, investments or strategic alliances or other capital needs or limit our ability to take advantage of businessopportunities.
In addition, our Amended Credit Agreement requires that we comply with a minimum consolidated fixed charge coverage ratio, andboth our Amended Credit Agreement and the Certificate of Designation require that we comply with a maximum consolidated leverageratio. Our ability to comply with these ratios depends on our results of operations from time to time, which may be affected by events beyondour control. If we fail to satisfy the requirements of or if we are in default of the Amended Credit Agreement, we would be prohibited fromincurring further borrowings under the Amended Credit Agreement unless we were able to secure necessary waivers from the lenders. If thelenders declined to waive a default under the Amended Credit Agreement, our outstanding indebtedness under the Amended Credit Agreementcould be accelerated. Further, if our consolidated leverage ratio exceeds certain limits specified in the Certificate of Designation, we may beunable to incur additional indebtedness.
Any of the factors could have a material adverse impact on our business, our results of operations, cash flow and financial condition.
We may be unable to amend our Amended Credit Agreement or maintain or expand our credit capacity, each of which would adverselyaffect our operations and business.
We use credit facilities to support our working capital and acquisition needs. If we exhaust our borrowing capacity or if we are unableto increase the available borrowing capacity of the Amended Credit Agreement, our ability to fund the working capital and other needs of ourexisting operations could be constrained and our business and results of operations could be materially adversely affected. In addition, ourcredit facility reaches maturity in 2019 and there is no guarantee that we will be able to renew our credit facility on favorable terms or at all, and, if we are unable to do so, our costs of borrowing and our business may be adversely affected. There can be no assurance that we will beable to secure any additional capacity or amendment to our Amended Credit Agreement or to do so on terms that are acceptable to us, in whichcase, our costs of borrowing could rise and our business and results of operations could be materially adversely affected.
Our new awards and liquidity may be adversely affected by bonding and letter of credit capacity.
A portion of our new awards requires the support of bid and performance surety bonds or letters of credit, as well as advance paymentand retention bonds. Our primary use of surety bonds is to support water and wastewater treatment in the U.S., while letters of credit aregenerally used to support other projects. The issuance of surety bonds is at our sureties’ sole discretion and sureties rely on tangible net worthas an indication of risk when deciding whether to issue a requested surety bond. We currently have a negative tangible net worth, which ifsignificantly expanded could limit our bonding capacity or require us to use more of our letters of credit under our credit facility. If we arerequired to utilize our credit facility for letters of credit, the amount available under the credit facility for other purposes, includingcompensating for any swings in working capital could be adversely affected. Further, if we are unable to procure such surety bonds or useletters of credit, our ability to win new business and achieve our business plans could be adversely impacted, which would have a materialadverse effect on our growth, liquidity and financial condition.
14

Table of Contents
An impairment of some or all of our goodwill and intangible assets could have a material adverse effect on our financial condition andresults of operations.
As of December 30, 2016, we had $477.8 million of goodwill and $38.0 million of net intangible assets. We conduct a test forimpairment of goodwill as of the first day of the fourth quarter of each year or if an event occurs or circumstances change that would morelikely than not reduce the fair value of a reporting unit below its carrying amount. If the future fair value of any of our reporting units is lessthan their carrying value, we are required to record an impairment charge. The amount of any impairment charge could be significant and couldhave a material adverse effect on our financial condition and results of operations.
Unpredictable economic cycles, uncertain demand for our engineering and related services, and failure by our major customers to pay ourfees, could cause our revenue to fluctuate or be uncollectible.
Demand for our engineering and other services is affected by the general level of economic activity in the markets in which weoperate, both inside and outside of the U.S. Our customers and the markets in which we compete to provide services are likely to experienceperiods of economic decline from time‑to‑time. For example, the most recent global economic downturn and governmental tax revenuedeclines resulted in a slowdown in demand for our services from local government clients. Similarly, the decline in oil, gas and othercommodity prices in beginning in 2014 and continuing throughout 2016 has negatively affected demand for certain of our services and haspressured pricing.
Adverse economic conditions may decrease our customers’ willingness to make capital expenditures or otherwise reduce theirspending for our services, which could result in diminished revenue and margins for our business. The demand for services depends on thedemand and capital spending of our customers in their target markets, some of which are cyclical in nature. Adverse economic conditions couldalter the overall mix of services that our customers seek to purchase, and increased competition during a period of economic decline could forceus to accept contract terms that are less favorable to us than we might be able to negotiate under other circumstances. Changes in our mix ofservices or a less favorable contracting environment may cause our revenue and margins to decline. Moreover, our customers impacted by theeconomic downturn could delay or fail to pay our fees. If a customer failed to pay a significant outstanding fee, our financial results could beadversely affected. Adverse credit market conditions could negatively impact our customers’ ability to fund their projects and therefore utilizeour services; they can also impact subcontractors’ and suppliers’ ability to deliver work. These credit disruptions could negatively impact ourbacklog and profits, and could increase our costs or adversely impact project schedules.
The uncertainties involved in prolonged procurement processes associated with our projects make it particularly difficult to predictwhether and when we will receive a contract award. The uncertainty of contract award timing can present difficulties in matching ourworkforce size with our project needs. If an expected project award is delayed or not received, we could incur costs resulting from idleworkforce reductions in staff, or redundancy of facilities that would have the effect of reducing our profits.
Changes and fluctuations in the U.S. government’s spending priorities could adversely affect our revenue expectations.
Because a substantial part of our overall business is generated either directly or indirectly as a result of U.S. federal, state and localgovernment regulatory and infrastructure priorities, shifts in these priorities due to changes in policy imperatives, changes in elected officialsfollowing elections or changing economic conditions are often unpredictable and may affect our revenue.
Our contracts with the U.S. federal government are subject to the uncertainties of U.S. Congressional funding. Since governmentcontracts represent a significant percentage of our revenue, government budget deficits or a significant reduction in government funding couldlead to continued delays in contract awards and termination or suspension of our existing contracts, which could have an adverse impact on ourbusiness, financial condition and results of operations. In addition, any government shutdown or other curtailment of funding, such as the U.S.federal government shutdown in October 2013, could have an impact on our government projects including our ability to earn revenue on theprojects already awarded, and could have an adverse impact on us.
Effective March 1, 2013, the Budget Control Act of 2011 imposed a process known as sequestration to implement $1.2 trillion inautomatic spending cuts effective through fiscal year 2021, subsequently extended to 2023. Under sequestration the agencies of the U.S. federalgovernment may be required to modify or terminate contracts and substantially reduce awards of new work to companies like us, which willlikely impact our ability to earn revenue on projects already awarded, win new work from U.S. federal government customers and may have anadverse impact on us. In December 2015, Congress and the President enacted a two year budget agreement that removed the threat ofsequestration in the U.S. federal government’s fiscal 2016 and 2017 budgets, but
15

Table of Contents
absent a future budget agreement, the full effect of sequestration could return in the U.S. federal government’s 2018 budget. Because some ofthe spending cuts under the Act are continuing and others could be reinstated in future years, the U.S. federal government spending limitationsand reductions from sequestration may continue to affect our operations in the foreseeable future.
Political instability in key regions around the world coupled with the U.S. federal government’s commitment to the war on terror put atrisk U.S. federal discretionary spending, such as spending on infrastructure projects that are of particular importance to our business. At thestate and local levels, the need to compensate for reductions in federal matching funds, as well as financing of federal unfunded mandates,creates pressures to cut back on infrastructure project expenditures. As a result, there can be no assurances that changing U.S. governmentpriorities and spending would not have a material adverse impact on our business.
Government contracts present risks of termination for convenience, adjustment of payments received, restrictions on ability to compete forgovernment work and funding constraints.
The following risks are inherent in contracts with the U.S. federal government and agencies regulated by the U.S. federal government,which represents 21% of our total revenue for fiscal 2016:
· Because U.S. federal laws permit government agencies to terminate a contract for convenience, our U.S. government clients mayterminate or decide not to renew our contracts with little or no prior notice.
· Due to payments we receive from our U.S. government clients, our books, records and processes are subject to audit by variousU.S. governmental agencies for a number of years after these payments are made. Based on these audits, the U.S. governmentmay adjust or demand repayment of payments we previously received, or withhold a portion of fees due to us because ofunsatisfactory audit outcomes. Audits have been completed on our U.S. federal contracts through December 31, 2010, and arecontinuing for subsequent periods. Audits performed to date have not resulted in material adjustments to our financial statements,however, there can be no assurance that future audit findings will not result in repayments or disqualification of ourprocesses/systems, which could impact our ability to bid or win future U.S. government contract work. In addition, as agovernment contractor, we are subject to increased risks of investigation, criminal prosecution and other legal actions andliabilities to which purely private sector companies are not. The results of any such actions could adversely impact our businessand have an adverse effect on our consolidated financial statements .
· Our ability to earn revenue from our existing and future U.S. federal government projects will depend upon the availability offunding from U.S. federal government agencies. We cannot control whether those clients will fund or continue funding ourexisting projects.
· In years when the U.S. federal government does not complete its budget process before the end of its fiscal year on September 30,government operations are typically funded pursuant to a “continuing resolution” that authorizes agencies of the U.S. governmentto continue to operate, but does not authorize new spending initiatives, which can delay the award of new contracts. These delayscould have an adverse effect on our operating results.
· Many U.S. federal government programs in which we work require security clearances. Security clearances can be difficult andtime‑consuming to obtain. If we or our employees are unable to obtain or retain necessary security clearances, we may not be ableto win new business or may not be able to renew existing contracts. To the extent we cannot obtain or maintain the requiredsecurity clearances for our employees working on a particular contract, we may not derive the revenue anticipated from thecontract, which could adversely affect our business and results of operations.
Our ability to secure new government contracts and our revenue from existing government contracts could be adversely affected byany one or a combination of the factors listed above.
Many of our projects are funded by U.S. federal, state and local governments, and if we violate applicable laws governing this work, wewould be subject to the risk of suspension or debarment from government contracting activities, which could have a material adverse effecton our business and results of operations.
If we fail to comply with the terms of one or more of our government contracts or adhere to the statutes and regulations that governthis type of work, or if we or our employees are indicted or convicted on criminal charges (including misdemeanors) relating to any of ourgovernment contracts, in addition to any civil or criminal penalties and costs we may incur, we could be suspended or debarred fromgovernment contracting activities for a period of time. Some U.S. federal and state statutes and regulations provide for automatic debarment incertain circumstances. The suspension or debarment in any particular case may be limited to the facility, contract or subsidiary involved in theviolation or could be applied to our entire enterprise in certain severe circumstances. Even a
16

Table of Contents
narrow scope suspension or debarment could result in negative publicity that could adversely affect our ability to renew contracts and to securenew contracts, both with governments and private customers, which could materially and adversely affect our business and results of operations.
We may incur additional restructuring charges in future periods.
During the third quarter of 2016, we began a process to review the structure and resources within our business segments and formulatea restructuring plan to more fully align global operations with the Company’s client-centric strategy, including a simplified organizationstructure and streamlined delivery model to achieve higher levels of profitable growth. The restructuring activities have included workforcereductions and facilities consolidations. During the year ended December 30, 2016, we incurred $42.2 million of costs for these restructuringactivities, which have been included in general and administration expense on the consolidated statement of operations. Overall, we expect toincur up to approximately $50.0 million to $70.0 million in total restructuring charges related to employee severance and termination benefitsand facilities consolidation costs. We expect the 2016 Restructuring Plan to be complete by in the first half of 2017 and to result in aggregateannual cost savings of approximately $100.0 million.
These restructuring activities may result in a diversion of management’s attention from ongoing business, a loss of key personnel and aloss of clients, all of which could disrupt our operations. If these restructuring activities are not completed in a timely manner, if we incur coststhat are higher than originally or if anticipated cost savings, synergies, and efficiencies are not realized, there could be a material adverse impacton our business, financial condition, and results of operations.
The results of the United Kingdom’s referendum on a withdrawal from the European Union may have a negative effect on our business,results of operation and financial condition .
On June 23, 2016, the United Kingdom held a referendum in which a majority of the voters elected to withdraw from the European
Union, commonly referred to as “Brexit.” It is expected that the United Kingdom will exit the European Union within two years; although, theexact timeframe for such exit is unknown. Nevertheless, the referendum has created significant uncertainty about the future relationshipbetween the United Kingdom and the European Union, and may adversely affect global economic conditions and the stability of global financialmarkets. Asset valuations, currency exchange rates and credit ratings may be especially subject to increased market volatility. Lack of clarityabout future United Kingdom laws and regulations as the United Kingdom determines which European Union laws to replace or replicate in theevent of a withdrawal could depress economic activity and restrict our access to capital. Changes in leadership and public sector infrastructurefunding could lead to cancellations, delays or changes in timing to our current and prospective infrastructure projects in the UnitedKingdom. These factors, among others, could potentially materially affect our business, results of operations and financial condition.
Our industry is highly competitive.
We are engaged in a highly competitive business in which most of our contracts with public sector clients are awarded through acompetitive bidding process that places no limit on the number or type of potential service providers. The process usually begins with agovernment agency request for proposal that delineates the size and scope of the proposed contract. The government agency evaluates theproposals on the basis of technical merit and cost.
In both the private and public sectors, acting either as a prime contractor or as a subcontractor, we may join with other firms that weotherwise compete with to form a team to compete for a single contract. Because a team can often offer stronger combined qualifications thanany firm standing alone, these teaming arrangements can be very important to the success of a particular contract competition orproposal. Consequently, we maintain a network of relationships with other companies to form teams that compete for particular contracts andprojects. Failure to maintain technical and price competitiveness, as well as failure to maintain access to strong teaming partners may adverselyimpact our ability to win work.
Our backlog is subject to unexpected adjustments and cancellations and may, therefore, be an uncertain indicator of our futureperformance.
Our backlog represents the total dollar amount of revenue we estimate we will earn as a result of performing work under contracts thathave been awarded. We cannot assure that the revenue projected in our backlog will be realized or, if realized, will result in profits. Projectsmay remain in our backlog for an extended period of time prior to project execution and, once project execution begins, it may occur unevenlyover multiple periods. In addition, our ability to earn revenue from our backlog depends on
17

Table of Contents
the availability of funding for various government and private clients. Most of our contracts with industrial clients have termination forconvenience provisions. Further, even if we provide services under the relevant contract, it is possible that the customer may default orotherwise refuse to pay amounts owed to us. Therefore, project terminations, contract suspensions or reductions in scope, or defaults inpayment may occur from time‑to‑time with respect to contracts reflected in our backlog, which in turn would adversely affect the revenue andprofit we actually receive from contracts reflected in our backlog. Future project cancellations and scope adjustments could further reduce thedollar amount of our backlog and the revenue and profit that we actually earn.
Backlog is not a measure defined in U.S. generally accepted accounting principles (“U.S. GAAP”), and our methodology fordetermining backlog may not be comparable to the methodology used by other companies in determining their backlog. The amount of backlogis not necessarily indicative of our future earnings or cash flows.
Our inability to attract and retain professional personnel could adversely affect our business.
Our ability to attract, retain and expand our staff of qualified engineers and technical professionals will be an important factor indetermining our future success and growth. The market for these professionals is competitive inside and outside the U.S. We lost veteranmanagers and engineers through the reduction in force and voluntary retirement programs we initiated in 2014 and continued through 2016 aspart of our planned restructuring activities. As some of our existing key personnel approach retirement age, we are developing andimplementing proactive succession plans. If we cannot attract and retain qualified personnel, or if we cannot effectively implement oursuccession plans, we could experience a material adverse impact on our business, financial condition, and results of operations. Since we derivea significant part of our revenue from services performed by our professional staff, our failure to retain and attract professional staff couldadversely affect our business by impacting our ability to complete our projects and secure new contracts.
We face potential liability for faulty engineering services and we are subject to potential liability in other litigation, regulatory and legalproceedings.
Our engineering practice involves professional judgments regarding the planning, design, development, construction, operations andmanagement of industrial facilities and public infrastructure projects. Because our projects are often large and can affect many people, ourfailure to make judgments and recommendations in accordance with applicable professional standards could result in large damages and,perhaps, punitive damages. Although we have adopted quality control, risk management and risk avoidance programs designed to reducepotential liabilities, and carry professional liability insurance to further set off this risk, there can be no assurance that such programs willprotect us fully from all risks and liabilities.
We are also a party to other lawsuits and other legal and regulatory proceedings that arise in the normal course of business, includingemployment‑related claims and contractual disputes. While we do not currently believe that any pending lawsuits or proceedings will have amaterial adverse effect on our results of operations or financial condition, there can be no assurance that this will not be the case.
Fluctuations in commodity prices may affect our customers’ investment decisions and therefore subject us to risks of cancellation or delaysin existing work, or changes in the timing and funding of new awards.
Commodity prices can affect our customers and may have a significant impact on the costs and profitability of our projects. Forexample, for projects that we perform on a guaranteed fixed price or “not to exceed” cost basis, unforeseen rising commodity prices can reduceour profit or cause us to incur a loss. Further, rising commodity prices can negatively impact the potential returns on investments for ourcustomers and may lead to customers deferring new investments or canceling or delaying existing projects. Some of our customers are engagedin the production or processing of commodity products, particularly in the energy sector, and fluctuations in commodity prices can impact theirbusiness and their willingness to make new capital investments, which in turn may reduce demand for our services. Cancellations, delays andweakness in demand for our services in markets that are affected by commodity price fluctuations may affect our operating results in significantand unpredictable ways and could have a material adverse impact on our business, financial condition, and results of operations.
Changes in the level of activity in the hydrocarbon industry may adversely affect our financial condition and results of operations.
Demand for our oilfield services and other services we provide to the hydrocarbon industry fluctuates, and depends in part ondecisions by our customers about their current and future activities and expenditures which, in turn, depend largely upon prevailing industry andmarket conditions that are influenced by numerous factors over which we have no control, including, but not limited to:
18
Table of Contents
· Current and projected prices of oil and natural gas and hydrocarbon products;· Oil and natural gas supply and demand in different geographic areas around the world;· Cost of exploring for, developing, producing and delivering oil and natural gas;· Availability of qualified personnel and lead times associated with acquiring equipment and products;· Federal, state and local regulation of oilfield activities;· Environmental concerns regarding oil and natural gas exploration and production activities and methods; and,· Seasonal limitations on access to work locations.
Anticipated future prices for natural gas and crude oil are a primary factor affecting activity and expenditure levels of our customers inthe hydrocarbon industry. Lower prices or volatility in prices for oil and natural gas, as has recently occurred, typically decrease spending anddrilling activity, which can cause rapid and material declines in demand for our oilfield services and in the prices we are able to charge for ourservices. Worldwide political, economic, military and terrorist events, as well as natural disasters and other factors beyond our controlcontribute to oil and natural gas price levels and volatility and are likely to continue to do so in the future.
We could sustain losses on contracts that contain a fixed price or guaranteed maximum price provision if our costs exceed the maximumprices.
Under fixed price contracts, we agree to deliver projects for a definite, predetermined price and under guaranteed maximum pricecontracts, we agree to deliver projects for a price that is capped regardless of our actual costs incurred over the life of the project. Under costreimbursable contracts with maximum pricing provisions, we are typically compensated for the labor hours expended at agreed‑upon hourlyrates plus cost of materials plus any subcontractor costs used; however, there is a stated maximum compensation for the services to be providedunder the contract. Many fixed-price or guaranteed maximum price contracts are for large industrial facilities and public infrastructure projectsand present the risk that our costs to complete a project may exceed the guaranteed maximum or fixed-price agreed upon with the client. Thefees negotiated for such projects may not cover our actual costs and desired profit margins. In addition, many of our customers on fixed ormaximum price contracts do not accept escalation clauses regarding labor or material cost increases, including commodity price increases. Ifour actual costs for a maximum price project or fixed-price project are higher than we expect, as has occurred in recent years, our profit marginson the project will be reduced or we could suffer a loss that could materially affect our results of operations .
Our use of the percentage‑‑of‑‑completion method requires the use of estimates and changes in those estimates could result in a reduction orreversal of previously recorded revenues and profits.
The revenue for our engineering and construction contracts is accounted for on the percentage‑of‑completion method ofaccounting. This method of accounting recognizes revenue and profit over the duration of the contract, generally based on the proportion ofcosts incurred to date, to the total costs expected to be incurred for the project. Revised estimates of costs and contract revenue are recordedwhen they are known or can otherwise be reasonably estimated. The inherent uncertainties in the estimating process make it possible for actualcost and revenue to vary materially from prior estimates, which can result in the reduction or reversal of previously recorded revenues andprofits.
Environmental regulations and related compliance investigations may adversely impact our project performance, expose us to liability andcould adversely affect our revenue.
A substantial portion of our business is generated either directly or indirectly as a result of laws and regulations related toenvironmental matters. In particular, our business involves significant risks including the assessment, analysis, remediation, handling,management and disposal of hazardous substances. As a result, we are subject to a variety of environmental laws and regulations governing,among other things, discharges of pollutants and hazardous substances into the air and water and the handling and disposal of hazardous wasteincluding nuclear materials and related record keeping requirements. These laws and regulations and related investigations into our compliance,as it pertains to facility operations and remediation of hazardous substances, can cause project delays and substantial management timecommitment and may significantly add to our costs. Violations of these environmental laws and regulations could subject us to civil andcriminal penalties and other liabilities, which can be very large. Although we have not been subject to any material civil or criminal penaltiesfor violations of these laws to date, we have incurred costs and diverted resources to respond to reviews that have negatively impacted theprofitability of some of our projects. While the costs of these reviews have not been material to our consolidated results of operations in thepast, additional or expanded reviews or proceedings on environmental compliance, or any substantial fines or penalties, could affect ourprofitability and our stock price in the future, or could
19
Table of Contents
adversely affect our ability to compete for new business. Changes in environmental regulations could affect our business more significantlythan other firms. Accordingly, a reduction in the number or scope of these laws and regulations, or changes in government policies regardingthe funding, implementation or enforcement of such laws and regulations, could significantly reduce one of our most important markets andlimit our opportunities for growth or reduce our revenue. In addition, any effort by government agencies to reduce the role of privatecontractors in regulatory programs, including environmental compliance projects, could have material adverse effects on our business.
We may not be successful in growing through acquisitions or integrating effectively any businesses and operations we may acquire.
Our success depends in part on our ability to continually enhance and broaden our service offerings and our service delivery footprintin response to changing customer demands, technology, and competitive pressures. Numerous mergers and acquisitions in our industry haveresulted in a group of larger firms that offer a full complement of single source services including studies, design, engineering, procurement,construction, operations, maintenance, and facility ownership. To remain competitive, we may acquire new and complementary businesses toexpand our portfolio of services, add value to the projects undertaken for clients or enhance our capital strength. We do not know if we will beable to complete any future acquisitions or whether we will be able to successfully integrate any acquired businesses, operate them profitably, orretain their key employees.
When suitable acquisition candidates are identified, we anticipate significant competition when trying to acquire these companies, andthere can be no assurance that we will be able to acquire such acquisition targets at reasonable prices or on favorable terms. The Certificate ofDesignation also limits our ability to conduct certain acquisitions by requiring the consent of the holders of a majority of the outstanding sharesof our Series A Preferred Stock before a proposed acquisition can be approved. If we cannot identify or successfully acquire suitableacquisition candidates, we may not be able to successfully expand our operations. Further, there can be no assurance that we will be able togenerate sufficient cash flow from an acquisition to service any indebtedness incurred to finance such acquisitions or realize any otheranticipated benefits. In addition, there can be no assurance that the due diligence undertaken in connection with an acquisition will uncover allliabilities relating to the acquired business. Nor can there be any assurance that our profitability will be improved as a result of theseacquisitions. Any acquisition may involve operating risks, such as:
· The difficulty of assimilating the acquired operations and personnel and integrating them into our current business;· The potential impairment of employee morale;· The potential disruption of our ongoing business;· Preserving important strategic and customer relationships;· The diversion of management’s attention and other resources;· The risks of entering markets in which we have little or no experience;· The possibility that acquisition related liabilities that we incur or assume may prove to be more burdensome than anticipated;· The risks associated with possible violations of the Foreign Corrupt Practices Act, the United Kingdom Bribery Act of 2010, and
other anti‑corruption laws as a result of any acquisition or otherwise applicable to our business; and,· The possibility that any acquired firms do not perform as expected .
The success of our joint ventures depends on the satisfactory performance by our joint venture partners. The failure of our joint venturepartners to perform their obligations could impose on us additional financial and performance obligations that could result in reducedprofits or significant losses on the projects that our joint ventures undertake.
We routinely enter into joint ventures as part of our business. The success of these joint ventures depends, in large part, on thesatisfactory performance of our joint venture partners. If our joint venture partners fail to satisfactorily perform their joint venture obligationsas a result of financial or other difficulties, the joint venture may be unable to adequately perform or deliver its contracted services. Under thesecircumstances, we may be required to make additional investments and provide additional services to ensure the adequate performance andproject delivery. These additional obligations could result in reduced profits or, in some cases, significant losses for us with respect to the jointventure.
Occasionally, we participate in joint ventures where we are not a controlling party. In such instances we may have limited control overjoint venture decisions and actions, including internal controls and financial reporting, which may have an adverse impact on our business.
20

Table of Contents
We may be restricted in our ability to access the cash flows or assets from our subsidiaries and joint venture partners upon which we aresubstantially dependent.
Substantially all of our cash flows and liquidity necessary to meet our operating expenditures and to participate in our internal marketare generated by our subsidiaries. Our ability to access these necessary cash flows may be restricted by certain rules and regulations regardingthe financial condition and operational requirements imposed on our foreign subsidiaries that may limit our ability to gain access to the cashflows or assets of these entities. We do not manage all of these entities. Even in those joint ventures that we manage, we are often required toconsider the interests of our joint venture partners in connection with decisions concerning the operations of the joint ventures. Our ability toaccess cash flows from our joint ventures may be restricted by certain rules and regulations imposed on our foreign joint ventures and by jointventure arrangements that may restrict us from gaining access to the cash flows or assets of these entities. As of December 30, 2016,$46.6 million of our cash included in our consolidated balance sheet was held in bank accounts of our consolidated joint ventures.
Our dependence on subcontractors and equipment manufacturers could adversely affect us.
We rely on third party subcontractors as well as third party equipment manufacturers to complete our projects. To the extent that wecannot engage subcontractors or acquire equipment or materials, our ability to complete a project in a timely fashion or at a profit may beimpaired. If the amount we are required to pay for these goods and services exceeds the amount we have estimated in bidding for fixed pricecontracts, we could experience losses in the performance of these contracts. In addition, if a subcontractor or a manufacturer is unable todeliver its services, equipment or materials according to the negotiated terms for any reason, including the deterioration of its financialcondition, we may be required to purchase the services, equipment or materials from another source at a higher price or on less favorableterms. These risks are potentially more significant in an economic downturn if financial difficulties in our supply chain cause oursubcontractors or equipment suppliers not to be able to support the demands and schedules of our business. This may reduce the profit weexpect to realize or result in a loss on a project for which the services, equipment or materials were needed.
Our defined benefit pension plans have significant deficits that may grow in the future; deficits require payments over time to meet anyunderfunded benefit obligations under these plans which can create volatility in our cash flows from operations.
As a result of our acquisition of Halcrow, the Company acquired defined benefit pension plans (also known as “defined benefitpension schemes”) that have significant deficits. The ongoing funding obligations for the defined benefit pension plans vary from time to timedepending on actuarial assumptions outside of the Company’s control, such as discount rates, inflation rates, plan investment returns, and lifeexpectancy of the plan members. Additionally, certain transactions, such as the October 4, 2016 transaction to restructure the benefits providedto members of the Halcrow Pension Scheme, one of our defined benefit pension schemes, may change our funding obligations. In order tomaintain an adequate funding position over time, the Company continuously reviews these assumptions and mitigates these risks by workingwith the pension plan trustees and with actuarial and investment advisors. The Company maintains an ongoing dialog with its pension plantrustees to negotiate a reasonable schedule for cash contributions as required by local regulations. Certain assumptions that are outside ourcontrol, such as discount rates, inflation rates, plan investment returns or life expectancy change over time and impact the level of contributionswe have to make relative to the schemes. As a result, there is an inherent variability to the Company to meet such funding obligations, whichcould have material adverse effects on our financial position and/or cash flows.
We face risks associated with our international business.
We derive a substantial portion of our revenue from operations outside of the U.S. Conducting business abroad is subject to a varietyof risks including:
· Currency exchange rate fluctuations, restrictions on currency movement and impact of international tax laws could adverselyaffect our results of operations and particularly if we are forced to maintain assets in currencies other than the U.S. dollar as ourfinancial results are reported in U.S. dollars.
· Political and economic instability and unexpected changes in regulatory environment in countries outside the U.S. or negativeattitudes and sentiments towards the U.S. could adversely affect our projects overseas and our ability to repatriate cash.
· Inconsistent and diverse regulations, licensing and legal requirements may increase our costs because our operations must complywith a variety of laws that differ from country-to-country.
21

Table of Contents
· Terrorist attacks and civil unrest in some of the countries where we do business may delay project schedules, threaten the healthand safety of our employees, increase our cost of operations, and also result in cancellation of our contracts.
· Challenges in managing risks inherent in international operations, such as unique labor rules and corrupt business environmentsmay cause inadvertent violations of both foreign and U.S. laws that we may not immediately detect or correct.
While we are monitoring such regulatory, geopolitical and other factors, we cannot assess with certainty what impact they may haveover time on our business.
Foreign exchange risks may affect our ability to realize a profit from certain projects.
We attempt to minimize our exposure from currency risks by denominating our contracts in the currencies of our expenditures,obtaining escalation provisions for projects in inflationary economies, or entering into derivative (hedging) instruments. However, these actionsmay not always eliminate our currency risk exposure. Based on fluctuations in currency, the U.S. dollar value of our backlog may from time totime increase or decrease significantly. We do not enter into derivative instruments or hedging activities for speculative purposes. Ouroperational cash flows and cash balances may consist of different currencies at various points in time in order to execute our project contractsglobally. In addition, our non‑U.S. asset and liability balances are subject to currency fluctuations when measured period to period for financialreporting purposes in U.S. dollars.
Limitations of or modifications to, indemnification regulations of the U.S. or foreign countries could adversely affect our business.
The Price‑Anderson Nuclear Industries Indemnity Act, commonly called the Price‑Anderson Act (“PAA”), is a U.S. federal law,which, among other things, regulates radioactive materials and the nuclear energy industry, including liability and compensation in the event ofnuclear related incidents. The PAA provides certain protections and indemnification to nuclear energy plant operators and DOEcontractors. The PAA protections and indemnification apply to us as part of our services to the U.S. nuclear energy industry and the DOE fornew facilities, maintenance, modification, decontamination and decommissioning of nuclear energy, weapons, and research facilities. We offersimilar services in other jurisdictions outside the U.S., provided we believe similar protections and indemnities are available, either throughlaws or commercial insurance. These protections and indemnifications, however, may not cover all of our liability that could arise in theperformance of these services. To the extent the PAA or other protections and indemnifications do not apply to our services, our business couldbe adversely affected because of the cost of losses associated with liability not covered by the available protections and indemnifications, or byvirtue of our loss of business because of these added costs.
Risks associated with doing business in highly corrupt environments and employee, agent or partner misconduct or failure to comply withanti‑‑bribery and other governmental laws could, among other things, harm our reputation.
The global nature of our business creates various domestic and local regulatory challenges. In select cases, our operations includeprojects in developing countries and countries torn by war and conflict. Many of these countries are rated poorly by Transparency International,the independent watchdog organization for government and institutional corruption around the world. Further, our operations outside of theU.S. are subject to the Foreign Corrupt Practices Act (“FCPA”), the United Kingdom Bribery Act 2010, and similar anti‑bribery laws in otherjurisdictions which generally prohibit companies and their intermediaries from paying or offering anything of value to foreign governmentofficials for the purpose of obtaining or retaining business, or otherwise receiving discretionary favorable treatment of any kind. In addition, wemay be held liable for actions taken by our local partners, subcontractors and agents even though such parties are not always subject to ourcontrol. Any determination that we have violated the FCPA, the United Kingdom Bribery Act 2010, or any similar anti‑bribery laws in otherjurisdictions (whether directly or through acts of others, intentionally or through inadvertence) could result in sanctions that could have amaterial adverse effect on our business and our reputation and on our ability to secure U.S. federal government and other contracts. While ourstaff is trained on FCPA, the United Kingdom Bribery Act 2010, and other anti‑corruption laws and we have procedures and controls in place tomonitor compliance, situations may arise that could potentially put us in violation of the these regulations and thus negatively impact ourbusiness. In addition, we are also subject to various international trade and export laws. Any misconduct, fraud, non‑compliance withapplicable governmental laws and regulations, or other improper activities by our employees, agents or partners could have a significant adverseimpact on our business, financial results and reputation and could subject us to criminal and civil enforcement actions.
Misconduct could also include the failure to comply with government procurement regulations, regulations regarding the
22
Table of Contents
protection of classified information, regulations regarding the pricing of labor and other costs in government contracts, regulations on lobbyingor similar activities, regulations pertaining to the internal controls over financial reporting, environmental laws and any other applicable laws orregulations. In addition, we regularly provide services that may be highly sensitive or that relate to critical national security matters; if asecurity breach were to occur, our ability to procure future government contracts could be severely limited. Failure to comply with applicablelaws or regulations or acts of misconduct could subject us to fines and penalties, loss of security clearances, and suspension or debarment fromcontracting, any or all of which could harm our reputation, reduce our revenue and profits and subject us to criminal and civil enforcementactions.
We face risks associated with working in locations where there are high security risks.
Some of our projects are performed in locations known for their high security risks. In these high risk locations, we may incursubstantial security costs to maintain the safety of our employees and work sites. Despite our best efforts, we cannot guarantee the safety of ouremployees and we may suffer future losses of employees and subcontractors.
We face risks associated with our work sites and the maintenance of adequate safety standards.
Construction and maintenance sites are inherently dangerous workplaces and place our employees in close proximity to dangers of thework site, such as mechanized equipment, moving vehicles, chemical and manufacturing process and materials. While we routinely plan andimplement site-specific safety programs and training for our employees and subcontractors. Our failure to maintain and implement adequatesafety standards and procedures could have a material adverse impact on our business, financial condition and results of operations.
Our businesses can be materially and adversely affected by severe weather.
Severe weather has in the past and can in the future create conditions that adversely affect our ability to complete specific projects ontime or without excess costs. Such adverse weather conditions may include:
· Evacuation of personnel and curtailment of services which may be temporary in nature;· Increased labor and materials costs in areas impacted by weather and subsequent increased demand for labor and materials for
repairing and rebuilding;· Weather related damage to our jobsites or facilities;· Inability to deliver materials to jobsites in accordance with contract schedules;· Loss of productivity; and,· Inability to complete projects in accordance with project schedules.
We typically remain obligated to perform our services after a natural disaster unless the contract contains a force majeure clause. Wehave force majeure clauses in the majority of our contracts that are at the highest risk of being impacted by a force majeure, which are ourdesign‑build, program management and EPC contracts. In addition, we typically seek and frequently obtain force majeure clauses in ourengineering and consulting contracts. If a contract contains a force majeure provision, we may be able to obtain an extension of time tocomplete our obligations under such contracts, but we will still be subject to our other contractual obligations in the event of such anextraordinary event. Because we cannot predict the length, severity or location of any potential force majeure event, it is not possible todetermine the specific effects any such event may have on us. Depending on the specific circumstances of any particular force majeure event,or if we are unable to react quickly such an event, our operations may be affected significantly, our productivity may be affected, our ability tocomplete projects in accordance with our contractual obligations may be affected and we may incur increased labor and materials costs, whichcould have a negative impact on our financial condition, relationships with customers or suppliers, and our reputation.
Rising inflation and increases to interest rates and construction costs could reduce the demand for our services as well as decrease ourprofit on our existing contracts.
Rising inflation could result in reduced demand for our services as inflationary pressures can prompt our public, government andcommercial clients to reduce or eliminate spending. Further, increasing inflation could have an adverse impact on our costs of operations asincreasing inflation could increase the cost of certain services or products used in delivering our services.
This risk is further heightened because in some instances we may bear some or all of the risk of rising inflation in our fixed
23
Table of Contents
price and guaranteed maximum price contracts which make up a significant portion of our revenue. In addition, if we expand our business intomarkets and geographic areas where fixed price work is more prevalent, inflation may have a larger impact on our results of operations in thefuture. Therefore, increases in inflation, interest rates or construction costs could individually or collectively have a material adverse impact onour business and financial results.
It can be difficult or expensive to obtain the insurance we need for our business operations.
As part of our business operations, we maintain insurance both as a corporate risk management strategy and to satisfy the requirementsof many of our contracts. Insurance products go through market fluctuations and can become expensive and sometimes very difficult toobtain. We work with a diversified team of insurers to reduce our risk of available capacity. There can be no assurances, however, that we cansecure all necessary or appropriate insurance in the future at an affordable price for the required limits. Our failure to obtain such insurancecould lead to uninsured losses that could have a material adverse effect on our results of operations or financial condition.
Our present assessment of the insurance market is that there is adequate capacity to cover our insurance needs, but the cost ofinsurance may rise. Currently our insurance and bonds are purchased from several of the world’s leading and financially stable providers oftenin layered insurance or co‑surety arrangements. The built‑in redundancy of such arrangements usually enables us to call upon existinginsurance and surety suppliers to fill gaps that may arise if other such suppliers become financially unstable, however, this may not always bethe case. Our risk management personnel continuously monitor the developments in the insurance market and financial stability of theinsurance providers.
Actual results could differ from the estimates and assumptions used to prepare our financial statements.
In order to prepare financial statements in conformity with U.S. GAAP, we are required to make estimates and assumptions as of thedate of the financial statements which affect the reported values of our assets, liabilities, revenue and expenses, and disclosures of contingentassets and liabilities. Any changes in our estimates or assumptions could adversely affect our results of operations and result in futureimpairment charges. Areas requiring significant estimates by us include:
· Recognition of contract revenue, costs, profit or losses in applying the percentage‑of‑completion method of accounting;· Recognition of recoveries under contract change orders or claims;· Collectability of billed and work‑in‑process unbilled accounts receivables and the need for and the amount of allowances for
problematic accounts;· Estimated amounts for anticipated project losses, warranty costs and contract close‑out costs;· Determination of liabilities under pension and other postretirement benefit programs;· Accruals for self-insurance programs for medical, workers compensation, general liability and professional liability;· Recoverability of deferred tax assets and the related valuation allowances, and accruals for uncertain tax positions;· Stock option valuation model assumptions;· Accruals for other estimated liabilities;· Employee incentive plans; and,· Asset valuations .
We rely on information systems to conduct our business, and failure to protect these systems against security breaches couldadversely affect our business and results of operations. Additionally, if these systems fail or become unavailable for any significant periodof time, our business could be harmed.
Because of recent advancements in technology and well‑known efforts on the part of computer hackers and cyber terrorists to breachdata security of companies, we face risks associated with potential failure to adequately protect critical corporate, client, and employee datawhich, if released, could adversely impact our client relationships, our reputation, our operational capabilities and results, and violate privacylaws and other applicable laws and regulations. As part of our business, we develop, receive and retain confidential and sensitive data about ourcompany and our clients including the U.S. federal.
In addition, as a global company, we rely heavily on computer, information and communications technology and related systems inorder to operate. From time to time, we may be subject to systems failures, including network, software or hardware failures, whether caused byus, third party service providers, intruders or hackers, computer viruses, natural disasters, power shortages or terrorist attacks. Such failurescould cause loss of data and interruptions or delays in our or our customers’ businesses and could
24

Table of Contents
damage our reputation. In addition, the failure or disruption of our communications or utilities could cause us to interrupt or suspend ouroperations or otherwise adversely affect our business. Losses that may occur as a result of any system or operational failure or disruption maycause our actual results to differ materially from those anticipated.
We rely on industry accepted security measures and technology to securely maintain confidential and proprietary informationmaintained on our information systems. However, these measures and technology may not adequately prevent security breaches. Anysignificant interruption or failure of our information systems or any significant breach of security could result in the violation of privacy lawsand other applicable laws and regulations, damage our reputation and adversely affect our business and results of operations.
Further, there is increasing public attention on the importance of cyber security relating to critical infrastructure. This creates thepotential for future developments in the regulatory approach to this area, which may adversely impact our clients and how we offer our servicesto our clients.
Risks Related to Our Internal Market, Including Continuing Liquidity Risk in Repurchasing Stock
We are an employee-controlled professional engineering services firm. As a result, ownership of our common stock and the ability totrade shares of our common stock on our internal market has been largely limited to “eligible employee stockholders,” which includes certainactive and former employees, directors, eligible consultants and benefit plans and, under limited circumstances at our discretion, other third-parties. At a special meeting held on February 19, 2015, our stockholders approved certain measures, including amendments to our restatedcertificate of incorporation, intended to facilitate investments in our common or preferred stock, including preferred stock convertible intocommon stock, by third-party investors who we refer to as “outside investors.” On June 24, 2015, we sold and issued an aggregate of 3,214,400shares of our Series A Preferred Stock to Apollo for an aggregate purchase price of approximately $200.0 million in a private placement. OnApril 11, 2016, we sold and issued an additional 1,607,200 shares of Series A Preferred Stock to Apollo for an aggregate purchase price ofapproximately $100.0 million in a second closing subject to the conditions within the Subscription Agreement. Total proceeds from the 2016preferred stock offering were $99.8 million, net of issuance costs of $0.2 million. Our outside investors, including Apollo, may transfer ourstock other than through the internal market, subject to any contractual limitations that we and the outside investor agree upon. In addition,certain other rights and restrictions in our restated certificate of incorporation are applicable to eligible employee stockholders, but are notapplicable to outside investors who may hold our common or preferred stock from time to time.
Unlike public companies whose stock is traded on a securities exchange, there is no public market for our common stock, which istraded exclusively on the internal market we established in 2000 to provide liquidity to eligible common stockholders. The following aresignificant risks that arise from the restrictions on selling our common stock and the operation of the internal market and are not typical risksassociated with publicly traded stock of other companies you may be familiar with. Accordingly, you should consider the following risks inconnection with any investment in our common stock. For a detailed discussion of the operation of our internal market and the transferrestrictions on our common stock, see Item 5. Market for Registrant’s Common Equity, Related Stockholder Matters and Issuer Purchases ofEquity Securities in this Annual Report on Form 10-K for the year ended December 30, 2016. Members of our Board of Directors and ourmanagement have historically participated in the internal market by purchasing and selling shares of our common stock on various tradedates. We expect that members of our Board of Directors and our management will continue to trade shares on the internal market from time totime, although such transactions are solely at the discretion of each individual.
The price of our common stock is determined by our Board of Directors’ judgment of fair value and not by market trading activity.
The price of our common stock on each trade date is established by our Board of Directors based on the factors that are described inthis Annual Report on Form 10-K under the heading Item 5. Market for Registrant’s Common Equity, Related Stockholder Matters and IssuerPurchases of Equity Securities . Our Board of Directors sets the common stock price in advance of each trade date, and all trades on ourinternal market are transacted at the price established by our Board, which is a significant difference between investing in our common stockand owning stock of a publicly traded company. The market trading activity in our common stock on any given trade date, therefore, cannotaffect the price of shares of our common stock on that trade date. This is a risk to eligible employee stockholders because our common stockprice will not change to reflect the supply of, or the demand for, shares on a given trade date as it would in a public market. Eligible employeestockholders may not be able to sell their shares of common stock or may have to sell their shares at a price that is lower than the price thatwould prevail if the internal market price could change on a given trade date to reflect supply and demand. The common stock valuationmethodology that our Board of
25
Table of Contents
Directors uses is intended to establish a price for shares of our common stock that represents fair value as of the applicable trade date. Thevaluation methodology used to determine fair value is subject to change at the discretion of our Board of Directors. However, the Certificate ofDesignation prevents us from, among other things, repurchasing shares of common stock from eligible employee stockholders in the internalmarket or otherwise at a valuation inconsistent with our normal quarterly practice without the consent of the holders of a majority of the thenoutstanding shares of our Series A Preferred Stock.
Transfer restrictions on our common stock could prevent eligible employee stockholders from selling their common stock and result in theloss of all or part of their investment.
Since all of the shares of our common stock held by eligible employee stockholders are subject to transfer restrictions, eligibleemployee stockholders will generally only be able to sell their common stock through our internal market on the scheduled trade dates eachyear. In order to satisfy legal requirements for mandatory cash distributions or under other limited circumstances subject to our discretion, wemay purchase shares from stockholders or permit stockholders to sell shares of common stock to third parties outside of the internal market. Asa result, owning shares of our common stock is different from owning shares of stock that are publicly traded on a stock market because oureligible employee stockholders may not be able to sell their shares of our common stock on demand. Further, our common stock price coulddecline between the time eligible employee stockholders want to sell and the time they become able to sell, which would result in a partial ortotal loss of their investment.
Absence of a public market may prevent eligible employee stockholders from selling their stock at the time of their choosing and could resultin the loss of all or part of their investment.
While we intend for the internal market to provide some degree of liquidity to eligible employee stockholders, we are under noobligation to continue to maintain the internal market and there can be no assurance that there will be enough orders to purchase shares topermit eligible employee stockholders to sell their shares on the internal market at the time of their choosing. Our internal trading marketgenerally experiences trade imbalances, with more sell orders than buy orders on each trade date. Under the internal market rules, we mayparticipate in the internal market as a buyer of common stock if there are more sell orders than buy orders in the market, and we generally haveelected to do so in the past to some extent, although we are under no obligation to do so and will not guarantee market liquidity. Beginning inthe second half of 2014, as result of adverse operating results, reduced liquidity and other factors, we have limited the amount of moneyallocated to purchasing shares in the internal market, resulting in limitations on the number of shares eligible employee stockholders can sell inthe internal market. We expect that we will continue to impose limitations on the amount of funds allocated to purchasing shares on the internalmarket trade dates that are currently expected to occur in 2017 and beyond.
We determine whether to participate in the internal market on a quarterly basis and do not set aside funds in advance to purchaseshares of common stock in order to balance sell orders and buy orders on future trade dates. Prior to each quarterly trade date, we review theoutstanding orders and any resulting imbalance between sell orders and buy orders and make a determination whether or not we shouldparticipate in the internal market by buying shares of common stock in order to help balance the number of sell orders and buy orders. Inmaking that determination, our management and Board of Directors consider prevailing circumstances, including our financial condition andresults of operations, our available cash and capital resources, including the borrowing capacity available pursuant to the terms of our AmendedCredit Agreement and other sources of liquidity, expected current and future needs for cash to fund our operations, anticipated contingenciesand other factors. Any of those considerations, or other considerations that may arise in the future, could cause our management or Board ofDirectors to decide that we will participate in the internal market only on a limited basis (i.e. “partially clear” the market), in which case wewould purchase some, but not all, of the shares of common stock subject to sell orders in excess of the number of buy orders on the applicabletrade date, as has been the case on recent trade dates. Furthermore, such considerations could cause our management or Board of Directors todecide not to purchase any shares of common stock on any trade date, either on a one-time basis, or on a going-forward basis in accordance withinternal market rules. In addition, in September 2016, our principal revolving credit facility was amended to include a limitation on the amountwe may spend to repurchase our common stock in connection with its employee stock ownership program and to make legally requiredrepurchases of common stock held in benefit plan accounts. Furthermore, the Certificate of Designation prevents us from, among other things,repurchasing shares of common stock from eligible employee stockholders in the internal market or otherwise in excess of certain negotiatedpre-approved amounts without the consent of the holders of at least a majority of the then outstanding shares of our Series A Preferred Stock. Ifwe sell additional shares of preferred stock or common stock to other outside investors, the contractual terms governing such investments couldalso impose additional direct or indirect limitations on our ability to conduct repurchases.
If we do not purchase any shares of common stock or only purchase enough shares to partially clear the market on any trade
26
Table of Contents
date, sell orders will be subject to limitations we refer to as proration and allocation in accordance with the internal market rules in effect at thetime and eligible employee stockholders may only be able to sell a portion of the shares they want to sell on that trade date. Our Board ofDirectors has authority to modify the internal market rules related to allocation of limits on sell orders.
Together with prudent management of our resources for operating cash needs, we expect that the amounts that we will be able to spendto clear sell orders on the trade dates that are currently expected to occur in 2017 and beyond will continue to be severely restricted. Our Boardof Directors and management anticipate that the internal market will only partially clear, and some sell orders will be only partially filled, onsuch trade dates. Consequently, insufficient buyer demand could continue to cause sell orders to be limited, or could prevent the internal marketfrom opening on any particular trade date, either of which could cause delay in eligible employee stockholders’ ability to sell their commonstock. If our stock price declines from the time eligible employee stockholders want to sell to the time they become able to sell, they couldsuffer partial or total loss of their investment. No assurance can be given that eligible employee stockholders desiring to sell all or a portion oftheir shares of common stock will be able to do so.
Legal requirements to repurchase shares of our common stock held through our 401(k) plan may constrain our ability to purchase shares inthe internal market, which could delay or prevent sales by eligible employee stockholders who want to sell their common stock and result inthe loss of all or part of their investment.
A significant portion of our outstanding shares of common stock are owned by eligible stockholders, including former and retiredemployees, through the CH2M HILL Retirement and Tax-Deferred Savings Plan (the “401(k) Plan”), which is subject to the requirements ofthe Employee Retirement Income Security Act of 1974, as amended (“ERISA”). We are legally required to repurchase shares of our commonstock held through the 401(k) Plan under certain circumstances, primarily related to separation from employment or retirement of eligibleemployee stockholders, and within the time periods prescribed by ERISA and the documents governing the terms of the 401(k) Plan. In somecases, our obligation to repurchase such shares of common stock arises if the former employee makes a request to liquidate their holdings of ourcommon stock and in other cases the requirement is automatically triggered upon the former employee reaching a certain age. Accordingly, weare not able to predict the precise timing or amount of legally required repurchases we will be required to make in any future period. As ofDecember 30, 2016, the aggregate amount of our common stock that we could be legally required to repurchase had a value of up to$123.9 million, at the then-current stock price established by our Board of Directors. If we were to fail to make such legally requiredrepurchases within the applicable time periods, we would be in violation of the terms of ERISA. In order to satisfy our obligation to makelegally required repurchases, we could be required to expend significant funds, which could reduce our liquidity and limit the amount of fundsavailable to purchase other shares of our common stock offered on the internal market on any trade date, or prevent such repurchases on theinternal market entirely. Consequently, our obligation to make legally required repurchases could cause sell order amounts to be limited, orcould prevent the internal market from opening on any particular trade date, either of which could cause delay in eligible stockholders’ ability tosell their common stock. If our stock price declines from the time eligible stockholders want to sell to the time they become able to sell, theycould suffer partial or total loss of their investment. No assurance can be given that eligible stockholders desiring to sell all or a portion of theirshares of common stock will be able to do so.
Changes in the operation of the internal market or a determination to stop maintaining the internal market would delay or prevent sales byeligible employee stockholders who want to sell their common stock, which could result in the loss of all or part of their investment.
Our Board of Directors could, in its discretion, determine to change the internal market rules. For example, our Board of Directorscould change the method for prorating or otherwise allocating buy orders and sell orders in an under-subscribed market, prioritize certain ordersto comply with applicable laws or other considerations or limit the number or percentage of a stockholder’s shares of common stock that suchstockholder could sell on any given trade date. In addition, our Board of Directors, in their sole discretion, could decide to cease operating theinternal market for a variety of reasons. A determination to change the rules under which the internal market operates or a decision to stopmaintaining the internal market entirely, could cause significant delays in stockholders’ ability to sell their common stock or prevent them fromselling their common stock altogether.
Moreover, changes to the rules under which the internal market operates could affect different stockholders in different ways; forexample, by prioritizing certain transactions in stock held through employee benefit plans over transactions in stock held directly. TheCertificate of Designation prevents us from, among other things, repurchasing shares of common stock from eligible employee stockholders inthe internal market or otherwise at a valuation inconsistent with our normal quarterly practice without the consent of the holders of at least amajority of the then outstanding shares of our Series A Preferred Stock. Similarly, if we sell additional shares of preferred stock or commonstock to an outside investor, the contractual terms governing such investment could impose additional
27
Table of Contents
direct or indirect limitations on the Board of Directors’ ability to change the internal market rules or require any such change to affect outsideinvestors differently than it affects stockholders. If our common stock price declines from the time stockholders want to sell to the time theybecome able to sell, they could suffer partial or total loss of their investment.
The Company may be unable to or may decide to not provide sufficient liquidity to enable the sale of all or a portion of shares offered forsale and may not be able to continue proration or allocation of sales at current levels or at all.
The ability of the Company to provide sufficient liquidity or capital to participate in the internal market at all or to participate at recentlevels may be restricted by, without limitation, the number of shares offered for sale, other corporate opportunities, or the ability of theCompany to generate enough liquidity. In the year ended December 30, 2016, we experienced project losses and other adverse operatingresults, including additional cost growth of $121.3 million on a fixed-price transportation contract to design and construct roadwayimprovements on an expressway in the southwestern United States, and $301.5 million on a fixed-price EPC project in Australia through aconsolidated joint venture with an Australian construction contractor to engineer, procure, construct and start-up a combined cycle power plantto supply power to a large liquefied natural gas facility in Australia. While we may recover a significant portion of such losses from the clients,and we intend to pursue recovery vigorously, we currently anticipate these losses will constrain our cash flow and liquidity. In the context ofour current debt structure and projected cash needs, the Company may be unable to or may decide to not provide sufficient liquidity toparticipate in the internal market at all or at current levels until our cash flow and liquidity constraints are resolved.
The amount of shares offered for sale at any given time and the increasing number of shares held by employees at retirement age maycause requests for sales of shares that far exceed the amount of capital the Board of Directors allocates to the internal market. In addition to ouranticipated cash flow and liquidity constraints, the Company, acting through the Board of Directors, may decide to allocate capital or cash toactivities or opportunities outside the internal market. Further, the Company in the future may not be able to generate the liquidity required,either through operations or through use of the credit facility, to participate in the internal market.
The occurrence of any of these or similar events could cause the funds available to fulfill sell orders to be limited, could prevent theinternal market from operating for a certain period or periods of time, could cause delays in the opening of the internal market trade dates orcould result in the cessation of the internal market altogether. Any of these changes could cause a delay in eligible stockholders’ ability to selltheir common stock. If our stock price declines from the time eligible stockholders want to sell to the time they become able to sell, they couldsuffer partial or total loss of their investment. No assurance can be given that eligible stockholders desiring to sell all or a portion of theircommon stock will be able to do so.
Our Amended Credit Agreement and the Certificate of Designations for our Series A Preferred Stock contain covenants that may restrict theCompany’s ability to conduct certain repurchases of shares of capital stock in the internal market.
Our management and Board of Directors have sole discretion with respect to the decision whether to repurchase shares in the internalmarket on any trade date. In making the determination whether to participate in an under-subscribed market on any trade date, our managementand Board of Directors will consider a variety of relevant factors in light of prevailing circumstances at that time, including contractual termsagreed to with any outside investor.
Both our Amended Credit Agreement and the Certificate of Designations for our Series A Preferred Stock limit our ability torepurchase shares of our common stock in the internal market on any trade date and, under certain circumstances may prevent us fromrepurchasing shares on a trade date.
The Amended Credit Agreement provides that we may spend up to $75.0 million (less the amount of any legally required repurchasesof common stock held in benefit plans) to repurchase our common stock in in the internal market during the three quarter period endingMarch 31, 2017. Thereafter, we may spend up to $100.0 million (less the amount of any legally required repurchases of common stock held inbenefit plans) to repurchase common stock in in the internal market) during each rolling four quarter period. Moreover, in order to make anyrepurchases in the internal market, we must not be in default under the terms of the Amended Credit Agreement and both before and aftergiving effect to such repurchases we must be in pro forma compliance with the financial covenants contained in the Amended CreditAgreement.
In 2017, under the Certificate of Designation, the Company is permitted to repurchase shares of common stock in an amountdetermined by a formula based upon our cash flow from operations, minus capital expenditures, for fiscal 2016. Based upon our results ofoperations for fiscal year 2016, the Company is prohibited from repurchasing shares of common stock in the internal market,
28
Table of Contents
except as legally required, unless it is able to obtain the consent of the holders of at least a majority of the Series A Preferred Stock. On January17, 2017, the Company received from the Series A Preferred Stock holder, an acknowledgment and consent permitting the Company to spendup to $25.0 million, in the aggregate, to repurchase shares of common stock in the first trade of 2017 related to the 2016 third quarter financialresults. No assurance can be given that in the future the Company will be able to obtain an acknowledgment and consent from the Series APreferred Stockholder permitting the Company to repurchase common stock in the internal market if such an acknowledgment and consent isrequired.
Based on these limitations and other factors including adverse operating results and reduced liquidity, we expect that the amounts thatwe will spend to repurchase shares in the internal market in 2017 and beyond will continue to be severely limited and could prevent the internalmarket from opening on any particular trade date, either of which could delay an eligible employee stockholders’ ability to sell their commonstock. If our stock price declines from the time eligible employee stockholders want to sell to the time they become able to sell, they couldsuffer partial or total loss of their investment. No assurance can be given that eligible employee stockholders desiring to sell all or a portion oftheir shares of common stock will be able to do so.
Future changes in our capital structure to provide greater liquidity or access to greater liquidity may interrupt, substantially alter, or ceasethe operation of our internal market .
In order to provide greater liquidity to the Company to meet future capital needs, the Company is beginning to considertransformational alternatives to our internal market and the capital structure of the Company. These transformational alternatives may include,but are not limited, to an initial public offering, issuance of additional Series A Preferred Stock to Apollo or other investors, issuance ofpreferred stock or common stock to other outside, non-employee investors, or seeking partners for a merger or other business combination forthe Company.
If the Company elects to pursue any one or any combination of transformational alternatives to our capital structure and received anynecessary stockholder approval to proceed, obligations resulting from the laws, regulations or agreements between parties to achieve the chosencapital structure transformation alternative could cause sell order amounts to be limited, could prevent the internal market from operating for acertain period or periods of time, could cause delays in the opening of the internal market trade dates or could result in the cessation of theinternal market altogether. Any of these changes could cause a delay in eligible stockholders’ ability to sell their common stock. If our stockprice declines from the time eligible stockholders want to sell to the time they become able to sell, they could suffer partial or total loss of theirinvestment. No assurance can be given that eligible stockholders desiring to sell all or a portion of their common stock will be able to do so.
The limited market and common stock transfer restrictions applicable to eligible stockholders, as well as rights and restrictions in ourrestated certificate of incorporation and bylaws, will likely have anti‑‑takeover effects.
Only the Company, members of our Board of Directors, certain consultants and certain eligible employees may purchase our commonstock through our internal market. We also have significant restrictions on the transfer of our common stock by stockholders outside of theinternal market. These limitations make it extremely difficult for a potential acquirer who does not have the prior consent of our Board ofDirectors and any necessary approval of the stockholders to attain control of our company, regardless of the price per share an acquirer might bewilling to pay and whether or not our stockholders would be willing to sell at that price. In addition, other provisions in our restated certificateof incorporation and bylaws impose a sixty six and two thirds percent (66 2/3%) stockholder approval requirement for any amendment to ourbylaws proposed by a stockholder and impose a requirement that our employees constitute a majority of the Board of Directors at all times,which may make it more difficult for a potential acquirer to gain control of our company without the prior consent of our Board ofDirectors. The Certificate of Designation also prevents us from, among other things, effecting certain liquidation events (including a sale of theCompany) and changes of control in which the holders of Series A Preferred Stock would receive less than $600.0 million in cash or liquidassets without the consent of the holders of at least a majority of the then outstanding shares of our Series A Preferred Stock.
Future returns on our common stock may be significantly lower than historical returns and the value of our common stock may decline.
Historical trends in our stock price are not necessarily indicative of the stock price in the future. In the past, our stock price has, insome cases, declined from one quarter to the next. We cannot assure stockholders that our common stock will provide returns in the futurecomparable to those achieved historically or that the price will not decline.
29
Table of Contents
Risks Related to Our Series A Preferred Stock
The issuance of shares of our Series A Preferred Stock to Apollo has reduced the relative voting power of holders of our common stock, maydilute the ownership of such holders and therefore negatively affect the price of our common stock, and any additional issuance of shares ofour Series A Preferred Stock in the future may increase these effects.
On June 24, 2015, we sold and issued an aggregate of 3,214,400 shares of our Series A Preferred Stock to Apollo for an aggregatepurchase price of approximately $200.0 million in a private placement. On April 11, 2016, we sold and issued an additional 1,607,200 shares ofSeries A Preferred Stock to Apollo for an aggregate purchase price of approximately $100.0 million in a second closing subject to theconditions within the Subscription Agreement. As holders of our Series A Preferred Stock are entitled to vote, on an as-converted basis,together with holders of our common stock as a single class on all matters submitted to a vote of our common stockholders, the issuance of theSeries A Preferred Stock to Apollo has effectively reduced the relative voting power of the holders of our common stock.
In addition, any holder of outstanding shares of Series A Preferred Stock may elect, from time to time, to convert any or all of suchholder’s shares of Series A Preferred Stock into a number of shares of our common stock as is determined by dividing the original issue price of$62.22 per share (the “Original Issue Price”) by a conversion price (the “Initial Conversion Price”), which initially is also $62.22 per share.Under certain circumstances set forth in our Investor Rights Agreement with Apollo, after June 24, 2020, the Initial Conversion Price will bereduced to $52.65 or $47.86. The Initial Conversion Price is also subject to adjustments on a broad-based, weighted-average basis upon theissuance of shares of common stock or certain equivalent securities at a price per share less than the Initial Conversion Price as adjusted to date,subject to certain exclusions. Conversion of the Series A Preferred Stock to common stock would dilute the ownership interest of existingholders of our common stock.
The holders of our Series A Preferred Stock may exercise influence over us, including through Apollo’s ability to elect up to two members ofour Board of Directors.
As of December 30, 2016, the shares of Series A Preferred Stock owned by Apollo represent approximately 17% of the voting rightsof our common stock, on an as-converted basis. As a result, Apollo has the ability to influence the outcome of any matter submitted for the voteof our stockholders.
In addition, the Certificate of Designation grants certain consent rights to the holders of at least a majority of Series A Preferred Stockbefore taking certain actions, including (a) increasing the authorized number of shares of Series A Preferred Stock; (b) authorizing securitieshaving rights, preferences or privileges that are senior to or on a parity with the Series A Preferred Stock as to dividends or upon anyliquidation, dissolution or winding up of the Company, whether voluntary or involuntary, or any other transaction deemed a liquidation eventpursuant to the certificate of designation (including a sale of the Company) or increasing the authorized number of shares of any such securities;(c) amending our restated certificate of incorporation in any way that adversely affects the rights, preferences or privileges of the Series APreferred Stock; (d) conducting certain liquidation events in which the holders of Series A Preferred Stock would receive less than$600.0 million in cash or liquid assets; (e) effecting or allowing the registration or listing on a securities exchange of any securities of theCompany other than in accordance with post-registration or post-listing restrictions on transfer of our common stock as further described in theCertificate of Designation; (f) entering into agreements for certain acquisitions, joint ventures or investments, except, in certain circumstances,those involving amounts of $100.0 million or less; (g) entering into agreements for certain firm, fixed-price or lump-sum design-build or EPCcontracts outside of our water business group involving certain negotiated amounts; (h) entering into certain related-party transactions; (i)entering into any new line of business; (j) conducting certain repurchases of shares of capital stock in excess of negotiated pre-approvedamounts set forth in the certificate of designation; (k) incurring certain debt for borrowed money in amounts that would cause our leverage ratioto exceed 3.00:1.00 (or 3.25:1.00 for 2015); (l) increasing the number of directors on our Board of Directors to more than 13; and (m) undercertain circumstances set forth in our Investor Rights Agreement with Apollo, after June 24, 2020, issuing equity securities other than certainpre-approved issuances pursuant to existing plans and agreements. Apollo and any other future holders of Series A Preferred Stock may haveinterests that diverge from, or even conflict with, those of our other stockholders. For example, the holders of Series A Preferred Stock mayhave an interest in directly or indirectly pursuing acquisitions, divestitures, financings or other transactions that, in their judgment, couldenhance their other equity investments, even though such transactions might involve risks to us.
In addition, for so long as Apollo continues to hold a minimum required number of the shares of Series A Preferred Stock set forth inthe Investor Rights Agreement, Apollo will have the right to designate two directors to our Board of Directors.
30

Table of Contents
Notwithstanding the fact that all directors will be subject to fiduciary duties and applicable law, the interests of the directors appointed byApollo may differ from the interests of our stockholders as a whole or of our other directors.
The Series A Preferred Stock has rights, preferences and privileges that are not held by, and are preferential to, the rights of our commonstockholders. Such preferential rights could adversely affect our liquidity and financial condition and may result in the interests of theholders of the Series A Preferred Stock differing from those of our common stockholders.
In the event of any liquidation, dissolution or winding up of the Company, whether voluntary or involuntary, or any other transactiondeemed a liquidation event pursuant to the Certificate of Designation, including a sale of the Company (a “Liquidation”), each holder ofoutstanding shares of our Series A Preferred Stock will be entitled to be paid out of our assets available for distribution to stockholders, beforeany payment may be made to the holders of our common stock, an amount per share equal to the Original Issue Price, plus accrued and unpaiddividends thereon or, in the event that such Liquidation occurs before the June 24, 2020, such dividends as would have accrued on such sharesthrough such date and are unpaid, and in each case, together with any other dividends declared and unpaid on such shares of Series A PreferredStock. If, upon such Liquidation, the amount that the holders of Series A Preferred Stock would have received if all outstanding shares ofSeries A Preferred Stock had been converted into shares of our common stock immediately prior to such Liquidation would exceed than theamount they would receive pursuant to the preceding sentence, the holders of Series A Preferred Stock will receive such greater amount.
Dividends on the Series A Preferred Stock are cumulative and accrue quarterly, whether or not declared by our Board of Directors, atthe rate of 5.0% per annum on the sum of the Original Issue Price plus all accrued and unpaid dividends thereon. After June 24, 2020, the rate atwhich dividends accrue may increase from 5.0% to 10.0% or 15.0% if our stockholders do not approve a sale of the Company which has beenrecommended by our Board of Directors or subsequently do not approve certain other actions to facilitate an initial public offering. Dividendsaccruing on shares of Series A Preferred Stock prior to June 24, 2020 are not paid in cash or in kind but are added to the liquidation preferenceof the Series A Preferred Stock pursuant to the Certificate of Designation. After June 24, 2020, dividends accruing on shares of Series APreferred Stock will be payable in cash at the election of our Board of Directors. In addition, under certain circumstances set forth in theCertificate of Designation, after June 24, 2020, dividends accrued on shares of Series A Preferred Stock will be payable in cash or in kind at theelection of the holders of a majority of the outstanding shares of Series A Preferred Stock. In addition to the dividends accruing on shares ofSeries A Preferred Stock described above, if we declare certain dividends on our common stock, we will be required to declare and pay adividend on the outstanding shares of our Series A Preferred Stock on a pro rata basis with the common stock, determined on an as-convertedbasis.
Pursuant to the Certificate of Designation, we may redeem all shares of Series A Preferred Stock, but no less than all shares ofSeries A Preferred Stock, out of funds lawfully available for such purpose in one installment commencing at any time on or after June 24, 2018.The aggregate redemption price for the shares of Series A Preferred Stock will be equal to the greater of (a) the fair value of such shares, asdetermined by an appraisal provided for in the Certificate of Designation, plus accrued and unpaid dividends on such shares, together with anyother dividends declared and unpaid thereon, and (b) certain guaranteed minimum prices of up to an aggregate of $600.0 million. The Series APreferred Stock is not redeemable upon the election of the holders of Series A Preferred Stock.
Our obligation to pay dividends to the holders of our Series A Preferred Stock in certain circumstances and our potential decision toredeem the outstanding shares of Series A Preferred Stock could impact our liquidity and reduce the amount of cash flows available for workingcapital, capital expenditures, growth opportunities, acquisitions and other general corporate purposes and the repurchase of common stock onour internal market. Our obligations to the holders of Series A Preferred Stock could also limit our ability to obtain additional financing orincrease our borrowing costs, which could have an adverse effect on our financial condition.
Item 1B. Unresolved Staff Comment s
None.
Item 2. Propertie s
Our operations are conducted primarily in leased properties in 39 countries throughout the world. Our corporate headquarters arelocated 9191 S. Jamaica Street, Englewood, Colorado. We believe our current facilities, which include leases for approximately 2.7 millionsquare feet worldwide, are adequate for the operation of our business.
31

Table of Contents
Item 3. Legal Proceeding s
We are party to various legal actions arising in the normal course of business. Because a large portion of our business comes fromU.S. federal, state and municipal sources, our procurement and certain other practices at times are subject to review and investigation by variousagencies of the U.S. government and state attorneys’ offices. Such state and U.S. government investigations, whether relating to governmentcontracts or conducted for other reasons, could result in administrative, civil or criminal liabilities, including repayments, fines or penalties orcould lead to suspension or debarment from future U.S. government contracting. These investigations often take years to complete and manyresult in no adverse action or alternatively could result in settlement. Damages assessed in connection with and the cost of defending any suchactions could be substantial. While the outcomes of pending proceedings and legal actions are often difficult to predict, management believesthat proceedings and legal actions currently pending would not result in a material adverse effect on our results of operations or financialcondition even if the final outcome is adverse to the Company.
Many claims that are currently pending against us are covered by our professional liability insurance after we have exhausted our self-insurance requirement, which is currently $20.0 million per policy year. Management estimates that the levels of insurance coverage (afterretentions and deductibles) are generally adequate to cover our liabilities, if any, with regard to such claims. Any amounts that are probable ofpayment are accrued when such amounts are estimable. Subject to the foregoing, the following legal proceedings that have not yet beenterminated through settlement are not probable of payment at this time but are disclosed because an adverse outcome with regard to any one or acombination of these legal proceedings could have a future material adverse impact on our financial condition, cash flows or results ofoperations.
CH2M-WG Idaho, LLC (“CWI”), owned 50.5% by CH2M HILL Constructors, Inc., a wholly owned subsidiary of CH2M HILLCompanies, Ltd., is a remediation contractor for the U.S. Department of Energy (“DOE”) at the Idaho National Laboratory site. The originalremediation contract was to run from May 2005 through September 2012, and was extended through September 2015. CWI currently has adisagreement with DOE concerning what CWI’s final fee should be for the base contract period from May 2005 through September 2012. InDecember 2013, the DOE issued a final determination that was approximately $30.0 million less than CWI expected to receive in the feedetermination. On March 6, 2014, CWI filed a Certified Claim with the Contracting Officer for a total fee owed of $40.1 million. The CertifiedClaim was rejected through a Contracting Officer’s Final Decision in May 2014, and CWI filed its appeal to the Civilian Board of ContractAppeals on May 30, 2014. The trial was held April 12 through 28, 2016, and the post-trial briefing phase is now complete. We are awaiting thedecision from the Board. Based on information presently known to management, we believe that the outcome of this dispute will not have amaterial adverse effect on our financial condition, cash flows or results of operations.
In 2003, the Municipality of Anchorage, Alaska (“Municipality”) began its Port of Anchorage Intermodal Expansion Project byentering into Memoranda of Understanding with the Maritime Administration (“MarAd”). MarAd contracted with Integrated Concepts andResearch Corporation (“ICRC”) to perform certain design and construction-related work on the project. In 2006, ICRC subcontracted certainproject design work to PND Engineers, Inc. (“PND”). In 2006, PND subcontracted some limited portions of its work to VECO, Inc. (n/k/aCH2M HILL Alaska, Inc.). During the design phase, PND’s proprietary design, the Open Cell Sheet Pile system (“OCSP”) was recommendedas the preferred design alternative on the project. VECO issued two documents, one in 2006 and one in 2007. On March 8, 2013, theMunicipality filed suit against ICRC, PND, and CH2M HILL Alaska, Inc. in the Superior Court for the State of Alaska, Third Judicial Districtat Anchorage. Four additional parties (GeoEngineers, Inc.; Terracon Consultants, Inc.; Colaska, Inc.; and MKB Constructors) were later addedto the litigation. The matter was later transferred to the United States District Court for the District of Alaska. The Municipality alleged theproject suffered from design and construction deficiencies, and initially claimed damages against all defendants of approximately$340.0 million. The Municipality’s claims against CH2M HILL Alaska, Inc. ultimately included claims for professional negligence,negligence, and negligent misrepresentation. The Court issued a ruling on October 31, 2016, granting CH2M HILL Alaska, Inc.’s motion forsummary judgment as to negligence, negligent misrepresentation, and the portion of the professional negligence claim relating to VECO’s 2007report. The Municipality has also filed suit against MarAd in the Court of Federal Claims related to the Project. On January 6, 2017, theMunicipality and CH2M HILL Alaska, Inc. reached a settlement for an immaterial amount under fair and reasonable terms, and theMunicipality dismissed CH2M HILL Alaska, Inc. with prejudice from the litigation.
In 2009, URS-CH2M HILL Amtrak Joint Venture, a joint venture formed by CH2M HILL, Inc., a wholly owned subsidiary of CH2MHILL Companies, Ltd., and URS Corporation (“URS”) was contracted by Amtrak to provide Program Management Oversight andadministration services for the Amtrak Improvements Project, a $1.3 billion Amtrak-awarded stimulus funded under the American Recoveryand Reinvestment Act. This ongoing appointment includes over 366 projects involving improvements to bridges,
32

Table of Contents
communications and systems, electrical transmission, stations, security, railroad ties, etc. On July 17, 2014, Amtrak’s Office of InspectorGeneral served a subpoena duces tecum on CH2M HILL, Inc. and joint venture partner, URS, requesting multiple categories ofrecords. Following CH2M HILL, Inc.’s production of documents in compliance with the subpoena, the U.S. Attorney’s Office in Philadelphiacontacted CH2M HILL, Inc.’s outside counsel in January 2016 and has since asserted potential violations of the federal False Claims Actresulting in excess of $3.0 million in claims. CH2M HILL, Inc. and the federal government have reached a settlement in principle under fairand reasonable terms to settle the government’s civil False Claims Act claims. On February 27, 2017, the parties reached a settlement pursuantto which CH2M HILL, Inc. and its joint venture partner will pay the United States federal government $1.5 million.
In 2012, CH2M HILL Australia Pty Limited entered into a 50/50 integrated joint venture with UGL Infrastructure Pty Limited(“UGL”), an Australian construction contractor (“CH2M-UGL JV” or “JV”). The JV entered into a Consortium Agreement with GeneralElectric and GE Electrical International Inc (“Consortium”). The Consortium was awarded a contract by JKC Australia LNG Pty Limited(“JKC”) for the engineering, procurement, construction and commissioning of a 360 MW Combined Cycle Power Plant (the “Project”) forINPEX Operations Australia Pty Limited (“Inpex”) at Blaydin Point, Darwin, NT, Australia (the “Subcontract”). On January 24, 2017, theConsortium terminated the Subcontract because of JKC’s repudiatory breach. The Consortium also demobilized from the work site. TheConsortium issued a termination letter which described JKC’s failure to properly administer the Subcontract. JKC’s failures include, amongother things, (1) a failure to provide fuel gas by the milestone date and (2) delay in the provision of electrical load against the previously advisedprogram. There are a number of other omissions and interferences by JKC with respect to completing site documentation that have alsocontributed to the Consortium’s decision to terminate the Subcontract. JKC has claimed that the Consortium’s termination was not valid. JKCclaims the Consortium has abandoned the work and, as such, JKC has now purported to terminate the Subcontract. The Consortium and JKCare now in dispute over the termination. The Consortium expects to file arbitration claims against JKC, and anticipates that JKC will file claimsback. We expect the arbitration to be lengthy and at this time are unable to predict the timing of resolution or the outcome of disputes, but theoutcome could be materially adverse to our results of operations, cash flow and financial condition. The primary dispute over the termination isto be decided in an International Chamber of Commerce arbitration in Singapore.
Item 4. Mine Safety Disclosure s
None.
PART I I
Item 5 . Market for Registrant’s Common Equity, Related Stockholder Matters and Issuer Purchases of Equity Securities
Market Information
CH2M has a long history as an employee-controlled professional engineering services firm. Our common stock was, in the past, onlyavailable to be owned by certain active and former employees, directors, eligible consultants and benefit plans and their participants and, underlimited circumstances at our discretion, other third-parties. We refer to those eligible owners of our common stock as our “eligible employeestockholders.” In 2015, our stockholders approved certain measures, including amendments to CH2M’s restated certificate of incorporation,intended to facilitate investments in CH2M's common or preferred stock, including preferred stock convertible into common stock, by third-party investors, who we refer to as “outside investors,” and to permit such outside investors to transfer CH2M common stock other than throughthe internal market, subject to any contractual limitations CH2M and the outside investor agree upon. In addition, certain other rights andrestrictions in our restated certificate of incorporation are applicable to eligible employee stockholders, but are not applicable to outsideinvestors who may hold common or preferred stock in CH2M from time to time.
There is no market on which our stock may be purchased by the general public. In order to provide liquidity for our stockholders, in2000 CH2M established an Internal Market (“Internal Market”) operated through an independent broker, currently Neidiger, Tucker andBruner, Inc. (“NTB”) .
The Internal Market enables eligible employee stockholders to offer to sell or purchase shares of our common stock on predetermineddays (each, a “Trade Date”). The Trade Dates are determined by our Board of Directors in it sole discretion and generally occur on a quarterlybasis. Unlike public companies whose stock is traded on a national securities exchange, the price of our common stock is determined by ourBoard of Directors, generally on a quarterly basis in conjunction with the determination and
33

Table of Contents
announcement of quarterly Trade Dates based on a company fair valuation methodology that is intended to establish a price for our commonstock that represents fair value as of the applicable Trade Date. After our Board of Directors determines the stock price for use on the nextTrade Date, all eligible employee stockholders are advised as to the new stock price and the next Trade Date .
Purchases of common stock on the Internal Market are restricted to the following authorized buyers :
· Our employees, directors and certain eligible consultants;· Trustees of the benefit plans (on behalf of plan participants); and,· Administrator of the Payroll Deduction Stock Purchase Plan (“PDSPP”) (on behalf of PDSPP participants).
In addition, at the discretion of our Board of Directors, we may permit other third parties to purchase common stock from existingstockholders under limited circumstances in private transactions outside of the Internal Market. Authorized sellers who may sell shares throughthe Internal Market include the authorized buyers and former employees who acquired shares of our common stock while employed, as well asany third parties who may be permitted to purchase our common stock as described above.
Our Internal Market is managed through an independent broker, currently NTB. On each Trade Date, NTB acts upon instructions, or“orders,” from the buyers and sellers to trade shares of our common stock at the stock price set by our Board of Directors and in accordancewith the Internal Market rules. All sellers on the Internal Market, other than CH2M and the trustees of the CH2M HILL Companies, Ltd.Amended and Restated 401(k) Plan ( the “401(k) Plan”), pay NTB a commission fee equal to three tenths of one percent (0.3%) of the proceedsfrom such sales. No commission is paid by buyers on the Internal Market. NTB does not play a role in determining the price of our commonstock and is not affiliated with CH2M. Individual stock ownership account records are currently maintained by our in-house transfer agent.
The Internal Market functions differently than most public securities markets, where actual market trading activity determines thetrading price of the securities. On the Internal Market, the price of shares of our common stock is determined by our Board of Directors basedon their judgment of fair value. Our eligible employee stockholders then make independent decisions to submit buy orders and sell orders foreach trade date, which generally does not result in a “balanced market” because the number of buy orders and sell orders are unequal. TheInternal Market rules permit CH2M to elect to purchase shares if the Internal Market is “under-subscribed” for a particular Trade Date, meaningthat there are more sell orders than buy orders. Similarly, CH2M may elect to sell shares or impose limitations on the number of shares that anauthorized buyer may purchase if the Internal Market is “over-subscribed” for a particular Trade Date, meaning that there are more buy ordersthan sell orders. Since the inception of the Internal Market in 2000, the Internal Market has been under-subscribed on all Trade Datesbut one.
CH2M may, but is not obligated to, purchase shares of common stock on the Internal Market on any Trade Date at the price in effecton that Trade Date, but only to the extent that the number of shares offered for sale by eligible employee stockholders exceeds the number ofshares sought to be purchased by authorized buyers. The decision whether or not CH2M will purchase shares in the Internal Market, if theInternal Market is under-subscribed, is solely within the discretion of our management and Board of Directors, and we generally will not notifyeligible employee stockholders as to whether or not we will participate prior to the Trade Date. Eligible employee stockholders shouldunderstand that there can be no assurance that they will be able to sell their stock without substantial delay or at all on the Internal Market. Inmaking the determination as to whether to participate in an under-subscribed market on any trade date, CH2M’s management and Board ofDirectors consider relevant factors in light of prevailing circumstances, including our financial condition and results of operations, our availablecash and capital resources, including the limits that CH2M may spend on share repurchases and the borrowing capacity available pursuant to theterms of our Amended Credit Agreement and other sources of liquidity, limitations on repurchases contained in our Certificate of Designation,other contractual terms agreed to with any outside investor, expected current and future needs for cash to fund our operations, anticipatedcontingencies and other factors. Depending on prevailing circumstances, we may consider other factors from time to time in connection withthe decision whether or not to participate in an under-subscribed market on any particular Trade Date .
If the aggregate number of shares offered for sale on the Internal Market on any Trade Date is greater than the number of shares soughtto be purchased and CH2M’s management and Board of Directors determine to limit the amount of money expended by CH2M to repurchaseshares in the Internal Market, or not to participate in the Internal Market, sell orders submitted by eligible employee stockholders will be subjectto proration or allocation, meaning that sell orders will be accepted as follows :
· Proration . If enough buy orders are received to purchase all the shares offered by each eligible employee stockholder who wantsto sell fewer than 500 shares, which we refer to as the “proration threshold,” and at least 500 shares from each
34

Table of Contents
other seller, then all sell orders will be accepted up to the first 500 shares and the portion of any sell orders exceeding 500 shareswill be accepted on a pro-rata basis. In other words, every eligible employee stockholder selling 500 or fewer shares would sellall of such shares, while eligible employee stockholders seeking to sell more than 500 shares would sell 500 shares plus a portionof the remainder of the shares they are offering. The proration threshold is subject to change at the discretion of our Board ofDirectors and any change to the proration threshold will be announced in advance of the Trade Date on which the change will takeeffect.
· Allocation. If not enough buy orders are received to give effect to the proration described above, then the purchase orders will beallocated equally to each seller. For example, if there are only enough buy orders to purchase up to 100 shares from every seller,then every seller will sell the same number (100) of shares (except eligible employee stockholders who want to sell fewer than100 shares, who would sell the exact number of shares they specify in their sell orders) even though some sellers may be seekingto sell only 100 (or fewer) shares, while others are seeking to sell considerably more shares.
In any such case, all shares of common stock offered by any eligible employee stockholder for sale but not sold on that Trade Datewould remain the property of the eligible employee stockholder and held in the their name or applicable account and the eligible employeestockholder will have to submit a new sell order in order to sell such shares on a subsequent Trade Date.
CH2M experienced project losses and other adverse operating results in recent periods, which has constrained our cash flow andliquidity. In addition, CH2M’s principal revolving credit facility included limitations on the amount CH2M may spend to repurchase itscommon stock in the Internal Market in connection with its employee stock ownership program up to $75.0 million during the three quarterperiod ending March 31, 2017 and, thereafter, up to $100.0 million during a rolling four quarter period less the amount of any legally requiredpurchases of common stock held in benefit plans. Additionally, the covenants contained within CH2M’s Certificate of Designation of theSeries A Preferred Stock prohibit the repurchase by the Company of shares of our common stock in excess of negotiated pre-approvedamounts. As a result of these factors and others, CH2M management and Board of Directors determined to participate only to a limited extentin the Internal Market during 2016.
For the March 2016 Trade Date, CH2M allocated an aggregate of $26.4 million towards purchasing shares on such Trade Date, notincluding any legally required repurchases of shares held in benefit plan accounts and employee placed orders of $4.9 million to purchaseshares. The total funds available were less than the amount necessary to purchase all of the shares offered on the Internal Market for the March2016 Trade Date, so eligible employee stockholders were subject to a cap equal to 500 shares, plus approximately 10% of the remaining sharesin their order on the number of shares they could sell. For the June 2016 Trade Date, CH2M allocated an aggregate of $25.0 million towardspurchasing shares, not including any legally required repurchases and employee placed orders of $3.2 million to purchase shares. The totalfunds available were less than the amount necessary to purchase all of the shares offered on the Internal Market for the June 2016 Trade Date,so eligible employee stockholders were subject to a cap equal to 500 shares, plus approximately 17% of the remaining shares in their order onthe number of shares they could sell. For the September 2016 Trade Date, CH2M allocated $10.0 million towards purchasing shares, notincluding any legally required repurchases and employee placed orders of $3.4 million to purchase shares. The total funds available were lessthan the amount necessary to purchase all of the shares offered on the Internal Market for the September 2016 Trade Date, so eligible employeestockholders were subject to a cap equal to approximately 297 shares on the number of shares they could sell.
As disclosed in a Form 12b-25 filed with the Securities and Exchange Commission on November 15, 2016, CH2M delayed filing itsForm 10-Q for the third fiscal quarter ended September 30, 2016 due to an Audit Committee investigation into potential accounting errors withrespect to the timing and amount of certain project cost overruns reported in 2015. As a result of this delay, CH2M did not hold a Trade Dateduring the fourth quarter of 2016, and instead the Board of Directors determined to hold a Trade Date on February 10, 2017 following the filingof our Form 10-Q for the third fiscal quarter ended September 30, 2016 on January 20, 2017 with the Securities and ExchangeCommission. For the February 2017 Trade Date, CH2M allocated an aggregate of $10.0 million towards purchasing shares on such Trade Date,not including any legally required repurchases of shares held in benefit plan accounts and employees placed orders of $5.0 million to purchaseshares. The total funds available were less than the amount necessary to purchase all of the shares offered on the Internal Market for theFebruary 2017 Trade Date, so eligible employee stockholders were subject to a 260 share cap on the number of shares they could sell.
In 2017, the Company will continue to have restrictions regarding how much it can spend to repurchase shares in the InternalMarket. As noted above, CH2M’s principal revolving credit facility limits the amount CH2M may spend to repurchase its common stock in theInternal Market to up to $100.0 million during the rolling four quarter period beginning April 1, 2017, less the amount of
35
Table of Contents
any legally required purchases of common stock held in benefit plans. Additionally, in 2017, t he Certificate of Designation for the Series APreferred Stock prohibits the repurchase by the Company of shares of our common stock in excess of negotiated pre-approved amountsdetermined by a formula based upon our “Free Cash Flow” or cash flow from operations, minus capital expenditures, for fiscal 2016. Our FreeCash Flow was negative for fiscal year 2016, and as a result, other than certain specified exemptions, the Company is prohibited fromrepurchasing shares of common stock in the Internal Market, except as legally required, unless it is able to obtain the consent of the holders of atleast a majority of the Series A Preferred Stock. On January 17, 2017, the Company received from the Series A Preferred Stockholder, anacknowledgment and consent permitting the Company to spend up to $25.0 million, in the aggregate, to repurchase shares of common stock inconnection with legally required distributions and to participate as a buyer in the Internal Market on the February 2017 Trade Date. Noassurance can be given that in the future the Company will be able to obtain an acknowledgment and consent from the Series A PreferredStockholder permitting the Company to repurchase common stock in the internal market if such an acknowledgment and consent is required.
Regardless of any bank covenant or charter limitation, CH2M’s management and Board of Directors could determine to limit theamount of money expended by CH2M to repurchase shares in the Internal Market, or not to participate in the Internal Market at all, either ofwhich would result in proration of sell orders that stockholders may place for trades on the next Trade Date. In addition, CH2M’s Board ofDirectors could determine to suspend trading on the Internal Market in order to provide time to evaluate the ability to adequately provide forproration and to conserve CH2M’s cash reserves and available liquidity. Since the September 26, 2014 trade, CH2M has limited the amountexpended to repurchase shares in the Internal Market. We expect that the amounts CH2M will be able to spend to repurchase shares insubsequent Trade Dates will continue to be restricted, and CH2M’s Board of Directors and management anticipate that some sell orders will beonly partially filled on such Trade Dates.
We may sell shares or impose limitations on the number of shares that an individual eligible employee stockholder may purchase if theInternal Market is over-subscribed. To the extent that the aggregate number of shares sought to be purchased exceeds the aggregate number ofshares offered for sale, we may, but are not obligated to, sell authorized but unissued shares of common stock on the Internal Market at the pricein effect on that Trade Date to satisfy purchase demands. The decision as to whether or not we will sell shares in the Internal Market, if theInternal Market is over-subscribed, is solely within our discretion, and we will not notify eligible employee stockholders as to whether or not wewill participate prior to the Trade Date. Eligible employee stockholders should understand that there can be no assurance that they will be ableto buy as many shares as they would like on a given Trade Date. We will consider a variety of factors in making the determination as towhether to participate in an over-subscribed market. Since the inception of the Internal Market in 2000, however, the Internal Market has beenunder-subscribed on all Trade Dates but one.
If the aggregate purchase orders exceed the number of shares of our common stock available for sale in the Internal Market on anyTrade Date and a determination is made that CH2M will not issue additional shares to satisfy the excess purchase orders, the followingprospective purchasers will have priority to purchase shares, in the order listed:
· Administrator of the PDSPP;· Trustees of the 401(k) Plan; and· Internal Market participants on a pro‑rata basis (including purchases through pre‑tax and after‑tax deferred compensation
plans).
All eligible employee stockholders who desire to sell their stock upon retirement must do so in accordance with the rules governing theInternal Market. In addition, our Articles of Incorporation and Bylaws, as well as the terms of the 401(k) Plan, permit us to allow retired andother former employees to continue to hold the common stock they own after leaving. The Board of Directors has determined that formeremployees are permitted to continue to hold common stock after separation, although the Board of Directors has the discretion to change ormodify this policy at any time.
Price of our Common Stock
The price of CH2M common stock is established by the Board of Directors for each Trade Date based on a company fair valuationmethodology described in the CH2M Prospectus, dated March 23, 2010 (the “Prospectus”), as filed with the SEC, as amended by theinformation contained in the subsequent annual, quarterly and current reports filed by CH2M with the SEC pursuant
36

Table of Contents
to the Securities Exchange Act of 1934. The valuation methodology used by the Board of Directors includes the following valuation formula(“Stock Valuation Formula”):
Share Price = [(7.8 × M × P) + (SE)] / CS
As further discussed below, the Stock Valuation Formula is one of several factors considered by the Board of Directors as part of thetotal mix of information available to determine the fair value of CH2M common stock.
In order to determine the fair value of the common stock in the absence of a public trading market, our Board of Directors felt itappropriate to develop a valuation methodology to use as a tool to determine a price that would be a valid approximation of the fair value. Indetermining the fair value stock price, our Board of Directors believes that the use of a going concern component (i.e., net income, which wecall profit after tax, as adjusted by the market factor) and a book value component (i.e., total stockholders’ equity) is a reasonable valuationprocess based on factors that are generally used in the valuation of equity securities. As part of the total mix of information that our Board ofDirectors considers in determining the fair value of our common stock in addition to the Stock Valuation Formula, our Board of Directorsreviews company appraisal information prepared by independent third party valuation experts and other available information. The valuationmethodology used to determine the stock price is subject to change at the discretion of our Board of Directors, as described below.
The existence of an over-subscribed or under-subscribed market on any given Trade Date will not affect the stock price on that TradeDate. However, our Board of Directors, when determining the stock price for a future Trade Date, may take into account the fact that there havebeen under-subscribed or over-subscribed markets on prior Trade Dates.
Market Factor (“M”). “M” is the market factor, which is subjectively determined in the sole discretion of our Board of Directors. Amarket factor greater than one increases the price per share, while a market factor less than one would decrease the price per share. Indetermining the market factor, our Board of Directors takes into account factors it considers to be relevant in determining the fair value of ourcommon stock, including:
· The market for publicly traded equity securities of companies comparable to us;· The merger and acquisition market for companies comparable to us;· The prospects for our future performance, including our financial condition and results of operations;· General economic conditions;· General capital market conditions; and,· Other factors our Board of Directors deem appropriate.
Our Board of Directors has not assigned predetermined weights to the various factors it may consider in determining the market factor.
In its discretion, our Board of Directors may change the market factor used in the valuation process from time-to-time. Our Board ofDirectors could change the market factor, for example, following a change in general market conditions that either increased or decreased stockmarket equity values for companies comparable to us, if our Board of Directors felt that the market change was applicable to our common stockas well. The Board may consider adjusting the “M” factor in future periods to enable the stock price formula to better reflect the fair value ofCH2M, including expectations for the future performance of CH2M as well as any other factors as described above.
As part of the total mix of information that our Board of Directors considers in determining the “M” factor, our Board of Directors alsomay take into account company appraisal information prepared by independent valuation experts. In setting the common stock price, our Boardof Directors compares the total of the going concern and book value components used in the valuation methodology to the enterprise value ofCH2M in the appraisal provided by the independent valuation experts. If our Board of Directors concludes that its initial determination of the“M” factor should be re-examined, our Board of Directors may review, and if appropriate, adjust the “M” factor. Since the inception of theInternal Market program on January 1, 2000, the total of the going concern and book value components used by our Board of Directors insetting the price for our common stock has always been within the enterprise appraisal range provided quarterly by the independent valuationexperts.
Profit After Tax (“P”). “P” is profit after tax, otherwise referred to as net income, for the four fiscal quarters immediately precedingthe Trade Date. Our Board of Directors, at its discretion, may exclude nonrecurring or unusual transactions from the
37
Table of Contents
calculation. Nonrecurring or unusual transactions are developments that the market would not generally take into account in valuing an equitysecurity. A change in accounting rules, for example, could increase or decrease net income without changing the fair value of our commonstock. Similarly, such a change could fail to have an immediate impact on the value of our common stock, but still have an impact on the valueof our common stock over time. Our Board of Directors believes that in order to determine the fair value of our common stock, it is importantfor the Board of Directors to have the ability to review unusual or one-time events that affect net income. For example, in 2016 there was aone-time, non-cash tax benefit related to the redesign of one of our defined benefit plans in the United Kingdom. Additionally, results related toour Power EPC business are excluded as CH2M chose to exit the business in 2014, and inclusion of Power EPC results do not accurately reflectthe profitability or value of CH2M’s continuing operations. In 2016, there were also certain restructuring activities which resulted in recordingnon-cash charges for restructuring activities and recognizing a cash restructuring charge related primarily to severance costs, as well asreductions to reported earnings as a result of the recognition of certain non-cash depreciation and amortization charges relating toacquisitions. The reasons for, and effects of, these charges and reductions of our reported earnings are discussed in further detail in this AnnualReport under Item 7. Management's Discussion and Analysis of Financial Condition and Results of Operations . The Board of Directorsconcluded that these charges are among the types of cash and non-cash charges that would generally not be taken into account by the market invaluing an equity security. Therefore, the Board of Directors decided to exclude these charges from the “P” (profit after tax) parameter forstock valuation purposes during the relevant periods and expects to treat similar charges and costs in future periods in the samemanner. Because “P” is calculated on a four quarter basis, an exclusion impacts the calculation of fair value for four consecutive quarters. OurBoard of Directors may determine to exclude other future unusual or non-recurring items from the calculation of “P”.
Total Stockholders’ Equity (“SE”). “SE” is CH2M’s total stockholders’ equity, which includes intangible items, as set forth on ourmost recent available quarterly or annual financial statements. Our Board of Directors, at its discretion, may exclude from the stockholders’equity parameter nonrecurring or unusual transactions that the market would not generally take into account in valuing an equity security. Theexclusions from stockholders’ equity will generally be those transactions that are non-cash and are reported as “accumulated othercomprehensive income (loss)” on the face of our consolidated balance sheet. For example, our Board of Directors excluded, and will continueto exclude, a non-cash adjustment to stockholders’ equity related to the accounting for our defined benefit pension and other postretirementplans. Because this adjustment is unusual and will fluctuate from period to period, our Board of Directors exclude it from the “SE” parameterfor stock valuation purposes. Similarly, other items that are reported as components of “accumulated other comprehensive income (loss)” andnon-controlling interests are excluded from “SE” and include items such as unrealized gains/losses on securities and foreign currencytranslation adjustments.
Common Stock Outstanding (“CS”). “CS” is the weighted-average number of shares of our common stock outstanding during the fourfiscal quarters immediately preceding the Trade Date, calculated on a fully-diluted basis. By “fully-diluted” we mean that the calculations aremade as if all outstanding options to purchase our common stock had been exercised and other “dilutive” securities, such as our Series APreferred Stock, were converted into shares of our common stock. In addition, an estimate of the weighted-average number of shares that wereasonably anticipate will be issued under our stock-based compensation programs and employee benefit plans is included in thiscalculation. For example, we include in CS as calculated an estimate of the weighted-average number of shares that we reasonably anticipatewill be issued during the next four quarters under our stock-based compensation programs and employee benefit plans in this calculation. Weinclude an estimate of the weighted-average number of shares that we reasonably anticipate will be issued during the next four quarters becausewe have more than a 30-year history in making annual grants of stock-based compensation. Therefore, we believe that we have sufficientinformation to reasonably estimate the number of such “to be issued” shares. This approach avoids an artificial variance in share value duringthe first calendar quarter of each year when the bulk of shares of our common stock are issued by us pursuant to our stock-based compensationprograms. Similarly, if we make a substantial issuance of shares during the four fiscal quarters immediately preceding the Trade Date, using theweighted average of those shares may create an inappropriate variance in share value during the four fiscal quarters following the issuance. Forexample, if we use shares as all or part of the consideration for the acquisition of a business, the time-weighted average number of shares issuedin the acquisition transaction would not match the impact of the transaction reflected in total stockholders’ equity (or “SE”) as describedabove. Therefore, in the discretion of the Board of Directors, a substantial issuance of shares during the four-quarter period used to calculateCS for each Trade Date may be treated as having been issued at the beginning of such four-quarter period. As a result, our Board of Directorsmay determine, in its discretion, to adjust the weighted-average number of shares to reflect in an appropriate manner the impact of past oranticipated future issuances.
38

Table of Contents
The following table shows a comparison of the “CS” value actually used by our Board of Directors to calculate common stock priceson the dates indicated versus the year-to-date weighted-average number of shares of common stock as reflected in the diluted earnings per sharecalculation in our financial statements for the past three years.
YTD Weighted ‑‑ Average Number of Shares as reflected inEffective Date CS Diluted EPS calculation (in thousands) (in thousands)February 14, 2014 30,502 29,890May 16, 2014 30,242 28,809August 15, 2014 29,892 28,976November 24, 2014 29,470 28,429February 20, 2015 28,980 28,257May 7, 2015 28,465 27,386August 3, 2015 31,270 27,383November 2, 2015 31,918 28,717February 22, 2016 31,702 27,181May 2, 2016 31,482 26,507August 1, 2016 33,111 26,065January 19, 2017 32,622 25,817March 6, 2017 32,173 25,732
Constant 7.8 . In the course of developing this valuation methodology, it became apparent to our Board of Directors that a multiplewould be required in order for the common stock price derived by this methodology to approximate our historical, pre-Internal Market commonstock price. Another objective of our Board of Directors when developing the valuation methodology was to establish the fair value of ourcommon stock using a market factor of 1.0. We believe that it was important to begin the Internal Market program with an “M” factor equal to1.0 in order to make it easier for stockholders to understand future changes, if any, to the market factor.
Therefore, the constant 7.8 was introduced into the formula. The constant 7.8 is the multiple that our Board of Directors determinednecessary (i) for the new stock price to approximate our historical stock price derived using the pre-Internal Market formula as well as (ii) toallow the use of the market factor of 1.0 at the beginning of the Internal Market program.
We generally announce the new stock price and the Trade Date approximately four weeks prior to each Trade Date. The broker,currently NTB, will deliver the information to all employees and eligible participants in the internal market. In addition, we will file a CurrentReport on Form 8-K disclosing the new stock price and all components used by our Board of Directors in determining such price in accordancewith the valuation methodology described above.
We will also make the most current prospectus for our common stock and our audited annual financial statements available to allstockholders, as well as other employees, and to participants in the Internal Market through the employee benefit plans. Such information willbe made available at the same time as our annual reports and proxy information.
Current Price of Our Common Stock
Starting in 2000, with the introduction of the Internal Market and its quarterly trades, our Board of Directors reviews the commonstock price prior to each Trade Date using the valuation methodology described above to set the price for the common stock.
39
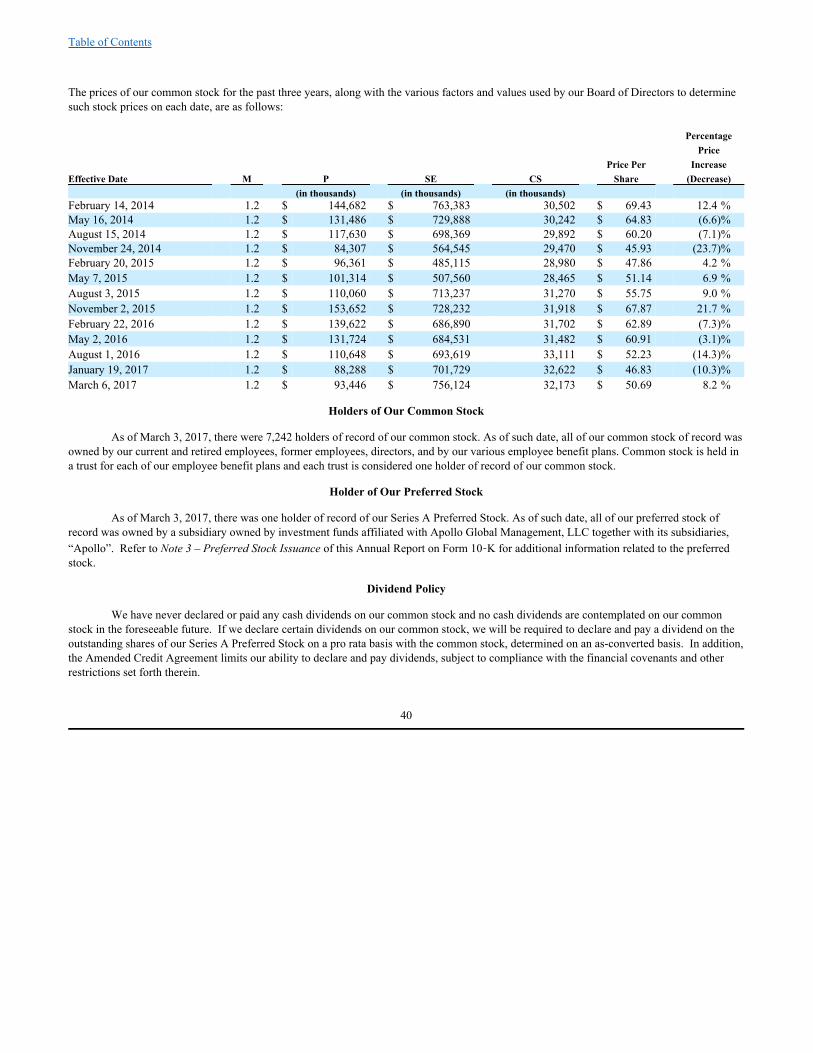
Table of Contents
The prices of our common stock for the past three years, along with the various factors and values used by our Board of Directors to determinesuch stock prices on each date, are as follows:
Percentage Price Price Per IncreaseEffective Date M P SE CS Share (Decrease) (in thousands) (in thousands) (in thousands) February 14, 2014 1.2 $ 144,682 $ 763,383 30,502 $ 69.43 12.4 % May 16, 2014 1.2 $ 131,486 $ 729,888 30,242 $ 64.83 (6.6)% August 15, 2014 1.2 $ 117,630 $ 698,369 29,892 $ 60.20 (7.1)% November 24, 2014 1.2 $ 84,307 $ 564,545 29,470 $ 45.93 (23.7)% February 20, 2015 1.2 $ 96,361 $ 485,115 28,980 $ 47.86 4.2 % May 7, 2015 1.2 $ 101,314 $ 507,560 28,465 $ 51.14 6.9 % August 3, 2015 1.2 $ 110,060 $ 713,237 31,270 $ 55.75 9.0 % November 2, 2015 1.2 $ 153,652 $ 728,232 31,918 $ 67.87 21.7 % February 22, 2016 1.2 $ 139,622 $ 686,890 31,702 $ 62.89 (7.3)% May 2, 2016 1.2 $ 131,724 $ 684,531 31,482 $ 60.91 (3.1)% August 1, 2016 1.2 $ 110,648 $ 693,619 33,111 $ 52.23 (14.3)% January 19, 2017 1.2 $ 88,288 $ 701,729 32,622 $ 46.83 (10.3)% March 6, 2017 1.2 $ 93,446 $ 756,124 32,173 $ 50.69 8.2 %
Holders of Our Common Stock
As of March 3, 2017, there were 7,242 holders of record of our common stock. As of such date, all of our common stock of record wasowned by our current and retired employees, former employees, directors, and by our various employee benefit plans. Common stock is held ina trust for each of our employee benefit plans and each trust is considered one holder of record of our common stock.
Holder of Our Preferred Stock
As of March 3, 2017, there was one holder of record of our Series A Preferred Stock. As of such date, all of our preferred stock ofrecord was owned by a subsidiary owned by investment funds affiliated with Apollo Global Management, LLC together with its subsidiaries,“Apollo”. Refer to Note 3 – Preferred Stock Issuance of this Annual Report on Form 10‑K for additional information related to the preferredstock.
Dividend Policy
We have never declared or paid any cash dividends on our common stock and no cash dividends are contemplated on our commonstock in the foreseeable future. If we declare certain dividends on our common stock, we will be required to declare and pay a dividend on theoutstanding shares of our Series A Preferred Stock on a pro rata basis with the common stock, determined on an as-converted basis. In addition,the Amended Credit Agreement limits our ability to declare and pay dividends, subject to compliance with the financial covenants and otherrestrictions set forth therein.
40

Table of Contents
Issuer Purchases of Equity Securities
The following table covers the purchases of our securities by CH2M during the quarter ended December 30, 2016:
Total Number of Maximum Number Shares Purchased of Shares that May Total Average as Part of Publicly Yet Be Purchased Number of Price Paid Announced Plans Under the Plans or Period Shares per Share or Programs Programs October (a) 3,394 $ 52.23 — — November — — — — December (b) 6,278 $ 52.23 — —
Total 9,672 $ 52.23 — —
(a) Shares purchased by CH2M from terminated employees.(b) Minimum required distributions of CH2M shares from our 401(k) Plan.
Item 6. Selected Financial Dat a
The selected financial data presented below under the captions “Selected Statement of Operations Data” and “Selected Balance SheetData” for, and as of the end of, each of the years in the five‑year period ended December 30, 2016, are derived from the consolidated financialstatements of CH2M HILL Companies, Ltd. and subsidiaries, which have been audited by KPMG LLP, an independent registered publicaccounting firm. The consolidated financial statements as of December 30, 2016 and December 25, 2015, and for each of the years in thethree‑year period ended December 30, 2016, and the report thereon of KPMG LLP, are included in Item 15. Exhibits and Financial StatementSchedules of this Annual Report on Form 10‑K. The following information should be read in conjunction with Item 7. Management’sDiscussion and Analysis of Financial Condition and Results of Operations and the consolidated financial statements and related notes thereto.
Years Ended December 30, December 25, December 31, December 31, December 31, ($ in millions, except per share data) 2016 2015 2014 2013 2012 Selected Statement of Operations Data:
Revenue $ 5,235.9 $ 5,361.5 $ 5,413.5 $ 5,877.8 $ 6,160.6 Operating (loss) income (240.1)(b) 134.8 (341.6)(d) 192.4 158.8 Net income (loss) attributable to CH2M 15.0 (b) 80.4 (181.5)(d) 118.3 93.0 Net income (loss) attributable to CH2M per commonshare:
Basic $ 0.03 $ 2.62 $ (6.42) $ 4.00 $ 2.99 Diluted $ 0.03 $ 2.61 $ (6.42) $ 3.96 $ 2.95
Selected Balance Sheet Data: Total assets $ 2,670.5 $ 2,861.3 $ 2,941.3 $ 3056.4 $ 3,114.6 Long-term debt, including current maturities (a) 497.9 301.7 513.0 391.1 252.3 Total CH2M stockholders’ equity 546.7 ( c) 412.2 212.8 (e) 624.4 603.7
(a) Substantially all of our long‑term debt relates to our revolving credit facility. Borrowings on this facility are primarily used forworking capital needs, required pension contributions and funds to repurchase shares on our internal market.
(b) The operating loss primarily was caused by estimated project losses and costs incurred for restructuring activities in 2016. Theoperating loss was offset by the release of a significant tax valuation allowance for an existing deferred tax asset related to the HalcrowPension Scheme benefit restructuring as well as project losses attributable to noncontrolling interests resulting in net incomeattributable to CH2M.
(c) The increase in stockholders’ equity primarily relates to the change in accumulated other comprehensive income due to the HalcrowPension Scheme benefit restructuring.
(d) The primary cause for the operating loss income and net loss attributable to CH2M relates to estimated project losses, impairmentcharges, and costs incurred for restructuring activities in 2014.
(e) The decrease in stockholders’ equity is related to the consolidated net loss incurred in 2014, shares repurchases and changes
41
Table of Contents
in assumptions that increased pension liabilities that are included in accumulated other comprehensive income.
Item 7. Management’s Discussion and Analysis of Financial Condition and Results of Operations
Business Summary
Founded in 1946, we are a large employee-controlled professional engineering services firm providing engineering, construction,consulting, design, design-build, procurement, operations and maintenance, EPC, program management and technical services around theworld. We have approximately 20,000 employees worldwide inclusive of craft and hourly employees as well as employees in our consolidatedjoint ventures.
We provide services to a diverse customer base including the U.S. federal and foreign governments and governmental authorities;provincial, state and local municipal governments and agencies; universities; and private sector industries. We believe we provide our clientswith innovative project delivery using cost-effective approaches and advanced technologies.
Our revenue is dependent upon our ability to attract and retain qualified and productive employees, identify business opportunities,allocate our labor resources to profitable markets, secure new contracts, execute existing contracts, and maintain existing clientrelationships. Moreover, as a professional services company, the quality of the work generated by our employees is integral to our revenuegeneration.
Private Equity Investor
On June 22, 2015, the Company designated 10,000,000 shares as Series A Preferred Stock with an original issue price of $62.22 underthe Certificate of Designation. On June 24, 2015, the Company sold and issued an aggregate of 3,214,400 shares of Series A Preferred Stock foran aggregate purchase price of $200.0 million in a private placement to a subsidiary owned by investment funds affiliated with Apollo GlobalManagement, LLC (together with its subsidiaries, “Apollo”). Total proceeds from the preferred stock offering were $191.7 million, net ofissuance costs of $8.3 million. The sale occurred in connection with the initial closing pursuant to the Subscription Agreement entered into bythe Company and Apollo on May 27, 2015 (“Subscription Agreement”).
On April 11, 2016, pursuant to the Subscription Agreement, we sold and issued in a second closing an aggregate of 1,607,200 shares ofSeries A Preferred Stock to Apollo at a price of $62.22 per share for an aggregate purchase price of approximately $100.0 million in a privateplacement. Total proceeds from the preferred stock offering were $99.8 million, net of issuance costs of $0.2 million.
Under our agreement with Apollo, the Company’s maximum consolidated leverage ratio is 3.00x for 2016 and beyond, consistent withour Amended Credit Agreement. As of December 30, 2016, we were in compliance with this covenant. Management continually assesses itspotential future compliance with the consolidated leverage ratio covenant based on estimates of future earnings and cash flows. If there is anexpected possibility on non-compliance, we will discuss possibilities with Apollo to modify the covenant consistent with discussions with theCompany’s lenders or utilize other means of capitalizing the Company to anticipate or remedy any non-compliance. The expected cash outflowsrequired to fund the project losses discussed in Note 2 – Changes in Project-Related Estimates of the Notes to Consolidated FinancialStatements in Item 15 of this Annual Report on Form 10‑K and the related impact on earnings will put a financial strain on the Company thatmay require an amendment or other remedies to be pursued by management if certain earnings estimates or cash flow improvement initiativesare not achieved or if required to facilitate restructuring plans.
Additionally, the Certificate of Designation for the Series A Preferred Stock prohibits the repurchase by the Company of shares of ourcommon stock in excess of negotiated pre-approved amounts in 2015 and 2016, and in excess of amounts determined by a negotiated formula in2017 and beyond. In 2017, t he Certificate of Designation for the Series A Preferred Stock prohibits the repurchase by the Company of sharesof our common stock in excess of negotiated pre-approved amounts determined by a formula based upon our “Free Cash Flow” or our cash flowfrom operations, minus capital expenditures, for fiscal year 2016. Our Free Cash Flow was negative for the year ended December 30, 2016, andas a result, other than certain specified exemptions, the Company is prohibited from repurchasing shares of common stock in the internalmarket, except as legally required, in the year ending December 29, 2017 unless it is able to obtain the consent of the holders of at least amajority of the Series A Preferred Stock. On January 17, 2017, the Company received from the Series A Preferred Stock holder, anacknowledgment and consent permitting the Company to spend up to $25.0 million, in the aggregate, to repurchase shares of common stock inthe first trade of 2017. No assurance can be given that in the future the Company will be able to obtain an acknowledgment and consent fromthe Series A
42
Table of Contents
Preferred Stockholder permitting the Company to repurchase common stock in the internal market.
For a summary of the terms and conditions of the Series A Preferred Stock, see Note 3 – Preferred Stock Issuance of the consolidatedfinancial statements.
Defined Benefit Plans During the year ended December 30, 2016, the Company adopted an amendment for one of our United States defined benefit plans, the
CH2M HILL OMI Retirement Plan OMI Plan, to freeze future pay and benefit service accruals beginning in 2017 for non-union participants,resulting a gain on curtailment of $4.6 million. There was also an additional gain of $1.2 million due to settlements within several small definedbenefit pension plans in the Middle East during the year ended December 30, 2016.
On October 4, 2016, Halcrow Group Limited (“HGL”), a subsidiary of CH2M, effected a transaction to restructure the benefits
provided to members of the Halcrow Pension Scheme (“HPS”), a defined benefit plan sponsored by HGL, by providing each member with theoption to transfer his or her benefits in the HPS to a new pension scheme, which is also sponsored by HGL (“HPS2”). Alternatively, membershad the option to remain in the HPS which will enter the Pension Protection Fund (“PPF”) under a regulated apportionment arrangement. Thenew scheme, HPS2, provides benefits that are better than the compensation that would otherwise be paid by the PPF if a member chose to jointhe PPF rather than HPS2. The PPF was created by the United Kingdom Pensions Act 2004 to provide compensation to members of eligibledefined benefit pension schemes when an employer of the scheme can no longer support the pension scheme. A member that transferred toHPS2 will receive substantially similar benefits to those in the HPS, except that annual increases and revaluation of benefits are reduced tostatutory levels. A pension scheme member of the HPS that elected to transfer to the new scheme also received a one-time uplift to benefits ofeither 1.0% or 2.5%. The Pension Regulator, which is the United Kingdom’s executive body that regulates work-based pension schemes, andthe PPF provided necessary regulatory approvals for the transaction to restructure the HPS benefits.
As a result of the transaction described above, HGL ceased to have any further obligations to the HPS on October 4, 2016. All
members who consented to transfer to HPS2 were transferred on October 5, 2016. Members who agreed to transfer to the new scheme accountfor 96.6% of the HPS’ liabilities and a broadly equivalent proportion of the HPS’ assets have transferred to the new scheme, as well as 20% ofHGL’s equity issued as part of the transaction. Those members who remained in the HPS began the process of transferring to the PPF duringthe fourth quarter of 2016 along with the assets that remain in the HPS, as well as 5% of HGL’s equity issued as part of the transaction.
Additionally, in connection with the transaction, CH2M issued a £50.0 million, approximately $65.0 million, parent company
guarantee to support HPS2 and funded £80.0 million, approximately $104.0 million, to be allocated between HPS2 and the PPF based on theproportion of the HPS’ members that transferred to HPS2. As discussed in more detail in the Income Taxes section below, we also removed aHGL valuation allowance, generating a benefit of approximately $65.0 million in the year ended December 30, 2016. As a result of thetransaction on October 4, 2016, our overall pension liability was reduced by approximately $228.9 million.
For additional details regarding our defined benefit pension plans, see Note 16 – Employee Retirement Plans of the Notes to
Consolidated Financial Statements in Item 15 of this Annual Report on Form 10‑K.
Restructuring Plans
2016 Restructuring Plan. During the third quarter of 2016, the Company began a process to review the structure and resources withinits business segments and formulate a restructuring plan to more fully align global operations with the Company’s client-centric strategy,including a simplified organization structure and streamlined delivery model to achieve higher levels of profitable growth (“2016 RestructuringPlan”). The restructuring activities include such items as workforce reductions and facilities consolidations. During the year endedDecember 30, 2016, we incurred $42.2 million of costs for these restructuring activities related to the 2016 Restructuring Plan, which have beenincluded in selling, general and administration expense on the consolidated statements of operations. Overall, we expect to incur up toapproximately $50.0 million to $70.0 million in total restructuring charges under the 2016 Restructuring Plan, primarily related to employeeseverance and termination benefits and facilities consolidation costs. We expect the 2016 Restructuring Plan to be completed in the first half of2017 and to result in aggregate annual cost savings of approximately $100.0 million.
43
Table of Contents
2014 Restructuring Plan. During the third quarter of 2014, the Company commenced certain restructuring activities in order toachieve important business objectives, including reducing overhead costs, improving efficiency, and reducing risk (“2014 RestructuringPlan”). These restructuring activities, which continued into 2015, included such items as a voluntary retirement program, workforce reductions,facilities consolidations and closures, and evaluation of certain lines of business. For the years ended December 25, 2015 and December 31,2014, we incurred $60.6 million and $70.4 million, respectively, of costs for these restructuring activities which have been included in selling,general and administration expense on the consolidated statements of operations. The restructuring activities under the 2014 Restructuring Planwere substantially complete as of December 25, 2015.
The Company’s overall overhead cost structure has benefited from the restructuring activities as described in the Results of Operations
section below through the reduction of costs within the corporate overhead functions as well as overhead costs within the business segmentsthemselves. A portion of these costs savings has been offset by the charges incurred in the years ended December 30, 2016 and December 25,2015.
Acquisitions
We continuously monitor acquisition and investment opportunities that will expand our portfolio of services, provide local resourcesinternationally to serve our customers, and add value to the projects undertaken for clients. On September 6, 2016, we acquired a controllinginterest in one of our joint ventures for consideration of $6.3 million, $2.1 million net of cash acquired, resulting in a gain of $15.0 million onthe fair value remeasurement of the original equity method investment recorded in equity in earnings of joint ventures and affiliated companiesand $31.3 million of goodwill.
On April 4, 2014, we acquired certain agreed upon assets and liabilities of TERA Environmental Consultants (“TERA”) forconsideration of $119.6 million. TERA was an employee-owned environmental consulting firm headquartered in Canada specializing inproviding environmental assessment, planning, siting, permitting, licensing, and related services for the pipeline, electrical transmission, and oiland gas industries.
Summary of Operations
In the first quarter of 2016, we implemented certain organizational changes, including the reorganization of our internal reportingstructure to better facilitate our strategy for growth and operational efficiency. In connection with this refinement, we discontinued our formerIndustrial and Urban Environments (“IUE”) business group as a standalone unit, and we combined its industrial and advanced technologybusiness with our Oil, Gas and Chemicals business group to form the Energy and Industrial business group. Additionally, our urbanenvironments and sports business which was formerly within IUE was combined with our Water business group. Our Power EPC businesscontinues to be monitored as a separate operating segment as we exit the fixed-price Power EPC business. As a result of this reorganization, weidentified our four business groups, which include Energy and Industrial, Environment and Nuclear, Transportation, and Water, as well as ourPower EPC business as reportable operating segments.
Costs for corporate general and administrative expenses, restructuring costs and amortization expense related to intangible assets have
been allocated to each segment based on the estimated benefits provided by corporate functions. This allocation is primarily based upon metricsthat reflect the proportionate volume of project-related activity and employee labor costs within each segment. Prior year amounts have beenrevised to conform to the current year presentation.
During the third quarter of 2016, the Company began the process of assessing and modifying its current operating structure to more
fully align global operations with the Company’s client-centric strategy and to streamline its delivery model to achieve higher levels ofprofitable growth. The transformation became operational in the first quarter of 2017. We expect to revise our segments in 2017 as a result ofthe modified operating structure.
44
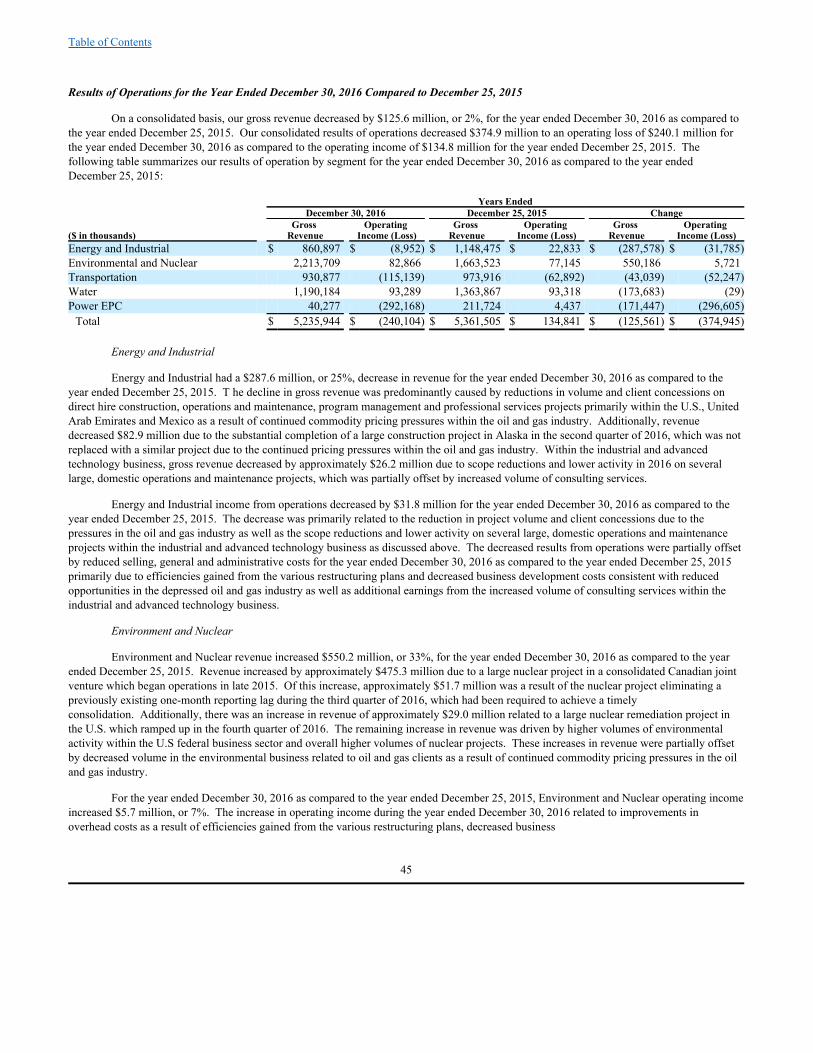
Table of Contents
Results of Operations for the Year Ended December 30, 2016 Compared to December 25, 2015
On a consolidated basis, our gross revenue decreased by $125.6 million, or 2%, for the year ended December 30, 2016 as compared tothe year ended December 25, 2015. Our consolidated results of operations decreased $374.9 million to an operating loss of $240.1 million forthe year ended December 30, 2016 as compared to the operating income of $134.8 million for the year ended December 25, 2015. Thefollowing table summarizes our results of operation by segment for the year ended December 30, 2016 as compared to the year endedDecember 25, 2015:
Years Ended December 30, 2016 December 25, 2015 Change
($ in thousands) Gross Revenue Operating
Income (Loss) Gross Revenue Operating
Income (Loss) Gross Revenue Operating
Income (Loss)Energy and Industrial $ 860,897 $ (8,952) $ 1,148,475 $ 22,833 $ (287,578) $ (31,785)Environmental and Nuclear 2,213,709 82,866 1,663,523 77,145 550,186 5,721Transportation 930,877 (115,139) 973,916 (62,892) (43,039) (52,247)Water 1,190,184 93,289 1,363,867 93,318 (173,683) (29)Power EPC 40,277 (292,168) 211,724 4,437 (171,447) (296,605)
Total $ 5,235,944 $ (240,104) $ 5,361,505 $ 134,841 $ (125,561) $ (374,945) Energy and Industrial
Energy and Industrial had a $287.6 million, or 25%, decrease in revenue for the year ended December 30, 2016 as compared to theyear ended December 25, 2015. T he decline in gross revenue was predominantly caused by reductions in volume and client concessions ondirect hire construction, operations and maintenance, program management and professional services projects primarily within the U.S., UnitedArab Emirates and Mexico as a result of continued commodity pricing pressures within the oil and gas industry. Additionally, revenuedecreased $82.9 million due to the substantial completion of a large construction project in Alaska in the second quarter of 2016, which was notreplaced with a similar project due to the continued pricing pressures within the oil and gas industry. Within the industrial and advancedtechnology business, gross revenue decreased by approximately $26.2 million due to scope reductions and lower activity in 2016 on severallarge, domestic operations and maintenance projects, which was partially offset by increased volume of consulting services.
Energy and Industrial income from operations decreased by $31.8 million for the year ended December 30, 2016 as compared to theyear ended December 25, 2015. The decrease was primarily related to the reduction in project volume and client concessions due to thepressures in the oil and gas industry as well as the scope reductions and lower activity on several large, domestic operations and maintenanceprojects within the industrial and advanced technology business as discussed above. The decreased results from operations were partially offsetby reduced selling, general and administrative costs for the year ended December 30, 2016 as compared to the year ended December 25, 2015primarily due to efficiencies gained from the various restructuring plans and decreased business development costs consistent with reducedopportunities in the depressed oil and gas industry as well as additional earnings from the increased volume of consulting services within theindustrial and advanced technology business.
Environment and Nuclear
Environment and Nuclear revenue increased $550.2 million, or 33%, for the year ended December 30, 2016 as compared to the yearended December 25, 2015. Revenue increased by approximately $475.3 million due to a large nuclear project in a consolidated Canadian jointventure which began operations in late 2015. Of this increase, approximately $51.7 million was a result of the nuclear project eliminating apreviously existing one-month reporting lag during the third quarter of 2016, which had been required to achieve a timelyconsolidation. Additionally, there was an increase in revenue of approximately $29.0 million related to a large nuclear remediation project inthe U.S. which ramped up in the fourth quarter of 2016. The remaining increase in revenue was driven by higher volumes of environmentalactivity within the U.S federal business sector and overall higher volumes of nuclear projects. These increases in revenue were partially offsetby decreased volume in the environmental business related to oil and gas clients as a result of continued commodity pricing pressures in the oiland gas industry.
For the year ended December 30, 2016 as compared to the year ended December 25, 2015, Environment and Nuclear operating incomeincreased $5.7 million, or 7%. The increase in operating income during the year ended December 30, 2016 related to improvements inoverhead costs as a result of efficiencies gained from the various restructuring plans, decreased business
45
Table of Contents
development costs, and increased earnings related to the consolidated Canadian joint venture, which were partially offset by decreased volumein the environmental business related to oil and gas clients as a result of continued commodity pricing pressures in the oil and gas industry. Dueto market conditions and the overall nature of the work, profit margin on the Canadian joint venture as well as the U.S. nuclear remediationproject are somewhat lower than on other projects in the Environment and Nuclear portfolio. Consequently, operating income was not moresignificantly impacted by these projects.
Transportation
Transportation revenue decreased $43.0 million, or 4%, in the year ended December 30, 2016 as compared to the year endedDecember 25, 2015. The decrease was primarily caused by lower revenue on our fixed-price Transportation contract to design and constructroadway improvements on an expressway in the southwestern United States, lower revenue in our Middle East Transportation businesses, aswell as the negative effects of a weaker British Pound related to our Transportation consulting business in the United Kingdom. Additionally,revenue declined approximately $6.3 million as a result of reserving against outstanding accounts receivable on a firm-fixed price roadwayproject in Latin America during the year ended December 30, 2016.
Transportation operating loss increased $52.2 million for the year ended December 30, 2016 as compared to the year endedDecember 25, 2015. The increased operating loss was predominantly caused by cost growth resulting in changes in estimated costs of$121.3 million to complete a fixed-price Transportation contract to design and construct roadway improvements on an expressway in thesouthwestern United States in the year ended December 30, 2016 as compared to the $93.6 million cost growth in the year ended December 25,2015. Refer to Note 2 – Changes in Project-Related Estimates of the Notes to Consolidated Financial Statements in Item 15 of this AnnualReport on Form 10‑K for additional detail. While management believes that it has recorded an appropriate provision to complete this project,we may incur additional costs and losses if our cost estimation processes identify new costs not previously included in our total estimatedloss. These possible cost increases include extensions of the schedule to complete the job, lower than expected productivity levels, andperformance issues with our subcontractors. These potential changes in estimates could be materially adverse to the Company’s results ofoperations, cash flow or liquidity. The remaining increased operating loss was primarily driven by the negative effects of the weaker BritishPound related to our Transportation consulting business in the United Kingdom as well as the $6.3 million reserve against outstanding accountsreceivable on the firm-fixed price roadway project in Latin America in 2016.
Water
Water revenue decreased $173.7 million, or 13%, for the year ended December 30, 2016 as compared to the year ended December 25,2015. Approximately $134.7 million of the decline in revenue was attributable to decreased activity on two design-build-operate contracts forwater treatment facilities in the western United States as the projects approach completion and the completion of a program management projectin the Middle East. Revenue also decreased by approximately $16.9 million related to reduced activity on a large program management projectin the Middle East within the urban environments and sports industry. Additionally, revenue declined due to reduced activity on projects relatedto the oil and gas industry as well as projects in Puerto Rico related to the country’s constrained spending due to its economicchallenges. These decreases in revenue were partially offset by increased volume of consulting services in the U.S. and United Kingdom,however revenue from our Water consulting business in the United Kingdom was negatively impacted by the effects of a weaker British Pound.
Water’s operating income remained relatively flat in the year ended December 30, 2016 as compared to the year ended December 25,2015. There was a $14.6 million decrease in earnings related to the water and urban environment and sports projects which experiencedreductions in revenue as discussed above, with additional declines caused by a reduction in project volume within Puerto Rico due to thecountry’s economic challenges. These declines in earnings were offset by improvements in overhead costs related to restructuring activities aswell as improvements in operating margin due to the increased ratio of high-margin consulting projects to low-margin design-build projectswithin the Water business portfolio in the year ended December 30, 2016 as compared to the year ended December 25, 2015. Additionally, weacquired a controlling interest in one of our joint ventures which primarily operates in the water and urban environment and sports businesses,resulting in a fair value remeasurement gain of $15.0 million of the original equity method investment, of which $11.3 million was includedwithin Water’s equity in earnings of joint ventures and affiliated companies.
46

Table of Contents
Power EPC
Power EPC revenues decreased $171.4 million for the year ended December 30, 2016 as compared to the year ended December 25,2015. The revenues generated within our Power EPC segment are primarily related to our fixed-price EPC project in Australia being executedthrough a consolidated joint venture consortium with an Australian construction contractor and a major U.S.-based gas power technologymanufacturer (the “Consortium”) to engineer, procure, construct and start-up a combined cycle power plant that will supply power to a largeliquefied natural gas facility. While the level of activity has remained fairly consistent from period to period, revenues have decreased as aresult of the estimated costs to complete this project increasing significantly in the year ended December 30, 2016, which resulted in a reductionof revenue based on the percentage-of-completion method for accounting purposes.
For the year ended December 30, 2016 as compared to the year ended December 25, 2015, Power EPC’s operating income decreasedby $296.6 million primarily as a result of cost growth on our Australian fixed-price Power EPC resulting in changes in estimated costs tocomplete of $301.5 million during the year ended December 30, 2016. Refer to Note 2 – Changes in Project-Related Estimates of the Notes toConsolidated Financial Statements in Item 15 of this Annual Report on Form 10‑K for additional details. This decrease was partially offset by apartial recovery of previously disputed charges on a fixed-price Power contract to design and construct a new power generation facility in thenortheastern United States which was substantially completed in 2015.
On January 24, 2017, the Consortium terminated its contract with its client the general contractor, JKC Australia LNG Pty (the“Contractor”) on the grounds that the Contractor had by its actions repudiated the contract. The Contractor has claimed that the Consortium’stermination was not valid. The Consortium, which includes the consolidated Australian joint venture partnership, expects to file arbitrationclaims against the Contractor during the first half of 2017, and anticipates that the Contractor will file counter claims. We expect a lengthy,mulit-year arbitration process and at this time we are unable to predict the timing of resolution or the outcome of disputes. While we continueto assess the possible impacts to our financial statements, the ultimate outcome of the dispute will depend upon contested issues of fact andlaw. As a result of the contract termination, we evaluated the potential future costs as of December 30, 2016 in accordance with the accountingstandards applicable to contingent liabilities. The joint venture has incurred costs totaling approximately $20.0 million in 2017 to demobilizefrom the site and expects to continue to incur significant legal and other costs until the dispute is resolved. The Consortium is also in theprocess of determining the required costs to close out and terminate its current subcontractor obligations. These costs, which we expect will beincurred in 2017, have been accrued within our provision for loss accrual in our consolidated financial statements as of December 30, 2016based upon our best estimate from the information currently available. It is possible that certain subcontractors could file claims against theConsortium as a result of our termination of their subcontract which could be material to our consolidated financial statements. Additionally,the joint venture’s performance on the project is secured by certain bonds totaling approximately $50.0 million which could potentially becalled by our client at some time in the future. If we are ultimately unsuccessful in our claim that the contract was repudiated by our client, theConsortium could be liable for the completion of the project by a separate contractor and other related damages. These additional costs couldbe materially adverse to our results of operations, cash flow and financial condition in the future.
Results of Operations for the Year Ended December 25, 2015 Compared to December 31, 2014
On a consolidated basis, our gross revenue decreased by $52.0 million, or 1%, for the year ended December 30, 2016 as compared tothe year ended December 25, 2015. Our consolidated operations improved $476.4. million to an operating income of $134.8 million for theyear ended December 25, 2015 as compared to the operating loss of $341.6 million for the year ended December 31, 2014. The following tablesummarizes our results of operation by segment for the year ended December 25, 2015 as compared to the year ended December 31, 2014 :
Years Ended December 25, 2015 December 31, 2014 Change($ in thousands) Gross
Revenue Operating Income (Loss) Gross
Revenue Operating Income (Loss) Gross
Revenue Operating Income (Loss)
Energy and Industrial $ 1,148,475 $ 22,833 $ 1,230,695 $ (61,738) $ (82,220) $ 84,571Environmental and Nuclear 1,663,523 77,145 1,666,828 64,541 (3,305) 12,604Transportation 973,916 (62,892) 947,846 (24,648) 26,070 (38,244)Water 1,363,867 93,318 1,371,155 90,128 (7,288) 3,190Power EPC 211,724 4,437 196,945 (409,869) 14,779 414,306
Total $ 5,361,505 $ 134,841 $ 5,413,469 $ (341,586) $ (51,964) $ 476,427
47
Table of Contents
Energy and Industrial
Energy and Industrial had an $82.2 million, or 7%, decrease in revenue for the year ended December 25, 2015 as compared to the yearended December 31, 2014. Primarily as a result of sustained pricing pressures within the oil and gas industry, gross revenue declined due toreduced volume and client concessions on consulting, professional services, and operations and maintenance contracts largely within the U.S.,Canada, and the Middle East. Additionally, gross revenue decreased due to the substantial completion of several U.S. and Asia-Pacificconsulting projects within the industrial and advanced technology business which were not replaced with similar large scale projects in2015. These reductions in gross revenue were partially offset by significant increased construction activity on a gas construction contract inAlaska.
Operating income within Energy and Industrial increased by $84.6 million for the year ended December 25, 2015 as compared to theyear ended December 31, 2014. Operations improved primarily due to cost efficiencies from restructuring activities, reduced businessdevelopment costs consistent with reduced opportunities in the depressed oil and gas industry, and higher margin operations and maintenanceprojects within the electronics industry. Additionally, during the year ended December 31, 2014, our industrial and advanced technologybusiness had an operating charge of approximately $17.8 million related to increased estimated costs to complete a communications installationproject in our Europe region as well as a $9.2 million goodwill impairment charge. These increases in operating income were partially offsetby the reduced volume in oil and gas related consulting, professional services, and operations and maintenance contracts as discussed above.
Environment and Nuclear
Environment and Nuclear gross revenue decreased $3.3 million for the year ended December 25, 2015 as compared to the year endedDecember 31, 2014. The decrease in revenue was attributable to a $57.1 million decrease in volumes on a domestic design-build facilityrenovation project as the project approached substantial completion in 2015. Additionally, the depressed oil and gas industry caused a$15.4 million revenue decline due to lower volumes of environmental consulting projects in Canada. Revenue also decreased in our design-build military and government facilities businesses, due to our 2014 decision to no longer pursue such business. These declines in grossrevenue were significantly offset by the ramping up of a large nuclear project in a consolidated Canadian joint venture which began operationsin late 2015.
For the year ended December 25, 2015 as compared to the year ended December 31, 2014, Environment and Nuclear operating incomeincreased $12.6 million, or 20%. The increase in operating income was primary caused by reduced costs from restructuring efficiencies in2015, as well as lower business development spending. This increase was partially offset by the reductions in revenue as previously discussedas well as a $5.3 million unfavorable claim settlement during the year ended December 25, 2015. TERA, which was acquired in the secondquarter of 2014, contributed approximately $69.2 million of revenue and $9.2 million of operating income for the year ended December 25,2015 and approximately $84.6 million of revenue and $10.6 million of operating income for the year ended December 31, 2014. The decreasein TERA revenues and earnings were a result of lower capital spending on environmental projects for oil and gas clients in Canada.
Transportation
Transportation gross revenue increased $26.1 million, or 3%, in the year ended December 25, 2015 as compared to the year endedDecember 31, 2014 primarily due to increased construction activity in 2015 on a fixed-price Transportation contract to design and constructroadway improvements on an expressway in the southwestern United States and strong organic growth on various consulting projects inEurope. These increases were partially offset by a reduction of revenue generated by our operations in Canada and Europe due to foreigncurrency fluctuations caused by the strengthening of the U.S. dollar.
Transportation operating loss increased $38.2 million for the year ended December 25, 2015 as compared to the year endedDecember 31, 2014. The loss was predominantly caused by an estimated additional cost growth resulting in changes in estimated costs of$93.6 million to complete a fixed-price Transportation contract to design and construct roadway improvements on an expressway in thesouthwestern United States in the year ended December 25, 2015 as compared to the $38.7 million cost growth in the year ended December 31,2014. Refer to Note 2 – Changes in Project-Related Estimates of the Notes to Consolidated Financial Statements in Item 15 of this AnnualReport on Form 10‑K for additional detail. The decrease in earnings was partially offset by cost improvements from restructuring initiativesand approximately $23.0 million of additional operating income from strong organic growth in the European consulting business.
48
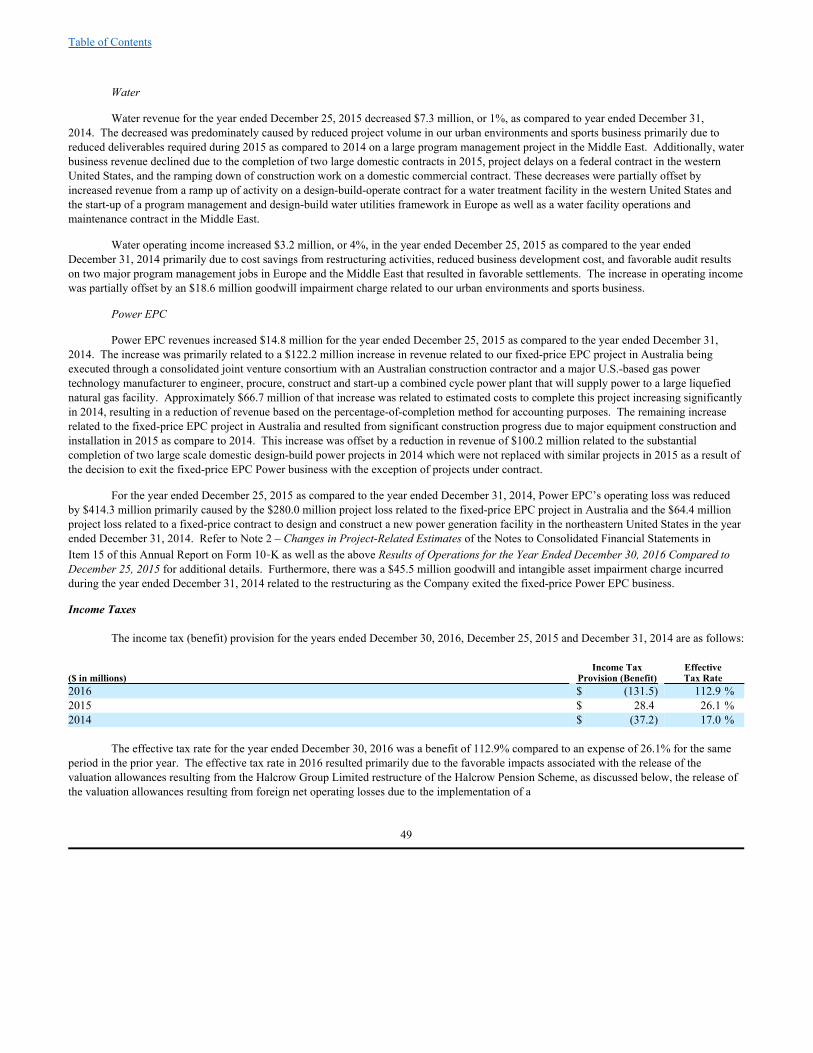
Table of Contents
Water
Water revenue for the year ended December 25, 2015 decreased $7.3 million, or 1%, as compared to year ended December 31,2014. The decreased was predominately caused by reduced project volume in our urban environments and sports business primarily due toreduced deliverables required during 2015 as compared to 2014 on a large program management project in the Middle East. Additionally, waterbusiness revenue declined due to the completion of two large domestic contracts in 2015, project delays on a federal contract in the westernUnited States, and the ramping down of construction work on a domestic commercial contract. These decreases were partially offset byincreased revenue from a ramp up of activity on a design-build-operate contract for a water treatment facility in the western United States andthe start-up of a program management and design-build water utilities framework in Europe as well as a water facility operations andmaintenance contract in the Middle East.
Water operating income increased $3.2 million, or 4%, in the year ended December 25, 2015 as compared to the year endedDecember 31, 2014 primarily due to cost savings from restructuring activities, reduced business development cost, and favorable audit resultson two major program management jobs in Europe and the Middle East that resulted in favorable settlements. The increase in operating incomewas partially offset by an $18.6 million goodwill impairment charge related to our urban environments and sports business.
Power EPC
Power EPC revenues increased $14.8 million for the year ended December 25, 2015 as compared to the year ended December 31,2014. The increase was primarily related to a $122.2 million increase in revenue related to our fixed-price EPC project in Australia beingexecuted through a consolidated joint venture consortium with an Australian construction contractor and a major U.S.-based gas powertechnology manufacturer to engineer, procure, construct and start-up a combined cycle power plant that will supply power to a large liquefiednatural gas facility. Approximately $66.7 million of that increase was related to estimated costs to complete this project increasing significantlyin 2014, resulting in a reduction of revenue based on the percentage-of-completion method for accounting purposes. The remaining increaserelated to the fixed-price EPC project in Australia and resulted from significant construction progress due to major equipment construction andinstallation in 2015 as compare to 2014. This increase was offset by a reduction in revenue of $100.2 million related to the substantialcompletion of two large scale domestic design-build power projects in 2014 which were not replaced with similar projects in 2015 as a result ofthe decision to exit the fixed-price EPC Power business with the exception of projects under contract.
For the year ended December 25, 2015 as compared to the year ended December 31, 2014, Power EPC’s operating loss was reducedby $414.3 million primarily caused by the $280.0 million project loss related to the fixed-price EPC project in Australia and the $64.4 millionproject loss related to a fixed-price contract to design and construct a new power generation facility in the northeastern United States in the yearended December 31, 2014. Refer to Note 2 – Changes in Project-Related Estimates of the Notes to Consolidated Financial Statements inItem 15 of this Annual Report on Form 10‑K as well as the above Results of Operations for the Year Ended December 30, 2016 Compared toDecember 25, 2015 for additional details. Furthermore, there was a $45.5 million goodwill and intangible asset impairment charge incurredduring the year ended December 31, 2014 related to the restructuring as the Company exited the fixed-price Power EPC business.
Income Taxes
The income tax (benefit) provision for the years ended December 30, 2016, December 25, 2015 and December 31, 2014 are as follows:
Income Tax Effective ($ in millions) Provision (Benefit) Tax Rate 2016 $ (131.5) 112.9 %2015 $ 28.4 26.1 %2014 $ (37.2) 17.0 %
The effective tax rate for the year ended December 30, 2016 was a benefit of 112.9% compared to an expense of 26.1% for the sameperiod in the prior year. The effective tax rate in 2016 resulted primarily due to the favorable impacts associated with the release of thevaluation allowances resulting from the Halcrow Group Limited restructure of the Halcrow Pension Scheme, as discussed below, the release ofthe valuation allowances resulting from foreign net operating losses due to the implementation of a
49

Table of Contents
new transfer pricing strategy and the remeasurement related to an acquisition of a controlling interest. Our effective tax rate continues to benegatively impacted by the effects of state income taxes, non-deductible foreign net operating losses, the disallowed portion of executivecompensation and the disallowed portions of meals and entertainment expenses.
CH2M is required to record all deferred tax assets or liabilities for temporary differences, net operating loss carryforwards, and taxcredit carryforwards. A deferred tax asset valuation allowance is established when it is more likely than not that all or some portion of thedeferred tax assets will not be realized in future periods. As of December 30, 2016 and December 25, 2015, we reported a valuation allowanceof $48.0 million and $210.4 million, respectively, related primarily to the reserve of certain foreign net loss carryforwards and the foreign taxcredit carryforward. The drop in valuation allowance is primarily related to the restructure of the Halcrow Pension Scheme, as discussed below,and the implementation of the new transfer pricing strategy.
Halcrow Group Limited (“HGL”) has substantial deferred tax assets, primarily related to the Halcrow Pension Scheme (“HPS). Thesedeferred tax assets represented future deductions available to HGL. When HGL was acquired in 2011, it was determined a full valuationallowance was required on these assets as there was uncertainty regarding the ability to realize these assets in the future. On October 4, 2016Halcrow Group Limited (“HGL”) completed a transaction to restructure the Halcrow Pension Scheme. As a result of the transaction, wereduced our overall pension liability and related future funding obligations. For additional information regarding the Halcrow Pension Schemeand changes to the defined benefit plan effective October 4, 2016, refer to Note 16 – Employee Retirement Plans of the Notes to ConsolidatedFinancial Statements in Item 15 of this Annual Report on Form 10‑K for additional details. Consequently, we feel that the deferred tax assets ofHGL will now more likely than not be realized and therefore the valuation allowance has been removed. This generated a benefit ofapproximately $65.0 million for the year ended December 30, 2016.
Income (losses) attributable to noncontrolling interests
We had income (losses) attributable to noncontrolling interests of ($139.3 million), $11.7 million and ($137.1 million) for the yearsended December 30, 2016, December 25, 2015 and December 31, 2014, respectively. The significant losses in the years ended December 30,2016 and December 31, 2014 were predominately related to cost growth on an Australian fixed-price Power EPC project being executed by aconsolidated joint venture. See discussion above in to Results of Operations and Note 2 – Changes in Project-Related Estimates of the Notes toConsolidated Financial Statements in Item 15 of this Annual Report on Form 10‑K for additional details regarding the Australian jointventure. As a result of the change in estimated costs to complete, we incurred a charge to joint venture operations of $301.5 million and$280.0 million in the years ended December 30, 2016 and December 31, 2014, respectively. No changes in estimated costs to complete theproject were made in 2015. Our portion of the increased project costs for the consolidated joint venture in the year ended December 30, 2016and December 31, 2014 was $154.1 million and $140.0 million, respectively. As such, the remaining losses were attributable to thenoncontrolling interest.
Liquidity and Capital Resources
Our primary sources of liquidity are cash flows from operations and borrowings under our secured revolving line of credit. Ourprimary uses of cash are working capital, acquisitions, capital expenditures and purchases of stock in our internal market. Changes in ourworking capital requirements can vary significantly from period to period based primarily on the mix of our projects underway and thepercentage of work completed during the period. We maintain a domestic cash management system which provides for cash sufficient tosatisfy financial obligations as they are submitted for payment and any excess cash in domestic bank accounts is applied against any outstandingdebt held under our credit facility described below. We maintain entities to do business in countries around the world and as a result hold cashin international bank accounts to fund the working capital requirements of those operations. At December 30, 2016 and December 25, 2015,cash totaling $108.7 million and $152.0 million, respectively, was held in foreign bank accounts.
I n addition, as is common within our industry, we partner with other engineering and construction firms on specific projects toleverage the skills of the respective partners and decrease our risk of loss. Often projects of this nature require significant cash contributionsand the joint ventures created may retain cash earned while the project is being completed. Cash and cash equivalents on our consolidatedbalance sheets include cash held within these consolidated joint venture entities which is used for operating activities of those joint ventures. Asof December 30, 2016 and December 25, 2015, cash and cash equivalents held in our consolidated joint ventures and reflected on theconsolidated balance sheets totaled $46.6 million and $95.4 million, respectively.
50
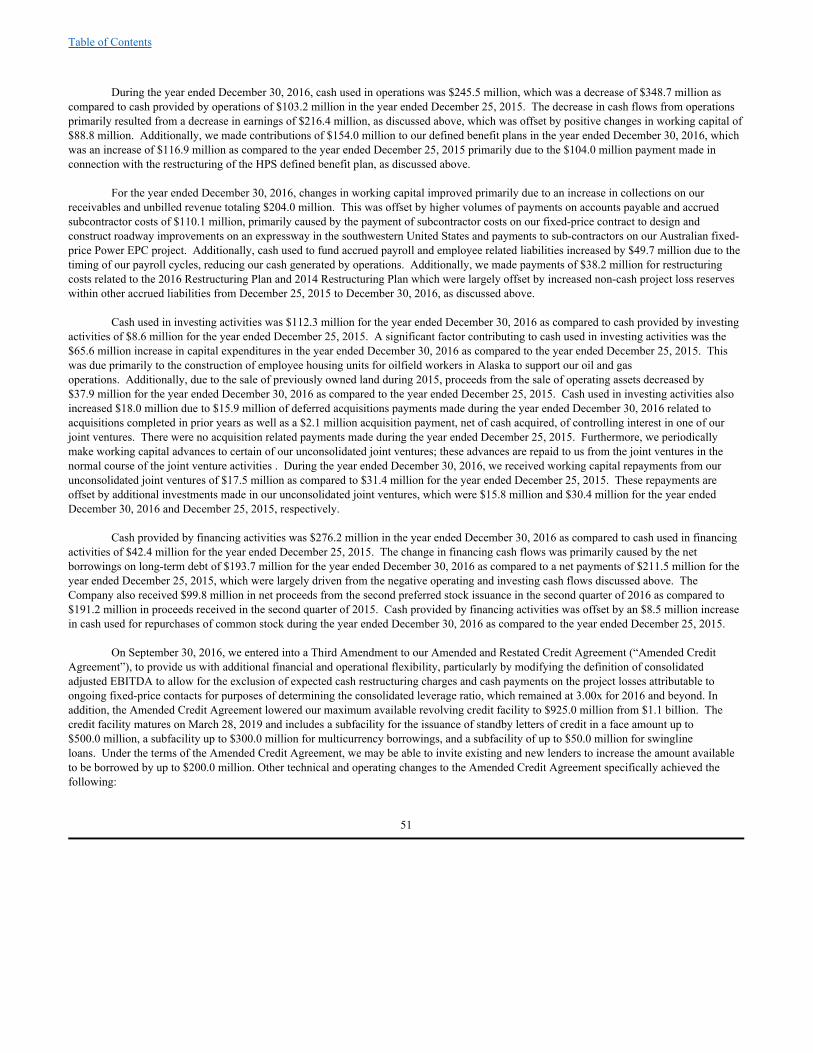
Table of Contents
During the year ended December 30, 2016, cash used in operations was $245.5 million, which was a decrease of $348.7 million ascompared to cash provided by operations of $103.2 million in the year ended December 25, 2015. The decrease in cash flows from operationsprimarily resulted from a decrease in earnings of $216.4 million, as discussed above, which was offset by positive changes in working capital of$88.8 million. Additionally, we made contributions of $154.0 million to our defined benefit plans in the year ended December 30, 2016, whichwas an increase of $116.9 million as compared to the year ended December 25, 2015 primarily due to the $104.0 million payment made inconnection with the restructuring of the HPS defined benefit plan, as discussed above.
For the year ended December 30, 2016, changes in working capital improved primarily due to an increase in collections on ourreceivables and unbilled revenue totaling $204.0 million. This was offset by higher volumes of payments on accounts payable and accruedsubcontractor costs of $110.1 million, primarily caused by the payment of subcontractor costs on our fixed-price contract to design andconstruct roadway improvements on an expressway in the southwestern United States and payments to sub-contractors on our Australian fixed-price Power EPC project. Additionally, cash used to fund accrued payroll and employee related liabilities increased by $49.7 million due to thetiming of our payroll cycles, reducing our cash generated by operations. Additionally, we made payments of $38.2 million for restructuringcosts related to the 2016 Restructuring Plan and 2014 Restructuring Plan which were largely offset by increased non-cash project loss reserveswithin other accrued liabilities from December 25, 2015 to December 30, 2016, as discussed above.
Cash used in investing activities was $112.3 million for the year ended December 30, 2016 as compared to cash provided by investingactivities of $8.6 million for the year ended December 25, 2015. A significant factor contributing to cash used in investing activities was the$65.6 million increase in capital expenditures in the year ended December 30, 2016 as compared to the year ended December 25, 2015. Thiswas due primarily to the construction of employee housing units for oilfield workers in Alaska to support our oil and gasoperations. Additionally, due to the sale of previously owned land during 2015, proceeds from the sale of operating assets decreased by$37.9 million for the year ended December 30, 2016 as compared to the year ended December 25, 2015. Cash used in investing activities alsoincreased $18.0 million due to $15.9 million of deferred acquisitions payments made during the year ended December 30, 2016 related toacquisitions completed in prior years as well as a $2.1 million acquisition payment, net of cash acquired, of controlling interest in one of ourjoint ventures. There were no acquisition related payments made during the year ended December 25, 2015. Furthermore, we periodicallymake working capital advances to certain of our unconsolidated joint ventures; these advances are repaid to us from the joint ventures in thenormal course of the joint venture activities . During the year ended December 30, 2016, we received working capital repayments from ourunconsolidated joint ventures of $17.5 million as compared to $31.4 million for the year ended December 25, 2015. These repayments areoffset by additional investments made in our unconsolidated joint ventures, which were $15.8 million and $30.4 million for the year endedDecember 30, 2016 and December 25, 2015, respectively.
Cash provided by financing activities was $276.2 million in the year ended December 30, 2016 as compared to cash used in financingactivities of $42.4 million for the year ended December 25, 2015. The change in financing cash flows was primarily caused by the netborrowings on long-term debt of $193.7 million for the year ended December 30, 2016 as compared to a net payments of $211.5 million for theyear ended December 25, 2015, which were largely driven from the negative operating and investing cash flows discussed above. TheCompany also received $99.8 million in net proceeds from the second preferred stock issuance in the second quarter of 2016 as compared to$191.2 million in proceeds received in the second quarter of 2015. Cash provided by financing activities was offset by an $8.5 million increasein cash used for repurchases of common stock during the year ended December 30, 2016 as compared to the year ended December 25, 2015.
On September 30, 2016, we entered into a Third Amendment to our Amended and Restated Credit Agreement (“Amended CreditAgreement”), to provide us with additional financial and operational flexibility, particularly by modifying the definition of consolidatedadjusted EBITDA to allow for the exclusion of expected cash restructuring charges and cash payments on the project losses attributable toongoing fixed-price contacts for purposes of determining the consolidated leverage ratio, which remained at 3.00x for 2016 and beyond. Inaddition, the Amended Credit Agreement lowered our maximum available revolving credit facility to $925.0 million from $1.1 billion. Thecredit facility matures on March 28, 2019 and includes a subfacility for the issuance of standby letters of credit in a face amount up to$500.0 million, a subfacility up to $300.0 million for multicurrency borrowings, and a subfacility of up to $50.0 million for swinglineloans. Under the terms of the Amended Credit Agreement, we may be able to invite existing and new lenders to increase the amount availableto be borrowed by up to $200.0 million. Other technical and operating changes to the Amended Credit Agreement specifically achieved thefollowing:
51

Table of Contents
· Increased the margins used to determine the interest rates of revolving loans under the Amended Credit Agreement and thecommitment fees payable by CH2M;
· Limited the amount CH2M may spend to repurchase its common stock in connection with its employee stock ownership programup to $75.0 million during the three quarter period ending March 31, 2017 and, thereafter, up to $100.0 million during a rollingfour quarter period less the amount of any legally required repurchases of common stock held in benefit plans;
· Limited CH2M’s ability to pay cash dividends on preferred stock until no more than 10% of our consolidated adjusted EBITDAconsists of the cash and non-cash charges related to restructuring charges and project costs and losses in any rolling four quarterperiod and subject to minimum pro forma leverage ratio;
· Disallows the use of proceeds from asset sales to repurchase common or preferred stock; and,· Granted security interests to the lenders in substantially all of the assets of CH2M and CH2M’s subsidiaries, subject to certain
carve-outs.
At December 30, 2016, we had $487.0 million in outstanding borrowings on the credit facility, compared to $292.8 million atDecember 25, 2015. The average rate of interest charged on that balance was 3.73% as of December 30, 2016. At December 30, 2016,company-wide issued and outstanding letters of credit, and bank guarantee facilities of $134.2 million were outstanding, compared to$145.5 million at December 25, 2015. Our borrowing capacity under the credit facility is limited by a maximum consolidated leverage ratio,which is based on a multiple of an adjusted earnings before interest, taxes, depreciation and amortization calculation, and other outstandingobligations of the Company. As of December 30, 2016, the remaining unused borrowing capacity under the credit facility was approximately$107.4 million.
On November 23, 2016, December 28, 2016 and January 10, 2017, we received from the lenders under the Amended CreditAgreement consents permitting our delayed compliance with respect to the certifications to the lenders relating to our unaudited consolidatedfinancial statements as of and for the quarters ended June 26, 2015, September 25, 2015 and December 25, 2015 and confirming that adetermination that a material weakness exists in our internal controls over financial accounting would not constitute a default under the terms ofthe Amended Credit Agreement. The consents ensured that no event of default existed under the Amended Credit Agreement as a result of therestatement, and we could request the issuance of new loan advances and letters of credit under the Amended Credit Agreement in accordancewith its terms.
As of December 30, 2016, we were in compliance with the covenants required by the Amended Credit Agreement. Management
continually assesses it potential future compliance with the Amended Credit Agreement covenants based upon estimates of future earnings andcash flows. If there is an expected possibility of non-compliance, we will discuss possibilities with the Company’s lenders or utilize othermeans of capitalizing the Company to remedy any non-compliance. The expected cash outflows required to fund the project losses discussed inNote 2 – Changes in Project-Related Estimates of the Notes to Consolidated Financial Statements in Item 15 of this Annual Report onForm 10‑K and the related impact on earnings will put a financial strain on the Company that may require an amendment or other remedies tobe pursued by management if certain earnings estimates or cash flow improvement initiatives are not achieved. We may from time to timerefinance amounts outstanding under our Amended Credit Agreement with other loans, debt securities or other debt. The timing of any suchrefinancing will depend on many factors, including market conditions and contractual restrictions. In the context of our current debt structureand projected cash needs, there can be no assurance that the capacity under our Amended Credit Agreement will be adequate to fund futureoperations, to restructure operations, or to allow the Company to repurchase stock in our internal market in any significant amount or at all.
Additionally, the Certificate of Designation for the Series A Preferred Stock prohibits the repurchase by the Company of shares of ourcommon stock in excess of negotiated pre-approved amounts in 2015 and 2016, and in excess of amounts determined by a negotiated formula in2017 and beyond. In 2017, t he Certificate of Designation for the Series A Preferred Stock prohibits the repurchase by the Company of sharesof our common stock in excess of negotiated pre-approved amounts determined by a formula based upon our “Free Cash Flow” or our cash flowfrom operations, minus capital expenditures, for fiscal year 2016. Our Free Cash Flow was negative for the year ended December 30, 2016, andas a result, other than specified exemptions, the Company is prohibited from repurchasing shares of common stock in the internal market,except as legally required, unless it is able to obtain the consent of the holders of at least a majority of the Series A Preferred Stock. OnJanuary 17, 2017, the Company received from the Series A Preferred Stock holder, an acknowledgment and consent permitting the Company tospend up to $25.0 million, in the aggregate, to repurchase shares of common stock in the first trade of 2017. No assurance can be given that inthe future the Company will be able to obtain an acknowledgment and consent from the Series A Preferred Stockholder permitting the Companyto repurchase common stock in the internal market.
52

Table of Contents
Based on fourth quarter results of operations and our current business outlook, we believe that our sources of liquidity, including bankfacility credit capacity and issuances of debt, equity or other securities, will satisfy our working capital needs, capital expenditures, investmentrequirements, contractual obligations, commitments, principal and interest payments on our debt and other liquidity requirements for the next 12months. However, we cannot be certain that we will generate improved cash flows or that we will be able to obtain additional financing orinvestment on satisfactory terms. In addition, our liquidity is constrained due to 2016 results of operations and in the event our liquidity isinsufficient, we may be required to curtail spending and implement additional cost saving measures and restructuring actions or enter into newfinancing arrangements .
Off‑‑Balance Sheet Arrangements
We have interests in multiple joint ventures, some of which are unconsolidated variable interest entities, to facilitate the completion ofcontracts that are jointly performed with our joint venture partners. These joint ventures are formed to leverage the skills of the respectivepartners and include consulting, construction, design, project management and operations and maintenance contracts. Our risk of loss on jointventures is similar to what the risk of loss would be if the project was self‑performed, other than the fact that the risk is shared with ourpartners. See further discussion in Note 4— Variable Interest Entities and Equity Method Investments of the Notes to the ConsolidatedFinancial Statements in Item 15, of this Annual Report on Form 10‑K.
There were no substantial changes to other off‑balance sheet arrangements or contractual commitments during the year endedDecember 30, 2016.
Aggregate Commercial Commitments
We maintain a variety of commercial commitments that are generally made available to provide support for various provisions inengineering and construction contracts. Letters of credit are provided to clients in the ordinary course of the contracting business in lieu ofretention or for performance and completion guarantees on engineering and construction contracts. We post bid bonds and performance andpayment bonds, which are contractual agreements issued by a surety, for the purpose of guaranteeing our performance on contracts and toprotect owners and are subject to full or partial forfeiture for failure to perform obligations arising from a successful bid. We also carrysubstantial premium paid, traditional insurance for our business risks including professional liability and general casualty insurance and othercoverage which is customary in our industry .
We believe that we will be able to continue to have access to professional liability and general casualty insurance, as well as bonds,with sufficient coverage limits, and on acceptable financial terms necessary to support our business. The cost of such coverage has remainedstable during 2016, but there are no guarantees that the cost of such coverage will remain stable in future periods.
Our risk management personnel continuously monitor the developments in the insurance market. The financial stability of theinsurance and surety providers is one of the major factors that we take into account when buying our insurance coverage. Currently ourinsurance and bonds are purchased from several of the world’s leading and financially stable providers often in layered insurance or co‑suretyarrangements. The built‑in redundancy of such arrangements usually enables us to call upon existing insurance and surety suppliers to fill gapsthat may arise if other such suppliers become financially unstable.
Contractual obligations outstanding as of December 30, 2016 are summarized below:
Amount of Commitment Expiration Per Period Less than Total Amount($ in millions) 1 Year 1 ‑‑3 Years 4 ‑‑5 Years Over 5 Years CommittedLetters of credit $ 47.8 $ 44.1 $ 6.2 $ 27.7 $ 125.8Bank guarantees 7.7 0.6 0.1 — 8.4Long-term debt 2.2 493.5 2.2 — 497.9Interest payments 18.5 36.7 18.2 — 73.4Operating lease obligations 82.2 135.0 92.5 230.8 540.5Surety and bid bonds 765.2 35.4 0.1 — 800.7
Total $ 923.6 $ 745.3 $ 119.3 $ 258.5 $ 2,046.7The interest payments on the revolving credit facility are based on the borrowings outstanding as of December 30, 2016 at the expected interest rate over the period
outstanding.
53
1
1
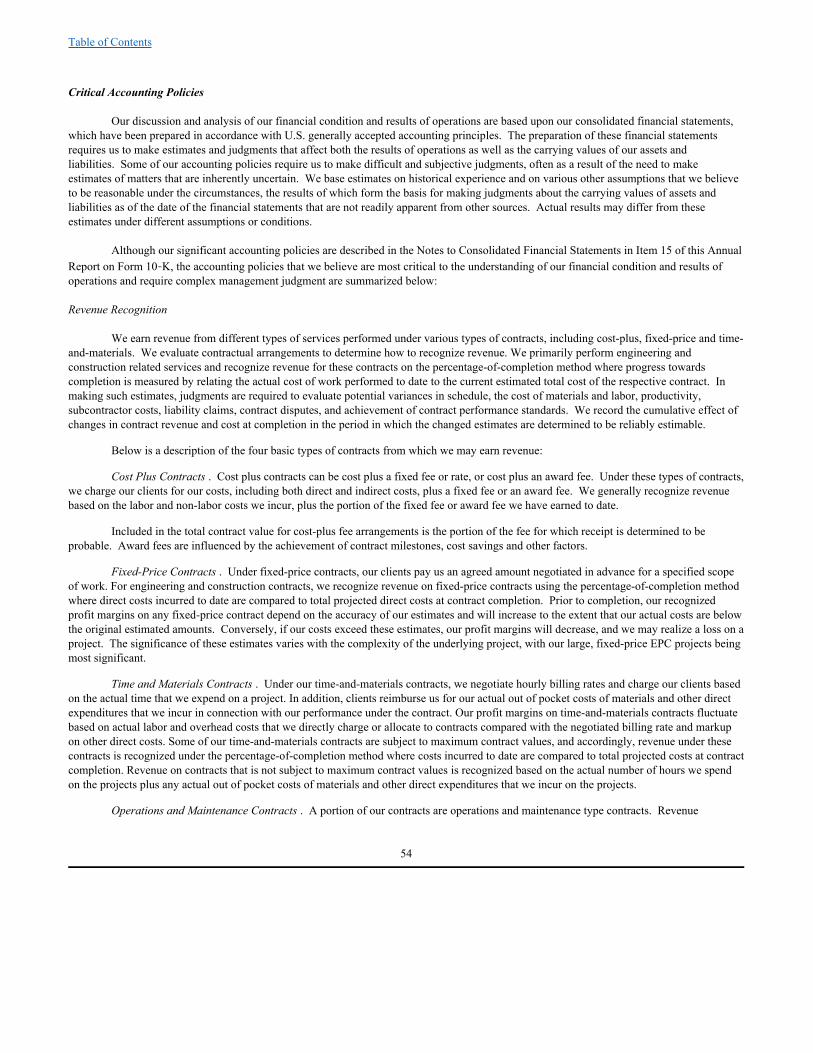
Table of Contents
Critical Accounting Policies
Our discussion and analysis of our financial condition and results of operations are based upon our consolidated financial statements,which have been prepared in accordance with U.S. generally accepted accounting principles. The preparation of these financial statementsrequires us to make estimates and judgments that affect both the results of operations as well as the carrying values of our assets andliabilities. Some of our accounting policies require us to make difficult and subjective judgments, often as a result of the need to makeestimates of matters that are inherently uncertain. We base estimates on historical experience and on various other assumptions that we believeto be reasonable under the circumstances, the results of which form the basis for making judgments about the carrying values of assets andliabilities as of the date of the financial statements that are not readily apparent from other sources. Actual results may differ from theseestimates under different assumptions or conditions.
Although our significant accounting policies are described in the Notes to Consolidated Financial Statements in Item 15 of this AnnualReport on Form 10‑K, the accounting policies that we believe are most critical to the understanding of our financial condition and results ofoperations and require complex management judgment are summarized below:
Revenue Recognition
We earn revenue from different types of services performed under various types of contracts, including cost-plus, fixed-price and time-and-materials. We evaluate contractual arrangements to determine how to recognize revenue. We primarily perform engineering andconstruction related services and recognize revenue for these contracts on the percentage-of-completion method where progress towardscompletion is measured by relating the actual cost of work performed to date to the current estimated total cost of the respective contract. Inmaking such estimates, judgments are required to evaluate potential variances in schedule, the cost of materials and labor, productivity,subcontractor costs, liability claims, contract disputes, and achievement of contract performance standards. We record the cumulative effect ofchanges in contract revenue and cost at completion in the period in which the changed estimates are determined to be reliably estimable.
Below is a description of the four basic types of contracts from which we may earn revenue:
Cost Plus Contracts . Cost plus contracts can be cost plus a fixed fee or rate, or cost plus an award fee. Under these types of contracts,we charge our clients for our costs, including both direct and indirect costs, plus a fixed fee or an award fee. We generally recognize revenuebased on the labor and non-labor costs we incur, plus the portion of the fixed fee or award fee we have earned to date.
Included in the total contract value for cost-plus fee arrangements is the portion of the fee for which receipt is determined to beprobable. Award fees are influenced by the achievement of contract milestones, cost savings and other factors.
Fixed-Price Contracts . Under fixed-price contracts, our clients pay us an agreed amount negotiated in advance for a specified scopeof work. For engineering and construction contracts, we recognize revenue on fixed-price contracts using the percentage-of-completion methodwhere direct costs incurred to date are compared to total projected direct costs at contract completion. Prior to completion, our recognizedprofit margins on any fixed-price contract depend on the accuracy of our estimates and will increase to the extent that our actual costs are belowthe original estimated amounts. Conversely, if our costs exceed these estimates, our profit margins will decrease, and we may realize a loss on aproject. The significance of these estimates varies with the complexity of the underlying project, with our large, fixed-price EPC projects beingmost significant.
Time and Materials Contracts . Under our time-and-materials contracts, we negotiate hourly billing rates and charge our clients basedon the actual time that we expend on a project. In addition, clients reimburse us for our actual out of pocket costs of materials and other directexpenditures that we incur in connection with our performance under the contract. Our profit margins on time-and-materials contracts fluctuatebased on actual labor and overhead costs that we directly charge or allocate to contracts compared with the negotiated billing rate and markupon other direct costs. Some of our time-and-materials contracts are subject to maximum contract values, and accordingly, revenue under thesecontracts is recognized under the percentage-of-completion method where costs incurred to date are compared to total projected costs at contractcompletion. Revenue on contracts that is not subject to maximum contract values is recognized based on the actual number of hours we spendon the projects plus any actual out of pocket costs of materials and other direct expenditures that we incur on the projects.
Operations and Maintenance Contracts . A portion of our contracts are operations and maintenance type contracts. Revenue
54

Table of Contents
is recognized on operations and maintenance contracts on a straight-line basis over the life of the contract once we have an arrangement, servicehas begun, the price is fixed or determinable and collectability is reasonably assured.
For all contract types noted above, change orders are included in total estimated contract revenue when it is probable that the changeorder will result in an addition to contract value and when the change order can be estimated. Management evaluates when a change order isprobable based upon its experience in negotiating change orders, the customer’s written approval of such changes or separate documentation ofchange order costs that are identifiable. Additional contract revenue related to claims is included in total estimated contract revenue when theamount can be reliably estimated, which is typically evidenced by a contract or other evidence providing a legal basis for the claim.
Losses on construction and engineering contracts in process are recognized in their entirety when the loss becomes evident and theamount of loss can be reasonably estimated.
Income Taxes
In determining net income for financial statement purposes, we must make estimates and judgments in the calculation of tax assets andliabilities and in the determination of the recoverability of the deferred tax assets. We account for income taxes utilizing an asset and liabilityapproach that requires the recognition of deferred tax assets and liabilities for the expected future tax effects of events that have been recognizedin the financial statements or tax returns. In estimating future tax consequences, we generally consider all expected future events other thanenactment of changes in the tax laws or rates. Deferred tax assets and liabilities are determined based on the difference between the tax basis ofassets and liabilities and their reported amounts using enacted tax rates in effect for the year in which differences are expected to reverse. Wemust assess the likelihood that we will be able to recover our deferred tax assets. A valuation allowance is provided for deferred tax assets if itis more likely than not that these items will not be realized. Annually, we determine the amount of undistributed foreign earnings investedindefinitely in our foreign operations. Deferred taxes are not provided on those earnings.
In addition, the calculation of our income tax provision and tax assets and liabilities involves uncertainties in the application ofcomplex tax regulations. For income tax benefits to be recognized, a tax position must be more likely than not to be sustained uponexamination by taxing authorities. We record reserves for uncertain tax positions that do not meet these criteria
Goodwill
Goodwill represents the excess of costs over fair value of the assets of businesses we have acquired. Goodwill acquired in a purchasebusiness combination is not amortized, but instead, is tested for impairment at least annually in accordance with the provisions of the FinancialAccounting Standards Board (“FASB”) Accounting Standards Codification (“ASC”) Topic 350, Intangibles-Goodwill and Other (“ASC 350”),as amended. Our annual goodwill impairment test is conducted as of the first day of the fourth quarter of each year, however, upon theoccurrence of certain triggering events, we are also required to test for impairment at dates other than the annual impairment testing date. Inperforming the impairment test, we evaluate our goodwill at the reporting unit level. Under the guidance of ASC 350, we have the option toassess either quantitative or qualitative factors to determine whether it is more likely than not that the fair values of our reporting units are lessthan their carrying amounts. If after assessing the totality of events or circumstances, we determine that it is not more likely than not that thefair values of our reporting units are less than their carrying amounts, then the next step of the impairment test is unnecessary. If we concludeotherwise, then we are required to test goodwill for impairment under the two-step process. The two-step process involves comparing theestimated fair value of each reporting unit to the unit’s carrying value, including goodwill. If the carrying value of a reporting unit does notexceed its fair value, the goodwill of the reporting unit is not considered impaired; therefore, the second step of the impairment test isunnecessary. If the carrying amount of a reporting unit exceeds its estimated fair value, we would then perform a second step to measure theamount of goodwill impairment loss to be recorded.
We determine the fair value of our reporting units using a combination of the income approach, the market approach, and the costapproach. The income approach calculates the present value of future cash flows based on assumptions and estimates derived from a review ofour expected revenue growth rates, profit margins, business plans, cost of capital and tax rates for the reporting units. Our market basedvaluation method estimates the fair value of our reporting units by the application of a multiple to our estimate of a cash flow metric for eachbusiness unit. The cost approach estimates the fair value of a reporting unit as the net replacement cost using current market quotes.
55
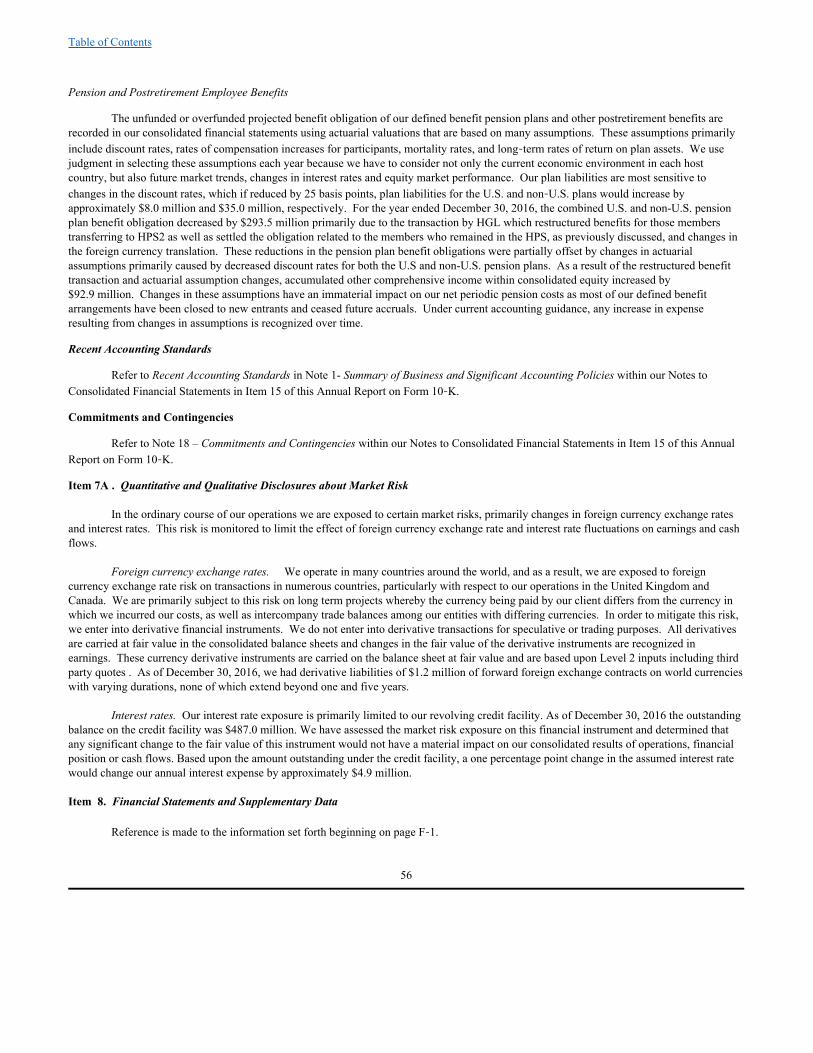
Table of Contents
Pension and Postretirement Employee Benefits
The unfunded or overfunded projected benefit obligation of our defined benefit pension plans and other postretirement benefits arerecorded in our consolidated financial statements using actuarial valuations that are based on many assumptions. These assumptions primarilyinclude discount rates, rates of compensation increases for participants, mortality rates, and long‑term rates of return on plan assets. We usejudgment in selecting these assumptions each year because we have to consider not only the current economic environment in each hostcountry, but also future market trends, changes in interest rates and equity market performance. Our plan liabilities are most sensitive tochanges in the discount rates, which if reduced by 25 basis points, plan liabilities for the U.S. and non‑U.S. plans would increase byapproximately $8.0 million and $35.0 million, respectively. For the year ended December 30, 2016, the combined U.S. and non-U.S. pensionplan benefit obligation decreased by $293.5 million primarily due to the transaction by HGL which restructured benefits for those memberstransferring to HPS2 as well as settled the obligation related to the members who remained in the HPS, as previously discussed, and changes inthe foreign currency translation. These reductions in the pension plan benefit obligations were partially offset by changes in actuarialassumptions primarily caused by decreased discount rates for both the U.S and non-U.S. pension plans. As a result of the restructured benefittransaction and actuarial assumption changes, accumulated other comprehensive income within consolidated equity increased by$92.9 million. Changes in these assumptions have an immaterial impact on our net periodic pension costs as most of our defined benefitarrangements have been closed to new entrants and ceased future accruals. Under current accounting guidance, any increase in expenseresulting from changes in assumptions is recognized over time.
Recent Accounting Standards
Refer to Recent Accounting Standards in Note 1- Summary of Business and Significant Accounting Policies within our Notes toConsolidated Financial Statements in Item 15 of this Annual Report on Form 10‑K.
Commitments and Contingencies
Refer to Note 18 – Commitments and Contingencies within our Notes to Consolidated Financial Statements in Item 15 of this AnnualReport on Form 10‑K.
Item 7A . Quantitative and Qualitative Disclosures about Market Risk
In the ordinary course of our operations we are exposed to certain market risks, primarily changes in foreign currency exchange ratesand interest rates. This risk is monitored to limit the effect of foreign currency exchange rate and interest rate fluctuations on earnings and cashflows.
Foreign currency exchange rates. We operate in many countries around the world, and as a result, we are exposed to foreigncurrency exchange rate risk on transactions in numerous countries, particularly with respect to our operations in the United Kingdom andCanada. We are primarily subject to this risk on long term projects whereby the currency being paid by our client differs from the currency inwhich we incurred our costs, as well as intercompany trade balances among our entities with differing currencies. In order to mitigate this risk,we enter into derivative financial instruments. We do not enter into derivative transactions for speculative or trading purposes. All derivativesare carried at fair value in the consolidated balance sheets and changes in the fair value of the derivative instruments are recognized inearnings. These currency derivative instruments are carried on the balance sheet at fair value and are based upon Level 2 inputs including thirdparty quotes . As of December 30, 2016, we had derivative liabilities of $1.2 million of forward foreign exchange contracts on world currencieswith varying durations, none of which extend beyond one and five years.
Interest rates. Our interest rate exposure is primarily limited to our revolving credit facility. As of December 30, 2016 the outstandingbalance on the credit facility was $487.0 million. We have assessed the market risk exposure on this financial instrument and determined thatany significant change to the fair value of this instrument would not have a material impact on our consolidated results of operations, financialposition or cash flows. Based upon the amount outstanding under the credit facility, a one percentage point change in the assumed interest ratewould change our annual interest expense by approximately $4.9 million.
Item 8. Financial Statements and Supplementary Data
Reference is made to the information set forth beginning on page F‑1.
56
Table of Contents
Item 9. Changes in and Disagreements with Accountants on Accounting and Financial Disclosure
None.
Item 9 A. Controls and Procedures
(a) Disclosure Controls and Procedures
Our management carried out an evaluation as of the last day of the period covered by this Annual Report on Form 10-K, under thesupervision and with the participation of our Chief Executive Officer and Chief Financial Officer, of the effectiveness of the design andoperation of our disclosure controls and procedures as defined in Rules 13a‑15(e) of the Securities Exchange Act of 1934, as amended(“Exchange Act”).
In conducting our evaluation, we concluded that there is a material weakness in the design of our internal control over financialreporting, as described below.
As a result of the material weakness in the design of our internal control over financial reporting, our Chief Executive Officer andChief Financial Officer have concluded that our disclosure controls and procedures were not effective as of December 30, 2016 to ensure thatinformation required to be disclosed by us in reports filed or submitted under the Exchange Act is (a) timely recorded, processed, summarizedand reported, and (b) accumulated and communicated to our management, including our Chief Executive Officer and Chief Financial Officer, asappropriate to allow timely decisions regarding required disclosure.
In light of the material weakness described below, we performed additional analysis and other post-closing procedures to ensure ourconsolidated financial statements were prepared in accordance with generally accepted accounting principles and reflect our financial positionand results of operations as of and for the year ended December 30, 2016. As a result, notwithstanding the material weakness described below,management concluded that the consolidated financial statements included in this Form 10-K present fairly, in all material respects, ourfinancial position, results of operations and cash flows as of and for the periods presented.
(b) Management’s Annual Report on Internal Control over Financial Reporting
Our management is responsible for establishing and maintaining adequate internal control over financial reporting, as such term isdefined in Exchange Act Rules 13a‑15(f). All internal control systems, no matter how well designed, have inherent limitations. Therefore,even those systems determined to be effective can provide only reasonable assurance with respect to financial statement preparation andpresentation for external purposes in accordance with generally accepted accounting principles. Under the supervision and with theparticipation of our management, including our Chief Executive Officer and Chief Financial Officer, we conducted an evaluation of theeffectiveness of our internal control over financial reporting based on the framework in Internal Control—Integrated Framework issued by theCommittee of Sponsoring Organizations of the Treadway Commission (COSO 2013 Framework).
Based on this assessment, management concluded that our internal control over financial reporting was not effective as ofDecember 30, 2016, because deficiencies have been identified that rise to the level of a material weakness as described below.
A material weakness is a deficiency, or a combination of deficiencies, in internal control over financial reporting, such that there is areasonable possibility that a material misstatement of our annual or interim financial statements will not be prevented or detected on a timelybasis.
Material weakness related to project reporting over the completeness and accuracy of estimates of revenues, costs and profit or lossat completion for long-term projects accounted for under the percentage-of-completion method
We determined that a material weakness in our internal control over financial reporting existed related to the ineffective design ofcertain controls associated with developing project cost estimates included in our estimates of revenues, costs and profit or loss at completionfor long-term contracts accounted for under the percentage-of-completion method. Specifically, three deficiencies in internal control overfinancial reporting were identified related to these project cost estimates. The first and second deficiency relate to Principle 10, “ Theorganization selects and develops control activities to mitigate the risk of achieving objectives ” of the control activities component of theCOSO 2013 Framework. The first deficiency involves process level control activities related to the project level operational processes used todevelop project cost estimates for large fixed-firm price engineering, procurement and
57
Table of Contents
construction projects. The Company did not identify these basis of estimate process level control activities as key internal controls, and, assuch, they were not designed to operate at the required level of rigor, precision and consistency, and include the retention of adequatedocumentation. The second deficiency involves a control that was intended to ensure project cost estimates not updated on a monthly basis areevaluated for potential accounting implications. It has been determined that such control was not designed effectively as it did not sufficientlyidentify items requiring follow-up and how such items were to be resolved. The third deficiency relates to Principle 14, “ The organizationinternally communicates information, including objectives and responsibilities for internal control, necessary to support the functioning ofinternal control” of the information and communication component of the COSO 2013 Framework. This deficiency involves a certificationcontrol that has been determined to have not been designed effectively. Specifically, the certification control did not adequately identify itemsrequiring follow-up and how such items were to be resolved, including the preparation and review of appropriate documentation of theresolution.
The material weakness resulted in the restatement of our unaudited consolidated financial statements as of and for the quarters endedJune 26, 2015, September 25, 2015, and December 25, 2015, and has not been remediated as of December 30, 2016.
This Annual Report on Form 10-K does not include an attestation report of our independent registered public accounting firmregarding internal control over financial reporting. As we are a non-accelerated filer, management's report is not subject to attestation by ourregistered public accounting firm pursuant to Section 404(c) of the Sarbanes-Oxley Act of 2002 that permits us to provide only management'sreport in this annual report.
(c) Remediation Plans to Address Material Weakness
Deficient control related to the inadequate design of process level controls dealing with the basis of estimate
We are implementing process level controls to ensure that the basis of estimate for major components of project cost as developed bythe project team are documented and reviewed. These controls will focus on the most significant items that impact project cost, e.g., schedule,labor, subcontractor and materials, change management, and risk register/contingency. These controls will require adequate documentationsupporting the estimation process, including significant judgments and the rationale for subsequent changes.
Deficient control related to the evaluation of project cost estimates not updated on a monthly basis
We will evaluate and change the control to provide specificity on the identification of items for follow-up and how such items are to beresolved, including the preparation and review of appropriate documentation of the resolution. The revised control will be designed to ensurethat project cost estimates are updated and evaluated on a quarterly basis.
Deficient control related to the certification process
We will evaluate and change the certification process to clarify the internal control responsibilities of the employee positions and jobtitles involved in the estimation of costs and consideration of accounting and reporting requirements. These internal control responsibilities willprovide specificity on the identification of items for follow-up and how such items are to be resolved, including the preparation and review ofappropriate documentation of the resolution. We will also provide training to the employees involved in the estimation of project costs andrelated accounting requirements, and implement periodic communications on the internal control responsibilities of employees involved in theprocess. In addition, we will implement controls to enhance business segment and corporate level oversight of the cost estimation process.
(d) Changes in Internal Control over Financial Reporting
There have been no changes in our internal control over financial reporting during the quarter ended December 30, 2016 that havematerially affected, or are reasonably likely to materially affect, our internal control over financial reporting .
Item 9 B. Other Information
None.
58

Table of Contents
PART II I
Item 10 . Directors, Executive Officers and Corporate Governance
Certain information required by this item is incorporated by reference from CH2M’s definitive proxy statement for its 2017 AnnualMeeting of Stockholders. Information regarding the executive officers of CH2M is presented under the caption “Executive Officers of CH2M”in Part I of this Annual Report on Form 10-K.
Item 1 1. Executive Compensation
Information required by this item is incorporated by reference from CH2M’s definitive proxy statement for its 2017 Annual Meetingof Stockholders.
Item 1 2. Security Ownership of Certain Beneficial Owners and Management and Related Stockholder Matters
Information required by this item is incorporated by reference from CH2M’s definitive proxy statement for its 2017 Annual Meetingof Stockholders.
Item 1 3. Certain Relationships and Related Transactions, and Director Independence
Information required by this item is incorporated by reference from CH2M’s definitive proxy statement for its 2017 Annual Meetingof Stockholders.
Item 1 4. Principal Accounting Fees and Services
Information required by this item is incorporated by reference from CH2M’s definitive proxy statement for its 2017 Annual Meetingof Stockholders.
59
Table of Contents
PART I V
Item 15 . Exhibits and Financial Statement Schedules
Documents Filed as Part of this Report
1. Financial Statements
Report of Independent Registered Public Accounting Firm 64 Consolidated Balance Sheets at December 30, 2016 and December 25, 2015 65 Consolidated Statements of Operations for the Years Ended December 30, 2016, December 25, 2015, andDecember 31, 2014 66 Consolidated Statements of Comprehensive Income (Loss) for the Years Ended December 30, 2016,December 25, 2015, and December 31, 2014 67 Consolidated Statements of Stockholders’ Equity for the Years Ended December 30, 2016, December 25, 2015,and December 31, 2014 68 Consolidated Statements of Cash Flows for the Years Ended December 30, 2016, December 25, 2015, andDecember 31, 2014 69 Notes to Consolidated Financial Statements 70
2. Financial Statement Schedules and Other
All financial statement schedules have been omitted because the required information is included in the consolidated financialstatements or notes thereto, or because such schedules are not applicable.
3. Exhibits
The Exhibits required by this item are listed in the Exhibit Index. Each management contract and compensatory plan or arrangement isdenoted with a “+” in the Exhibit Index.
Exhibit Number Description
3.1 Restated Certificate of Incorporation of CH2M HILL Companies, Ltd., as filed with the Delaware Secretary of State onFebruary 19, 2015 (filed as Exhibit A to CH2M’s Proxy Statement on January 16, 2015, (Commission File No. 000‑27261), andincorporated herein by reference)
3.2 Certificate of Designation of Series A Preferred Stock of CH2M HILL Companies, Ltd., as filed with the Delaware Secretary ofState on June 22, 2015 (filed as Exhibit 3.1 to CH2M’s Form 8‑K on June 24, 2015 (Commission File No. 000‑27261), andincorporated herein by reference)
3.3 Amended and Restated Bylaws of CH2M HILL Companies, Ltd., as amended through and including June 24, 2015 (filed asExhibit 3.2 to CH2M’s Form 8‑K on June 24, 2015 (Commission File No. 000‑27261), and incorporated herein by reference)
+10.1 CH2M HILL Companies, Ltd. Amended and Restated Short Term Incentive Plan effective January 1, 2012 (filed asExhibit 10.2 to CH2M’s Form 10‑Q for the quarter ended June 30, 2012 (Commission File No. 000‑27261), and incorporatedherein by reference)
+10.2 CH2M HILL Companies, Ltd. Amended and Restated Short Term Incentive Plan effective February 11, 2016 (filed as Exhibit10.1 to CH2M’s Form 10-Q for the quarter ended June 24, 2016 (Commission File No. 000 27261), and incorporated herein byreference)
+10.3 CH2M HILL Companies, Ltd. Amended and Restated Long Term Incentive Plan effective January 1, 2011 (filed asExhibit 10.3 to CH2M’s Form 10‑K for the year ended December 31, 2011 (Commission File No. 000‑27261), andincorporated herein by reference)
60
Table of Contents
+10.4 CH2M HILL Companies, Ltd. Amended and Restated Long Term Incentive Plan effective February 11, 2016 (filed as Exhibit10.2 to CH2M’s Form 10-Q for the quarter ended June 24, 2016 (Commission File No. 000 27261), and incorporated herein byreference)
+10.5 CH2M HILL Companies, Ltd. Amended and Restated 2009 Stock Option Plan, effective May 7, 2012 (filed as Exhibit 10.1 toCH2M’s Form 8‑K on May 11, 2012 (Commission File No. 000‑27261), and incorporated herein by reference)
+10.6 CH2M HILL Companies, Ltd. Amended and Restated Restricted Stock Plan effective September 13, 2013 (filed asExhibit 10.4 to CH2M’s Form 10‑K for the year end December 31, 2013 (Commission File No. 000‑27261), and incorporatedherein by reference)
+10.7 CH2M HILL Companies, Ltd. Amended and Restated Deferred Compensation Plan effective November 13, 2014 (filed asExhibit 10.5 to CH2M’s Form 10-K on February 25, 2015 (Commission File No. 000-27261), and incorporated herein byreference)
+10.8 CH2M HILL Companies, Ltd. Supplemental Executive Retirement and Retention Plan effective September 19, 2014 (filed asExhibit 10.6 to CH2M’s Form 10-K on February 25, 2015 (Commission File No. 002‑27261), and incorporated herein byreference)
+10.9 Form of Change of Control Severance Agreement between CH2M HILL Companies, Ltd. and employee directors andexecutive officers (filed as Exhibit 10.1 to CH2M’s Form 8‑K on November 4, 2015, (Commission File No. 002‑27261), andincorporated herein by reference)
+10.10 CH2M HILL Companies, Ltd. Death Benefit Only Plan effective September 13, 2012 (filed as Exhibit 10.1 to CH2M’sForm 10‑Q for the quarter ended September 30, 2012 (Commission File No. 000‑27261), and incorporated herein by reference)
+10.11 Form of Indemnification Agreement between CH2M HILL Companies, Ltd. and directors, effective as of October 1, 2015(filed as Exhibit 10.9 to CH2M’s Form 10-K filed for the year ended December 25, 2015 (Commission File 000-27261), andincorporated herein by reference)
+10.12 Form of Indemnification Agreement between CH2M HILL Companies, Ltd. and executive officers, effective as of October 1,2015 (filed as Exhibit 10.10 to CH2M’s Form 10-K filed for the year ended December 25, 2015 (Commission File 000-27261),and incorporated herein by reference)
10.13 Contract with Neidiger, Tucker, Bruner, Inc. dated as of July 1, 2006 (filed as Exhibit 10.12 to CH2M’s Form 10‑K for theyear ended December 31, 2010 (Commission File No. 000‑27261), and incorporated herein by reference
10.14 Addendum to Contract with Neidiger, Tucker, Bruner, Inc. dated as of February 11, 2011 (filed as Exhibit 10.1 to CH2M’sForm 10‑Q for the quarter ended March 31, 2011 (Commission File No. 000‑27261), and incorporated herein by reference)
10.15 Addendum to Contract with Neidiger, Tucker, Bruner, Inc. dated as of June 21, 2012 (filed as Exhibit 10.4 to CH2M’sForm 10‑Q for the quarter ended June 30, 2012 (Commission File No. 000‑27261), and incorporated herein by reference)
10.16 Addendum to Contract with Neidiger, Tucker, Bruner, Inc. dated as of June 6, 2014 (filed as Exhibit 10.1 to CH2M’sForm 10‑Q for the quarter ended June 30, 2014 (Commission File No. 000‑27261), and incorporated herein by reference)
10.17 Addendum to Contract with Neidiger, Tucker, Bruner, Inc. dated as of May 29, 2015 (filed as Exhibit 10.2 to CH2M’sForm 10‑Q for the quarter ended June 26, 2015 (Commission File No. 000‑27261), and incorporated herein by reference)
10.18 Addendum to Contract with Neidiger, Tucker, Bruner, Inc. dated as of May 25, 2016 (filed as Exhibit 10.3 to CH2M’sForm 10‑Q for the quarter ended June 24, 2016 (Commission File No. 000‑27261), and incorporated herein by reference)
61

Table of Contents
10.19 Second Amended and Restated Credit Agreement dated as of March 28, 2014, by and among CH2M HILL Companies, Ltd.and certain of its subsidiaries, Wells Fargo Bank, National Association, and other lenders as party thereto (filed as Exhibit 10.2to CH2M’s Form 10‑Q for the quarter ended March 30, 2014 (Commission File No. 000‑27261), and incorporated herein byreference)
10.20 First Amendment to Credit Agreement dated as of September 26, 2014, by and among CH2M HILL Companies, Ltd. andcertain of its subsidiaries, Wells Fargo Bank, National Association, and other lenders as party thereto (filed as Exhibit 10.2 toCH2M’s Form 10‑Q for the quarter ended September 30, 2014 (Commission File No. 000‑27261), and incorporated herein byreference)
10.21 Second Amendment to Credit Agreement dated as of March 30, 2015, by and among CH2M HILL Companies, Ltd. and certainof its subsidiaries, Wells Fargo Bank, National Association, and other lenders as party thereto (filed as Exhibit 10.1 to CH2M’sForm 10‑Q for the quarter ended March 27, 2015 (Commission File No. 000‑27261), and incorporated herein by reference)
10.22 Third Amendment to Credit Agreement dated as of September 30, 2016, to the Second Amended and Restated CreditAgreement dated as of March 28, 2014, by and among CH2M HILL Companies, Ltd. and certain of its subsidiaries, WellsFargo Bank, National Association, and other lenders as party thereto (filed as Exhibit 10.1 to CH2M’s Form 10‑Q for thequarter ended September 30, 2016 (Commission File No. 000‑27261), and incorporated herein by reference)
+10.23 Separation, Waiver and General Release Agreement entered into on May 29, 2015 by and between CH2M and J. Robert Berra(filed as Exhibit 10.1 to CH2M’s Form 10-Q for the quarter ended June 26, 2015 (Commission File No. 000-27261), andincorporated by reference)
+10.24 Retirement Transition Agreement between CH2M and John Madia dated October 6, 2015 (filed as Exhibit 10.1 to CH2M’sForm 10-Q for the quarter ended September 25, 2015 (Commission File No. 000-27261), and incorporated by reference
10.25 Subscription Agreement dated May 27, 2015 between CH2M HILL Companies, Ltd. and AP VIII CH2 Holdings, L.P. (filed asExhibit 99.1 to CH2M’s Form 8-K on May 28, 2015 (Commission File No. 000-27261), and incorporated by reference)
10.26 Investor Rights Agreement dated June 24, 2015, among CH2M HILL Companies, Ltd. and AP VIII CH2 Holdings, L.P. (filedas Exhibit 99.1 to CH2M’s Form 8-K on June 24, 2015 (Commission File No. 000-27261), and incorporated by reference)
*21.1 Subsidiaries of CH2M HILL Companies, Ltd.
*23.1 Consent of KPMG LLP, Independent Registered Public Accounting Firm
*24.1 Power of Attorney authorizing signature
*31.1 Written Statement of Chief Executive Officer pursuant to Section 302 of the Sarbanes‑Oxley Act of 2002
*31.2 Written Statement of Chief Financial Officer pursuant to Section 302 of the Sarbanes‑Oxley Act of 2002
*32.1 Written Statement of Chief Executive Officer pursuant to Section 906 of the Sarbanes‑Oxley Act of 2002 (18 U.S.C.Section 1350)
*32.2 Written Statement of Chief Financial Officer pursuant to Section 906 of the Sarbanes‑Oxley Act of 2002 (18 U.S.C.Section 1350)
99.1 Internal Market Rules effective November 14, 2014 (filed as Exhibit 99.1 to CH2M’s Form 10-K on February 25, 2015(Commission File No. 000-27261), and incorporated by reference)
*101.INS XBRL Instance Document
*101.SCH XBRL Taxonomy Extension Schema Document
62

Table of Contents
*101.CAL XBRL Taxonomy Extension Calculation Linkbase Document
*101.LAB XBRL Taxonomy Extension Labels Linkbase Document
*101.PRE XBRL Taxonomy Extension Presentation Linkbase Document
*101.DEF XBRL Taxonomy Extension Definition Linkbase Document
* Filed herewith
63

Table of Contents
Report of Independent Registered Public Accounting Fir m
The Board of Directors and StockholdersCH2M HILL Companies, Ltd.:
We have audited the accompanying consolidated balance sheets of CH2M HILL Companies, Ltd. and subsidiaries (the Company) as of December 30, 2016and December 25, 2015, and the related consolidated statements of operations, comprehensive income (loss), stockholders’ equity, and cash flows for eachof the years in the three year period ended December 30, 2016. These consolidated financial statements are the responsibility of the Company’smanagement. Our responsibility is to express an opinion on these consolidated financial statements based on our audits.
We conducted our audits in accordance with the standards of the Public Company Accounting Oversight Board (United States). Those standards require thatwe plan and perform the audit to obtain reasonable assurance about whether the financial statements are free of material misstatement. An audit includesexamining, on a test basis, evidence supporting the amounts and disclosures in the financial statements. An audit also includes assessing the accountingprinciples used and significant estimates made by management, as well as evaluating the overall financial statement presentation. We believe that our auditsprovide a reasonable basis for our opinion.
In our opinion, the consolidated financial statements referred to above present fairly, in all material respects, the financial position of CH2M HILLCompanies, Ltd. and subsidiaries as of December 30, 2016 and December 25, 2015, and the results of their operations and their cash flows for each of theyears in the three year period ended December 30, 2016, in conformity with U.S. generally accepted accounting principles.
/s/ KPMG LLP Denver, ColoradoMarch 7, 2017
64

Table of Contents
CH2M HILL COMPANIES, LTD. AND SUBSIDIARIES
Consolidated Balance Sheet
(Dollars in thousands)
December 30, December 25, 2016 2015ASSETS Current assets:
Cash and cash equivalents $ 131,029 $ 197,021Receivables, net—
Client accounts 604,150 739,532Unbilled revenue 530,751 601,713Other 11,485 17,316
Income tax receivable 18,375 19,800Prepaid expenses and other current assets 94,107 95,809
Total current assets 1,389,897 1,671,191Investments in unconsolidated affiliates 66,329 84,296Property, plant and equipment, net 248,432 203,666Goodwill 477,752 510,985Intangible assets, net 38,024 59,011Deferred income taxes 363,251 255,385Employee benefit plan assets and other 86,777 76,765
Total assets $ 2,670,462 $ 2,861,299LIABILITIES AND STOCKHOLDERS’ EQUITY Current liabilities:
Current portion of long-term debt $ 2,242 $ 2,069Accounts payable and accrued subcontractor costs 415,251 504,098Billings in excess of revenue 226,568 302,647Accrued payroll and employee related liabilities 272,458 328,585Other accrued liabilities 398,842 338,926
Total current liabilities 1,315,361 1,476,325Long-term employee related liabilities 308,118 599,033Long-term debt 495,632 299,593Other long-term liabilities 105,813 109,017
Total liabilities 2,224,924 2,483,968Commitments and contingencies (Note 18) Stockholders’ equity:
Preferred stock, $0.01 par value, 50,000,000 shares authorized of which 10,000,000 are designated asSeries A; 4,821,600 and 3,214,400 issued and outstanding at December 30, 2016 and as of December 25,2015, respectively 48 32Common stock, $0.01 par value, 100,000,000 shares authorized; 25,148,399 and 26,282,913 issued andoutstanding at December 30, 2016 and December 25, 2015, respectively 251 263Additional paid-in capital 169,573 125,381Retained earnings 586,252 561,213Accumulated other comprehensive loss (209,408) (274,704)
Total CH2M common stockholders’ equity 546,716 412,185Noncontrolling interests (101,178) (34,854)
Total stockholders' equity 445,538 377,331Total liabilities and stockholders’ equity $ 2,670,462 $ 2,861,299
The accompanying notes are an integral part of these consolidated financial statements.
65

Table of Contents
CH2M HILL COMPANIES, LTD. AND SUBSIDIARIES
Consolidated Statements of Operations
(Dollars in thousands except per share amounts)
December 30, December 25, December 31, 2016 2015 2014Gross revenue $ 5,235,944 $ 5,361,505 $ 5,413,469Equity in earnings of joint ventures and affiliated companies 51,957 46,765 54,918Operating expenses:
Direct cost of services (4,614,283) (4,343,156) (4,643,540)Selling, general and administrative (913,722) (930,273) (1,093,121)Impairment losses on goodwill and intangibles — — (73,312)
Operating (loss) income (240,104) 134,841 (341,586)Other income (expense):
Interest income 544 211 704Interest expense (16,183) (14,551) (14,926)
Income (loss) before benefit (provision) for income taxes (255,743) 120,501 (355,808)Benefit (provision) for income taxes 131,489 (28,384) 37,206Net (loss) income (124,254) 92,117 (318,602)Less: Loss (income) attributable to noncontrolling interests 139,292 (11,714) 137,065Net income (loss) attributable to CH2M $ 15,038 $ 80,403 $ (181,537)Net income (loss) attributable to CH2M per common share :
Basic $ 0.03 $ 2.62 $ (6.42)Diluted $ 0.03 $ 2.61 $ (6.42)
Weighted average number of common shares: Basic 25,648,091 27,119,498 28,256,864Diluted 25,732,114 27,181,179 28,256,864
Represents net (loss) income attributable to CH2M less (i) income allocated to preferred stockholders of $152 for the year ended December 30, 2016 and $4,279 for the year ended December 25, 2015,
respectively, and (ii) accrued dividends attributable to preferred stockholders of $14,006 and $5,088 for the years ended December 30, 2016 and December 25, 2015, respectively.
The accompanying notes are an integral part of these consolidated financial statements.
66
1
1

Table of Contents
CH2M HILL COMPANIES, LTD. AND SUBSIDIARIES
Consolidated Statements of Comprehensive Income (Loss)
(Dollars in thousands)
December 30, December 25, December 31, 2016 2015 2014Net (loss) income $ (124,254) $ 92,117 $ (318,602)Other comprehensive income (loss):
Foreign currency translation adjustments (27,141) (32,181) (23,903)Benefit plan adjustments, net of tax 92,437 29,834 (109,279)Unrealized (loss) gain on available-for-sale securities:
Loss on available-for-sale securities and other, net of tax — — (27)Less: reclassification adjustment for gains included in net income, net of tax — — (185)
Other comprehensive income (loss) 65,296 (2,347) (133,394)Comprehensive (loss) income (58,958) 89,770 (451,996)
Less: comprehensive (loss) income attributable to noncontrolling interests (126,402) 11,714 (137,065)Comprehensive income (loss) attributable to CH2M $ 67,444 $ 78,056 $ (314,931)
The accompanying notes are an integral part of these consolidated financial statements.
67

Table of Contents
CH2M HILL COMPANIES, LTD. AND SUBSIDIARIES
Consolidated Statements of Stockholders’ Equit y
(Dollars in thousands)
Accumulated Additional Other Total Preferred Stock Common Stock Paid-In Retained Comprehensive Noncontrolling Stockholders’ Shares Amount Shares Amount Capital Earnings Loss Interest EquityBalance at December 31, 2013 — $ — 28,782,277 $ 288 $ — $ 763,095 $ (138,963) $ 18,164 $ 642,584
Net loss — — — — — (181,537) — (137,065) (318,602)Other comprehensive (loss) income:
Foreign currency translationadjustments — — — — — — (23,903) — (23,903)Benefit plan adjustments, net oftax — — — — — — (109,279) — (109,279)Unrealized loss on equityinvestments, net of tax — — — — — — (27) — (27)Reclassification adjustment forgains included in net income, netof tax — — — — — — (185) — (185)
Distributions to affiliates, net — — — — — — — (6,289) (6,289)Shares issued in connection withstock based compensation andemployee benefit plans — — 934,514 9 48,949 — — — 48,958Shares issued in connection withpurchase of TERA — — 170,088 2 10,829 — — — 10,831Shares purchased and retired — — (2,563,309) (26) (59,778) (96,716) — — (156,520)
Balance at December 31, 2014 — $ — 27,323,570 $ 273 $ — $ 484,842 $ (272,357) $ (125,190) $ 87,568Net income — — — — — 80,403 — 11,714 92,117Other comprehensive (loss) income:
Foreign currency translationadjustments — — — — — — (32,181) — (32,181)Benefit plan adjustments, net oftax — — — — — — 29,834 — 29,834
Investments in affiliates, net — — — — — — — 78,622 78,622Shares issued in connection withstock based compensation andemployee benefit plans — — 607,846 6 32,968 — — — 32,974Series A Preferred Stock issued forcash 3,214,400 32 — — 191,645 — — — 191,677Shares purchased and retired — — (1,648,503) (16) (99,232) (4,032) — — (103,280)
Balance at December 25, 2015 3,214,400 32 26,282,913 263 125,381 561,213 (274,704) (34,854) 377,331Cumulative retained earningsadjustment due to ASU 2016-09 11,078 11,078
Balance at December 26, 2015 3,214,400 32 26,282,913 263 125,381 572,291 (274,704) (34,854) 388,409Net income (loss) — — — — — 15,038 — (139,292) (124,254)Other comprehensive (loss) income:
Foreign currency translationadjustments — — — — — — (27,141) — (27,141)Benefit plan adjustments, net oftax — — — — — — 79,547 — 79,547
Shares issued to noncontrollinginterest in Halcrow Group Limited — — — — 11,838 — 12,890 (24,688) 40Acquisition of controlling interest injoint venture — — — — — — 6,058 6,058Investments in affiliates, net — — — — — — — 91,598 91,598Shares issued in connection withstock based compensation andemployee benefit plans — — 581,502 6 36,289 — — — 36,295Series A Preferred Stock issued forcash 1,607,200 16 — — 100,861 (1,077) — — 99,800Shares purchased and retired — — (1,716,016) (18) (104,796) — — — (104,814)
Balance at December 30, 2016 4,821,600 $ 48 25,148,399 $ 251 $ 169,573 $ 586,252 $ (209,408) $ (101,178) $ 445,538
The accompanying notes are an integral part of these consolidated financial statements.
68
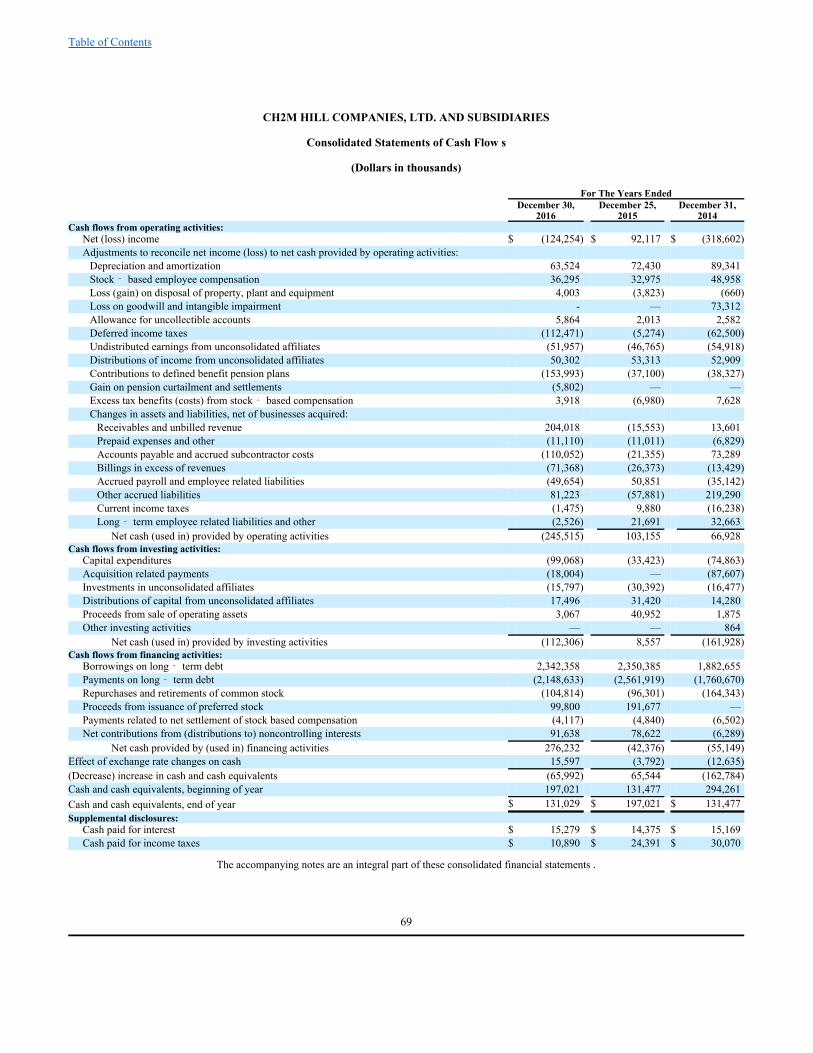
Table of Contents
CH2M HILL COMPANIES, LTD. AND SUBSIDIARIES
Consolidated Statements of Cash Flow s
(Dollars in thousands)
For The Years Ended December 30, December 25, December 31, 2016 2015 2014Cash flows from operating activities:
Net (loss) income $ (124,254) $ 92,117 $ (318,602)Adjustments to reconcile net income (loss) to net cash provided by operating activities:
Depreciation and amortization 63,524 72,430 89,341Stock ‑based employee compensation 36,295 32,975 48,958Loss (gain) on disposal of property, plant and equipment 4,003 (3,823) (660)Loss on goodwill and intangible impairment - — 73,312Allowance for uncollectible accounts 5,864 2,013 2,582Deferred income taxes (112,471) (5,274) (62,500)Undistributed earnings from unconsolidated affiliates (51,957) (46,765) (54,918)Distributions of income from unconsolidated affiliates 50,302 53,313 52,909Contributions to defined benefit pension plans (153,993) (37,100) (38,327)Gain on pension curtailment and settlements (5,802) — —Excess tax benefits (costs) from stock ‑based compensation 3,918 (6,980) 7,628Changes in assets and liabilities, net of businesses acquired:
Receivables and unbilled revenue 204,018 (15,553) 13,601Prepaid expenses and other (11,110) (11,011) (6,829)Accounts payable and accrued subcontractor costs (110,052) (21,355) 73,289Billings in excess of revenues (71,368) (26,373) (13,429)Accrued payroll and employee related liabilities (49,654) 50,851 (35,142)Other accrued liabilities 81,223 (57,881) 219,290Current income taxes (1,475) 9,880 (16,238)Long ‑term employee related liabilities and other (2,526) 21,691 32,663
Net cash (used in) provided by operating activities (245,515) 103,155 66,928Cash flows from investing activities:
Capital expenditures (99,068) (33,423) (74,863)Acquisition related payments (18,004) — (87,607)Investments in unconsolidated affiliates (15,797) (30,392) (16,477)Distributions of capital from unconsolidated affiliates 17,496 31,420 14,280Proceeds from sale of operating assets 3,067 40,952 1,875Other investing activities — — 864
Net cash (used in) provided by investing activities (112,306) 8,557 (161,928)Cash flows from financing activities:
Borrowings on long ‑term debt 2,342,358 2,350,385 1,882,655Payments on long ‑term debt (2,148,633) (2,561,919) (1,760,670)Repurchases and retirements of common stock (104,814) (96,301) (164,343)Proceeds from issuance of preferred stock 99,800 191,677 —Payments related to net settlement of stock based compensation (4,117) (4,840) (6,502)Net contributions from (distributions to) noncontrolling interests 91,638 78,622 (6,289)
Net cash provided by (used in) financing activities 276,232 (42,376) (55,149)Effect of exchange rate changes on cash 15,597 (3,792) (12,635)(Decrease) increase in cash and cash equivalents (65,992) 65,544 (162,784)Cash and cash equivalents, beginning of year 197,021 131,477 294,261Cash and cash equivalents, end of year $ 131,029 $ 197,021 $ 131,477Supplemental disclosures:
Cash paid for interest $ 15,279 $ 14,375 $ 15,169Cash paid for income taxes $ 10,890 $ 24,391 $ 30,070
The accompanying notes are an integral part of these consolidated financial statements .
69

Table of Contents
(1) Summar y of Business and Significant Accounting Policies
Summary of Business
CH2M HILL Companies, Ltd. and subsidiaries (“We”, “Our”, “CH2M” or the “Company”) is a large employee‑controlledprofessional engineering services firm, founded in 1946, providing engineering, construction, consulting, design, design‑build, procurement,engineering‑procurement‑construction (“EPC”), operations and maintenance, program management and technical services to U.S. federal, state,municipal and local government agencies, national governments, as well as private industry and utilities, around the world. A substantialportion of our professional fees are derived from projects that are funded directly or indirectly by government entities.
Basic Presentation and Principles of Consolidation
The consolidated financial statements (referred to herein as “financial statements”) are prepared in accordance with U.S. generallyaccepted accounting principles (“U.S. GAAP”). The consolidated financial statements include the accounts of CH2M and all of its whollyowned subsidiaries after elimination of all intercompany accounts and transactions. Partially owned affiliates and joint ventures are evaluatedfor consolidation. The consolidated financial statements include the accounts of all joint ventures in which the Company is the primarybeneficiary.
The equity method of accounting is used for investments in companies which we do not control. Our consolidated net income includesour proportionate share of the net income or loss of these companies. The cost method of accounting is used for our investments in companiesthat we do not control and for which we do not have the ability to exercise significant influence over operating and financial policies. Theseinvestments are recorded at cost.
Use of Estimates
The preparation of financial statements in conformity with U.S. GAAP requires management to make certain estimates, judgments,and assumptions. These estimates, judgments and assumptions can affect the reported amounts of assets and liabilities as of the date of theconsolidated financial statements, as well as the reported amounts of revenue and expenses during the periods presented. Actual results coulddiffer from our estimates.
Capital Structure
Our Company has authorized 100,000,000 shares of common stock, par value $0.01 per share, and 50,000,000 shares of Class Apreferred stock, par value $0.01 per share. The bylaws and articles of incorporation provide for the imposition of certain restrictions on thestock including, but not limited to, the right but not the obligation to repurchase shares upon termination of employment or affiliation, the rightof first refusal and ownership limits.
Change in Fiscal Year End
On March 30, 2015, in order to accommodate our financial accounting systems and the timely gathering and reporting of financialinformation, we changed our reporting period from a calendar year ending on December 31 of each year to a fiscal year ending on the lastFriday of December of each year, which in certain years results in a 53-week fiscal year. Our fiscal quarters also end on the last Friday ofMarch, June, and September. This change has been retroactively applied as if it was adopted as of January 1, 2015. The change in fiscal year-end did not have a material effect on the comparability of the periods presented.
Foreign Currency Translation
All assets and liabilities of our foreign subsidiaries are translated into U.S. dollars as of each balance sheet date. Translation gains andlosses related to permanent investments in foreign subsidiaries are reflected in stockholders’ equity as part of accumulated other comprehensiveloss. Revenues and expenses are translated at the average exchange rate for the period and included in the consolidated statements ofoperations. Foreign currency transaction gains and losses are recognized as incurred in the consolidated statements of operations.
Revenue Recognition
We earn revenue from different types of services performed under various types of contracts, including cost-plus, fixed-price and time-and-materials. We evaluate contractual arrangements to determine how to recognize revenue. We primarily perform
70
Table of Contents
engineering and construction related services and recognize revenue for these contracts on the percentage-of-completion method where progresstowards completion is measured by relating the actual cost of work performed to date to the current estimated total cost of the respectivecontract. In making such estimates, judgments are required to evaluate potential variances in schedule, the cost of materials and labor,productivity, subcontractor costs, liability claims, contract disputes, and achievement of contract performance standards. We record thecumulative effect of changes in contract revenue and cost at completion in the period in which the changed estimates are determined to bereliably estimable.
Below is a description of the four basic types of contracts from which we may earn revenue:
Cost‑Plus Contracts. Cost‑plus contracts can be cost plus a fixed fee or rate, or cost plus an award fee. Under these types ofcontracts, we charge our clients for our costs, including both direct and indirect costs, plus a fixed fee or an award fee. We generally recognizerevenue based on the labor and non-labor costs we incur, plus the portion of the fixed fee or award fee we have earned to date.
Included in the total contract value for cost-plus fee arrangements is the portion of the fee for which receipt is determined to beprobable. Award fees are influenced by the achievement of contract milestones, cost savings and other factors.
Fixed Price Contracts. Under fixed-price contracts, our clients pay us an agreed amount negotiated in advance for a specified scope ofwork. For engineering and construction contracts, we recognize revenue on fixed-price contracts using the percentage-of-completion methodwhere direct costs incurred to date are compared to total projected direct costs at contract completion. Prior to completion, our recognizedprofit margins on any fixed-price contract depend on the accuracy of our estimates and will increase to the extent that our actual costs are belowthe original estimated amounts. Conversely, if our costs exceed these estimates, our profit margins will decrease, and we may realize a loss on aproject. The significance of these estimates varies with the complexity of the underlying project, with our large, fixed-price EPC projects beingmost significant.
Time‑and‑Materials Contracts. Under our time-and-materials contracts, we negotiate hourly billing rates and charge our clients basedon the actual time that we expend on a project. In addition, clients reimburse us for our actual out of pocket costs of materials and other directexpenditures that we incur in connection with our performance under the contract. Our profit margins on time-and-materials contracts fluctuatebased on actual labor and overhead costs that we directly charge or allocate to contracts compared with the negotiated billing rate and markupon other direct costs. Some of our time-and-materials contracts are subject to maximum contract values, and accordingly, revenue under thesecontracts is recognized under the percentage-of-completion method where costs incurred to date are compared to total projected costs at contractcompletion. Revenue on contracts that is not subject to maximum contract values is recognized based on the actual number of hours we spendon the projects plus any actual out of pocket costs of materials and other direct expenditures that we incur on the projects.
Operations and Maintenance Contracts. A portion of our contracts are operations and maintenance type contracts. Revenue isrecognized on operations and maintenance contracts on a straight-line basis over the life of the contract once we have an arrangement, servicehas begun, the price is fixed or determinable and collectability is reasonably assured.
For all contract types noted above, change orders are included in total estimated contract revenue when it is probable that the changeorder will result in an addition to contract value and when the change order can be estimated. Management evaluates when a change order isprobable based upon its experience in negotiating change orders, the customer’s written approval of such changes or separate documentation ofchange order costs that are identifiable. Additional contract revenue related to claims is included in total estimated contract revenue when theamount can be reliably estimated, which is typically evidenced by a contract or other evidence providing a legal basis for the claim.
Losses on construction and engineering contracts in process are recognized in their entirety when the loss becomes evident and theamount of loss can be reasonably estimated.
Unbilled Revenue and Billings in Excess of Revenue
Unbilled revenue represents the excess of contract revenue recognized over billings to date on contracts in process. These amountsbecome billable according to the contract terms, which usually consider the passage of time, achievement of certain milestones or completion ofthe project.
Billings in excess of revenue represent the excess of billings to our clients to date, per the contract terms, over work performed andrevenue recognized on contracts in process using the percentage-of-completion method.
71
Table of Contents
Allowance for Uncollectible Accounts Receivable
We reduce accounts receivable by estimating an allowance for amounts that may become uncollectible in the future. Managementdetermines the estimated allowance for uncollectible amounts based on their judgments in evaluating the aging of the receivables and thefinancial condition of our clients, which may be dependent on the type of client and the client’s current financial condition.
Fair Value Measurements
Fair value represents the price that would be received to sell an asset or paid to transfer a liability (an exit price) in the principal ormost advantageous market for the asset or liability in an orderly transaction between market participants on the measurement date. Assets andliabilities are valued based upon observable and non-observable inputs. Valuations using Level 1 inputs are based on unadjusted quoted pricesthat are available in active markets for the identical assets or liabilities at the measurement date. Level 2 inputs utilize significant otherobservable inputs available at the measurement date, other than quoted prices included in Level 1, either directly or indirectly; and valuationsusing Level 3 inputs are based on significant unobservable inputs that cannot be corroborated by observable market data and reflect the use ofsignificant management judgment. There were no significant transfers between levels during any period presented.
Restructuring and Related Charges
An exit activity includes but is not limited to a restructuring, such as a sale or termination of a line of business, the closure of businessactivities in a particular location, the relocation of business activities from one location to another, changes in management structure, and afundamental reorganization that affects the nature and focus of operations. The Company recognizes a current and long-term liability, withinother accrued liabilities and other long term liabilities, respectively, and the related expense, within general and administration expense, forrestructuring costs when the liability is incurred and can be measured. Restructuring accruals are based upon management estimates at the timethey are recorded and can change depending upon changes in facts and circumstances subsequent to the date the original liability wasrecorded. Nonretirement postemployment benefits offered as special termination benefits to employees, such as a voluntary early retirementprogram, are recognized as a liability and a loss when the employee accepts the offer and the amount can be reasonably estimated.
Income Taxes
We account for income taxes utilizing an asset and liability approach that requires the recognition of deferred tax assets and liabilitiesfor the expected future tax effects of events that have been recognized in the financial statements or tax returns. In estimating future taxconsequences, we generally consider all expected future events other than enactment of changes in the tax laws or rates. Deferred tax assets andliabilities are determined based on the difference between the tax basis of assets and liabilities and their reported amounts using enacted taxrates in effect for the year in which differences are expected to reverse. A valuation allowance is provided for deferred tax assets if it is morelikely than not that these items will not be realized. Annually, we determine the amount of undistributed foreign earnings invested indefinitelyin our foreign operations. Deferred taxes are not provided on those earnings. In addition, the calculation of tax assets and liabilities involvesuncertainties in the application of complex tax regulations. For income tax benefits to be recognized, a tax position must be more likely thannot to be sustained upon examination by taxing authorities. We record reserves for uncertain tax positions that do not meet these criteria.
Cash and Cash Equivalents
Highly liquid investments with original short‑term maturities of less than three months are considered cash equivalents in theconsolidated balance sheets and statements of cash flows. We maintain a domestic cash management system which provides for cash sufficientto satisfy financial obligations as they are submitted for payment and any excess cash in domestic bank accounts is applied against anyoutstanding debt held under our credit facility described below. If there is no balance outstanding on the credit facility, we invest cash in excessof this amount in money market funds. In addition, cash and cash equivalents on our consolidated balance sheets include cash held within ourconsolidated joint venture entities which is used for operating activities of those joint ventures. As of December 30, 2016 and December 25,2015, cash and cash equivalents held in our consolidated joint ventures and reflected on the consolidated balance sheets totaled $46.6 millionand $95.4 million, respectively.
72

Table of Contents
Property, Plant and Equipment
All additions, including improvements to existing facilities, are recorded at cost. Maintenance and repairs are charged to expense asincurred. When assets are retired or otherwise disposed of, the cost of the assets and the related accumulated depreciation are removed from theaccounts. Any gain or loss on retirements is reflected in operating income in the year of disposition.
Depreciation for owned property is based on the estimated useful lives of the assets using the straight‑line method for financialstatement purposes. Useful lives for buildings and land improvements range from twelve to twenty years. Furniture and fixtures, computersand office equipment, and field equipment are depreciated over their useful lives from three to ten years. Leasehold improvements aredepreciated over the shorter of their estimated useful life or the remaining term of the associated lease.
Goodwill
Goodwill represents the excess of costs over fair value of the assets of businesses we have acquired. Goodwill acquired in a purchasebusiness combination is not amortized, but instead, is tested for impairment at least annually. Our annual goodwill impairment test is conductedas of the first day of the fourth quarter of each year, however, upon the occurrence of certain triggering events, we are also required to test forimpairment at dates other than the annual impairment testing date. In performing the impairment test, we evaluate our goodwill at the reportingunit level. We have the option to assess either quantitative or qualitative factors to determine whether it is more likely than not that the fairvalues of our reporting units are less than their carrying amounts. If after assessing the totality of events or circumstances, we determine that itis not more likely than not that the fair values of our reporting units are less than their carrying amounts, then the next step of the impairmenttest is unnecessary. If we conclude otherwise, then we are required to test goodwill for impairment under the two-step process. The two-stepprocess involves comparing the estimated fair value of each reporting unit to the unit’s carrying value, including goodwill. If the carrying valueof a reporting unit does not exceed its fair value, the goodwill of the reporting unit is not considered impaired; therefore, the second step of theimpairment test is unnecessary. If the carrying amount of a reporting unit exceeds its estimated fair value, we would then perform a second stepto measure the amount of goodwill impairment loss to be recorded.
We determine the fair value of our reporting units using a combination of the income approach, the market approach, and the costapproach. The income approach calculates the present value of future cash flows based on assumptions and estimates derived from a review ofour expected revenue growth rates, profit margins, business plans, cost of capital and tax rates for the reporting units. Our market basedvaluation method estimates the fair value of our reporting units by the application of a multiple to our estimate of a cash flow metric for eachbusiness unit. The cost approach estimates the fair value of a reporting unit as the net replacement cost using current market quotes.
Intangible Assets
We may acquire other intangible assets in business combinations. Intangible assets are stated at fair value as of the date they areacquired in a business combination. We amortize intangible assets with finite lives on a straight-line basis over their expected useful lives,currently up to ten years. We test our intangible assets for impairment in the period in which a triggering event or change in circumstanceindicates that the carrying amount of the intangible asset may not be recoverable. If the carrying amount of the intangible asset exceeds the fairvalue, an impairment loss will be recognized in the amount of the excess. We determine the fair value of the intangible assets using adiscounted cash flow approach.
Accumulated Other Comprehensive Loss
Accumulated other comprehensive loss consists of foreign currency translation adjustments and benefit plan adjustments, as discussedin more detail in Note 16 – Employee Retirement Plans . These components are included in the consolidated statements of stockholders’ equityand consolidated statements of comprehensive income. Taxes are not provided on the foreign currency translation gains and losses as deferredtaxes are not provided on the unremitted earnings of the foreign subsidiaries to which they relate.
73
Table of Contents
For the year ended December 30, 2016, changes to accumulated other comprehensive loss are as follows:
($ in thousands) 2016Benefit plans:
Balance at beginning of year $ (225,669)Benefit plan adjustments 72,402Noncontrolling interest in Halcrow Group Limited 12,890Other comprehensive income recognized during the year 7,145
Balance at end of year $ (133,232)Foreign currency translation:
Balance at beginning of year $ (49,035)Other comprehensive loss recognized during the year (27,141)
Balance at end of year $ (76,176)
Other comprehensive income related to our benefit plans includes pretax adjustments of $95.5 million ($72.4 million, net of tax) forthe year ended December 30, 2016. Other comprehensive income is recognized within the selling, general and administrative expense on ourconsolidated statements of operations.
Derivative instruments
We primarily enter into derivative financial instruments to mitigate exposures to changing foreign currency exchange rates on ourearnings and cash flows. We are primarily subject to this risk on long-term projects whereby the currency being paid by our client differs fromthe currency in which we incurred our costs, as well as intercompany trade balances among entities with differing currencies. We do not enterinto derivative transactions for speculative or trading purposes. All derivatives are carried at fair value on the consolidated balance sheets inother receivables or other accrued liabilities as applicable. The periodic change in the fair value of the derivative instruments related to ourbusiness group operations is recognized in earnings within direct costs. The periodic change in the fair value of the derivative instrumentsrelated to our general corporate foreign currency exposure is recognized within selling, general and administrative expense.
Concentrations of Credit Risk
Financial instruments which potentially subject our company to concentrations of credit risk consist principally of cash and cashequivalents, short term investments and trade receivables. Our cash is primarily held with major banks and financial institutions throughout theworld and typically is insured up to a set amount. Accordingly, we believe the risk of any potential loss on deposits held in these institutions isminimal. Concentrations of credit risk relative to trade receivables are limited due to our diverse client base, which includes the U.S. federalgovernment, various states and municipalities, foreign government agencies, and a variety of U.S. and foreign corporations operating in a broadrange of industries and geographic areas.
Contracts with the U.S. federal government and its prime contractors usually contain standard provisions for permitting thegovernment to modify, curtail or terminate the contract for convenience of the government or such prime contractors if program requirements orbudgetary constraints change. Upon such a termination, we are generally entitled to recover costs incurred, settlement expenses and profit onwork completed prior to termination.
Recent Accounting Standards
In January 2017, the FASB issued Accounting Standard Update ("ASU") 2017-04, Intangibles-Goodwill and Other (Topic 350):Simplifying the Test of Goodwill Impairment. This ASU was issued with the objective of simplifying the subsequent measurement of goodwillfor public business entities and not-for-profit entities by eliminating the second step of the goodwill impairment test. As a result, an entitywould perform its annual, or interim, goodwill impairment test by comparing the fair value of a reporting unit with its carrying amount andrecognize an impairment charge for the amount by which the carrying amount exceeds the reporting unit’s fair value. The loss recognizedshould not exceed the total amount of goodwill allocated to that reporting unit. This ASU will be effective for fiscal years beginning afterDecember 15, 2019, and early adoption is permitted for interim and annual goodwill impairment tests performed on testing dates afterJanuary 1, 2017. We do not believe this ASU will have a material impact on our financial statements, and this change would not have impactedour 2016 annual impairment test conclusions. We plan to early adopt this ASU, and it will be effective for our annual goodwill impairment testto be conducted as of the first day of the fourth quarter
74

Table of Contents
of 2017.
In January 2017, the FASB issued Accounting Standard Update ("ASU") 2017-01, Business Combinations (Topic 805): Clarifying theDefinition of a Business). This ASU clarifies the definition of a business with the objective of adding guidance to assist entities with evaluatingwhether transactions should be accounted for as acquisitions (or disposals) of assets or businesses. This ASU will be effective for fiscal yearsbeginning after December 15, 2017, and should be applied prospectively. Once effective, we will apply this guidance to determine if certaintransactions are acquisitions (or disposals) of assets or businesses, but we do not believe this ASU will materially change how we currentlyevaluate similar transactions.
In October 2016, the FASB issued ASU 2016-17, Consolidation (Topic 810): Interests Held through Related Parties That Are under
Common Control . This standard amends the guidance issued with ASU 2015-02, Consolidation (Topic 810): Amendments to the ConsolidationAnalysis in order to make it less likely that a single decision maker would individually meet the characteristics to be the primary beneficiary of aVariable Interest Entity ("VIE"). When a decision maker or service provider considers indirect interests held through related parties undercommon control, they perform two steps. The second step was amended with this ASU to say that the decision maker should consider interestsheld by these related parties on a proportionate basis when determining the primary beneficiary of the VIE rather than in their entirety as wascalled for in the previous guidance. This ASU will be effective for fiscal years beginning after December 15, 2016, and early adoption is notpermitted. We are currently evaluating the impact of the adoption of this ASU on our financial position and results of operations.
In October 2016, the FASB issued ASU 2016-16, Income Taxes (Topic 740): Intra-Entity Transfers of Assets Other Than Inventory
. This ASU was issued with the objective to improve the accounting for the income tax consequences of intra-entity transfers of assets otherthan inventory. The new standard will require companies to recognize the income tax consequences of an intra-entity transfer of non-inventoryasset when the transfer occurs. This ASU will be effective for fiscal years beginning after December 15, 2017, and early adoption ispermitted. We are currently evaluating the impact of the adoption of this ASU on our financial position and results of operations.
In August 2016, the FASB issued ASU 2016-15, Statement of Cash Flows (Topic 230): Classification of Certain Cash Receipts and
Cash Payments. This ASU provides guidance for eight specific changes with respect to how certain cash receipts and cash payments areclassified within the statement of cash flows in order to reduce existing diversity in practice. This ASU will be effective for fiscal yearsbeginning after December 15, 2017, with early adoption permitted, and it should be applied using a retroactive transition method to each periodpresented. We are currently evaluating the impacts the adoption of this standard will have on our consolidated statements of cash flows,focusing on the impact our cash flows related to distributions received from equity method investees and contingent consideration paymentsmade subsequent to business combinations. We anticipate that approximately $15.9 million of the acquisition related payments within ourinvesting cash flows for the year ended December 30, 2016 will be reclassified to financing cash flows as a result of adopting this ASU.
In March 2016, the FASB issued ASU 2016-09, Improvements to Employee Share-Based Payments Accounting . The Companyelected to early adopt ASU 2016-09 with an effective date of December 26, 2015. As a result, for the year ended December 30, 2016, theCompany recognized the excess tax benefit of $3.9 million within income tax benefit on the consolidated statements of operations, adoptedprospectively, and previously unrecognized excess tax benefits of $11.1 million resulted in a cumulative-effect adjustment to retainedearnings. The adoption did not impact the existing classification of awards. Excess tax costs from stock-based compensation of $7.0 millionand excess tax benefits from stock-based compensation of $7.6 million for the years ended December 25, 2015 and December 31, 2014,respectively, were restated into cash flows from operating activities from cash flows from financing activity. Additionally, adoptedretrospectively, the Company reclassified $4.8 million and $6.5 million of employee withholding taxes paid from operating activities intofinancing activities for the years ended December 30, 2016 and December 25, 2015, respectively. Following the adoption of the standard, theCompany elected to continue estimating the number of awards expected to be forfeited and adjust its estimate on an ongoing basis.
In February 2016, the FASB issued ASU 2016-02, Leases . This ASU is a comprehensive new leases standard that was issued to
increase transparency and comparability among organizations by recognizing lease assets and lease liabilities on the balance sheet anddisclosing key information about leasing arrangements. The amendments in this ASU are effective for fiscal years beginning afterDecember 15, 2018, including interim periods within those fiscal years. We continue to assess the impact of adopting ASU 2016-02, but expectto record a significant amount of right-of-use assets and corresponding liabilities. Based upon our operating leases as of December 30, 2016,we have a total of $540.6 million undiscounted future minimum lease payments, without consideration of sublease income.
In January 2016, the FASB issued Accounting Standards Update (“ASU”) 2016-01, Recognition and Measurement of
75
Table of Contents
Financial Assets and Financial Liabilities . The amendments issued with this ASU require equity securities (including other ownershipinterests, such as partnerships, unincorporated joint ventures, and limited liability companies) to be measured at fair value with changes in thefair value recognized through net income. An entity’s equity investments that are accounted for under the equity method of accounting or resultin consolidation of an investee are not included within the scope of this update. This ASU will be effective for annual reporting periodsbeginning after December 15, 2017 and interim periods within those annual periods, with early adoption permitted. We believe this standard’simpact on CH2M will be limited to equity securities currently accounted for under the cost method of accounting, which as of December 30,2016 are valued at $3.5 million within investments in unconsolidated affiliates on the consolidated balance sheet. We do not expect theadoption of this standard to have a material impact on our consolidated statements of operations.
In November 2015, the FASB issued ASU 2015-17, Balance Sheet Classification of Deferred Taxes . The ASU simplifies thepresentation of deferred income taxes by requiring that deferred tax liabilities and assets are classified as noncurrent in a classified statement offinancial position. This simplification does not affect the current requirement that deferred tax liabilities and assets of a tax-paying componentof an entity be offset and presented as a single amount. This ASU is effective for annual periods beginning after December 15, 2016 andinterim periods within those annual periods. We have elected to early adopt this ASU as of December 26, 2015 in order to benefit from thesimplification of the deferred income tax balance sheet presentation. We have applied the change in accounting principle retrospectivelyresulting in a total long-term deferred tax asset of $255.4 million as of December 25, 2015, which had previously been reported as a currentdeferred tax asset of $8.7 million and a long-term deferred tax asset of $246.7 million.
In August 2014, the FASB issued ASU 2014-15, Disclosure of Uncertainties about an Entity’s Ability to Continue as a Going Concern. The ASU requires that management evaluate for each annual and interim reporting period whether there are conditions or events, consideredin the aggregate, that raise substantial doubt about the entity’s ability to continue as a going concern within one year after the date the financialstatements are issued. If there are conditions or events that raise substantial doubt about the entity’s ability to continue as a going concern,additional disclosures are required, even if the substantial doubt is alleviated as a result of consideration of management’s plans. This ASUbecame effective for our reporting periods beginning after December 15, 2016. The adoption of this standard did not have a material impact onour consolidated financial statements.
In May 2014, the FASB issued ASU 2014-09, Revenue from Contracts with Customers and subsequently modified with variousamendments and clarifications. This ASU is a comprehensive new revenue recognition model that is based on the principle that an entityshould recognize revenue to depict the transfer of goods or services to customers in an amount that reflects the consideration to which the entityexpects to be entitled in exchange for those goods and services. The ASU also requires additional quantitative and qualitative disclosures aboutthe nature, amount, timing and uncertainty of revenue and cash flows arising from contracts with customers, including significant judgmentsand changes in judgments and assets recognized from costs incurred to obtain or fulfill a contract. This ASU, as amended, is effective forannual reporting periods beginning after December 15, 2017 and interim periods within those annual periods. Companies may use either a fullretrospective or a modified retrospective approach to adopt this ASU. CH2M is currently evaluating the impact of this ASU, the subsequentlyissued amendments, and the transition alternatives on its financial position and results of operations. We have begun categorizing our variouscontract revenue streams in order to isolate those that will be significantly impacted. Once we have completed the assessment of the impactedrevenue streams, we can begin estimating the potential impact of the new standard as well as identify necessary controls, processes andinformation system changes.
(2) Changes in Project-Related Estimates
We have a fixed-price Transportation contract to design and construct roadway improvements on an expressway in the southwesternUnited States. The project is approximately 75% complete as of December 30, 2016. In 2014, we experienced unforeseen and unexpected costgrowth resulting in charges to operatio ns totaling $38.7 million for the year ended December 31, 2014, which included both the reversal ofpreviously recognized profits as well as the recording of the estimated total loss on the project at completion. In 2015, additional increases tothe cost estimates were identified primarily caused by design changes for a water main relocation, the discovery of extremely hard and abrasiverock during construction, differing site conditions, unidentified and mismarked utilities, client requested changes, labor supply challenges in theconstruction market, lower than expected labor productivity, and severe adverse weather delays. These increased cost growth resulted in therecording of additional project losses of $93.6 million in the year ended December 25, 2015.
During the first half of 2016, we estimated further cost growth in the amount of $60.0 million as a result of a review of the coveredscope of contracts, survey engineering and design challenges, rework of previously installed work and client-caused delays,
76

Table of Contents
including limited daytime access to portions of the site, the sum of which resulted in increased material quantities and work and scheduleextensions. We also had severe weather including record rainfall, and production shortfalls resulting from differing site conditions andengineering rework. Additionally, during the second half of 2016, we estimated additional cost growth of $61.3 million due to continued surveyengineering and design challenges, additional rework, greater than expected subcontractor costs, subcontracting work previously planned to beself-performed, delivery schedule extensions (which increased the overall estimated costs for labor and expenses), greater than expectedconstruction material expenditures, and additional weather delays.
CH2M is seeking resolution of outstanding change orders and claims through a combination of submissions to the Disputes Boardunder the terms of the contract and direct negotiations with the client. Change orders and claims totaling approximately $84.0 million havebeen submitted to the client. We have received favorable, non-binding recommendations from the Disputes Board on some of the claims. Wehave not been able to reach a mutual resolution with the client on these claims or the other change orders submitted. CH2M will continue toaggressively pursue its entitlements based on claims and change orders, including litigation if it cannot reach resolution with theclient. Accordingly, we cannot currently estimate the timing or amounts of recoveries or costs that may be achieved or incurred through theseresolution processes, and as such, we have not included any recoveries from these change orders and claims in our current estimated costs tocomplete.
While management believes that it has recorded an appropriate provision to complete the project, we may incur additional costs andlosses if our cost estimation processes identify new costs not previously included in our total estimated loss. These possible cost increasesinclude extensions of the schedule to complete the job, lower than expected productivity levels, and performance issues with oursubcontractors. These potential changes in estimates could be materially adverse to the Company’s results of operations, cash flow or liquidity.
Within our Power EPC segment, we were involved in a fixed-price EPC project in Australia through a consolidated joint venturepartnership with an Australian construction contractor and a major U.S.-based gas power technology manufacturer (the “Consortium”) toengineer, procure, construct and start-up a combined cycle power plant that will supply power to a large liquefied natural gas facility inAustralia. As of December 30, 2016, the total contract value of the joint venture project was approximately $520.0 million, and the project wasapproximately 85% complete. Due to a variety of issues, the joint experienced project losses of $280.0 million in 2014, of which our portion ofthe loss was $140.0 million .
During the second quarter of 2016, the client advised it was unable to meet various obligations in line with the program schedule asrequired under the terms of the contract. Subsequently in 2016, the client was unable to confirm the timing of its deliverables under the terms ofthe contract including the supply of feed gas, plant utilities and electrical power loads. As a result, the anticipated project completion date wasexpected to be delayed into 2018, thus significantly increasing the joint venture’s costs estimated to complete the project. Additionally,forecasted productivity levels that were assumed for construction completion had not been achieved, including as a result of client delays anddisruptions, also increasing the joint venture’s total estimated costs to complete. As a result of these factors, as well as others, and inclusive ofestimated anticipated further disruptions and inefficiencies, the joint venture recognized additional costs totaling $301.5 million in 2016, ofwhich our portion was $154.1 million.
On January 24, 2017, the Consortium terminated its contract with its client the general contractor, JKC Australia LNG Pty (the“Contractor”) on the grounds that the Contractor had by its actions repudiated the contract. The Contractor has claimed that the Consortium’stermination was not valid. The Consortium, which includes the consolidated Australian joint venture partnership, expects to file arbitrationclaims against the Contractor during the first half of 2017, and anticipates that the Contractor will file counter claims. We expect a lengthy,multi-year arbitration process and at this time we are unable to predict the timing of resolution or the outcome of disputes. While we continueto assess the possible impacts to our financial statements, the ultimate outcome of the dispute will depend upon contested issues of fact andlaw. As a result of the contract termination, we evaluated the potential future costs as of December 30, 2016 in accordance with the accountingstandards applicable to contingent liabilities. The joint venture has incurred costs totaling approximately $20.0 million in 2017 to demobilizefrom the site and expects to continue to incur significant legal and other costs until the dispute is resolved. The Consortium is also in theprocess of determining the required costs to close out and terminate its current subcontractor obligations. These costs, which we expect will beincurred in 2017, have been accrued within our provision for loss accrual in our consolidated financial statements as of December 30, 2016based upon our best estimate from the information currently available. It is possible that certain subcontractors could file claims against theConsortium as a result of our termination of their subcontract which could be material to our consolidated financial statements. Additionally,the joint venture’s performance on the project is secured by certain bonds totaling approximately $50.0 million which could potentially becalled by our client at some time in the future. If we are ultimately unsuccessful in our claim that the contract was repudiated by our client, theConsortium could be liable for the completion of the project by a separate contractor and other related damages. These additional costs couldbe materially adverse to our results of operations, cash flow and financial condition in the future.
77

Table of Contents
During 2014, we experienced significant cost growth on a fixed-price Power contract to design and construct a new power generationfacility in the northeastern United States. These increases in costs resulted from multiple sources including a substantial decline in union laborproductivity, poor subcontractor performance and the impacts of schedule delays caused by the above items and severe weather in thenortheastern United States. The effect of these changes in estimates resulted in a charge to operations totaling $64.4 million in the year endedDecember 31, 2014. There were no additional charges to operations in the year ended December 25, 2015 as the project achieved substantialcompletion in 2014. In the third quarter of 2016, we reached a final settlement with the client which did not materially change our financialposition on the project. All obligations associated with this project are scheduled for final completion during the first quarter of 2017.
All reserves for project related losses are included in other current liabilities and totaled $258.3 million and $152.6 million as ofDecember 30, 2016 and December 25, 2015, respectively. Of the amount included in the December 30, 2016 balance, $90.1 million relates toaccrued project losses attributable to, and payable by, the noncontrolling joint venture partner.
(3) Preferred Stock Issuance
As of December 30, 2016, the Company had 50,000,000 shares of preferred stock, $0.01 par value, authorized. On June 22, 2015, theCompany designated 10,000,000 shares as Series A Preferred Stock with an original issue price of $62.22 under the Certificate ofDesignation. On June 24, 2015, the Company sold and issued an aggregate of 3,214,400 shares of Series A Preferred Stock for an aggregatepurchase price of $200.0 million in a private placement to a subsidiary owned by investment funds affiliated with Apollo Global Management,LLC (together with its subsidiaries, “Apollo”). Total proceeds from the preferred stock offering were $191.7 million, net of issuance costs of$8.3 million. The sale occurred in connection with the initial closing pursuant to the Subscription Agreement entered into by the Company andApollo on May 27, 2015 (“Subscription Agreement”). On April 11, 2016, Apollo purchased an additional 1,607,200 shares of Series APreferred Stock for an aggregate purchase price of approximately $100.0 million in a second closing subject to the conditions within theSubscription Agreement. Total proceeds from the preferred stock offering were $99.8 million, net of issuance costs of $0.2 million.
Under our agreement with Apollo, the maximum consolidated leverage ratio is 3.00x for 2016 and beyond, consistent with our ThirdAmendment to our Amended and Restated Credit Agreement (“Amended Credit Agreement”) . As of December 30, 2016, we were incompliance with this covenant. Management continually assesses its potential future compliance with the consolidated leverage ratio covenantbased on estimates of future earnings and cash flows. If there is an expected possibility on non-compliance, we will discuss possibilities withApollo to modify the covenant consistent with discussions with the Company’s lenders or utilize other means of capitalizing the Company toanticipate or remedy any non-compliance. The expected cash outflows required to fund the project losses discussed in Note 2 – Changes inProject-Related Estimates and the related impact on earnings will put a financial strain on the Company that may require an amendment orother remedies to be pursued by management if certain earnings estimates or cash flow improvement initiatives are not achieved or if requiredto facilitate restructuring plans.
Additionally, the Certificate of Designation for the Series A Preferred Stock prohibits the repurchase by the Company of shares of ourcommon stock in excess of negotiated pre-approved amounts in 2015 and 2016, and in excess of amounts determined by a negotiated formula in2017 and beyond. In 2017, t he Certificate of Designation for the Series A Preferred Stock prohibits the repurchase by the Company of sharesof our common stock in excess of negotiated pre-approved amounts determined by a formula based upon our “Free Cash Flow” or our cash flowfrom operations, minus capital expenditures, for fiscal year 2016. Our Free Cash Flow was negative for the year ended December 30, 2016, andas a result, other than specified exemptions, the Company is prohibited from repurchasing shares of common stock in the internal market,except as legally required, unless it is able to obtain the consent of the holders of at least a majority of the Series A Preferred Stock. OnJanuary 17, 2017, the Company received from the Series A Preferred Stock holder, an acknowledgment and consent permitting the Company tospend up to $25.0 million, in the aggregate, to repurchase shares of common stock in the first trade of 2017. No assurance can be given that inthe future the Company will be able to obtain an acknowledgment and consent from the Series A Preferred Stockholder permitting the Companyto repurchase common stock in the internal market.
Dividends. Dividends on the Series A Preferred Stock are cumulative and accrue quarterly in arrears at the annual rate of 5.0% on thesum of the original issue price of $62.22 per share plus all accumulated and unpaid accruing dividends, regardless of whether or not declared bythe Board. After June 24, 2020 (the “Fifth Anniversary”), the rate at which dividends accrue may increase from 5.0% to 10.0% or 15.0% ifthere was a failure of the stockholders to approve certain other actions to facilitate an initial public offering as well as a failure to approve a saleof the Company.
Dividends accruing on shares of Series A Preferred Stock prior to the Fifth Anniversary are not paid in cash or in kind but are added tothe liquidation preference of the Series A Preferred Stock. After the Fifth Anniversary, dividends shall continue to accrue on
78
Table of Contents
shares of Series A Preferred Stock and will be payable in cash at the election of the Board. However, if after the Fifth Anniversary if there wasa failure of the stockholders to approve certain other actions to facilitate an initial public offering as well as a failure to approve a sale of theCompany, dividends accrued on shares of Series A Preferred Stock will be payable in cash or in kind at the election of the holders of a majorityof the outstanding shares of Series A Preferred Stock. Additionally, if the Company declares certain dividends on the common stock, theCompany is required to declare and pay a dividend on the outstanding shares of Series A Preferred Stock on a pro rata basis with the commonstock, determined on an as-converted basis.
Liquidation Preference. In the event of any liquidation, dissolution or winding up of the Company, whether voluntary or involuntary,or any other transaction deemed a liquidation event pursuant to the Certificate of Designation for the Series A Preferred Stock (including a saleof the Company), each holder of outstanding shares of Series A Preferred Stock will be entitled to be paid out of the assets of the Companyavailable for distribution to stockholders before any payment may be made to the holders of common stock. Each holder would receive anamount equal to the number of outstanding Series A Preferred Stock shares held multiplied by $62.22 plus either accrued and unpaid dividendson such shares or, if the liquidation event occurs before the Fifth Anniversary, an amount equal to all dividends that would have been accruedduring the period from the date of issuance through the Fifth Anniversary, and any other dividends declared on such shares. However, if theamount that the holders of Series A Preferred Stock would have received if all outstanding shares of Series A Preferred Stock had beenconverted into common stock immediately prior to the liquidation event exceeded the amount discussed previously, the holders of Series APreferred Stock will receive the greater amount.
Conversion. Each share of Series A Preferred Stock may be converted at any time at the option of the holder into a number of sharesof common stock as is determined by dividing the original issue price of $62.22 per share by the conversion price which is initially $62.22. Inthe event that after the Fifth Anniversary the Board of Directors recommends to the Company’s stockholders a sale of the company, but theCompany’s stockholders do not approve the recommended sale, then the conversion price would be reduced to $52.65. Additionally, if therewas a failure of the stockholders to approve certain other actions to facilitate an initial public offering of the Company’s common stock as wellas a failure to approve a sale of the Company recommended by the Board of Directors, then the conversion price would be $47.86. Theconversion price is also subject to adjustments on a broad-based, weighted-average basis upon the issuance of shares of common stock orcertain equivalent securities at a price per share less than conversion price of $62.22 or as then adjusted to date.
Mandatory conversion of the Series A Preferred Stock to common stock will occur immediately prior to the closing of any firm-commitment, underwritten public offering of the Company in which the aggregate proceeds to the Company exceed $200.0 million, beforededuction of underwriters’ discounts and commissions, provided that the common stock is then listed on the New York Stock Exchange, itsNYSE MKT or the Nasdaq Stock Market (or any successor exchange) and provided that the Company sells on a primary basis in such offeringat least certain required amounts of shares. All outstanding Series A Preferred Stock, accrued and unpaid dividends accrued on such shares, or,in the event that the public offering occurs before the Fifth Anniversary, dividends that would have accrued during the period from the date ofissuance through the Fifth Anniversary, as well as dividends declared and unpaid would be converted at the effective conversion priceautomatically. Or, all outstanding shares of Series A Preferred Stock, plus accrued and unpaid dividends, and dividends declared and unpaidwill automatically be converted into shares of common stock upon written notice delivered to the Company by the holders of at least a majorityof the then outstanding shares of Series A Preferred Stock.
Voting Rights . Each holder of outstanding shares of Series A Preferred Stock is entitled to vote with the holders of outstanding sharesof common stock, voting together as a single class, with respect to any and all matters presented to the stockholders of the Company. Eachoutstanding share of Series A Preferred Stock is entitled to a number of votes equal to the number of shares of common stock into which it isconvertible .
In addition, the Company may not take certain actions without first having obtained the affirmative vote or waiver of the holders of amajority of the outstanding shares of Series A Preferred Stock. These actions include, among other items, conducting certain liquidation events,entering into new lines of business, entering into agreements for certain acquisitions, joint ventures or investments involving amounts greaterthan $100.0 million and entering into agreements for certain firm, fixed-price or lump-sum design-build or EPC contracts. In addition, amongother things the Company is limited in certain additional amounts it may borrow, additional shares of certain securities that it may issue and theamounts of capital stock it can repurchase in excess of negotiated pre-approved amounts, in each case, without further approval from the holdersof the Series A Preferred Stock.
Redemption. The Company may redeem all the shares of Series A Preferred Stock (and not fewer than all shares of Series A PreferredStock) in one installment commencing at any time on or after June 24, 2018. The aggregate redemption price for the shares of Series APreferred Stock will be equal to the greater of (i) certain guaranteed minimum prices of up to an aggregate of $600.0 million, and (ii) the fairvalue of the shares, as determined by a third-party appraisal, plus accrued and unpaid dividends, and
79

Table of Contents
any other dividends declared and unpaid on such shares. The Series A Preferred Stock is not redeemable upon the election of the holders ofSeries A Preferred Stock.
(4) Variable Interest Entities and Equity Method Investments
We routinely enter into teaming arrangements, in the form of joint ventures, to perform projects for our clients. Such arrangements arecustomary in the engineering and construction industry and generally are project specific. The arrangements facilitate the completion ofprojects that are jointly contracted with our partners. These arrangements are formed to leverage the skills of the respective partners and includeconsulting, construction, design, design-build, program management and operations and maintenance contracts. The assets of a joint ventureare restricted for use only for the particular joint venture and are not available for general operations of the Company. Our risk of loss on thesearrangements is usually shared with our partners. The liability of each partner is usually joint and several, which means that each partner maybecome liable for the entire risk of loss on the project. Furthermore, on some of our projects, CH2M has granted guarantees which mayencumber both our contracting subsidiary company and CH2M for the entire risk of loss on the project.
Our financial statements include the accounts of our joint ventures when the joint ventures are variable interest entities (“VIE”) and weare the primary beneficiary or those joint ventures that are not VIEs yet we have a controlling interest. We perform a qualitative assessment todetermine whether our company is the primary beneficiary once an entity is identified as a VIE. A qualitative assessment begins with anunderstanding of the nature of the risks associated with the entity as well as the nature of the entity’s activities including terms of the contractsentered into by the entity, ownership interests issued by the entity and how they were marketed, and the parties involved in the design of theentity. All of the variable interests held by parties involved with the VIE are identified and a determination is made of which activities are mostsignificant to the economic performance of the entity and which variable interest holder has the power to direct those activities. Most of theVIEs with which our Company is involved have relatively few variable interests and are primarily related to our equity investments,subordinated financial support, and subcontracting arrangements. We consolidate those VIEs in which we have both the power to direct theactivities of the VIE that most significantly impact the VIEs economic performance and the obligation to absorb losses or the right to receive thebenefits from the VIE that could potentially be significant to the VIE. As of December 30, 2016 and December 25, 2015, total assets of VIEsthat were consolidated were $220.3 million and $224.6 million, respectively, and liabilities were $385.9 million and $289.3 million,respectively. Gross revenue of VIEs that were consolidated were $990.9 million, $533.0 million, and $365.9 million for the years endedDecember 30, 2016, December 25, 2015 and December 31, 2014, respectively. These assets and liabilities consist almost entirely of workingcapital accounts associated with the performance of an Australian fixed-price Power EPC project being executed through a consolidated jointventure partnership and an Environment and Nuclear consolidated joint venture consulting project in Canada.
In determining whether we have a controlling interest in a joint venture that is not a VIE and the requirement to consolidate theaccounts of the entity, we consider factors such as ownership interest, board representation, management representation, authority to makedecisions, and contractual and substantive participating rights of the partnership/members.
We held investments in unconsolidated VIEs and equity method investments of $66.3 million and $84.3 million as of December 30,2016 and December 25, 2015, respectively. Our proportionate share of net income or loss as well as gains or losses resulting from changes infair value of equity method investments due to acquisitions and disposals is included as equity in earnings of joint ventures and affiliatedcompanies in the consolidated statements of operations. In general, the equity investment in our unconsolidated affiliates is equal to our currentequity investment plus our portion of the entities’ undistributed earnings. We provide certain services, including engineering, constructionmanagement and computer and telecommunications support, to these unconsolidated entities. These services are billed to the joint ventures inaccordance with the provisions of the agreements.
80

Table of Contents
Summarized financial information for our unconsolidated VIEs and equity method investments as of and for the years ended is asfollows:
December 30, December 25,($ in thousands) 2016 2015Financial Position:
Current assets $ 457,273 $ 569,224Noncurrent assets 21,964 22,333
Total assets $ 479,237 $ 591,557Current liabilities $ 303,502 $ 383,887Noncurrent liabilities 1,353 1,566Partners’/Owners’ equity 174,382 206,104
Total liabilities and equity $ 479,237 $ 591,557CH2M’s share of equity $ 66,329 $ 84,296
December 30, December 25, December 31,($ in thousands) 2016 2015 2014Results of Operations:
Revenue $ 1,683,389 $ 2,382,854 $ 2,514,461Direct costs (1,544,856) (2,177,271) (2,297,607)
Gross margin 138,533 205,583 216,854Selling, general and administrative expenses (44,306) (55,250) (39,981)
Operating income 94,227 150,333 176,873Other loss, net (5,028) (4,620) (3,663)
Net income $ 89,199 $ 145,713 $ 173,210CH2M’s share of net income $ 51,957 $ 46,765 $ 54,918
81

Table of Contents
We have the following significant investments in unconsolidated VIEs and equity method investments companies as of December 30,2016:
% OwnershipDomestic:
AGVIQ - CH2M HILL Joint Venture III/IIIA 49.0 %CH2M/WG Idaho, LLC 50.5 %Coastal Estuary Services LLC 49.9 %MW/CH2M HILL, a Joint Venture (SNWA) 50.0 %National Security Technologies, LLC 10.0 %OMI Beca Ltd. 50.0 %Savannah River Remediation LLC 15.0 %URS/CH2M OAK RIDGE LLC (UCOR) 45.0 %Washington Closure LLC (River Corridor) 30.0 %
Foreign: A-One+ 33.3 %Broadlands Environmental Services 10.0 %CHT JV 50.0 %C2V+ 50.0 %Cavendish Dounreay Partnership LTD 30.0 %CH2M HILL - MACE Joint Venture 51.0 %CH2M HILL-KUNWON PMC 54.0 %CHCJV 50.0 %Consorcio Integrador Rio de Janeiro 48.0 %Consórcio Sondotécnica-Cobrape-CH2M 25.0 %CPG Consultants-CH2M NIP JV 50.0 %Halcrow Hyder 50.0 %HWC Treatment Program Alliance Joint Venture 50.0 %SMNM-VECO JV 50.0 %Sydney Water Corporation-Odour Program Mgmt Alliance 50.0 %Transcend Partners, LTD. 40.0 %
(5) Property, Plant and Equipment
Property, plant and equipment consists of the following as of:
December 30, December 25,($ in thousands) 2016 2015Land $ 5,021 $ 5,021Buildings and land improvements 108,963 67,631Furniture and fixtures 26,126 25,332Computers and office equipment 162,078 158,399Field equipment 130,681 138,721Leasehold improvements 75,492 65,734 508,361 460,838Less: accumulated depreciation (259,929) (257,172)
Net property, plant and equipment $ 248,432 $ 203,666
Depreciation expense, which is reflected within selling, general and administrative expense, totaled $45.3 million, $47.3 million, and$43.1 million for the years ended December 30, 2016, December 25, 2015, and December 31, 2014, respectively.
During the year ended December 30, 2016, we constructed employee housing units for oilfield workers in Alaska to support our oiland gas operations resulting in the addition of approximately $42.9 million to buildings and land improvements.
82

Table of Contents
(6) Receivables
Receivables are stated at net realizable values and consist of receivables billed to clients as well as receivables for which revenue hasbeen earned but has not yet been billed. The U.S. federal government and agencies regulated by the U.S. federal government accounted forapproximately 10% of our net receivables at December 30, 2016 and December 25, 2015, respectively. No other customer exceeded 10% oftotal receivables at December 30, 2016 or December 25, 2015.
The change in the allowance for uncollectible accounts consists of the following for the years ended:
December 30, December 25,($ in thousands) 2016 2015Balance at beginning of year $ 7,432 $ 8,360
Provision charged to expense 5,864 2,013Accounts written off (432) (1,573)Other (877) (1,368)
Balance at end of year $ 11,987 $ 7,432
(7) Acquisitions
On April 4, 2014, we acquired certain agreed upon assets and liabilities of TERA Environmental Consultants (“TERA”) forconsideration of $119.6 million. TERA was an employee-owned environmental consulting firm headquartered in Canada specializing inenvironmental assessment, planning, siting, permitting, licensing, and related services for the pipeline, electrical transmission, and oil and gasindustries. TERA’s operations are reported in the consolidated financial statements within the Environment and Nuclear business group andgenerated approximately $16.8 million of revenue and $3.7 million of operating loss for the year ended December 30, 2016, $69.2 million ofrevenue and $9.2 million of operating income for the year ended December 25, 2015, and approximately $84.6 million of revenue and$10.6 million of operating income for the year ended December 31, 2014.
On September 6, 2016, we acquired a controlling interest in one of our joint ventures for consideration of $6.3 million, $2.1 million net
of cash acquired, resulting in a gain of $15.0 million on the fair value remeasurement of the original equity method investment recorded inequity in earnings of joint ventures and affiliated companies and $31.3 million of goodwill.
(8) Goodwill and Intangible Assets
Our annual goodwill impairment test is conducted as of the first day of the fourth quarter of each year. There were no triggeringevents during the year ended December 30, 2016 that would require us to initiate a goodwill impairment test at a date other than the annualimpairment testing date. We identified nine reporting units relevant to our annual impairment review. In selecting these reporting units, weconsidered (i) whether an operating segment or a component of an operating segment is a business, (ii) whether discrete financial information isavailable, (iii) whether the financial information is regularly reviewed by management of the operating segment, and (iv) how the operations aremanaged or how an acquired entity is integrated in the business operations. Based upon this evaluation, we determined that we have thefollowing reporting units:
· Environmental (Environment and Nuclear segment)· Government Facilities and Infrastructure (Environment and Nuclear segment)· Industrial and Advanced Technology (Energy and Industrial segment)· Nuclear (Environment and Nuclear segment)· Oil, Gas and Chemicals (Energy and Industrial segment)· Power EPC (Power EPC segment)· Transportation (Transportation segment)· Urban Environments and Sports (Water segment)· Water (Water segment)
After completing step one of the annual impairment test, we determined that the carrying value of each reporting unit did not exceedits respective fair value; therefore, the second step of the impairment test was unnecessary. As a result, no impairment charge was recorded forthe year ended December 30, 2016. No impairment of identifiable intangibles was incurred in the year ended December 30, 2016.
83
Table of Contents
For the year ended December 31, 2014, we recorded a goodwill impairment charge of $64.2 million, of which $36.4 million related toour Power EPC reporting unit and $27.8 million related to our Industrial and Advanced Technology and Urban Environments and Sportsreporting units. Additionally, for the year ended December 31, 2014 we identified an impairment in our tradename intangibles of $9.1 millionrelated to our Power EPC reporting unit.
The following table presents the changes in goodwill by segment, excluding segments to which no goodwill is associated, during theyears ended December 30, 2016 and December 25, 2015:
($ in thousands) Energy andIndustrial
Environment andNuclear Transportation Water
ConsolidatedTotal
Balance as of December 31, 2014 $ 93,242 $ 73,186 $ 293,149 $ 74,398 $ 533,975Foreign currency translation - (8,422) (11,629) (2,939) (22,990)
Balance as of December 25, 2015 $ 93,242 $ 64,764 $ 281,520 $ 71,459 $ 510,985Acquisitions 5,003 - 2,814 23,449 31,266Foreign currency translation (341) (3,898) (46,867) (13,393) (64,499)
Balance as of December 30, 2016 $ 97,904 $ 60,866 $ 237,467 $ 81,515 $ 477,752
The following table presents the changes in intangible assets by segments, excluding segments to which no intangible assets areassociated, for the years ended December 30, 2016 and December 25, 2015:
($ in thousands) Environment and
Nuclear Transportation Water Consolidated
TotalBalance as of December 31, 2014 $ 42,353 $ 38,300 $ 10,726 $ 91,379
Amortization (6,383) (14,492) (4,200) (25,075)Foreign currency translation (5,874) (1,077) (342) (7,293)
Balance as of December 25, 2015 $ 30,096 $ 22,731 $ 6,184 $ 59,011Amortization (4,589) (10,598) (2,965) (18,152)Foreign currency translation 489 (2,523) (801) (2,835)
Balance as of December 30, 2016 $ 25,996 $ 9,610 $ 2,418 $ 38,024
Intangible assets with finite lives consist of the following:
Accumulated Net finite ‑‑lived($ in thousands) Cost Amortization intangible assetsDecember 30, 2016 Customer relationships 172,880 (134,856) 38,024
Total finite-lived intangible assets $ 172,880 $ (134,856) $ 38,024December 25, 2015 Customer relationships 187,580 (128,655) 58,925Tradename 4,499 (4,413) 86
Total finite-lived intangible assets $ 192,079 $ (133,068) $ 59,011
All intangible assets are being amortized over their expected lives of between two and ten years. Amortization expense is reflected inselling, general and administrative expense and totaled $18.2 million, $25.1 million and $46.2 million for the years ended December 30, 2016,December 25, 2015 and December 31, 2014, respectively. All intangible assets are expected to be fully amortized in 2024.
84
Table of Contents
At December 30, 2016, the future estimated amortization expense related to these intangible assets is:
Amortization($ in thousands) Expense2017 $ 15,5432018 4,1982019 3,4652020 3,4652021 3,465Thereafter 7,888 $ 38,024
(9) Fair Value of Financial Instruments
Cash and cash equivalents, client accounts receivable, unbilled revenue, accounts payable and accrued subcontractor costs and billingsin excess of revenue are carried at cost, which approximates fair value due to their short maturities. Fair value of long‑term debt, including thecurrent portion, is estimated based on Level 2 inputs, except the amount outstanding on the revolving credit facility for which the carrying valueapproximates fair value. Fair value is determined by discounting future cash flows using interest rates available for issues with similar termsand average maturities. The estimated fair values of our financial instruments where carrying values do not approximate fair value are asfollows for the years ended December 30, 2016 and December 25, 2015:
2016 2015($ in thousands) Carrying Amount Fair Value Carrying Amount Fair ValueEquipment financing $ 8,152 $ 7,662 $ 8,594 $ 8,056Note payable by consolidated joint venture $ 2,483 $ 2,284 $ — $ —
We primarily enter into derivative financial instruments to mitigate exposures to changing foreign currency exchange rates. Thesecurrency derivative instruments are carried on the balance sheet at fair value and are typically based upon Level 2 inputs including third partyquotes. At December 30, 2016 and December 25, 2015, we had forward foreign exchange contracts on world currencies with varying durations,none of which extend beyond one year. We had $1.2 million of derivative liabilities for the year ended December 30, 2016 and an insignificantamount of derivative assets as of December 25, 2015.
The unrealized and realized gains and losses due to changes in derivative fair values included in selling, general and administrativeexpense are as follows:
For The Years Ended December 30, December 25, December 31,(in thousands) 2016 2015 2014Unrealized loss (gain) from changes in derivative fair values $ 1,062 $ 129 $ (142)Realized loss (gain) from changes in derivative fair values $ 6,000 $ 8,009 $ (2,740)
(10) Revolving Credit Facility and Long‑‑Term Debt
On September 30, 2016, we entered into a Third Amendment to our Amended and Restated Credit Agreement (“Amended CreditAgreement”), to provide us with additional financial and operational flexibility, particularly by modifying the definition of consolidatedadjusted EBITDA to allow for the exclusion of expected cash restructuring charges and cash payments on the project losses attributable toongoing fixed-price contacts for purposes of determining the consolidated leverage ratio, which remained at 3.00x for 2016 and beyond. Inaddition, the Amended Credit Agreement lowered our maximum available revolving credit facility to $925.0 million from $1.1 billion. Thecredit facility matures on March 28, 2019 and includes a subfacility for the issuance of standby letters of credit in a face amount up to$500.0 million, a subfacility up to $300.0 million for multicurrency borrowings, and a subfacility of up to $50.0 million for swinglineloans. Under the terms of the Amended Credit Agreement, we may be able to invite existing and new lenders to increase the amount availableto be borrowed by up to $200.0 million. Other technical and operating changes to the Amended Credit Agreement specifically achieved thefollowing:
· Increased the margins used to determine the interest rates of revolving loans under the Amended Credit Agreement and thecommitment fees payable by CH2M;
85
Table of Contents
· Limited the amount CH2M may spend to repurchase its common stock in connection with its employee stock ownership programup to $75.0 million during the three quarter period ending March 31, 2017 and, thereafter, up to $100.0 million during a rollingfour quarter period less the amount of any legally required repurchases of common stock held in benefit plans;
· Limited CH2M’s ability to pay cash dividends on preferred stock until no more than 10% of our consolidated adjusted EBITDAconsists of the cash and non-cash charges related to restructuring charges and project costs and losses in any rolling four quarterperiod and subject to minimum pro forma leverage ratio;
· Disallows the use of proceeds from asset sales to repurchase common or preferred stock; and,· Granted security interests to the lenders in substantially all of the assets of CH2M and CH2M’s subsidiaries, subject to certain
carve-outs. The Amended Credit Agreement contains customary representations, warranties and conditions to borrowing including customary
affirmative and negative covenants, which include covenants that limit or restrict our ability to incur indebtedness and other obligations, grantliens to secure their obligations, make investments, merge or consolidate, and dispose of assets outside the ordinary course of business, in eachcase subject to customary exceptions for credit facilities of this size and type.
On November 23, 2016, December 28, 2016 and January 10, 2017, we received from the lenders under the Amended Credit
Agreement consents permitting our delayed compliance with respect to the certifications to the lenders relating to our unaudited consolidatedfinancial statements as of and for the quarters ended June 26, 2015, September 25, 2015 and December 25, 2015 and confirming that adetermination that a material weakness exists in our internal controls over financial accounting would not constitute a default under the terms ofthe Amended Credit Agreement. The consents ensured that no event of default existed under the Amended Credit Agreement as a result of therestatement, and we could request the issuance of new loan advances and letters of credit under the Amended Credit Agreement in accordancewith its terms.
As of December 30, 2016, we were in compliance with the covenants required by the Amended Credit Agreement. Management
continually assesses its potential future compliance with the Amended Credit Agreement covenants based upon estimates of future earnings andcash flows. If there is an expected possibility of non-compliance, we will discuss possibilities with the Company’s lenders or utilize othermeans of capitalizing the Company to anticipate or remedy any non-compliance. The expected cash outflows required to fund the project lossesdiscussed in Note 2 – Changes in Project-Related Estimates and the related impact on earnings will put a financial strain on the Company thatmay require an amendment or other remedies to be pursued by management if certain earnings estimates or cash flow improvement initiativesare not achieved or if required to facilitate restructuring plans.
There were $487.0 million and $292.8 million in borrowings outstanding on the credit facility for the years ended December 30, 2016
and December 25, 2015, respectively. The average rate of interest charged on that balance was 3.73% as of December 30, 2016. The company-wide issued and outstanding letters of credit and bank guarantee facilities were $134.2 million and $145.5 million for the years ended December30, 2016 and December 25, 2015, respectively. The remaining unused borrowing capacity under the credit facility was approximately $107.4million as of December 30, 2016.
86
Table of Contents
Our nonrecourse and other long‑term debt consist of the following for the years ended:
December 30, December 25,($ in thousands) 2016 2015Revolving credit facility, average rate of interest of 3.73% $ 487,009 $ 292,783Equipment financing, due in monthly installments to September 2021, secured by equipment. These notesbear interest ranging from 0.22% to 3.29% 8,152 8,594Note payable by consolidated joint venture, due July 2019. This note bears interest at 6-month LIBOR plus2.5% 2,483 —Other notes payable 230 285
Total debt $ 497,874 $ 301,662Less: current portion of debt 2,242 2,069
Total long-term portion of debt $ 495,632 $ 299,593
At December 30, 2016, future principal payments on long‑term debt for each year ending are as follows:
($ in thousands) PrincipalPayments
2017 $ 2,2422018 2,2322019 491,2432020 1,5982021 559Thereafter —
Total future principal payments $ 497,874
(11) Operating Lease Obligations
We have entered into certain noncancellable leases, which are being accounted for as operating leases. At December 30, 2016, futureminimum lease payments, without consideration of sublease income, for each year ending are as follows:
($ in thousands) Lease
Payments2017 $ 82,2422018 73,0892019 61,9312020 50,0952021 42,437Thereafter 230,802
Total future minimum lease payments $ 540,596
Rental expense charged to operations, net of sublease income, was $95.5 million, $118.1 million, and $121.1 million for the yearsended December 30, 2016, December 25, 2015 and December 31, 2014, respectively. Rental expense included amortization of deferred gains,primarily related to the sale-leaseback of our corporate offices, of $1.4 million, $3.9 millon and $4.3 million for the years ended December 30,2016, December 25, 2015 and December 31, 2014, respectively. Certain of our operating leases contain provisions for a specific rent‑freeperiod and escalation clauses. We accrue rental expense during the rent‑free period based on total expected rental payments to be made overthe life of the related lease.
87
Table of Contents
(12) Income Taxes
Income before provision for income taxes for the years ended December 30, 2016, December 25, 2015 and December 31, 2014consists of the following:
($ in thousands) 2016 2015 2014U.S. (loss) income $ (43,917) $ 79,058 $ (161,951)Foreign income (72,534) 29,729 (56,792)
Income before taxes $ (116,451) $ 108,787 $ (218,743)
The provision for income taxes for the years ended December 30, 2016, December 25, 2015 and December 31, 2014 consists of thefollowing:
($ in thousands) 2016 2015 2014Current income tax (benefit) expense:
Federal $ 19,668 $ 5,138 $ 17,660Foreign 16,975 15,356 14,318State and local (440) 8,076 (1,801)
Total current income tax expense 36,203 28,570 30,177Deferred income tax (benefit) expense:
Federal (82,726) 7,864 (52,852)Foreign (76,665) (7,138) (10,271)State (8,301) (912) (4,260)
Total deferred income tax benefit (167,692) (186) (67,383)Total income tax (benefit) expense $ (131,489) $ 28,384 $ (37,206)
The reconciliations of income tax computed at the U.S. federal statutory tax rate to our effective income tax rate for the years endedDecember 30, 2016, December 25, 2015 and December 31, 2014 are as follows:
($ in thousands) 2016 2015 2014Pretax (loss) income $ (116,451) $ 108,787 $ (218,743)Federal statutory rate 35% 35% 35%
Expected tax (benefit) expense (40,758) 38,075 (76,560)Reconciling items:
State income taxes, net of federal benefit (5,024) 5,000 (11,498)Compensation (5,431) — —Non-deductible goodwill impairment — — 8,881Non-taxable reversal of purchase accounting accrual — — (5,459)Tax effect of noncontrolling interests (1,544) (3,205) (1,557)Permanent expenses 14,611 27,138 16,221Foreign tax rate differential (13,978) (10,636) 10,765Tax credits 880 (8,281) (19,278)Change in valuation allowance (89,689) 3,146 35,993Change in uncertain tax positions 4,698 (23,434) 16,550Other 4,746 581 (11,264)
(Benefit) provision for income taxes $ (131,489) $ 28,384 $ (37,206)
88

Table of Contents
The tax effects of temporary differences that give rise to significant portions of the deferred tax assets and liabilities at December 30,2016 and December 25, 2015 are as follows:
($ in thousands) 2016 2015Deferred tax assets:
Net operating loss carryforwards $ 102,917 $ 121,599Deferred gain, insurance and other 93,809 62,684Credit carryovers 76,916 71,458Accrued employee benefits 174,717 239,677
Total deferred tax assets 448,359 495,418Valuation allowance (46,044) (210,391)
Net deferred tax assets 402,315 285,027Deferred tax liabilities:
Investments in affiliates (10,025) (6,882)Depreciation and amortization (29,039) (22,760)
Net deferred tax liabilities (39,064) (29,642)Net deferred tax assets $ 363,251 $ 255,385
The effective tax rate for the year ended December 30, 2016 was a benefit of 112.9% compared to an expense of 26.1% for the sameperiod in the prior year. The effective tax rate in 2016 is higher compared to the same period in the prior years primarily due to the favorableimpacts associated with the remeasurement related to an acquisition of a controlling interest, the release of the valuation allowances related tothe Halcrow Group Limited pension, as discussed below, and the release of the valuation allowances related to foreign net operating losses dueto the implementation of a new transfer pricing policy. Recent discussions regarding tax reform may result in changes to long-standing taxprinciples which could adversely affect our effective tax rate or result in higher cash tax liabilities. These discussions include a reducedcorporate tax rate, repatriation of foreign earnings, cash, and cash equivalents, and cross border adjustability. Our effective tax rate continues tobe negatively impacted by the effects of state income taxes, non-deductible foreign net operating losses, and the disallowed portions of mealsand entertainment expenses.
CH2M is required to record all deferred tax assets or liabilities for temporary differences, net operating loss carryforwards, and taxcredit carryforwards. A deferred tax asset valuation allowance is established when it is more likely than not that all or some portion of thedeferred tax assets will not be realized in future periods. As of December 30, 2016 and December 25, 2015, we reported a valuation allowanceof $46.0 million and $210.4 million, respectively, related primarily to the reserve of certain foreign net loss carryforwards and the foreign taxcredit carryforward. The decrease in valuation allowance is primarily related to the restructure of the Halcrow Pension Scheme, as discussedbelow, and the implementation of the new transfer pricing policy. As of December 30, 2016, the Company had U.S. federal net operating losscarryforwards of approximately $243.0 million, state net operating loss carryforwards of $228.0 million, and foreign net operating losses of$102.0 million to reduce future taxable income. These net operating losses can be carried forward for varying terms between three years and anunlimited carryforward. There is $69.3 million of foreign tax credit available for carryforward through the years 2018-2026.
Halcrow Group Limited (“HGL”), a subsidiary of CH2M, has substantial deferred tax assets, primarily related to the Halcrow PensionScheme (“HPS”), a defined benefit plan sponsored by HGL. These deferred tax assets represented future deductions available to HGL. WhenHGL was acquired in 2011, it was determined a full valuation allowance was required on these assets as there was uncertainty regarding theability to realize these assets in the future. On October 4, 2016, HGL effected a transaction to restructure the Halcrow Pension Scheme. As aresult of the transaction, our overall pension liability and related future funding obligations were reduced. For additional information regardingthe Halcrow Pension Scheme and changes to the defined benefit plan effective October 4, 2016, refer to Note 16 – Employee Retirement Plans. Consequently, we believe that the deferred tax assets of HGL will now more likely than not be realized, and therefore, valuation allowancehas been removed. This generated a benefit of approximately $65.0 million in the year ended December 30, 2016.
During the year ended December 30, 2016, the Company elected to early adopt ASU 2016-09 with an effective date of December 26,2015. Accordingly, the Company recognized $3.9 million of tax benefit. This in addition to the previously unrecognized excess tax benefits of$11.1 million, which resulted in a cumulative-effect adjustment to retained earnings.
Undistributed earnings of our foreign subsidiaries totaled approximately $432.3 million at December 30, 2016. These earnings areconsidered to be permanently reinvested. Accordingly, no provision for U.S. federal and state income taxes or foreign withholding taxes hasbeen made. Determining the tax liability that would arise if these earnings were repatriated is not practical. At December 30, 2016, CH2M hasrecognized a deferred tax liability of $3.1 million within investments in unconsolidated
89

Table of Contents
unconsolidated affiliates related to foreign subsidiaries where no permanent reinvestment assertion exists. Cash held in international accounts atDecember 30, 2016 and December 25, 2015 was $108.7 million and $152.0 million, respectively.
As of December 30, 2016 and December 25, 2015, we had $8.0 million and $38.5 million, respectively, recorded as a liability foruncertain tax positions and accrued interest. We recognize interest and penalties related to uncertain tax positions in income tax expense. As ofDecember 30, 2016 and December 25, 2015, we had approximately $2.6 million and $3.0 million, respectively, of accrued interest and penaltiesrelated to uncertain tax positions.
A reconciliation of the beginning and ending amount of uncertain tax positions as of December 30, 2016 and December 25, 2015 is asfollows (in thousands):
Balance at December 31, 2014 $ 48,561Additions for current year tax positions 30,363Additions for prior year tax positions 2,797Reductions for prior year tax positions (1,131)Reductions as a result of settlement with tax authority (19,862)Reductions as a result of lapse of applicable statue of expirations (1,486)
Balance at December 25, 2015 $ 59,242Additions for current year tax positions 23,888Additions for prior year tax positions 8,248Reductions for prior year tax positions (12,111)Reductions as a result of settlement with tax authority (2,136)Reductions as a result of lapse of applicable statue of expirations (283)
Balance at December 30, 2016 $ 76,848
If recognized, $38.1 million of the uncertain tax positions would affect the effective tax rate. We do not anticipate any significantchanges to the uncertain tax positions in the next twelve months.
We file income tax returns in the U.S. federal jurisdiction and various state and foreign jurisdictions. In the normal course of business,we are subject to examination by taxing authorities throughout the world, including such major jurisdictions as the U.S., Canada, and the UnitedKingdom. With few exceptions, we are no longer subject to U.S. federal, state and local, or non‑U.S. income tax examinations by taxauthorities in major tax jurisdictions for years before 2008.
(13) Earnings Per Share
Basic earnings per share (“EPS”) is calculated using the weighted-average number of common shares outstanding during the periodand income available to common stockholders, which is calculated by deducting the dividends accumulated for the period on cumulativepreferred stock (whether or not earned) and income allocated to preferred stockholders as calculated under the two-class method. In the eventthe Company has a net loss, the net loss is not allocated to preferred stockholders as the holders do not have a contractual obligation to share inthe Company’s losses. The Company considers all of the Series A Preferred Stock to be participating securities as the holders of the preferredstock are entitled contractually to receive a cumulative dividend.
Diluted EPS under the two-class method is computed by giving effect to all potential shares of common stock including common stockissuable upon conversion of the convertible preferred stock, the related convertible dividends for the aggregate five year contractual obligation,and stock options. The denominator is calculated by using the weighted-average number of common shares and common stock equivalentsoutstanding during the period, assuming conversion at the beginning of the period or at the time of issuance if later. Additionally, whencalculating diluted EPS, the Company analyzes the potential dilutive effect of the outstanding preferred stock under the if-converted method, inwhich it is assumed that the outstanding preferred stock convert to common stock at the beginning of the period. In the event that the if-converted method is more dilutive than the two-class method, the if-converted diluted EPS will be reflected in our financialstatements. Common stock equivalents are only included in the diluted EPS calculation when their effect is dilutive.
The table below presents the reconciliations of basic and diluted EPS for the years ended December 30, 2016, December 25, 2015, andDecember 31, 2014. The reconciliation of basic and diluted EPS for the year ended December 31, 2014 has been restated to conform to thetwo-class method and presentation as shown below:
90
Table of Contents
December 30, December 25, December 31,($ in thousands, except per share amounts) 2016 2015 2014Numerator - basic and diluted:
Net (loss) income $ (124,254) $ 92,117 $ (318,602)Less: loss (income) attributable to noncontrolling interests 139,292 (11,714) 137,065
Net income (loss) attributable to CH2M 15,038 80,403 (181,537)Less: accrued dividends attributable to preferred stockholders 14,006 5,088 —Less: income allocated to preferred stockholders 152 4,279 —
Income (loss) available to common stockholders - basic and diluted $ 880 $ 71,036 $ (181,537)
Denominators: Weighted-average common shares outstanding - basic 25,648 27,119 28,257Dilutive effect of common stock equivalents 84 62 —
Diluted adjusted weighted-average common shares outstanding, assuming conversion ofcommon stock equivalents 25,732 27,181 28,257
Basic net income (loss) per common share $ 0.03 $ 2.62 $ (6.42)Diluted net income (loss) per common share $ 0.03 $ 2.61 $ (6.42)
For the years ended December 30, 2016 and December 25, 2015, options to purchase 1.9 million and 0.1 million shares of commonstock, respectively, and 5.1 million and 3.3 million shares of preferred stock and accumulated preferred stock dividends, respectively, wereexcluded from the dilutive EPS calculation because including them would have been antidilutive.
(14) Restructuring and Related Charges
2016 Restructuring Plan. During the third quarter of 2016, the Company began a process to review the structure and resources withinits business segments and formulate a restructuring plan to more fully align global operations with the Company’s client-centric strategy,including a simplified organization structure and streamlined delivery model to achieve higher levels of profitable growth (“2016 RestructuringPlan”). The anticipated restructuring activities include such items as workforce reductions and facilities consolidations. During the year endedDecember 30, 2016, we incurred $42.2 million of costs for these restructuring activities related to the 2016 Restructuring Plan, which have beenincluded in selling, general and administration expense on the consolidated statements of operations. Overall, we expect to incur up toapproximately $50.0 million to $70.0 million in total restructuring charges under the 2016 Restructuring Plan, primarily related to employeeseverance and termination benefits and facilities consolidation costs. We expect the 2016 Restructuring Plan to be completed in the first half of2017 and to result in aggregate annual cost savings of approximately $100.0 million.
2014 Restructuring Plan. In September 2014, the Company commenced certain restructuring activities in order to achieve importantbusiness objectives, including reducing overhead costs, improving efficiency, and reducing risk (“2014 Restructuring Plan”). Theserestructuring activities, which continued into 2015, included such items as a voluntary retirement program, workforce reductions, facilitiesconsolidations and closures, and evaluation of certain lines of business. For the years ended December 25, 2015 and December 31, 2014, weincurred $60.6 million and $70.4 million, respectively, of costs for these restructuring activities which have been included in selling, generaland administration expense on the consolidated statements of operations.. The restructuring activities under the 2014 Restructuring Plan weresubstantially complete as of December 25, 2015.
Overall, as of December 30, 2016, we have incurred aggregated costs of $173.2 million for restructuring activities related to the 2014Restructuring Plan and the 2016 Restructuring Plan.
91
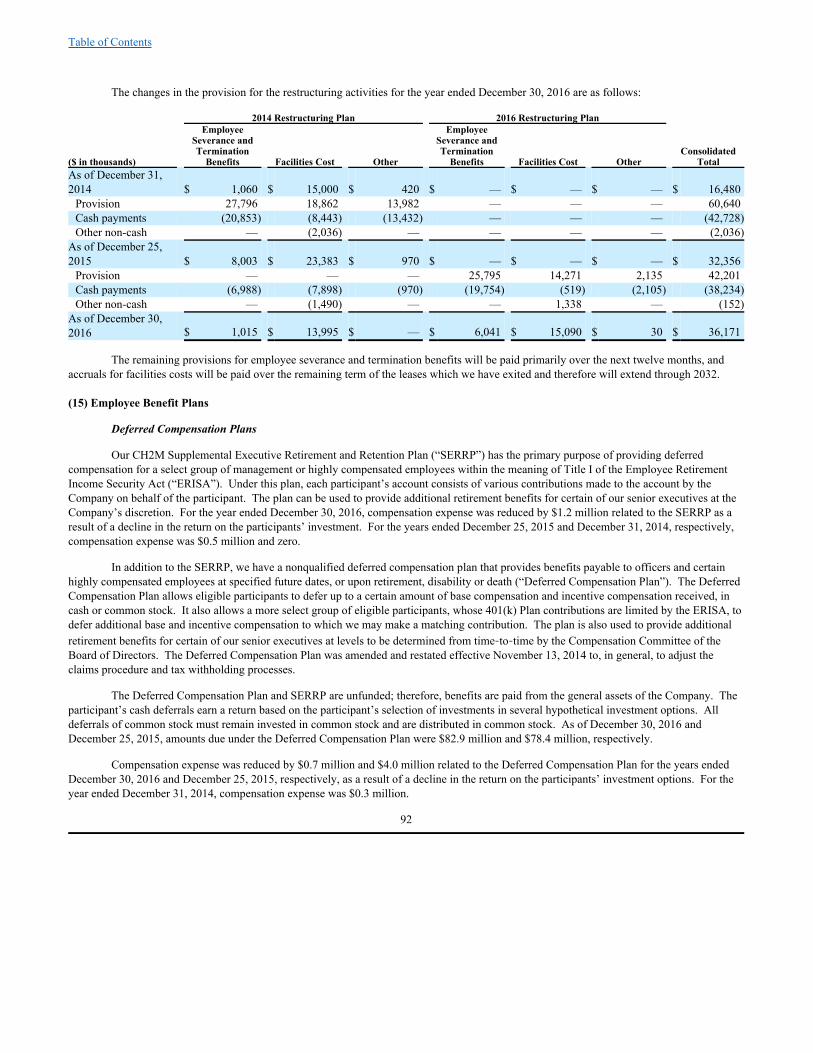
Table of Contents
The changes in the provision for the restructuring activities for the year ended December 30, 2016 are as follows:
2014 Restructuring Plan 2016 Restructuring Plan
($ in thousands)
EmployeeSeverance andTerminationBenefits Facilities Cost Other
EmployeeSeverance andTerminationBenefits Facilities Cost Other
ConsolidatedTotal
As of December 31,2014 $ 1,060 $ 15,000 $ 420 $ — $ — $ — $ 16,480
Provision 27,796 18,862 13,982 — — — 60,640Cash payments (20,853) (8,443) (13,432) — — — (42,728)Other non-cash — (2,036) — — — — (2,036)
As of December 25,2015 $ 8,003 $ 23,383 $ 970 $ — $ — $ — $ 32,356
Provision — — — 25,795 14,271 2,135 42,201Cash payments (6,988) (7,898) (970) (19,754) (519) (2,105) (38,234)Other non-cash — (1,490) — — 1,338 — (152)
As of December 30,2016 $ 1,015 $ 13,995 $ — $ 6,041 $ 15,090 $ 30 $ 36,171
The remaining provisions for employee severance and termination benefits will be paid primarily over the next twelve months, andaccruals for facilities costs will be paid over the remaining term of the leases which we have exited and therefore will extend through 2032.
(15) Employee Benefit Plans
Deferred Compensation Plans
Our CH2M Supplemental Executive Retirement and Retention Plan (“SERRP”) has the primary purpose of providing deferredcompensation for a select group of management or highly compensated employees within the meaning of Title I of the Employee RetirementIncome Security Act (“ERISA”). Under this plan, each participant’s account consists of various contributions made to the account by theCompany on behalf of the participant. The plan can be used to provide additional retirement benefits for certain of our senior executives at theCompany’s discretion. For the year ended December 30, 2016, compensation expense was reduced by $1.2 million related to the SERRP as aresult of a decline in the return on the participants’ investment. For the years ended December 25, 2015 and December 31, 2014, respectively,compensation expense was $0.5 million and zero.
In addition to the SERRP, we have a nonqualified deferred compensation plan that provides benefits payable to officers and certainhighly compensated employees at specified future dates, or upon retirement, disability or death (“Deferred Compensation Plan”). The DeferredCompensation Plan allows eligible participants to defer up to a certain amount of base compensation and incentive compensation received, incash or common stock. It also allows a more select group of eligible participants, whose 401(k) Plan contributions are limited by the ERISA, todefer additional base and incentive compensation to which we may make a matching contribution. The plan is also used to provide additionalretirement benefits for certain of our senior executives at levels to be determined from time‑to‑time by the Compensation Committee of theBoard of Directors. The Deferred Compensation Plan was amended and restated effective November 13, 2014 to, in general, to adjust theclaims procedure and tax withholding processes.
The Deferred Compensation Plan and SERRP are unfunded; therefore, benefits are paid from the general assets of the Company. Theparticipant’s cash deferrals earn a return based on the participant’s selection of investments in several hypothetical investment options. Alldeferrals of common stock must remain invested in common stock and are distributed in common stock. As of December 30, 2016 andDecember 25, 2015, amounts due under the Deferred Compensation Plan were $82.9 million and $78.4 million, respectively.
Compensation expense was reduced by $0.7 million and $4.0 million related to the Deferred Compensation Plan for the years endedDecember 30, 2016 and December 25, 2015, respectively, as a result of a decline in the return on the participants’ investment options. For theyear ended December 31, 2014, compensation expense was $0.3 million.
92

$$$$$$$
$ $
$ $
Table of Contents
Stock Option Plans
In 2009, the Board of Directors and stockholders approved the CH2M HILL Companies, Ltd. 2009 Stock Option Plan (“2009 StockOption Plan”) which reserved 3,000,000 shares of our common stock for issuance upon exercise of stock options granted. Effective May 7,2012, the 2009 Stock Option Plan was amended and restated to increase the number of reserved shares to 5,500,000. All options outstandingunder the previously cancelled plans (“1999 and 2004 Stock Option Plans”), that expired or for any other reason cease to be exercisable, wererolled into the 2009 Stock Option Plan and are available for grant in addition to the 5,500,000 options reserved.
Stock options are granted at an exercise price equal to the fair market value of our common stock at the date of grant. Stock optionsgranted generally become exercisable 25%, 25% and 50% after one, two and three years, respectively, and have a term of five years from thedate of grant. The following table summarizes the activity relating to the 2009 Stock Option Plan during 2016:
Number WeightedAverage
Stock Options: of Shares Exercise PriceOutstanding at December 25, 2015 2,205,246 55.92
Granted 888,913 62.75Exercised (307,746) 51.51Forfeited (193,964) 59.14Expired (195,375) 54.06
Outstanding at December 30, 2016 2,397,074 58.90Exercisable at December 30, 2016 1,001,894 57.52Available for future grants 1,810,235
The following table summarizes stock options outstanding and stock options vested and exercisable as of December 30, 2016 andDecember 25, 2015:
2016 2015Stock options outstanding:
Aggregate intrinsic value (thousands) 939 26,462 Weighted average contractual term (years) 2.8 2.6
Stock options vested and exercisable: Aggregate intrinsic value (thousands) 262 13,486 Weighted average contractual term (years) 1.5 1.4
We received $2.3 million, $1.8 million, and $5.0 million from options exercised during the years ended December 30, 2016,December 25, 2015 and December 31, 2014, respectively. Our stock option plan also allows participants to satisfy the exercise price andparticipant tax withholding obligation by tendering shares of company stock that have been owned by the participants for at least six months.The intrinsic value associated with exercises was $3.4 million, $2.1 million, and $9.9 million during the years ended December 30, 2016,December 25, 2015 and December 31, 2014, respectively.
We measure the fair value of each stock option grant at the date of grant using a Black‑Scholes option pricing model. The weightedaverage grant date fair value of options granted during the years ended December 30, 2016 and December 25, 2015 was $11.18 and $8.40,respectively. The following assumptions were used in determining the fair value of options granted during 2016 and 2015:
2016 2015Risk-free interest rate 0.97 % 1.36 % Expected dividend yield — % — % Expected option life 4.2 Years 4.2 YearsExpected stock price volatility 19.9 % 17.3 %
We estimate the expected term of options granted based on historical experience of employee exercise behavior. We estimate thevolatility of our common stock by using the weighted‑average of historical volatility over the same period as the option term. We use theTreasury Yield Curve rates for the risk‑free interest rate in the option valuation model with maturities similar to the expected term of theoptions. We do not anticipate paying any cash dividends on our common stock in the foreseeable future and therefore use an expected dividendyield of zero in the option valuation model. We are required to estimate forfeitures at the time of grant and revise
93
Table of Contents
those estimates in subsequent periods if actual forfeitures differ from those estimates. We use historical data to estimate pre‑vesting optionforfeitures and record stock‑ based compensation expense only for those awards that are expected to vest. All stock‑based payment awards areamortized on a straight‑line basis over the requisite service periods of the awards.
The total compensation expense recognized for stock options granted for the years ended December 30, 2016, December 25, 2015 andDecember 31, 2014 was $5.0 million, $3.7 million, and $3.5 million, respectively. The remaining unrecognized compensation expense relatedto nonvested awards as of December 30, 2016 is $8.7 million. We expect to recognize this compensation expense over the weighted averageremaining recognition period of 1.7 years, subject to forfeitures that may occur during that period.
Payroll Deduction Stock Purchase Plan
Our Payroll Deduction Stock Purchase Plan (“PDSPP”) provides for the purchase of common stock at 90% of the market value as ofthe date of purchase through payroll deductions by participating employees. Eligible employees may purchase common stock totaling up to15% of an employee’s compensation through payroll deductions. An employee cannot purchase more than $25,000 of common stock under thePDSPP in any calendar year. The PDSPP is intended to qualify under Section 423 of the Internal Revenue Code (“IRC”). The PDSPP is notintended to qualify under Section 401(a) of the IRC and is not subject to ERISA. The PDSPP is non‑compensatory since the plan is available toall eligible stockholders and incorporates no option features such as a look‑back period. Accordingly, no compensation expense is recognizedin the financial statements for the PDSPP. During the years ended December 30, 2016, and December 25, 2015 and December 31, 2014, a totalof 188,862 shares, 297,390 shares, and 415,557 shares, respectively, were issued under the PDSPP, for total proceeds of $10.0 million,$14.7 million, and $22.4 million, respectively.
Phantom Stock Plan
Our Phantom Stock Plan provides eligible individuals with added incentives to continue in the long‑term service of ourcompany. Eligible individuals are generally individuals who are not residents of the U.S. Phantom stock grants are 100% vested on the grantdate and may be redeemed after six months from the grant date. The value of phantom stock is equal to the market value of our commonstock. All amounts granted under the Phantom Stock Plan are payable in cash only. Compensation expense under this plan is based on thevalue of the units on the date of grant.
During the years ended December 30, 2016 and December 25, 2015, respectively, 387 units and 1,112 units were granted under thePhantom Stock Plan. No units were granted under the Phantom Stock Plan during the years ended December 31, 2014. The average fair valueof the units granted under the Phantom Stock Plan during 2016 was $62.89. Compensation expense was reduced by $0.3 million related to thePhantom Stock Plan for the year ended December 30, 2016 as a result of a decline in the market value of our common stock in 2016.Compensation expense was $0.4 million for the year ended December 25, 2015 and zero for each year ended December 31, 2014.
The following table summarizes the activity relating to the Phantom Stock Plan during 2016:
Number of UnitsBalance at December 25, 2015 17,508
Granted 387Exercised (46)Forfeited (297)
Balance at December 30, 2016 17,552
Stock Appreciation Rights Plan
In February 1999, we established the Stock Appreciation Rights (“SARs”) Plan. Eligible individuals are generally individuals who arenot residents of the U.S. SARs are granted at an exercise price equal to the market value of our common stock and generally becomeexercisable 25%, 25% and 50% after one, two and three years, respectively, and have a term of five years from the date of the grant. Allamounts granted under the SARs Plan are payable in cash only. Compensation expense under this plan is based on the vesting provisions andthe market value of our common stock. Compensation expense was reduced by $0.2 million related to the SARs Plan during the year endedDecember 30, 2016 as a result of a decline in the market value of our common stock in 2016. Compensation expense for the years endedDecember 25, 2015 and December 31, 2014 was $0.3 million and zero, respectively.
94
$$$$$
$$$$$
Table of Contents
The following table summarizes the activity relating to the SARs Plan during 2016:
Number Weighted Average of Rights Exercise PriceBalance at December 25, 2015 34,916 56.36
Granted 16,404 62.89Exercised (5,320) 51.48Forfeited (15,872) 59.72
Balance at December 30, 2016 30,128 59.01
Long Term Incentive Plan
The Long Term Incentive Plan (“LTIP”) rewards certain executives and senior leaders for the creation of value in the organizationthrough the achievement of specific long‑term (three year) goals of earnings growth and strategic initiatives. The Compensation Committee ofthe Board annually reviews and endorses participation in the LTIP and new plans are established each year. At the end of each plan’s three-yearperformance period, the Board approves the payout percentage based on actual performance. Awards are typically paid in both Companycommon stock and a cash amount approximately equal to an employees related tax liability. During the years ended December 30, 2016,December 25, 2015 and December 31, 2014, a total of 51,646 shares, zero shares, and 66,528 shares, respectively, were issued under the LTIPat a fair value of $62.89, $0.00, and $69.43 per share, respectively. Compensation expense for common stock under the LTIP plan was reducedby $3.2 million as a result of underperformance to the stated three-year program goals for the year ended December 30, 2016. For the yearended December 25, 2015, compensation expense for common stock awards under the LTIP was $6.9 million. For the year endedDecember 31, 2014, compensation expense for common stock under the LTIP plan was reduced by $6.4 million as a result of underperformanceto the stated three-year program goals.
Restricted Stock Plan
Our Restricted Stock Plan provides eligible individuals with added incentives to continue in the long‑term service of theCompany. The awards are made for no consideration, vest over various periods, and may include performance requirements, but are consideredoutstanding at the time of grant. During the years ended December 30, 2016, and December 25, 2015 and December 31, 2014, a total of 50,554shares, 49,902 shares, and 268,291 shares, respectively, were granted under the Restricted Stock Plan.
We recognize compensation costs, net of forfeitures, over the vesting term based on the fair value of the restricted stock at the date ofgrant. The amount of compensation expense recognized under the Restricted Stock Plan was $1.4 million for the year ended December 30,2016 and zero for each year ended December 25, 2015 and December 31, 2014. As of December 30, 2016, there was $2.6 million ofunrecognized compensation expense related to non‑vested restricted stock grants. The expense is expected to be recognized over a weightedaverage period of 1.5 years.
The following table summarizes the activity relating to the Restricted Stock Plan during 2016:
Weighted Average Grant Date
Non ‑‑
vested Shares Fair ValueBalance at December 25, 2015 293,835 61.14
Granted 50,554 62.83Vested (220,684) 63.90Cancelled (21,514) 54.43
Balance at December 30, 2016 102,191 57.43
The weighted‑average fair values of the shares granted under the Restricted Stock Plan during the years ended December 30, 2016,December 25, 2015 and December 31, 2014 were $62.83, $51.54, and $64.92, respectively.
(16) Employee Retirement Plans
Retirement and Tax‑‑Deferred Savings Plan
The Retirement and Tax‑Deferred Savings Plan (“401(k) Plan”) is a retirement plan that includes a cash deferral arrangement that isintended to qualify under Sections 401(a) and 401(k) of the Internal Revenue Code and provides benefits to eligible employees
95
Table of Contents
upon retirement. The 401(k) Plan allows for matching contributions up to 58.33% of the first 6% of elective deferrals made each quarter up to amaximum of 3.5% of the employee’s quarterly base compensation, although specific subsidiaries may have different limits on employermatching. The matching contributions can be made in both cash and/or stock. Expenses related to matching contributions made in commonstock for the 401(k) Plan were $28.6 million, $21.4 million, and $48.5 million for the years ended December 30, 2016, December 25, 2015, andDecember 31, 2014, respectively.
Defined Benefit Plans
We sponsor several defined benefit pension plans primarily in the United States and the United Kingdom.
In the U.S., we have three noncontributory defined benefit pension plans. Benefits in two of the plans are frozen while one planremains active, the CH2M HILL OMI Retirement Plan (“OMI Plan”). Benefits are generally based on years of service and compensationduring the span of employment.
In the U.K., we assumed several defined benefit plans as part of our acquisition of Halcrow on November 10, 2011, of which thelargest is the Halcrow Pension Scheme. These defined benefit plans have been closed to new entrants for many years. The information relatedto these plans is presented within the Non‑U.S. Pension Plans columns of the tables below, which also include several small end-of-servicebenefit plans in the Middle East.
Changes in Defined Benefit Plans
During the year ended December 30, 2016, the Company adopted an amendment for one of our United States defined benefit plans, theOMI Plan, to freeze future pay and benefit service accruals beginning in 2017 for non-union participants, resulting a gain on curtailment of$4.6 million in our net periodic pension expense and a $3.0 million reduction in our projected benefit obligation. There was also an additionalgain of $1.2 million due to settlements within several small end-of-service benefit plans in the Middle East during the year ended December 30,2016, which resulted in a $6.1 million reduction to our projected benefit obligation.
On October 4, 2016, Halcrow Group Limited (“HGL”), a subsidiary of CH2M, effected a transaction to restructure the benefitsprovided to members of the Halcrow Pension Scheme (“HPS”), a defined benefit plan sponsored by HGL, by providing each member with theoption to transfer his or her benefits in the HPS to a new pension scheme, which is also sponsored by HGL (“HPS2”). Alternatively, membershad the option to remain in the HPS which will enter the Pension Protection Fund (“PPF”) under a regulated apportionment arrangement. Thenew scheme, HPS2, provides benefits that are better than the compensation that would otherwise be paid by the PPF if a member chose to jointhe PPF rather than HPS2. The PPF was created by the United Kingdom Pensions Act 2004 to provide compensation to members of eligibledefined benefit pension schemes when an employer of the scheme can no longer support the pension scheme. A member that transferred toHPS2 will receive substantially similar benefits to those in the HPS, except that annual increases and revaluation of benefits are reduced tostatutory levels. A pension scheme member of the HPS that elected to transfer to the new scheme also received a one-time uplift to benefits ofeither 1.0% or 2.5%. The Pension Regulator, which is the United Kingdom’s executive body that regulates work-based pension schemes, andthe PPF provided necessary regulatory approvals for the transaction to restructure the HPS benefits.
As a result of the transaction described above, HGL ceased to have any further obligations to the HPS on October 4, 2016. Allmembers who consented to transfer to HPS2 were transferred on October 5, 2016. Members who agreed to transfer to the new scheme accountfor 96.6% of the HPS’ liabilities and a broadly equivalent proportion of the HPS’ assets have transferred to the new scheme, as well as 20% ofHGL’s equity issued as part of the transaction. As a result of the restructured benefits for those members transferring to HPS2, the projectedbenefit obligation was reduced by $362.3 million. Those members who remained in the HPS began the process of transferring to the PPFduring the fourth quarter of 2016 along with the assets that remain in the HPS, as well as 5% of HGL’s equity issued as part of the transaction,resulting in a settlement of $28.4 million and an actuarial gain of $16.2 million within the projected benefit obligation. We did not incur a gainor loss on settlement as a result of the transaction as the settlement cost related to the members who remained in HPS was less than the serviceand interest cost components of net periodic pension expense for 2016.
Additionally, in connection with the transaction, CH2M issued a £50.0 million, approximately $65.0 million, parent company
guarantee to support HPS2 and funded £80.0 million, approximately $104.0 million, to be allocated between HPS2 and the PPF based on theproportion of the HPS’ members that transferred to HPS2.
96
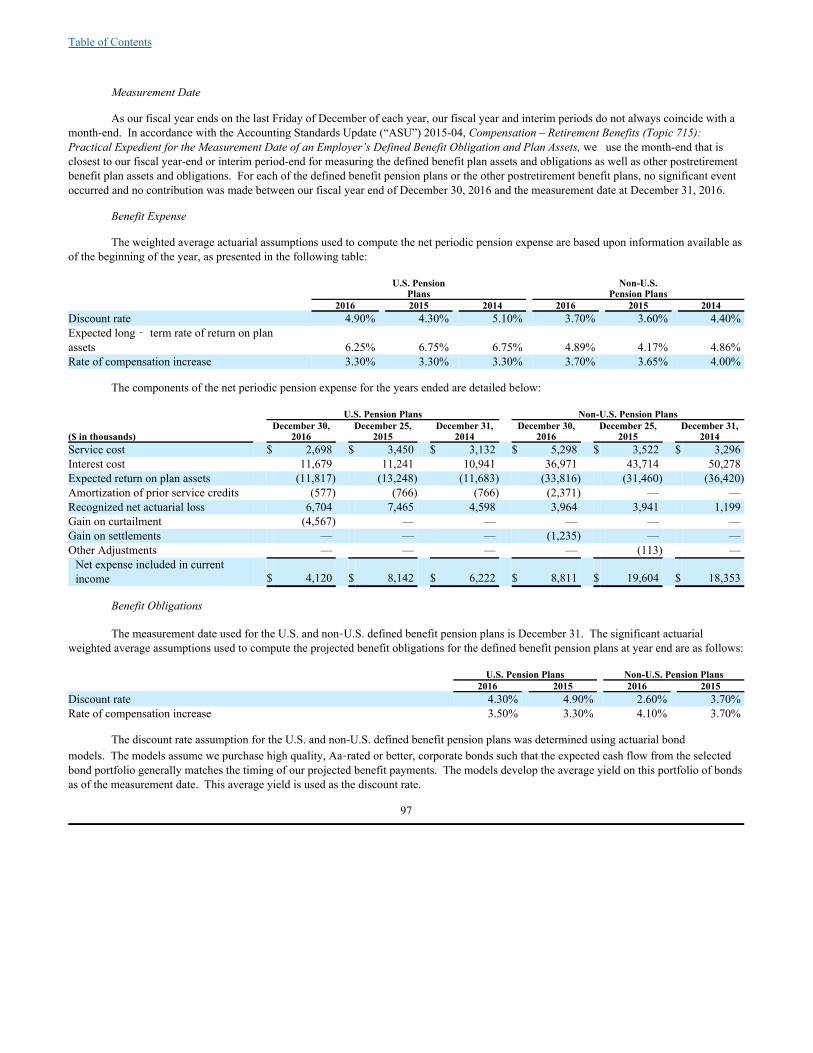
Table of Contents
Measurement Date
As our fiscal year ends on the last Friday of December of each year, our fiscal year and interim periods do not always coincide with amonth-end. In accordance with the Accounting Standards Update (“ASU”) 2015-04, Compensation – Retirement Benefits (Topic 715):Practical Expedient for the Measurement Date of an Employer’s Defined Benefit Obligation and Plan Assets, we use the month-end that isclosest to our fiscal year-end or interim period-end for measuring the defined benefit plan assets and obligations as well as other postretirementbenefit plan assets and obligations. For each of the defined benefit pension plans or the other postretirement benefit plans, no significant eventoccurred and no contribution was made between our fiscal year end of December 30, 2016 and the measurement date at December 31, 2016.
Benefit Expense
The weighted average actuarial assumptions used to compute the net periodic pension expense are based upon information available asof the beginning of the year, as presented in the following table:
U.S. Pension Non-U.S. Plans Pension Plans 2016 2015 2014 2016 2015 2014Discount rate 4.90% 4.30% 5.10% 3.70% 3.60% 4.40%Expected long ‑term rate of return on planassets 6.25% 6.75% 6.75% 4.89% 4.17% 4.86%Rate of compensation increase 3.30% 3.30% 3.30% 3.70% 3.65% 4.00%
The components of the net periodic pension expense for the years ended are detailed below:
U.S. Pension Plans Non-U.S. Pension Plans December 30, December 25, December 31, December 30, December 25, December 31,($ in thousands) 2016 2015 2014 2016 2015 2014Service cost $ 2,698 $ 3,450 $ 3,132 $ 5,298 $ 3,522 $ 3,296Interest cost 11,679 11,241 10,941 36,971 43,714 50,278Expected return on plan assets (11,817) (13,248) (11,683) (33,816) (31,460) (36,420)Amortization of prior service credits (577) (766) (766) (2,371) — —Recognized net actuarial loss 6,704 7,465 4,598 3,964 3,941 1,199Gain on curtailment (4,567) — — — — —Gain on settlements — — — (1,235) — —Other Adjustments — — — — (113) —
Net expense included in currentincome $ 4,120 $ 8,142 $ 6,222 $ 8,811 $ 19,604 $ 18,353
Benefit Obligations
The measurement date used for the U.S. and non‑U.S. defined benefit pension plans is December 31. The significant actuarialweighted average assumptions used to compute the projected benefit obligations for the defined benefit pension plans at year end are as follows:
U.S. Pension Plans Non-U.S. Pension Plans 2016 2015 2016 2015Discount rate 4.30% 4.90% 2.60% 3.70%Rate of compensation increase 3.50% 3.30% 4.10% 3.70%
The discount rate assumption for the U.S. and non-U.S. defined benefit pension plans was determined using actuarial bondmodels. The models assume we purchase high quality, Aa‑rated or better, corporate bonds such that the expected cash flow from the selectedbond portfolio generally matches the timing of our projected benefit payments. The models develop the average yield on this portfolio of bondsas of the measurement date. This average yield is used as the discount rate.
97
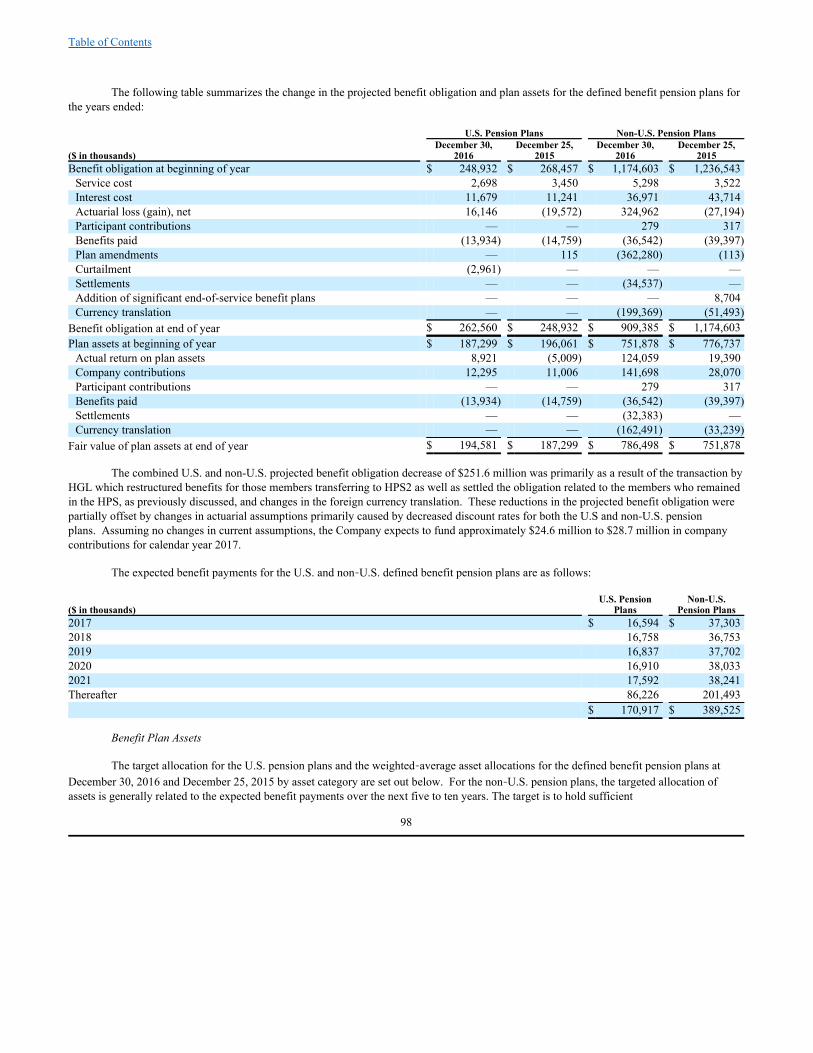
Table of Contents
The following table summarizes the change in the projected benefit obligation and plan assets for the defined benefit pension plans forthe years ended:
U.S. Pension Plans Non-U.S. Pension Plans December 30, December 25, December 30, December 25,($ in thousands) 2016 2015 2016 2015Benefit obligation at beginning of year $ 248,932 $ 268,457 $ 1,174,603 $ 1,236,543
Service cost 2,698 3,450 5,298 3,522Interest cost 11,679 11,241 36,971 43,714Actuarial loss (gain), net 16,146 (19,572) 324,962 (27,194)Participant contributions — — 279 317Benefits paid (13,934) (14,759) (36,542) (39,397)Plan amendments — 115 (362,280) (113)Curtailment (2,961) — — —Settlements — — (34,537) —Addition of significant end-of-service benefit plans — — — 8,704Currency translation — — (199,369) (51,493)
Benefit obligation at end of year $ 262,560 $ 248,932 $ 909,385 $ 1,174,603Plan assets at beginning of year $ 187,299 $ 196,061 $ 751,878 $ 776,737
Actual return on plan assets 8,921 (5,009) 124,059 19,390Company contributions 12,295 11,006 141,698 28,070Participant contributions — — 279 317Benefits paid (13,934) (14,759) (36,542) (39,397)Settlements — — (32,383) —Currency translation — — (162,491) (33,239)
Fair value of plan assets at end of year $ 194,581 $ 187,299 $ 786,498 $ 751,878
The combined U.S. and non-U.S. projected benefit obligation decrease of $251.6 million was primarily as a result of the transaction byHGL which restructured benefits for those members transferring to HPS2 as well as settled the obligation related to the members who remainedin the HPS, as previously discussed, and changes in the foreign currency translation. These reductions in the projected benefit obligation werepartially offset by changes in actuarial assumptions primarily caused by decreased discount rates for both the U.S and non-U.S. pensionplans. Assuming no changes in current assumptions, the Company expects to fund approximately $24.6 million to $28.7 million in companycontributions for calendar year 2017.
The expected benefit payments for the U.S. and non‑U.S. defined benefit pension plans are as follows:
U.S. Pension Non-U.S.($ in thousands) Plans Pension Plans2017 $ 16,594 $ 37,3032018 16,758 36,7532019 16,837 37,7022020 16,910 38,0332021 17,592 38,241Thereafter 86,226 201,493 $ 170,917 $ 389,525
Benefit Plan Assets
The target allocation for the U.S. pension plans and the weighted‑average asset allocations for the defined benefit pension plans atDecember 30, 2016 and December 25, 2015 by asset category are set out below. For the non‑U.S. pension plans, the targeted allocation ofassets is generally related to the expected benefit payments over the next five to ten years. The target is to hold sufficient
98
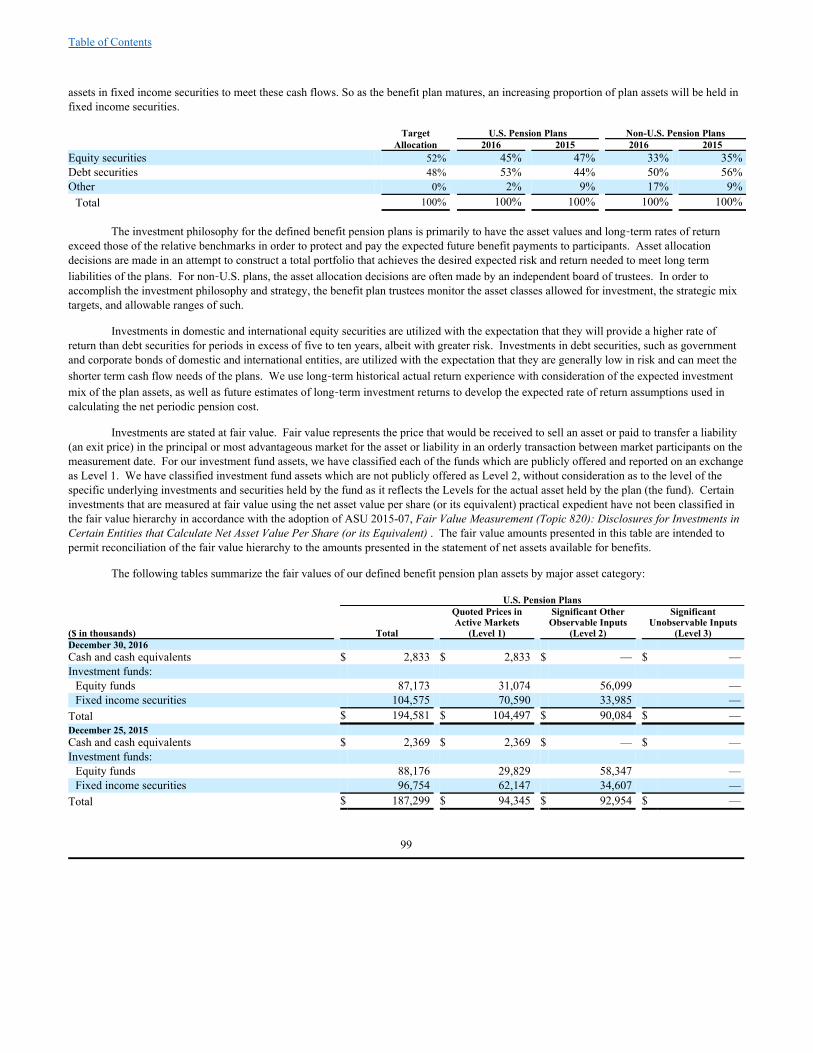
Table of Contents
assets in fixed income securities to meet these cash flows. So as the benefit plan matures, an increasing proportion of plan assets will be held infixed income securities.
Target U.S. Pension Plans Non-U.S. Pension Plans Allocation 2016 2015 2016 2015Equity securities 52% 45% 47% 33% 35%Debt securities 48% 53% 44% 50% 56%Other 0% 2% 9% 17% 9%
Total 100% 100% 100% 100% 100%
The investment philosophy for the defined benefit pension plans is primarily to have the asset values and long‑term rates of returnexceed those of the relative benchmarks in order to protect and pay the expected future benefit payments to participants. Asset allocationdecisions are made in an attempt to construct a total portfolio that achieves the desired expected risk and return needed to meet long termliabilities of the plans. For non‑U.S. plans, the asset allocation decisions are often made by an independent board of trustees. In order toaccomplish the investment philosophy and strategy, the benefit plan trustees monitor the asset classes allowed for investment, the strategic mixtargets, and allowable ranges of such.
Investments in domestic and international equity securities are utilized with the expectation that they will provide a higher rate ofreturn than debt securities for periods in excess of five to ten years, albeit with greater risk. Investments in debt securities, such as governmentand corporate bonds of domestic and international entities, are utilized with the expectation that they are generally low in risk and can meet theshorter term cash flow needs of the plans. We use long‑term historical actual return experience with consideration of the expected investmentmix of the plan assets, as well as future estimates of long‑term investment returns to develop the expected rate of return assumptions used incalculating the net periodic pension cost.
Investments are stated at fair value. Fair value represents the price that would be received to sell an asset or paid to transfer a liability(an exit price) in the principal or most advantageous market for the asset or liability in an orderly transaction between market participants on themeasurement date. For our investment fund assets, we have classified each of the funds which are publicly offered and reported on an exchangeas Level 1. We have classified investment fund assets which are not publicly offered as Level 2, without consideration as to the level of thespecific underlying investments and securities held by the fund as it reflects the Levels for the actual asset held by the plan (the fund). Certaininvestments that are measured at fair value using the net asset value per share (or its equivalent) practical expedient have not been classified inthe fair value hierarchy in accordance with the adoption of ASU 2015-07, Fair Value Measurement (Topic 820): Disclosures for Investments inCertain Entities that Calculate Net Asset Value Per Share (or its Equivalent) . The fair value amounts presented in this table are intended topermit reconciliation of the fair value hierarchy to the amounts presented in the statement of net assets available for benefits.
The following tables summarize the fair values of our defined benefit pension plan assets by major asset category:
U.S. Pension Plans Quoted Prices in Significant Other Significant
Active Markets Observable Inputs Unobservable Inputs($ in thousands) Total (Level 1) (Level 2) (Level 3)December 30, 2016 Cash and cash equivalents $ 2,833 $ 2,833 $ — $ —Investment funds:
Equity funds 87,173 31,074 56,099 —Fixed income securities 104,575 70,590 33,985 —
Total $ 194,581 $ 104,497 $ 90,084 $ —December 25, 2015 Cash and cash equivalents $ 2,369 $ 2,369 $ — $ —Investment funds:
Equity funds 88,176 29,829 58,347 —Fixed income securities 96,754 62,147 34,607 —
Total $ 187,299 $ 94,345 $ 92,954 $ —
99

Table of Contents
Non-U.S. Pension Plans Quoted Prices in Significant Other Significant Active Markets Observable Inputs Unobservable Inputs($ in thousands) Total (Level 1) (Level 2) (Level 3)December 30, 2016 Cash and cash equivalents $ 92,624 $ 80,538 $ 12,086 $ —Investment funds:
Equity funds 229,261 — 229,261 —Fixed income securities 367,862 — 367,862 —International property fund 3,326 — 3,326 —Other 25,648 — 25,648 —
Total investments in the fair value hierarchy $ 718,721 $ 80,538 $ 638,183 $ —Investments measured at net asset value 67,777
Total investment asset fair value measurement $ 786,498 $ 80,538 $ 638,183 $ —December 25, 2015 Cash and cash equivalents $ 34,673 $ 7,719 $ 26,954 $ —Investment funds:
Equity funds 231,931 — 231,931 —Fixed income securities 386,770 — 386,770 —International property fund 3,549 — 3,549 —Other 19,637 — 19,637 —
Total investments in the fair value hierarchy $ 676,560 $ 7,719 $ 668,841 $ —Investments measured at net asset value 75,318
Total investment asset fair value measurement $ 751,878 $ 7,719 $ 668,841 $ —
Funded Status
The following table presents the underfunded status of the defined benefit pension plans at December 30, 2016 and December 25, 2015which is included in long‑term employee related liabilities on the consolidated balance sheets:
Non-U.S. U.S. Pension Plans Pension Plans($ in thousands) 2016 2015 2016 2015Projected benefit obligation $ 262,560 $ 248,932 $ 909,385 $ 1,174,603Fair value of plan assets 194,581 187,299 786,498 751,878Overfunded status — — 2,493 2,906Underfunded status $ (67,979) $ (61,633) $ (125,380) $ (425,631)Amounts recognized in accumulated other comprehensive income consistof:
Net actuarial loss $ 88,066 $ 78,689 $ 342,227 $ 173,196Net prior service credits (323) (5,468) (312,834) —
Total $ 87,743 $ 73,221 $ 29,393 $ 173,196Amounts to be recognized in the following year as a component of netperiodic pension expense:
Net actuarial loss $ 7,630 $ 6,513 $ 10,244 2,885Net prior service credits (53) (752) (9,795) —
Total $ 7,577 $ 5,761 $ 449 2,885Additional information:
Accumulated benefit obligation $ 261,880 $ 245,726 $ 904,747 $ 1,166,501
Other Postretirement Benefits
We sponsor a medical benefit plan for retired employees of certain subsidiaries. The plan is contributory, and retiree premiums arebased on years of service at retirement. The benefits contain limitations and a cap on future cost increases. We fund postretirement medicalbenefits on a pay‑as‑you‑go basis. Additionally, we have a frozen non‑qualified pension plan that provides additional retirement benefits tocertain senior executives that remained employed and retired from CH2M on or after age 65.
100
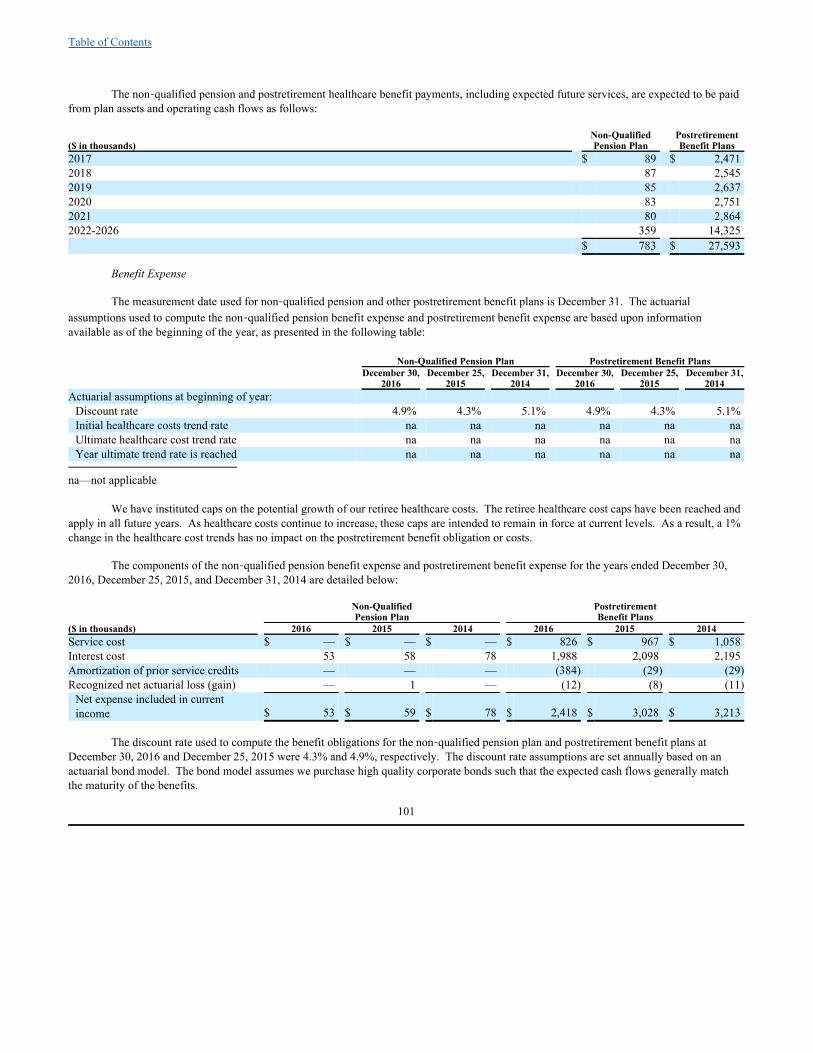
Table of Contents
The non‑qualified pension and postretirement healthcare benefit payments, including expected future services, are expected to be paidfrom plan assets and operating cash flows as follows:
Non-Qualified Postretirement($ in thousands) Pension Plan Benefit Plans2017 $ 89 $ 2,4712018 87 2,5452019 85 2,6372020 83 2,7512021 80 2,8642022-2026 359 14,325 $ 783 $ 27,593
Benefit Expense
The measurement date used for non‑qualified pension and other postretirement benefit plans is December 31. The actuarialassumptions used to compute the non‑qualified pension benefit expense and postretirement benefit expense are based upon informationavailable as of the beginning of the year, as presented in the following table:
Non-Qualified Pension Plan Postretirement Benefit Plans December 30, December 25, December 31, December 30, December 25, December 31, 2016 2015 2014 2016 2015 2014Actuarial assumptions at beginning of year:
Discount rate 4.9% 4.3% 5.1% 4.9% 4.3% 5.1%Initial healthcare costs trend rate na na na na na naUltimate healthcare cost trend rate na na na na na naYear ultimate trend rate is reached na na na na na na
na—not applicable
We have instituted caps on the potential growth of our retiree healthcare costs. The retiree healthcare cost caps have been reached andapply in all future years. As healthcare costs continue to increase, these caps are intended to remain in force at current levels. As a result, a 1%change in the healthcare cost trends has no impact on the postretirement benefit obligation or costs.
The components of the non‑qualified pension benefit expense and postretirement benefit expense for the years ended December 30,2016, December 25, 2015, and December 31, 2014 are detailed below:
Non-Qualified Postretirement Pension Plan Benefit Plans($ in thousands) 2016 2015 2014 2016 2015 2014Service cost $ — $ — $ — $ 826 $ 967 $ 1,058Interest cost 53 58 78 1,988 2,098 2,195Amortization of prior service credits — — — (384) (29) (29)Recognized net actuarial loss (gain) — 1 — (12) (8) (11)
Net expense included in currentincome $ 53 $ 59 $ 78 $ 2,418 $ 3,028 $ 3,213
The discount rate used to compute the benefit obligations for the non‑qualified pension plan and postretirement benefit plans atDecember 30, 2016 and December 25, 2015 were 4.3% and 4.9%, respectively. The discount rate assumptions are set annually based on anactuarial bond model. The bond model assumes we purchase high quality corporate bonds such that the expected cash flows generally matchthe maturity of the benefits.
101
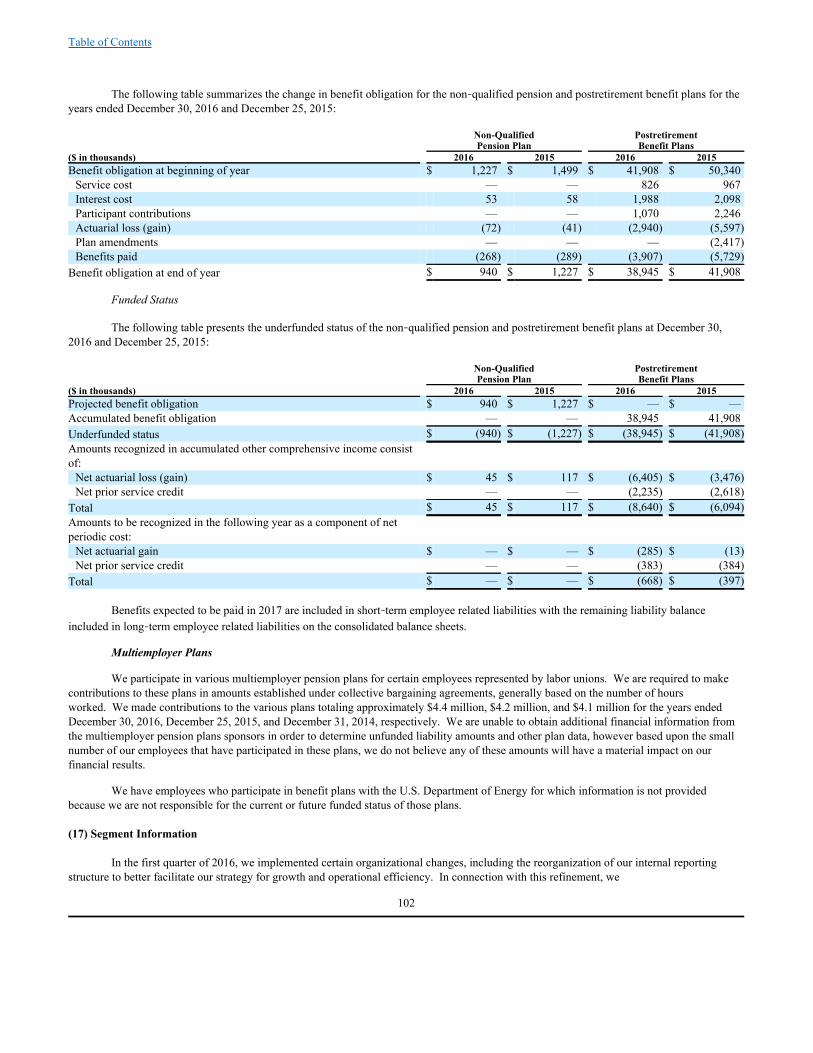
Table of Contents
The following table summarizes the change in benefit obligation for the non‑qualified pension and postretirement benefit plans for theyears ended December 30, 2016 and December 25, 2015:
Non-Qualified Postretirement Pension Plan Benefit Plans($ in thousands) 2016 2015 2016 2015Benefit obligation at beginning of year $ 1,227 $ 1,499 $ 41,908 $ 50,340
Service cost — — 826 967Interest cost 53 58 1,988 2,098Participant contributions — — 1,070 2,246Actuarial loss (gain) (72) (41) (2,940) (5,597)Plan amendments — — — (2,417)Benefits paid (268) (289) (3,907) (5,729)
Benefit obligation at end of year $ 940 $ 1,227 $ 38,945 $ 41,908
Funded Status
The following table presents the underfunded status of the non‑qualified pension and postretirement benefit plans at December 30,2016 and December 25, 2015:
Non-Qualified Postretirement Pension Plan Benefit Plans($ in thousands) 2016 2015 2016 2015Projected benefit obligation $ 940 $ 1,227 $ — $ —Accumulated benefit obligation — — 38,945 41,908Underfunded status $ (940) $ (1,227) $ (38,945) $ (41,908)Amounts recognized in accumulated other comprehensive income consistof:
Net actuarial loss (gain) $ 45 $ 117 $ (6,405) $ (3,476)Net prior service credit — — (2,235) (2,618)
Total $ 45 $ 117 $ (8,640) $ (6,094)Amounts to be recognized in the following year as a component of netperiodic cost:
Net actuarial gain $ — $ — $ (285) $ (13)Net prior service credit — — (383) (384)
Total $ — $ — $ (668) $ (397)
Benefits expected to be paid in 2017 are included in short‑term employee related liabilities with the remaining liability balanceincluded in long‑term employee related liabilities on the consolidated balance sheets.
Multiemployer Plans
We participate in various multiemployer pension plans for certain employees represented by labor unions. We are required to makecontributions to these plans in amounts established under collective bargaining agreements, generally based on the number of hoursworked. We made contributions to the various plans totaling approximately $4.4 million, $4.2 million, and $4.1 million for the years endedDecember 30, 2016, December 25, 2015, and December 31, 2014, respectively. We are unable to obtain additional financial information fromthe multiemployer pension plans sponsors in order to determine unfunded liability amounts and other plan data, however based upon the smallnumber of our employees that have participated in these plans, we do not believe any of these amounts will have a material impact on ourfinancial results.
We have employees who participate in benefit plans with the U.S. Department of Energy for which information is not providedbecause we are not responsible for the current or future funded status of those plans. (17) Segment Information
In the first quarter of 2016, we implemented certain organizational changes, including the reorganization of our internal reportingstructure to better facilitate our strategy for growth and operational efficiency. In connection with this refinement, we
102

Table of Contents
discontinued our former Industrial and Urban Environments (“IUE”) business group as a standalone unit, and we combined its industrial andadvanced technology business with our Oil, Gas and Chemicals business group to form the Energy and Industrial business group. Additionally,our urban environments and sports business which was formerly within IUE was combined with our Water business group. Our Power EPCbusiness continues to be monitored as a separate operating segment as we exit the fixed-price Power EPC business. As a result of thisreorganization, we identified our four business groups, which include Energy and Industrial, Environment and Nuclear, Transportation, andWater, as well as our Power EPC business as reportable operating segments.
Certain financial information relating to the years ended December 30, 2016, December 25, 2015 and December 31, 2014 for each
segment is provided below. Costs for corporate selling, general and administrative expenses, restructuring costs and amortization expenserelated to intangible assets have been allocated to each segment based on the estimated benefits provided by corporate functions. Thisallocation is primarily based upon metrics that reflect the proportionate volume of project-related activity and employee labor costs within eachsegment. Additionally, during the third quarter of 2016, an Environment and Nuclear consolidated joint venture consulting project in Canadaeliminated a previously existing one-month reporting lag, which had been required to achieve a timely consolidation. As a result of this change,revenue and direct cost of services each included an additional $51.7 million for the year ended December 30, 2016. There was no impact toour operating loss for the year ended December 30, 2016. Prior year amounts have been revised to conform to the current year presentation.
Year Ended December 30, 2016 Gross Equity in Operating($ in thousands) Revenue Earnings Income (Loss)Energy and Industrial $ 860,897 $ 3,400 $ (8,952)Environment and Nuclear 2,213,709 19,820 82,866Transportation 930,877 10,197 (115,139)Water 1,190,184 18,540 93,289Power EPC 40,277 — (292,168)
Total $ 5,235,944 $ 51,957 $ (240,104)
Year Ended December 25, 2015 Gross Equity in Operating($ in thousands) Revenue Earnings Income (Loss)Energy and Industrial $ 1,148,475 $ 2,311 $ 22,833Environment and Nuclear 1,663,523 29,123 77,145Transportation 973,916 8,363 (62,892)Water 1,363,867 6,968 93,318Power EPC 211,724 — 4,437
Total $ 5,361,505 $ 46,765 $ 134,841
Year Ended December 31, 2014 Gross Equity in Operating($ in thousands) Revenue Earnings Income (Loss)Energy and Industrial $ 1,230,695 $ 2,980 $ (61,738)Environment and Nuclear 1,666,828 35,208 64,541Transportation 947,846 12,813 (24,648)Water 1,371,155 3,917 90,128Power EPC 196,945 — (409,869)
Total $ 5,413,469 $ 54,918 $ (341,586)
Significant Clients
We derived approximately 21%, 19% and 21% of our total revenue from contracts with the U.S. federal government and the agenciesregulated by the U.S. federal government in the years ended December 30, 2016, December 25, 2015 and December 31, 2014,respectively. Additionally, in the year ended December 30, 2016, we derived approximately 12% of our total revenue from our Environmentand Nuclear consolidated joint venture consulting contract with Canadian Nuclear Laboratories.
Operating Information by Geographic Area
Although the majority of our consolidated revenue is generated from our domestic operations, we provide services in numerouscountries, including Canada, which accounted for 17% of the total consolidated revenue in 2016 and was primarily related
103
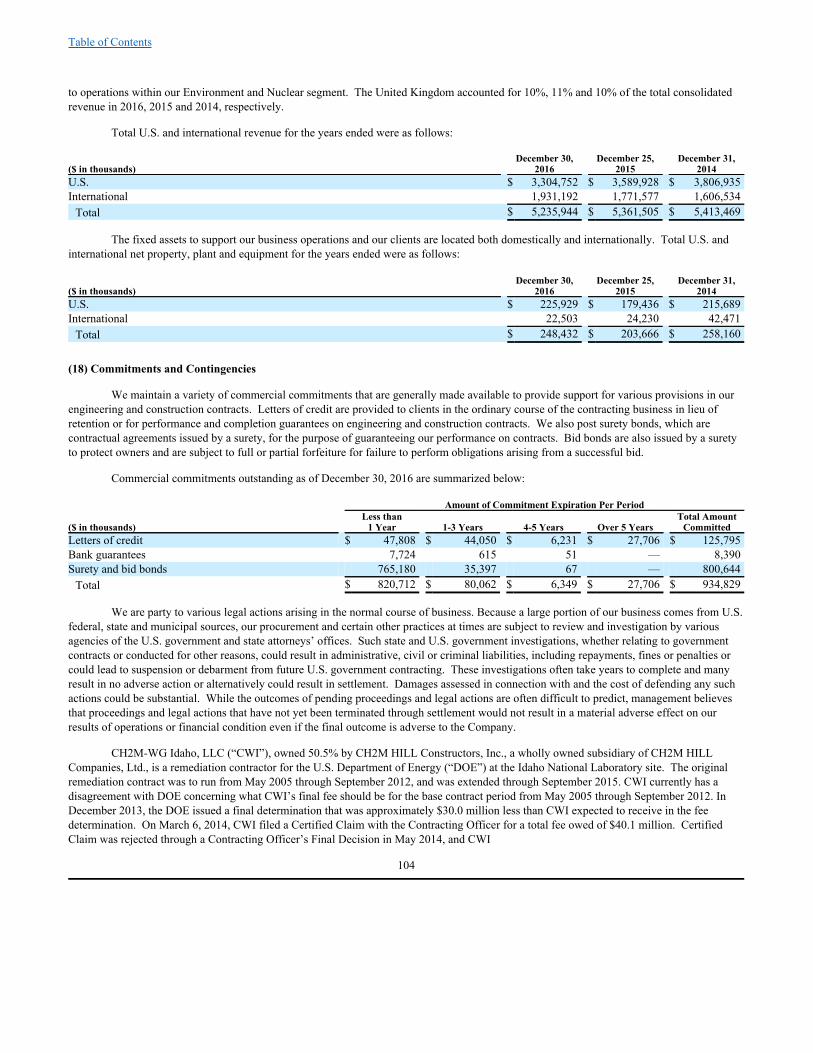
Table of Contents
to operations within our Environment and Nuclear segment. The United Kingdom accounted for 10%, 11% and 10% of the total consolidatedrevenue in 2016, 2015 and 2014, respectively.
Total U.S. and international revenue for the years ended were as follows:
December 30, December 25, December 31,($ in thousands) 2016 2015 2014U.S. $ 3,304,752 $ 3,589,928 $ 3,806,935International 1,931,192 1,771,577 1,606,534
Total $ 5,235,944 $ 5,361,505 $ 5,413,469
The fixed assets to support our business operations and our clients are located both domestically and internationally. Total U.S. andinternational net property, plant and equipment for the years ended were as follows:
December 30, December 25, December 31,($ in thousands) 2016 2015 2014U.S. $ 225,929 $ 179,436 $ 215,689International 22,503 24,230 42,471
Total $ 248,432 $ 203,666 $ 258,160
(18) Commitments and Contingencies
We maintain a variety of commercial commitments that are generally made available to provide support for various provisions in ourengineering and construction contracts. Letters of credit are provided to clients in the ordinary course of the contracting business in lieu ofretention or for performance and completion guarantees on engineering and construction contracts. We also post surety bonds, which arecontractual agreements issued by a surety, for the purpose of guaranteeing our performance on contracts. Bid bonds are also issued by a suretyto protect owners and are subject to full or partial forfeiture for failure to perform obligations arising from a successful bid.
Commercial commitments outstanding as of December 30, 2016 are summarized below:
Amount of Commitment Expiration Per Period Less than Total Amount($ in thousands) 1 Year 1-3 Years 4-5 Years Over 5 Years CommittedLetters of credit $ 47,808 $ 44,050 $ 6,231 $ 27,706 $ 125,795Bank guarantees 7,724 615 51 — 8,390Surety and bid bonds 765,180 35,397 67 — 800,644
Total $ 820,712 $ 80,062 $ 6,349 $ 27,706 $ 934,829
We are party to various legal actions arising in the normal course of business. Because a large portion of our business comes from U.S.federal, state and municipal sources, our procurement and certain other practices at times are subject to review and investigation by variousagencies of the U.S. government and state attorneys’ offices. Such state and U.S. government investigations, whether relating to governmentcontracts or conducted for other reasons, could result in administrative, civil or criminal liabilities, including repayments, fines or penalties orcould lead to suspension or debarment from future U.S. government contracting. These investigations often take years to complete and manyresult in no adverse action or alternatively could result in settlement. Damages assessed in connection with and the cost of defending any suchactions could be substantial. While the outcomes of pending proceedings and legal actions are often difficult to predict, management believesthat proceedings and legal actions that have not yet been terminated through settlement would not result in a material adverse effect on ourresults of operations or financial condition even if the final outcome is adverse to the Company.
CH2M-WG Idaho, LLC (“CWI”), owned 50.5% by CH2M HILL Constructors, Inc., a wholly owned subsidiary of CH2M HILLCompanies, Ltd., is a remediation contractor for the U.S. Department of Energy (“DOE”) at the Idaho National Laboratory site. The originalremediation contract was to run from May 2005 through September 2012, and was extended through September 2015. CWI currently has adisagreement with DOE concerning what CWI’s final fee should be for the base contract period from May 2005 through September 2012. InDecember 2013, the DOE issued a final determination that was approximately $30.0 million less than CWI expected to receive in the feedetermination. On March 6, 2014, CWI filed a Certified Claim with the Contracting Officer for a total fee owed of $40.1 million. CertifiedClaim was rejected through a Contracting Officer’s Final Decision in May 2014, and CWI
104

Table of Contents
filed its appeal to the Civilian Board of Contract Appeals on May 30, 2014. The trial was held on April 12 through 28, 2016, and the post-trialbriefing phase is now complete. We are awaiting the decision from the Board. Based on information presently known to management, webelieve that the outcome of this dispute will not have a material adverse effect on our financial condition, cash flows or results of operations.
In 2003, the Municipality of Anchorage, Alaska (“Municipality”) began its Port of Anchorage Intermodal Expansion Project byentering into Memoranda of Understanding with the Maritime Administration (“MarAd”). MarAd contracted with Integrated Concepts andResearch Corporation (“ICRC”) to perform certain design and construction-related work on the project. In 2006, ICRC subcontracted certainproject design work to PND Engineers, Inc. (“PND”). In 2006, PND subcontracted some limited portions of its work to VECO, Inc. (n/k/aCH2M HILL Alaska, Inc.). During the design phase, PND’s proprietary design, the Open Cell Sheet Pile system (“OCSP”) was recommendedas the preferred design alternative on the project. VECO issued two documents, one in 2006 and one in 2007. On March 8, 2013, theMunicipality filed suit against ICRC, PND, and CH2M HILL Alaska, Inc. in the Superior Court for the State of Alaska, Third Judicial Districtat Anchorage. Four additional parties (GeoEngineers, Inc.; Terracon Consultants, Inc.; Colaska, Inc.; and MKB Constructors) were later addedto the litigation. The matter was transferred to the United States District Court for the District of Alaska. The Municipality alleged the projectsuffered from design and construction deficiencies, and initially claimed damages against all defendants of approximately $340.0 million . TheMunicipality’s claims against CH2M HILL Alaska, Inc. ultimately included claims for professional negligence, negligence, and negligentmisrepresentation. The Court issued a ruling on October 31, 2016, granting CH2M HILL Alaska, Inc.’s motion for summary judgment as tonegligence, negligent misrepresentation, and the portion of the professional negligence claim relating to VECO’s 2007 report. The Municipalityhas also filed suit against MarAd in the Court of Federal Claims related to the Project. Based on information presently known to management,we intend to vigorously defend the claims brought against us, and we believe that the outcome of this dispute will not have a material adverseeffect on our financial condition, cash flows or results of operations . On January 26, 2017, the Municipality and CH2M HILL Alaska, Inc.reached a settlement for an immaterial amount under fair and reasonable terms, and the Municipality dismissed CH2M HILL Alaska, Inc. withprejudice from the litigation.
In 2009, URS-CH2M HILL Amtrak Joint Venture, a joint venture formed by CH2M HILL, Inc., a wholly owned subsidiary of CH2MHILL Companies, Ltd., and URS Corporation (“URS”) was contracted by Amtrak to provide Program Management Oversight andadministration services for the Amtrak Improvements Project, a $1.3 billion Amtrak-awarded stimulus funded under the American Recoveryand Reinvestment Act. This ongoing appointment includes over 366 projects involving improvements to bridges, communications and systems,electrical transmission, stations, security, railroad ties, etc. On July 17, 2014, Amtrak’s Office of Inspector General served a subpoena ducestecum on CH2M HILL, Inc. and joint venture partner, URS, requesting multiple categories of records. Following CH2M HILL, Inc.’sproduction of documents in compliance with the subpoena, the U.S. Attorney’s Office in Philadelphia contacted CH2M HILL, Inc.’s outsidecounsel in January 2016 and has since asserted potential violations of the federal False Claims Act resulting in excess of $3.0 million inclaims. CH2M HILL, Inc. and the federal government have reached a settlement in principle under fair and reasonable terms to settle thegovernment’s civil False Claims Act claims. On February 27, 2017, the parties reached a settlement pursuant to which CH2M HILL, Inc. andits joint venture partner will pay the United States federal government $1.5 million.
In 2012, CH2M HILL Australia Pty Limited entered into a 50/50 integrated joint venture with UGL Infrastructure Pty Limited(“UGL”), an Australian construction contractor (“CH2M-UGL JV” or “JV”). The JV entered into a Consortium Agreement with GeneralElectric and GE Electrical International Inc. The Consortium was awarded a contract by JKC Australia LNG Pty Limited (“JKC”) for theengineering, procurement, construction and commissioning of a 360 MW Combined Cycle Power Plant (the “Project”) for INPEX OperationsAustralia Pty Limited (“Inpex”) at Blaydin Point, Darwin, NT, Australia (the “Subcontract”). On January 24, 2017, the Consortium terminatedthe Subcontract because of JKC’s repudiatory breach. The Consortium also demobilized from the work site. The Consortium issued atermination letter which described JKC’s failure to properly administer the Subcontract. JKC’s failures include, among other things, (1) afailure to provide fuel gas by the milestone date and (2) delay in the provision of electrical load against the previously advised program. Thereare a number of other omissions and interferences by JKC with respect to completing site documentation that have also contributed to theConsortium’s decision to terminate the Subcontract. JKC has claimed that the Consortium’s termination was not valid. JKC claims theConsortium has abandoned the work and, as such, JKC has now purported to terminate the Subcontract. The Consortium and JKC are now indispute over the termination. The Consortium expects to file arbitration claims against JKC, and anticipates that JKC will file claims back. Weexpect the arbitration to be lengthy and at this time are unable to predict the timing of resolution or the outcome of disputes, but the outcomecould be materially adverse to our results of operations, cash flow and financial condition. The primary dispute over the termination is to bedecided in an International Chamber of Commerce arbitration in Singapore.
Many claims that are currently pending against us are covered by our professional liability insurance after we have exhausted our self-insurance requirement, which is currently $20.0 million per policy year. Management estimates that the levels of insurance
105
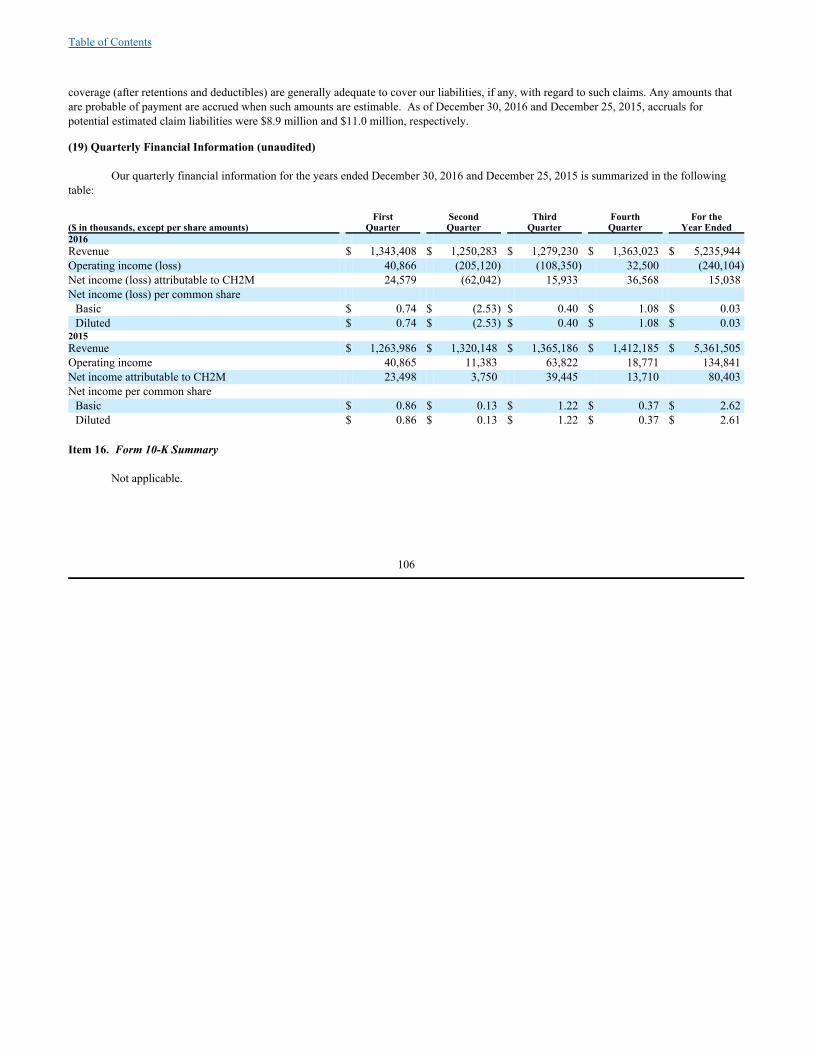
Table of Contents
coverage (after retentions and deductibles) are generally adequate to cover our liabilities, if any, with regard to such claims. Any amounts thatare probable of payment are accrued when such amounts are estimable. As of December 30, 2016 and December 25, 2015, accruals forpotential estimated claim liabilities were $8.9 million and $11.0 million, respectively.
(19) Quarterly Financial Information (unaudited)
Our quarterly financial information for the years ended December 30, 2016 and December 25, 2015 is summarized in the followingtable:
First Second Third Fourth For the($ in thousands, except per share amounts) Quarter Quarter Quarter Quarter Year Ended2016 Revenue $ 1,343,408 $ 1,250,283 $ 1,279,230 $ 1,363,023 $ 5,235,944Operating income (loss) 40,866 (205,120) (108,350) 32,500 (240,104)Net income (loss) attributable to CH2M 24,579 (62,042) 15,933 36,568 15,038Net income (loss) per common share
Basic $ 0.74 $ (2.53) $ 0.40 $ 1.08 $ 0.03Diluted $ 0.74 $ (2.53) $ 0.40 $ 1.08 $ 0.03
2015 Revenue $ 1,263,986 $ 1,320,148 $ 1,365,186 $ 1,412,185 $ 5,361,505Operating income 40,865 11,383 63,822 18,771 134,841Net income attributable to CH2M 23,498 3,750 39,445 13,710 80,403Net income per common share
Basic $ 0.86 $ 0.13 $ 1.22 $ 0.37 $ 2.62Diluted $ 0.86 $ 0.13 $ 1.22 $ 0.37 $ 2.61
Item 16. Form 10-K Summary
Not applicable.
106

Table of Contents
Signature s
Pursuant to the requirements of Section 13 or 15(d) of the Securities Exchange Act of 1934, the registrant has duly caused this reportto be signed on its behalf by the undersigned, thereunto duly authorized, in the City of Englewood, Douglas County, State of Colorado, onMarch 7, 2017.
Interim Chief Financial Officer and Chief Accounting Officer
CH2M Hill Companies, Ltd.
By: /s/ Gary L. McArthurGary L. McArthur
Executive Vice President and Chief Financial Officer
Pursuant to the requirements of the Securities Exchange Act of 1934, this report has been signed by the following persons in thecapacities and on the dates stated, through their attorney‑in‑fact as appointed in the power of attorney of February 16, 2017 included asExhibit 24.1 filed herewith.
Signature Title Date
/s/ Jacqueline C. Hinman President and Chief Executive Officer (principalexecutive officer) and a Director
March 7,2017Jacqueline C. Hinman
/s/ Gary L. McArthur Executive Vice President and Chief Financial Officer
(principal financial officer)March 7,
2017Gary L. McArthur
/s/ Ryan L. Beckman Vice President, Chief Accounting Officer andController (principal accounting officer)
March 7,2017Ryan L. Beckman
*
Director March 7,
2017Malcolm Brinded *
Director March 7,2017Lisa Glatch
*
Charles O. Holliday, Jr
Director March 7,
2017
*Director March 7,
2017W. Blakely Jeffcoat
*Director March 7,
2017Scott Kleinman *
Director March 7,2017Gregory T. McIntyre
*
Director March 7,2017Antoine G. Munfakh
*Director March 7,
2017Georgia R. Nelson

Table of Contents
*Director March 7,
2017Thomas L. Pennella
*Director March 7,
2017Terry A. Ruhl
*Director March 7,
2017Janet Walstrom
*Director March 7,
2017Barry L. Williams
*By: /s/ Gary L. McArthur
Gary L. McArthur, as attorney‑in‑fact
Exhibit 21.1

Exhibit 21.1
Subsidiaries of CH2M HILL Companies, Ltd.
Subsidiary Jurisdiction of Organization CH2M HILL Alaska, Inc. Alaska CH2M HILL Canada Limited Canada CH2M HILL Constructors, Inc. Delaware CH2M HILL Engineers, Inc. Delaware CH2M HILL Global Holdings, S.a.r.l. Luxembourg CH2M HILL, Inc. Florida CH2M HILL International, Ltd. Delaware CH2M HILL Netherlands Holding B.V. Netherlands CHIHB, LP Bermuda CHVENG, LLC Delaware Halcrow Group Ltd. United Kingdom Halcrow Holdings Ltd. United Kingdom LG Constructors, Inc. Delaware Operations Management International, Inc. California
Exhibit 23.1

Exhibit 23.1
Consent of Independent Registered Public Accounting Firm
The Board of DirectorsCH2M HILL Companies, Ltd.:
We consent to the incorporation by reference in the registration statement (No. 333-165649) on Form S-8 of CH2M HILLCompanies, Ltd. (the Company) of our report dated March 7, 2017, with respect to the consolidated balance sheets of theCompany as of December 30, 2016 and December 25, 2015, and the related consolidated statements of operations, comprehensiveincome (loss), stockholders’ equity, and cash flows for each of the years in the three-year period ended December 30, 2016,which appears in the December 30, 2016 annual report on Form 10-K of the Company.
.
/s/ KPMG LLP KPMG LLP Denver, Colorado March 7, 2017
Exhibit 24.1

Exhibit 24.1
POWER OF ATTORNEY
Each person whose signature appears below does hereby make, constitute and appoint each of Jacqueline C. Hinman, Gary L. McArthur and Ryan L.Beckman, acting individually, as such person’s true and lawful attorney‑in‑fact and agent, with full power of substitution, resubstitution andrevocation to execute, deliver and file with the U.S. Securities and Exchange Commission, the United Kingdom Financial Conduct Authority and thecorresponding securities regulatory agency in each other country where a registration or filing may be necessary or advised in connection with anyoffering of the Company’s securities, including but not limited to: Argentina, Brazil, Canada, Hong Kong, India, Ireland, Mexico, Poland, Qatar,Singapore, the United Arab Emirates, and the United Kingdom, for and on such person’s behalf, and in any and all capacities,
1. The Annual Report on Form 10‑K of CH2M HILL Companies, Ltd. for the year ended December 30, 2016, any and all amendments(including post‑effective amendments) thereto with all exhibits thereto and other documents in connection therewith, or foreign jurisdictionequivalent reports and statements;
2. A Prospectus for use in the member nations of the European Union pursuant to the EU Prospectus Directions and any and all amendmentsthereto with all exhibits and other documents in connection therewith, and
3. Such annual or other periodic reports on business, prospects, financial and results of operations as may be required in any such other country.
granting unto each of said attorneys‑in fact and agents full power and authority to do and perform each and every act and thing requisite and necessaryto be done as fully to all intents and purposes as such person might or could do in person, hereby ratifying and confirming all that said attorney‑in‑ factand agent or such person’s substitute or substitutes may lawfully do or cause to be done by virtue hereof.
/s/ Malcolm BrindedMalcolm Brinded
February 16, 2017
/s/ Lisa GlatchLisa Glatch
February 16, 2017
/s/Jacqueline C. HinmanJacqueline C. Hinman.
February 16, 2017
/s/ Charles O. Holliday, Jr.Charles O. Holliday, Jr.
February 16, 2017
/s/ W. Blakely JeffcoatW. Blakely Jeffcoat
February 16, 2017
/s/ Scott KleinmanScott Kleinman
February 16, 2017
/s/ Gregory T. McIntyreGregory T. McIntyre
February 16, 2017
/s/ Antoine G. MunfakhAntoine G. Munfakh
February 16, 2017
/s/ Georgia R. NelsonGeorgia R. Nelson
February 16, 2017
/s/ Thomas L. PennellaThomas L. Pennella
February 16, 2017
/s/ Terry A. RuhlTerry A. Ruhl
February 16, 2017

/s/ Janet WalstromJanet Walstrom
February 16, 2017
/s/ Barry L. WilliamsBarry L. Williams February 16, 2017

Exhibit 31.1
CERTIFICATION
Pursuant to Section 302 of the Sarbanes‑‑Oxley Act of 2002
I, Jacqueline C. Hinman, certify that:
1. I have reviewed this annual report on Form 10‑K of CH2M HILL Companies, Ltd.;
2. Based on my knowledge, this report does not contain any untrue statement of a material fact or omit to state a material fact necessary to makethe statements made, in light of the circumstances under which such statements were made, not misleading with respect to the period coveredby this report;
3. Based on my knowledge, the financial statements, and other financial information included in this report, fairly present in all materialrespects the financial condition, results of operations and cash flows of the registrant as of, and for, the periods presented in this report;
4. The registrant’s other certifying officer and I are responsible for establishing and maintaining disclosure controls and procedures (as definedin Exchange Act Rules 13a‑15(e) and 15d‑15(e)) and internal control over financial reporting (as defined in Exchange Act Rules 13a‑15(f)and 15d‑15(f)) for the registrant and have:
a) designed such disclosure controls and procedures, or caused such disclosure controls and procedures to be designed under oursupervision, to ensure that material information relating to the registrant, including its consolidated subsidiaries, is made known tous by others within those entities, particularly during the period in which this report is being prepared;
b) designed such internal control over financial reporting, or caused such internal control over financial reporting to be designed underour supervision, to provide reasonable assurance regarding the reliability of financial reporting and the preparation of financialstatements for external purposes in accordance with generally accepted accounting principles;
c) evaluated the effectiveness of the registrant’s disclosure controls and procedures and presented in this report our conclusions aboutthe effectiveness of the disclosure controls and procedures, as of the end of the period covered by this report based on suchevaluation; and
d) disclosed in this report any change in the registrant’s internal control over financial reporting that occurred during the registrant’smost recent fiscal quarter (the registrant’s fourth fiscal quarter in the case of an annual report) that has materially affected, or isreasonably likely to materially affect, the registrant’s internal control over financial reporting; and
5. The registrant’s other certifying officer and I have disclosed, based on our most recent evaluation of internal control over financial reporting,to the registrant’s auditors and the audit committee of the registrant’s board of directors (or persons performing the equivalent functions):
a) all significant deficiencies and material weaknesses in the design or operation of internal control over financial reporting which arereasonably likely to adversely affect the registrant’s ability to record, process, summarize and report financial information; and
b) any fraud, whether or not material, that involves management or other employees who have a significant role in the registrant’sinternal control over financial reporting.
Date: March 7, 2017
/s/ JACQUELINE C. HINMANJacqueline C. HinmanChief Executive Officer
Exhibit 31.2
Exhibit 31.2
CERTIFICATION
Pursuant to Section 302 of the Sarbanes‑‑Oxley Act of 2002
I, Gary L. McArthur, certify that:
1. I have reviewed this annual report on Form 10‑K of CH2M HILL Companies, Ltd.;
2. Based on my knowledge, this report does not contain any untrue statement of a material fact or omit to state a material fact necessary to makethe statements made, in light of the circumstances under which such statements were made, not misleading with respect to the period coveredby this report;
3. Based on my knowledge, the financial statements, and other financial information included in this report, fairly present in all materialrespects the financial condition, results of operations and cash flows of the registrant as of, and for, the periods presented in this report;
4. The registrant’s other certifying officer and I are responsible for establishing and maintaining disclosure controls and procedures (as definedin Exchange Act Rules 13a‑15(e) and 15d‑15(e)) and internal control over financial reporting (as defined in Exchange Act Rules 13a‑15(f)and 15d‑15(f)) for the registrant and have:
a) designed such disclosure controls and procedures, or caused such disclosure controls and procedures to be designed under oursupervision, to ensure that material information relating to the registrant, including its consolidated subsidiaries, is made known tous by others within those entities, particularly during the period in which this report is being prepared;
b) designed such internal control over financial reporting, or caused such internal control over financial reporting to be designed underour supervision, to provide reasonable assurance regarding the reliability of financial reporting and the preparation of financialstatements for external purposes in accordance with generally accepted accounting principles;
c) evaluated the effectiveness of the registrant’s disclosure controls and procedures and presented in this report our conclusions aboutthe effectiveness of the disclosure controls and procedures, as of the end of the period covered by this report based on suchevaluation; and
d) disclosed in this report any change in the registrant’s internal control over financial reporting that occurred during the registrant’smost recent fiscal quarter (the registrant’s fourth fiscal quarter in the case of an annual report) that has materially affected, or isreasonably likely to materially affect, the registrant’s internal control over financial reporting; and
5. The registrant’s other certifying officer and I have disclosed, based on our most recent evaluation of internal control over financial reporting,to the registrant’s auditors and the audit committee of the registrant’s board of directors (or persons performing the equivalent functions):
a) all significant deficiencies and material weaknesses in the design or operation of internal control over financial reporting which arereasonably likely to adversely affect the registrant’s ability to record, process, summarize and report financial information; and
b) any fraud, whether or not material, that involves management or other employees who have a significant role in the registrant’sinternal control over financial reporting.
Date: March 7, 2017
/s/ Gary L. McArthurGary L. McArthurChief Financial Officer
Exhibit 32.1

Exhibit 32.1
CERTIFICATION
PURSUANT TO RULE 13A‑‑14(B) OF THE SECURITIES EXCHANGE ACT OF 1934, AS AMENDED, ANDSECTION 1350 OF CHAPTER 63 OF TITLE 18 OF THE UNITED STATES CODE (18 U.S.C.
SECTION 1350)
In connection with the Annual Report of CH2M HILL Companies, Ltd. (the “Company”) on Form 10‑K for the annualperiod ended December 30, 2016 as filed with the Securities and Exchange Commission on the date hereof (the “Report”), I,Jacqueline C. Hinman, Chief Executive Officer of the Company, certify, pursuant to 18 U.S.C. Section 1350 as adopted bySection 906 of the Sarbanes‑Oxley Act of 2002 that to the best of my knowledge:
(1) The Report fully complies with the requirements of section 13(a) or 15(d) of the Exchange Act as amended; and
(2) The information contained in the Report fairly presents, in all material respects, the financial condition and resultsof operations of the Company as of, and for, the periods presented in the Report.
/s/ Jacqueline C. HinmanJacqueline C. HinmanChief Executive Officer
March 7, 2017
This certification “accompanies” the Report to which it relates, is not deemed filed with the Securities and ExchangeCommission and is not to be incorporated by reference into any filing of the Company under the Securities Act of 1933, asamended, or the Securities Exchange Act of 1934, as amended (whether made before or after the date of the Report), irrespectiveof any general incorporation language contained in such filing. A signed original of this written statement required by Section 906has been provided to the Company and will be retained by the Company and furnished to the Securities and ExchangeCommission or its staff upon request.
Exhibit 32.2

Exhibit 32.2
CERTIFICATION
PURSUANT TO RULE 13A‑‑14(B) OF THE SECURITIES EXCHANGE ACT OF 1934, AS AMENDED,AND SECTION 1350 OF CHAPTER 63 OF TITLE 18 OF THE UNITED STATES CODE (18 U.S.C. SECTION 1350)
In connection with the Annual Report of CH2M HILL Companies, Ltd. (the “Company”) on Form 10‑K for the annualperiod ended December 30, 2016 as filed with the Securities and Exchange Commission on the date hereof (the “Report”), I, GaryL. McArthur, Chief Financial Officer of the Company, certify, pursuant to 18 U.S.C. Section 1350 as adopted by Section 906 ofthe Sarbanes‑Oxley Act of 2002 that to the best of my knowledge:
(1) The Report fully complies with the requirements of section 13(a) or 15(d) of the Exchange Act as amended; and
(2) The information contained in the Report fairly presents, in all material respects, the financial condition and resultsof operations of the Company as of, and for, the periods presented in the Report.
G G
/s/ Gary L. McArthurGary L. McArthurChief Financial Officer
March 7, 2017
This certification “accompanies” the Report to which it relates, is not deemed filed with the Securities and ExchangeCommission and is not to be incorporated by reference into any filing of the Company under the Securities Act of 1933, asamended, or the Securities Exchange Act of 1934, as amended (whether made before or after the date of the Report), irrespectiveof any general incorporation language contained in such filing. A signed original of this written statement required by Section 906has been provided to the Company and will be retained by the Company and furnished to the Securities and ExchangeCommission or its staff upon request.


![Hardware-assistedTrusted ExecutionEnvironments[AE08] A Platform for OnBoard Credentials, Financial Cryptography and Data Security (2008) [KEAR09] On-board credentials with open provisioning](https://static.fdocuments.us/doc/165x107/5e69990e1b95787072660732/hardware-assistedtrusted-executionenvironments-ae08-a-platform-for-onboard-credentials.jpg)