
UNITED STATES DEPARTMENT OF THE INTERIOR RESOURCE APPRAISAL OF THE
94
UNITED STATES DEPARTMENT OF THE INTERIOR GEOLOGICAL SURVEY RESOURCE APPRAISAL OF THE MT. SHASTA WILDERNESS STUDY AREA, SISKIYOU COUNTY, CALIFORNIA By Robert L. Christiansen, Frank J. Kleinhampl, Richard J. Blakely U.S. Geological Survey Ernest T. Tuchek, Fredrick L. Johnson, and Martin D. Conyac U.S. Bureau of Mines Open-file report 77-250 1977 This report is preliminary and has not been edited or reviewed for conformity with Geological Survey standards and nomenclature
Transcript of UNITED STATES DEPARTMENT OF THE INTERIOR RESOURCE APPRAISAL OF THE

UNITED STATES DEPARTMENT OF THE INTERIOR
GEOLOGICAL SURVEY
RESOURCE APPRAISAL OF THE MT. SHASTA WILDERNESS
STUDY AREA, SISKIYOU COUNTY, CALIFORNIA
By
Robert L. Christiansen, Frank J. Kleinhampl, Richard J. Blakely
U.S. Geological Survey
Ernest T. Tuchek, Fredrick L. Johnson, and Martin D. Conyac
U.S. Bureau of Mines
Open-file report 77-250
1977
This report is preliminary and has not been edited or reviewed for conformity with Geological Survey standards and nomenclature

CONTENTS
Page
Summary and conclusions : 1
Introduction 5
Previous studies 6
Present study - - - 6
Acknowledgements 7
Geology ~ --------.........__________________ Q
Geologic and geophysical setting 8
Volcanism of Mt. Shasta 9
Rocks and types of volcanic units - 9
Structural controls 13
History of volcanism - 15
Aeromagnetic data and interpretation 21
Description of the aeromagnetic anomalies 22
Model ing experiments 24
Mt. Shasta 26
Ash Creek Butte 28
The Whaleback 29
Summary 30
Resource potential 32
Geothermal energy - 32
Mineral deposits 36
Regional distribution and general features 36
Geochemical exploration 38
Methods 38
Precious metals (gold and silver) 40
ii

Resource potential (continued)
Mineral deposits (continued)
Geochemical exploration (continued)
Base metals (lead, zinc, and copper) 40
Arsenic and Antimony 42
Other metals (Mo, Bi, Sn, Be, Hg, Ni, Cr, and V) 43
Nonmetallic deposits 44
Conclusions 44
Economic mineral appraisal 46
Sampling and analytical techniques 46
Mining claims 46
References cited 50
iii

ILLUSTRATIONS
Figure 1. Index map
2. Generalized geologic map of Mt. Shasta
3. Geologic map of the Mt. Shasta Wilderness Study Area
4. Bouguer gravity map of Mt. Shasta and the surrounding region
5. Photograph of Sargents Ridge and upper Mud Creek
6. Photograph of Misery Hill, upper Avalanche Gulch, and the
Mt. Shasta summit
7. Photograph of Shastina and the Mt. Shasta summit
8. Photograph of the Hot!urn cone
9. Aeromagnetic map of the area surrounding Mt. Shasta
10. Aeromagnetic map of Mt. Shasta
11. Digitized approximation to the topography of Mt. Shasta
12. Residual field resulting from inverse model of Mt. Shasta
aeromagnetic data
13. Digitized approximation to the topography of Ash Creek Butte
14. Residual field resulting from inverse model of Ash Creek
Butte aeromagnetic data
15. Digitized approximation to the topography of The Whaleback
16. Locations, sample numbers, and types of geochemical-
exploration samples, Mt. Shasta Wilderness Study area
17. Lead and zinc in samples
18. Copper and molybdenum in samples -
19. Arsenic and antimony samples
20. Mercury in samples
21. Chromium, nickel and vanadium in samples
22. Beryllium and boron in samples
23. Map of Mt. Shasta Wilderness Study Area showing claim
locations
1v

TABLES
Table 1. Major component cones of Mt. Shasta stratovolcano
2. Chemical analyses of volcanic rocks of Mt. Shasta
3. Inverse modeling results of aeromagnetic anomaly over Mt. Shasta-
4. Magnetic properties of samples from Mt. Shasta
5. Inverse modeling results of aeromagnetic anomaly over Ash Creek
Butte
6. Trace-element analyses of selected samples of rocks, stream
sediments, and soils
7. Averages and ranges of selected trace elements in unaltered
volcanic rocks of Mt. Shasta
8. Zinc contents of selected samples -
9. Copper contents of selected samples
10. Beryllium contents of samples with highest background quantities-
11. Boron contents of samples with values above background

Studies Related to Wilderness
RESOURCE APPRAISAL OF THE MT. SHASTA
WILDERNESS STUDY AREA, SISKIYOU COUNTY, CALIFORNIA
By Robert L. Christiansen, Frank J. Kleinhampl, and
Richard J. Blakely, U.S. Geological Survey
and Ernest T. Tuchek, Fredrick L. Johnson,
and Martin D. Conyac, U.S. Bureau of Mines
SUMMARY AND CONCLUSIONS
The only potentially extractable resource of Mt. Shasta may be
geothermal energy, but the potential within the Wilderness Study Area is
low. Some sulfur and gypsum occur locally around active and extinct
fumaroles near the summit but are too small to indicate a resource.
Cinder deposits have been mined near the Wilderness Study Area, but
almost none are exposed within it. The levels of trace-metal anomalies
relative to background values and the amounts of exposed mineralized
rock are too small to indicate economic potential.
Mt. Shasta is the largest and one of the highest of Cascade vol
canoes. It is near the southern end of the Cascade chain, flanked on
the south and west by pre-Tertiary metamorphic and plutonic rocks. A
few pre-Tertiary rocks also are exposed near the north base of Mt.
Shasta, but the oldest exposures through a large region to the northeast
and east are Tertiary volcanic rocks. A complex negative gravity ano-2 maly of nearly 1,200 km extends east and northeast from Mt. Shasta.

Most rocks of Mt. Shasta are pyroxene andesites, emplaced in rough
ly equal proportions as lava flows and as blocky pyroclastic and debris
flows to build a typical stratocone volcano. Hornblende-bearing ande
sites are less abundant but widely distributed. Small amounts of basalt
or basaltic andesite form cinder cones and flows on the flanks of the
stratocone, and some dacites occur as volcanic domes, pumice, and sparse
lava flows. The stratocone and its subsidiary vents were built on older
basalts and andesites from various vents, some of which now lie beneath
the stratocone. The summit, at least two older central vents, and a
line of flank vents are located along a nearly north-trending slightly
arcuate zone parallel to the principal regional faults and to the gen
eral strike of pre-Tertiary rocks. Few faults displace the rocks of Mt.
Shasta itself.
The Mt. Shasta stratocone grew in at least four major episodes of
andesitic cone building. The earliest formed the Sargents Ridge cone,
which is older than 100,000 years and'now forms the south flank of Mt.
Shasta. Dacitic domes and flows were erupted from the summit and flanks
late in the Sargents Ridge activity, and some late basalts were erupted
from the lower flanks. The next younger major part of the Mt. Shasta
stratocone, the Misery Hill cone, is bracketed between the limits of
about 100,000 and 12,000 years. A dacitic dome and pumice flows repre
sent the last eruptions from its summit, and a few dacites and basalts
occur on the flanks. The third major cone to evolve was Shastina; its
central vent lies west of the other three central vents,and the Shastina
cone therefore looks more distinctly separate. Late dacitic domes and
blocky pyroclastic flows erupted within the summit crater and on the

flank of Shastina. The fourth and youngest part of the stratocone, the
Hot!urn cone, forms the summit and much of the northeast flank of Mt.
Shasta. Most of the Hotlum cone is less than 3,000-4,000 years old.
The summit crater is filled by a dacite dome, making the summit of Mt.
Shasta the youngest major eruptive unit of the volcano. Its continued
cooling sustains two areas of active fumaroles and a hot spring. A
lesser eruption may have occurred as recently as 1786.
A detailed new aeromagnetic survey shows a conspicuous band of
anomalies along the north-trending line of vents through the summit and
connects with an older volcano to the north and with a nearby buried
intrusion. These anomalies help delineate the structurally controlled
north-trending vent zone. Aeromagnetic anomalies associated with the
main part of Mt. Shasta and with Shastina were modeled numerically as a
magnetic source bounded by the topographic surface, showing the direc
tion of magnetization to be anomalous; if the bottom of the source is
assumed flat and horizontal, the main cone is substantially less magne
tic than Shastina. This disparity tentatively is interpreted to reflect
a rise in isotherms beneath the Hotlum cone, centered beneath the summit
and northeast flank of Mt. Shasta.
The Wilderness Study Area has a low potential for geothermal energy
resources. The following indications are favorable: (1) the youngest
major volcanic activity was less than 3,000-4,000 years ago, and some
eruptive activity may have occurred within the last two centuries. (2)
The emplacement of dacites late during each major cone-building phase
suggests the possible existence of dacitic magma chambers or solidified
but still-cooling shallow intrusive bodies. (3) Small active fumaroles

and a hot spring near the summit indicate high temperatures near the ,
surface; interpretation of aeromagnetic anomalies further suggests
somewhat elevated temperatures beneath the summit area. However, the
absence of areally significant hydrothermal activity on or near the
mountain, the probably high permeability of the hydro!ogic recharge zone
on the stratocone, and the steepness of slopes and instability of ter
rain in most of the Wilderness Study Area indicate that no major hydro-
thermal convection system is likely to exist at shallow depth within the
stratocone. Any significant potential for future geothermal development
is more likely to exist on and near the lower slopes of the volcano,
generally outside the study area.
Areas of intense but very localized hydrothermal alteration occur
in the central vent areas of each of the four main cones but virtually
nowhere else. Very small amounts of sulfur occur locally in these
areas, particularly around the fumaroles on the summit dome. Low-level
anomalies of some trace elements (lead, zinc, copper, and a few lighter
elements), only slightly above background, are associated with some of
the altered rocks in the central vent areas. Minor copper minerals are
visible on fracture coatings in the center of the Sargents Ridge cone.
The low level of the anomalies relative to background and the small
amounts of exposed mineralized rock indicate no economic potential.
The Mount Shasta Wilderness Study Area previously has been pros
pected for mineral deposits, but no commercial grade material was ever
found. Courthouse records show that three placer claims were located
for platinum. Twenty-four samples taken from the claimed areas con
tained no significant quantities of economic minerals. Almost no cinder
deposits are exposed within the Wilderness Study Area.

INTRODUCTION
Mt. Shasta is the dominant natural feature of Northern California
and has been a landmark since the first explorations of the region. The
current proposal to establish a Wilderness Area on a major part of the
mountain requires an evaluation of its potential for producing valuable
mineral or energy resources. Neither Mt. Shasta nor any other Cascade
volcano has yet been explored or thoroughly studied for its geothermal
potential; in particular no deep drilling has been done. For this reason,
more attention has been placed in this study on volcanic stratigraphy,
geologic history, and geophysical modelling than commonly is done by the
Geological Survey in wilderness studies. The resource appraisal presented
here consists of a geologic, geophysical, and geochemical study by the
Geological Survey and a study of existing mineral claims by the Bureau
of Mines.
Mt. Shasta is a volcano near the southern end of the Cascade vol-
Fig. 1.~N can j c chain of the Pacific Northwest (Fig. 1). Rising to an altitude of near here/ 3 ' 3
14,162 feet (4,319 m), Mt. Shasta is the second highest (to Mt. Rainier)
of the Cascade volcanoes and is the largest of all in volume; Williams
(1932, 1934) estimated its volume as 335 km3 .
The Mountain is encircled by roads, including Interstate Highway 5
v on the west, U.S. Highway 97 on the north, California State Highway 89
lf~ ulll/ on the south, and the unpaved Military Pass Road on the east (Fig. 2). near nere// A nai/orl li-i nhi.ia w +f\ 4-Ur* M4> CU->*-^-« Clx-t Dm.il ««1 <imU<- * /% *** -> 1 4--< * i«4^ *£A paved highway to the Mt. Shasta Ski Bowl climbs to an altitude of
\near hereFig. 3. \ about 8jOOQ feet (2,440 m ) On the south side of the mountain (Fig. 3),
and numerous unpaved timber access roads, many of them unmaintained,
give access to the lower parts of the mountain on all sides. The

Wilderness Study Area occupies mainly the upper slopes of the mountain
near and above timberline, which in this region is generally about 9,500
feet (2,900 m). On the northwest side of Mt. Shasta, the Wilderness
Study Area extends to near the level of the Southern Pacific Railroad
right-of-way at an altitude of about 5,000 feet (1,500 m).
Previous Studies
The geology of Mt. Shasta was first studied comprehensively by
Williams (1932, 1934), who prepared a small-scale reconnaissance geo
logic map, characterized petrographically the main eruptive products of,
the volcano, and recognized a north-south alignment of eruptive vents
across the flanks and summit of the volcano. Later petrologic and
geochemical studies of some of Mt. Shasta'.s lavas were made by Smith and
Carmichael (1968), Peterman and others (1970), Steinborn (1972), Condie
and Swenson (1973), and Anderson (1974). The only previous geophysical»
data covering Mt. Shasta and its immediate surroundings are gravity
surveys (LaFehr, 1965; Chapman and Bishop, 1967; Kirn and Blank, 1972).
Recently, detailed studies have been started of the youngest deposits of
the volcano, aimed at an evaluation of the volcanic hazards of Mt.
Shasta (Crandell, 1973; Miller and Crandell, 1975).
Present Study
Field work was done during three and a half months in the summer of
1975. It Included: (1) preparing a new geologic map of the Wilderness
Study Area (Fig. 3) and its surroundings (Fig. 2) at a scale of 1:62,500;
(2) a new aeromagnetic survey (Figs. 9 & 10); (3) sampling some of the
lavas for additional petrographic and chemical analyses (table 2); (4)
collecting samples of soils, stream sediments, and altered bedrock for

'geochemical characterization of any possible anomalies that might be
related to metallic mineral deposits (Fig. 16); and (5) field examina
tion of mining claims (Fig. 23) in and near the Study Area.
Responsibility for preparation of the report has been divided among
the authors. Christiansen wrote the introduction, the section on geo
logy, the section on geothermal energy potential, and is responsible for
overall coordination and for preparation of the summary and conclusions.
Blakely wrote the section on aeromagnetic data and interpretation,
Kleinhampl wrote the evaluation of potential for mineral deposits, and
Tuchek, Johnson and Conyac wrote the economic mineral appraisal. All
authors have helped revise the entire report for internal consistency
and accuracy.
Acknowledgments
We acknowledge the helpful cooperation of the U.S. Forest Service,
especially District Rangers Ronald Anderson and Dale Trail, in facili
tating field work and in accomodating some unavoidable delays in com
pleting the report. The main conclusions of the study reflect the
enthusiastic cooperation of C. D. Miller of the Geological Survey, both
in the field and in data interpretation. Miller's studies of Mt. Shasta
for evaluation of volcanic hazards, done simultaneously and in coordina
tion with ours, have been an essential part of the study of volcanism at
Mt. Shasta, reported here. Gerald K. Van Kooten ably assisted in the
field work. We thank Arthur Conradi for preparation of the topographic
data for aeromagnetic interpretation and Donald Plouff for helpful
discussions of the aeromagnetic modeling experiments.

GEOLOGY
Geologic and Geophysical Setting
Mt. Shasta lies near the southern end of the Cascade chain. Of the
major cascade volcanoes only Lassen Peak is farther south, and it is
offset from the continuous linear belt in which the other major vol
canoes of the chain occur (Fig. 1). Mt. Shasta, at the end of this
continuous belt, is adjacent to a mountainous terrane of Paleozoic and
Mesozoic plutonic and low-grade metamorphic rocks, the Klamath Mountains
province, south and west of the volcano. A few exposures of these pre-
Tertiary rocks also are present just north of Mt. Shasta, but eastward
toward the Medicine Lake Volcano and far beyond, the only exposed bed-
v rock consists of the products of Cenozoic volcanism. A sharp gravity Fig. 4.-X near here/ gradient (Fig. 4) marks the overlap between the Klamath Mountains province
and Mt. Shasta and its bordering volcanic terrane. The volcanic terrane
is marked in the Shasta region by a complex relative gravity low that2 extends over an area of nearly 1,200 km , well beyond Mt. Shasta itself,
to include the area northeast and east as far as the Medicine Lake
volcano although the latter is marked by a smaller positive gravity
anomaly within the larger gravity low. The significance of this large
negative gravity anomaly is uncertain, but it may relate to the configu
ration of the plutonic-magmatic underpinning of this part of the Cascades
(for example, see Heiken, 1976). Whether this larger gravity feature
reflects an active zone of magmatism within the crust is conjectural,
but there is ample geologic evidence of very young volcanism within the
zone that is marked by this gravity feature. A conspicuous positive
aeromagnetic anomaly is associated with the mountain (Figs. 9 & 10).
Volcanism of Mt. Shasta
Mt. Shasta represents a complex volcanic history, more varied than
the massive volcanic stratocone might seem to imply (Christiansen and
Miller, 1976). At least four distinct episodes of cone building are
clear. Each of these episodes appears to reflect a relatively brief
time (less than a few thousand years) of rapid eruption of pyroxene-
andesite lavas and pyroclastic breccias from a single central vent,
followed by a more protracted period of continued pyroxene-andesitic to
more silicic volcanism from the summit and from flank vents. Generally,
the longer periods of time between the principal cone-building episodes
were dominated by erosion of the stratovolcano.
Rocks and types of volcanic units. By far the greatest proportion
of Mt. Shasta's volcanic rocks are pyroxene andesites. Typically both
hypersthene and augite are present as phenocrysts although'one or the
other may be relatively sparse or even lacking in some rocks. In most
of the pyroxene andesites, plagioclase is also a conspicuous and abun
dant phenocryst mineral, but in a few it is absent or (especially on the
lavas of Shastina) present only as very small (1/2 - 1 mm) phenocrysts.
Silica contents of the andesitic generally are between about 60 and 63
percent (table 2). A variety of types of inclusions is present in these
pyroxene andesites, but the most abundant are fine- to medium-grained
mafic dioritic inclusions that consist of plagioclase and hypersthene
(+. augite). Partial melting effects are texturally evident in some of
these inclusions. Other common inclusions include a variety of meta-
sedimentary and plutonic rock types. Commonly the pyroxene andesite
flows succeed one another with little or no evidence of erosion.

m
During the later stages of most of Mt. Shasta's major cone-building
episodes, eruption of pyroxene andesites from the central vent alterna
ted with eruption of hornblende-bearing andesites. The latter generally
are similar in appearance to the pyroxene andesites. Hornblende common
ly occurs as rather sparse phenocrysts along with the two types of pyro
xene, but in some units hornblende becomes the dominant mafic phenocrysti
mineral and augite or both augite and hypersthene phenocrysts may be
absent. The hornblende phenocrysts commonly are hollow and have cores
of plagioclase; in somewhat oxidized lavas, the phenocrysts generally
are oxyhornblende. Typically these rocks have fewer inclusions than
many of the pyroxene andesites. Numerous local unconformities give
ample evidence of erosion on the cone during the times of eruption of
the hornblende andesites.
The andesites occur in similar proportions both as lava flows and
as blocky diamictons (very poorly sorted clastic deposits with high
proportions of both fine-grained matrix and large blocks commonly to
10-30 cm, but in many instances to more than 1 m). The diamictons have
a variety of origins, and many can be distinguished by features diagnos
tic of their diverse origins (Crandell, 1971; Crandell and Mullineaux,
1975). Many of these poorly sorted rubbly deposits have angular to
subangular clasts and a friable fine-sandy matrix, show common evidence
of emplacement at higher-than-ambient temperatures (oxidation rinds or
prismatic jointing on blocks, pinkish-colored tops to emplacement units,
etc.), and are almost totally unsorted but distinctly tabular in overall
form. These features indicate emplacement as pyroclastic flows; textu-
rally most would classify as block-and-ash flows. They generally do
10

'not, tiowever, have glassy shards or pumice as do most ash flows erupted
as fragmental ejecta from the vent. These block-and-ash flows generally
appear to be hot-avalanche deposits formed by the catastrophic shatter
ing and collapse of materials erupted first as lavas. Other diamictons
commonly have at least some rounded to subrounded clasts, have a compact
silty or clayey matrix, may or may not show evidence of high-temperature
emplacement, and typically have at least a degree of sorting (particular
ly near their tops or distal margins). These deposits appear to have
been emplaced as debris flows of volcanic material; some of them may
relate to specific eruptions, especially when the cones were covered by
snow and ice, but others may be related to avalanching on the unstable
slopes of the volcano during noneruptive times, perhaps related to
rapid melting of snow and ice on the slopes of the stratocone while it
was still hot, to earthquakes, or to climatically triggered slumping.
Growth of Mt. Shasta by the accumulation of both lava flows and
blocky pyroclastic and debris flows have given it the principal features
characteristic of the great stratocone volcanoes.
Besides the andesites, which constitute the bulk of the stratocone,
there are also more mafic and more silicic volcanic rock types. Basalts
and basaltic andesites occur only on the flanks of the stratocone below
altitudes of about 7,000 ft (2,100 m). They typically form cinder
cones, but some also make extensive blankets of mafic ash. Some occur
as lava flows whose sources clearly are the cinder-cone vents. These
basalts or basaltic andesites generally have small phenocrysts of
plagioclase, olivine, and augite (+ hypersthene).
11

The silicic rocks are dacites, generally light in color and with
phenocrysts of plagioclase and mafic minerals. The latter are quite
varied; some dacites have only hypersthene or only hornblende, but most
have both and others also contain augite. Quartz has not been identi
fied as a phenocryst mineral in any of them. The dacites typically form
cumulodornes, rather steep-sided accumulations of viscous lava that did
not spread very far laterally. However, some of the dacitic vents did
erupt continuously long enough to have produced thick lava flows. Some
of the dacites were erupted as pumice and form both fallout and pumice-
flow deposits. Silica contents of the dacites generally are between
about 63 and 66 percent (table 2). Inclusions are common in the da-
cites, and in some domes they are quite abundant. The inclusions are
generally of fine-grained igneous rocks, commonly more mafic than the
dacites themselves.
The great stratocone. of Mt. Shasta lies among and above several
smaller older volcanoes characterized by almost shield-like forms.
These volcanoes, including The Whaleback, Ash Creek Butte, and Everitt
Hill (fig. 3), are formed of generally dark basalts, basaltic andesites,
and pyroxene andesites. In addition to the volcanoes just named, there
are similar flows that emerge from beneath the south base of Mt. Shasta
and indicate that several of these older volcanoes existed at or near
the site of Mt. Shasta before the stratocone was built. It is not clear
whether there was a direct genetic connection between these older lavas
and the Mt. Shasta pyroxene andesites.
12

Structural controls. Williams (1932, 1934) first noted a conspi
cuous alignment of vents on Mt. Shasta that extends approximately north-
south through the summit. Further mapping (Figs. 2 & 3) confirms this
nearly linear arrangement of vents although it also defines the exis
tence of many other vents that are not on this trend. The north-trend
ing alignment extends from Signal Butte on the south, northwards through
McKenzie Butte, Gray Butte (and perhaps Red Butte if the zone is considered
to have a width of about 1 km), Misery Hill, and the Summit (fig. 3); the
alignment extends northeastward through North Gate and a series of
dacitic domes both southwest and north of it. This zone includes nu
merous dacitic domes, several basaltic cinder cones, a mixed dacite-
olivine andesite vent, and a lava cone of olivine andesite.
Williams (1932, 1934) recognized that this alignment parallels a
major regional structural trend in stratified pre-Tertiary rocks south
and west of Mt. Shasta and suggested that the alignment was controlled
by the strikes of those rocks. The new aeromagnetic survey (see later
section) helps delineate this trend and also shows that it extends
beyond Mt. Shasta and its own flank vents, making the likelihood of a
fracture or fault control parallel to regional trends seem more likely
than the strikes of stratified units. Faults parallel to this trend are
mapped in pre-Tertiary rocks and in older Cenozoic volcanic rocks south
east of Mt. Shasta although few of them appear to displace the rocks of
the stratocone itself.
13

Williams also suggested that the summit of Shastlna and a partly
buried vent just to the east (Fig. 2) might lie on an east-west trend
that intersects the north-south trend at Mt. Shasta's summit to deter
mine the location of the stratocone. No additional evidence for this
east-west alignment has been found, and (as shown in the next section)
the main eruptive center of Mt. Shasta has moved four times during the
growth of the stratocone; the oldest of these centers lies off the
suggested trend. Furthermore, the new mapping shows that there are
numerous vents on the north and west flanks of the volcano, suggesting
that Shastina and the nearby vent may only be fortuitously aligned with
the present summit.
The reconnaissance mapping of Williams (1932, 1934) did not resolve
the major age differences between parts of the cone. Local strati graphic
relations suggested to Williams that eruptions along the north-trending
alignment of vents were the youngest major events on the main cone of
Mt. Shasta. Our mapping indicates that the dacites and basalts of
this zone, as well as those on the north and west sides of Mt. Shasta,
all represent late stages in their local sequences but that they collec
tively represent ages spanning most of the stratocone. We conclude that
the north-trending zone represents structural control for repeated erup
tive events at Mt, -Shaita; ir> parts of the volcanic plumbing system that
lay beyond this control (mainly on the north and west sides of the
system) vents were distributed more nearly randomly or were controlled
by structures of lesser extent.
14

I .History of vo1can1sm. Mt. Shasta evolved over more than 100,000
years. Detailed definition of the cycles in this evolutionary history
and their dating have only begun, but some major conclusions are appa
rent and have important implications for the resource potential of the
Wilderness Study Area. The geologic mapping and stratigraphy represented
by figures 2 and 3 have been generalized from more detailed work, still
only partially completed, both by us and by C. D. Miller of the U.S.
Geological Survey.
The Mt. Shasta stratovolcano consists of four or more major over
lapping cones; at least the oldest of the four may represent more than
one evolutionary cycle in the growth of the stratocone. For descriptive
convenience as well as stratigraphic clarity, we have given informal
Table l~\names to the four major component cones so far recognized (Table 1). near here/
The oldest cone recognized on Mt. Shasta is centered around upper
Mud Creek and is represented prominently by Sargents Ridge, for which it
is named (Figs. 2,3,5). A conspicuous feature around upper Mud Creek,
upper Sargents Ridge, and the east side of upper Avalanche Gulch is a
northward to northwestward dip of lavas and pyroclastic layers. This
dip is inward, toward the present summit, and clearly cannot represent
flows of lava, hot rubble, or muddy debris from a central vent near the
near hery Present summit (Fig. 5). Mapping shows that these dips represent only
one sector of a radially outward-dipping sequence that was erupted from
a central vent just east of upper Sargents Ridge and southwest of the
Konwakiton Glacier. Upper Sargents Ridge as far as Thumb Rock (Fig. 5),
represents an eroded crater rim concentric to this center. Hornblende
andesites are particularly abundant in the upper units of the Sargents
Ridge cone, and a dacite dome about 1.5 km south of the Konwakiton
15

-X -' " '" '|ro >Glacier (table 2 and fig. 5) was the last lava erupted within its summity crater. Numerous late-stage flank vents erupted dacite and a few erupted
basalt or basaltic andesite.
Work by C. D. Miller shows that soils on the lower flanks of the
Sargents Ridge cone, beyond the limits of Pleistocene glaciation, are
older than the last major glaciation of this region; furthermore, older
glacial deposits have been found on these flows at two localities. On
the east side of Mud Creek just below Clear Creek, till probably older
than the last major glaciation overlies block-and-ash flows of the
Sargents Ridge cone and may be overlain by others. On Interstate High
way 5, just north of Black Butte, an old till that must have come from
ice on Mt. Shasta overlies volcanic rocks that also probably came from
Mt. Shasta. These relations demonstrate that parts or all of the Sargents
Ridge cone are older than 100,000 years. This older part of Mt. Shasta
may actually represent more than one evolutionary cycle.
The second major cone of Mt. Shasta that we have recognized was
centered near the present summit, and part of an old summit dome is
preserved on Misery Hill, for which the cone is named (Figs. 2,3,6).
Lavas and blocky deposits from this central vent poured across the north
ward-dipping flows of the Sargents Ridge cone in upper Mud Creek but
were prevented by the partially preserved summit rim of the older cone
from covering its southern flank. Misery Hill lavas and blocky deposits
extend far to the west, north, and east, some of them emerging from
beneath younger lavas. The west rim of the Misery Hill summit crater is
partly preserved from the head of Avalanch Gulch around the west side of
near here/the uPPer WJv* tney Glacier (Fig. 6). Late dacitic domes and basaltic
cinder cones were erupted on the flanks of this cone. The youngest
16

'units'erupted from the central vent were a dacitic dome (partly pre
served on Misery Hill) that filled part of the summit crater, and pumice
flows of the Red Banks, which can be mapped over much of the preserved
surface of the Misery Hill cone (Fig. 6). Some of these pumice flows
and related fallout deposits are recognized farther north on the flanks
of the cone, where they emerge from beneath lavas of the two younger
cones.
Flows of the Misery Hill cone, even well beyond the limits of
glaciation, show soil development comparable to soils formed since the
last major glaciation (C. D. Miller, oral communication, 1975-1976);
however, the cone was extensively eroded during the last glaciation.
Therefore, the cone dates largely from the early part of the last gla
ciation. Late-stage evolution of the volcano, during which summit and
flank eruptions of dacite and basalt occurred infrequently, continued
through the last glaciation. The last known deposit of the Misery Hill
cone, the pumice of Red Banks, overlies moraines of a minor late Tioga
or post-Tioga glacial advance that probably occurred between about
12,000 and 10,000 years ago.
The third major cone of the Mt. Shasta stratovolcano is Shastina
Fig. 7--*VFigs. 2,3,7). Because it was erupted from a central vent at some near here/
distance from the other three major cones, Shastina is more obviously
distinct than the others. Most of Shastina consists of dark pyroxene-
andesite central-vent lava flows with only small phenocrysts of pi agio-
el ase (but conspicuous pyroxenes). These flows are quite uniform in
appearance and also strongly resemble a lava-flow field erupted from a
flank vent on the north side of Shastina at an elevation of 5,900 ft
(1,800 m). This flow field (named Lava Park by Williams, 1934) clearly
belongs to Shastina although it was not erupted from the central vent.
17

Many people have regarded the Lava Park flow as very young, estimating
its age from the oldest trees growing on it. However, examination of
soils on wind-deposited silt within the blocky top of the flow exposed
in railroad cuts reveals that it is comparable in age to the other
Shastina flows. Williams (1934) also regarded at least one other flow
on the northwest side of Shastina, and by implication many of the others
as well, as having been erupted from flank vents (see Williams, 1934, p.
236-237; figs. 1,3). Remapping and study of aerial photographs shows
clearly that the feature regarded by Williams as a vent is the levee of
a flow channel in a lava flow erupted from Shastina's summit. This
levee stood high enough to deflect a younger Shastina flow laterally and
to form a conspicuous oblique ridge on the northwest flank of the cone
(Fig. 7).
The age of the Shastina cone is better known than that of any of
the others; cone-building occurred rapidly, in a few thousand years or
less. The flows on the north side of Shastina overlie pumice .lithologi-
cally identical to the pumice of Red Banks (notably including the banding
of compositionally distinct types; see Eichelberger, 1975), which is
known to be younger than rock-glacier deposits estimated to be between
10,000 and 12,000 years old. Distinctive Holocene soils are found on
the lavas and deposits of Shastina (C. D. Miller, oral communication,
1975-1976). The youngest Shastina eruptive events emplacement of a
complex of dacitic domes into the summit crater, lateral explosions and
hot avalanches from those domes to produce a fan of block-and-ash flows
below Oilier Canyon, and the eruption of the Black Butte dome complex14 and related block-and-ash flows have been dated by C techniques and
give ages within a range of 9,400 £ 200 years (Miller and Crandell, 1975;
C. D. Miller and R. L. Christiansen, unpublished data).
18

The youngest part of Mt. Shasta is its summit and north and north-
\ east flank, formed entirely by lava flows erupted from a central vent at
near here^tne Prgsent summit (Figs. 2,3,8). The lower parts of most of these
' flows emerge from beneath the active Bolam, Hot!urn, and Wintun Glaciers,
but flow levees of several of the largest flows can be traced back up
the higher flanks of the cone toward the summit. The youngest major
unit erupted from this cone, named the Hot!urn cone, is a dome that fills
the summit crater; the dome itself contains an irregular linear crater
that may reflect explosion or collapse at the vent or disintegration of
its core under the attack of acidic fumarolic vapors.
Outcrops of the lower ends of flows from the Hot!urn cone overlie
lavas and block-and-ash flows of the Misery Hill cone and generally show
only weak soil formation. .Late Neoglacial moraines, probably less than
1,000-2,000 years old, lie beyond the present termini of the-active gla
ciers on the Hot!urn cone but are not flanked by older Neoglacial moraines,
3,000-4,500 years old, although joint work with C. D. Miller shows that
their equivalents occur elsewhere on Mt. Shasta even where conditions
for ice accumulation are poorer. Therefore, the Hot!urn lava flows prob
ably postdate early Neoglacial ice advances of 3,000 to 4,500 years ago;
several of the lava flows may be younger than 1,000 years. Preliminary14C dating of volcanic events probably related to the Hot!urn cone indi
cates that some of its eruptions occurred at least as recently as about
200 years ago (C. D. Miller and R. L. Christiansen, unpublished data).
The summit dome is the youngest major unit of Mt. Shasta and still has
active fumaroles and a small acid hot spring. Fumarole temperatures at
10 separate small vents were measured in July, 1975 at 84°C, probably
19

boiling temperature for these add waters at the altitude of 4,270 m,
thus Indicating that the summit dome probably Is still cooling. It 1s
possible that an eruption of Mt. Shasta was observed from the Pacific
Ocean In 1786 although the source of that eruption has not been iden
tified clearly (Finch, 1930).
20

? ' AEROMAGNETIC DATA AND INTERPRETATION
A detailed aeromagnetic survey of the Mount Shasta region was flown
In 1975, by commerlcal contract. The final compiled data consist of two
contour maps; one surrounds the main mountain and was flown at an eleva-
\. tlon of 2,600 m (Fig. 9), and a second was flown directly over Mount Fig. 9JO--X,near herei/Shasta at an elevation of 4,400 m (Fig. 10). For both surveys, the
flightlines were east-west and spaced approximately 1.6 km apart, with
two north-south tie lines. Location of the data was accomplished with
aerial photographs taken at intervals of approximately 1.2 km for the
low survey and 0.7 km for the high survey.
To prepare the contour maps of figures 9 and 10, the contractor (1)
edited obvious machine errors, (2) identified air photos with known
surface features, (3) filtered the data (4) adjusted flightlines to
agree with the tie lines, (5) removed the IGRF regional field updated to
1975, and (6) contoured the data with an interpolation algorithm.
Most of the obvious anomalies are associated in a general way with
topographic features such as Mount Shasta, Shastina, Rainbow Ridge,
Black Butte, and Ash Creek Butte. Other anomalies, such as the one over
The Whaleback, do not correlate with topography, and interpretation of
these anomalies is not as straightforward.
Analysis of the data is summarized here in two steps. First the
major anomalies are described, and second a series of inverse and for
ward modeling experiments are presented for three of the most prominent
anomalies: Mount Shasta (including Shastina), Ash Creek Butte, and The
Whaleback. Several principal results, constrained by the simple assump
tions of the models, were found: (1) the direction of magnetization of
Mount Shasta is anomalous, suggesting either that Shastina is more magnetic
21

than the main part of the stratocone or that the Curie-temperature iso
therm rises beneath the main summit; (2) part of The Whaleback appears
to be reversely magnetized, and two rather large sources of magnetism
lie buried near its south flank; and (3) the magnetization of Ash Creek
Butte is concentrated in the lower part of the mountain and probably
extends to substantial depth.
Description of the Aeromagnetic Anomalies
A striking feature of the low-elevation map (Fig. 9) is the north-
south trend of short-wavelength anomalies, extending entirely across the
map. This trend of anomalies overlies a trend in volcanic centers
extending north from near Everitt Hill (anomaly A), including Mount
Shasta, and terminating over The Uhaleback (anomaly B). The magnetic
sources producing this chain of anomalies are very near the surface and
probably correspond in a general way to the recent extrusive material
around the vents that coincide with this trend. The anomalies over
Mount Shasta and The Whaleback are discussed later in more detail.
The shoulder of a large positive anomaly is apparent in the extreme
southwest corner of the low-elevation map (Fig. 9, anomaly C). This is
probably caused by the edge of the Mesozoic mafic and ultramafic masses
that are prevalent west and southwest of the aeromagnetic map area
(Strand, 1963). Aeromagnetic profiles from near the Mount Shasta region
were discussed by Irwin and Bath (1962), and they also observed a cor
relation between large anomalies and these mafic and ultramafic bodies.
About 8 km north of this anomaly is a moderately large positive
anomaly over Rainbow Ridge (Fig. 9, anomaly D). Using the width of
constant gradient as a rough estimate of depth to the source (Peters,
1949), we calculate the source to be near the surface. This was unsus-
22

pected because outcrops at Rainbow Ridge are Mississ.ippian marine sedi
mentary rocks and Mesozoic metavolcanics (Strand, 1963), materials that
have relatively low magnetizations. For contrast, compare the anomaly
over Rainbow Ridge with the anomaly over Black Butte, about 5 km farther
north (Fig. 9, anomaly E). Black Butte is a 9,000 year-old volcanic
plug of relatively more magnetic dacite, yet, compared to Rainbow Ridge,
the anomaly is small in amplitude. This suggests that more magnetic
material, perhaps part of the ultramafic and mafic complex exposed
farther west, lies at shallow depth beneath the surface of Rainbow
Ridge.
In the northwest quadrant of the low-elevation map (Fig. 9, anomaly
F) is a broad, low-amplitude, negative anomaly. The southeastern corner
of this anomaly also appears on the high-elevation map (Fig. 10). The
-600-gamma contour of this anomaly in figure 9 traces the field of ande-
sitic flows on the northwest side of Shastina. The negative sense of
the anomaly suggests that the flows could be reversely magnetized. To
investigate this possibility, a detailed study was conducted to deter
mine their paleomagnetic polarities. Forty-nine oriented cores were
collected from eight separate flow units, cleaned by alternating-field
demagnetization, and measured with a spinner magnetometer. The average
direction of magnetization of all 49 samples has an inclination of 49.9°
and a declination of 5.7°, with a 95% cone-of-confidence radius of 4.2°.
While this direction is not aligned precisely with either the geocentric
dipole or the present earth's field, it does not deviate sufficiently to
produce the observed negative anomaly, and other explanations must be
considered. For example, a thick sequence of material with relatively
low magnetization, such as pyroclastic deposits, may underlie this part
23

of Shastlna to cause the negative anomaly. A second possibility is that
the anomaly 1s an edge effect produced by highly magnetic rocks of a
buried mafic and ultramafic complex that is exposed just to the south
west. A. Griscom (oral commun., 1976) has shown by modeling experiments
with aeromagnetic data over this mafic and ultramafic sequence that the
negative anomaly can be explained by postulating that the ultramafic
rocks dip at a low angle beneath the flank of Mount Shasta.
Modeling Experiments
Three of the most prominent anomalies of the survey area were
examined in detail by modeling experiments. The source of each of the
anomalies was approximated by a body with the topographic surface as its
upper boundary and with a flat lower surface. As a first assumption,
the magnetization of the source was assumed to be uniform. Then a
"best" magnetization vector was calculated using a least-squares inver
sion from the observed total-field anomaly. Although this is basically
the procedure commonly used to successfully model anomalies over sea-
mounts (e.g. Vacquier and Uyeda, 1967; Harrison et a!., 1975), any
geologist would question the assumption of uniform magnetization of
volcanoes in the Mount Shasta area. Consequently, a second step was to
examine the residual anomaly, the difference between the observed ano
maly and the anomaly calculated from the best single magnetization; the
residual represents the errors due to the simple assumptions of shape
and uniform magnetization. The residual anomalies either were modeled
in forward calculations (i.e., by assuming various shapes and magne
tizations, calculating new anomalies, and comparing the computed ano
malies visually and statistically to the observed anomaly) or they were
Interpreted 1n terms of the geology.
24

The computer program used for both the inverse and forward modeling
was developed by Donald Plouff (1975, 1976) and is a sophisticated ver
sion of the method described by Talwani (1965). The program requires
that the topographic relief be approximated by a series of horizontal
layers, each with vertical sides and polygonal edges. Several statis
tical parameters are calculated to indicate the precision of the fit.
One of these is the "coefficient of multiple correlation", which is
unity if the calculated and observed field are in precise agreement and
zero if there is no agreement. (See Plouff, 1975, for a mathematical
discussion of this parameter.) A normalized standard deviation (S) is
also computed to measure the difference between the observed and cal
culated anomalies. Let the anomaly at point i be h. and the cal
culated anomaly at the same point be h. 1 . Then
N 9.Vhi-v>2N
where N is the total number of field points. S will be zero for perfect
agreement between calculated and observed anomalies. This parameter is
the reciprocal of the "goodness ratio" described by Vacquier and Uyeda
(1967).
The length of the best-fit magnetization vector represents the bulk
magnetization of the body. Care should be used in attaching physical
significance to this number, however, because it is very sensitive to
the assumed size of the body. For example, doubling the three dimensions
of the source decreases the magnetization by approximately a factor of
eight, depending somewhat on the height of the survey above the source.
25

Fig. near her
Table 3-- near here
Fig. 12. near her
Mt. Shasta: Figure 11 shows the digitized approximation to the
topography of Mount Shasta. Although as many as 23 layers were used for
the modeling, figure 3 shows only the top 15. For reference, the layers
are numbered from top to bottom; layers 1 through 7 define the main peak
of Mount Shasta, layers 8 through 10 define the peak of Shastina, and
layers 11 through 15 are lower on the mountain.
Table 3 summarizes the various attempts to calculate the magneti
zation using inverse modeling. It is clear from table 3 that a source
composed of all 23 layers is not a satisfactory model. By successively
deleting layers from the top and bottom, the optimum model was found to
be layers 1 through 15, with a multiple correlation coefficient of 0.93>and a normalized standard deviation of 0.37. Figure 12 shows the resi
dual anomaly remaining after subtracting the anomaly due to all 15
1ayers.
There are two very pertinent results from this experiment. First,
because the entire mountain is normally magnetized and therefore less
than 0.7 million years in age, we expect the direction of the remnant
component of magnetization to be very close to the direction of a field
produced by a geocentric dipole (inclination =61°, declination =0°).
Induced components of magnetization will parallel the regional field of
the area (inclination - 65°, declination =19°). But the direction
determined by least squares differs substantially from any combination
of these directions (inclination = 45.0°, declination = 51.3°).
This discrepancy can be explained in at least three ways. The
first is by tectonic rotation of the mountain, which we discount on
geologic grounds. The second is by an error in the location of the
26

anoma-ly relative to the topography. We have reexamined the aerial
photographs and the contractor's analog data and find no evidence of
this type of error. The third and most likely explanation is that either
the assumption of uniform magnetization or the assumed shape of the
source is too simple. For example, if the distribution of magnetization
is such that the anomaly is displaced relative to an anomaly produced by
uniform magnetization, the naive assumption of uniform magnetization
calculates a spurious direction.
The second pertinent observation appears in the residual map of
Figure 12. The low residual anomaly over the main peak of Mount Shasta
and the high residual over Shastina suggest that Shastina could be
substantially more magnetic than the rest of Mount Shasta. To inves
tigate that possibility, various forward models were tried by varying
the magnetization of the layers. With J = 0.0152 emu/cc for Shastina
(layers 8 through 10) and J = 0.00152 emu/cc for the remainder of the
mountain, the fit improves considerably and has a standard deviation of
0.32. Within the constraints of this simple model, Shastina is more
magnetic than the remainder of the mountain by a factor of ten. It is
of interest to note that to obtain this excellent fit it was necessary
to maintain the anomalous direction determined by least squares. For
^^^ comparison to the model result, magnetic analyses of 12 rock samples Table 4.^> near here/Trom various locations on the mountain are presented in table 4. The
oaverage value of susceptibility for all rocks is 0.075 x 10 , and there
is no statistical difference between the susceptibility of Shastina
samples (0.071 x 10"3 ) and other Mount Shasta samples (0.079 x 10"3 ).
For remanent magnetization, the average of all rocks (excluding those
suspected on the basis of demagnetization experiments to have been
27

Fig. 13.-near- here
<Table 5 near hereFig. near
struck by lightning) is (0.201 x 10 ) emu/cc, and there 1s no statis-q
tlcal difference between Shastlna samples (0.220 x 10 emu/cc) andq
other Mount Shasta samples (0.186 x 10 emu/cc).
The contradictory results of the modeling experiments and the mag
netic analysis suggest something fundamentally different about Shastina
and the main peak of Mount Shasta (Blakely and Christiansen, 1976).
Perhaps the interior of Mount Shasta beneath the summit has a larger
fraction of pyroclastics than Shastina, thereby reducing its magneti
zation. A second possibility is that the Curie-point isotherm rises
beneath the Hotlum cone, effectively decreasing the size rather than the
magnetization of the magnetic source beneath the summit. No heat-flow
data exist to prove or disprove this idea, but fumarolic activity near
the summit of Mount Shasta is not matched on Shastina. Moreover, the
Hotlum volcanic episode, from which the summit dates is at least 4,000-
8,000 years younger than the Shastina episode, and magma may still exist
at shallow depths beneath the summit of Mount Shasta.
Ash Creek Butte: The largest anomaly of the entire survey area is
located over Ash Creek Butte in the northeastern quadrant of Figure 9
(anomaly H). Ash Creek Butte is a glaciated late Cenozoic basaltic-
andesite volcano.
Figure 13 shows the digitized approximation to the topography of
Ash Creek Butte, and Table 5 provides the results of inverse models>using different combinations of layers. As before, layers are numbered
nsecu^ve^ ̂rom *°P *° k°ttom * Tne best ro°de l (^9« 14) consists of
only the bottom two layers, suggesting that the magnetization of Ash
Creek Butte is concentrated near its base; I.e., below an elevation of
1,952 m. This two-layer model provides a correlation coefficient of
28

'0.92 and a standard deviation of only 0.39. Moreover, the residual
field shown in figure 14 is very smooth compared to the observed anomaly
(fig. 9). This excellent fit is surprising in view of the simplicity of
the model.
The intensity of magnetization for this two-layer model, however,
is 0.0297 emu/cc which is unreasonably large for common volcanic rocks.
This number could be reduced by lowering the bottom of the source to
greater depths, thereby increasing its volume, and this would probably
not substantially deteriorate the least-squares fit. But in order to
reduce the magnetization to a more reasonable value, say 0.01 emu/cc,
the bottom of the body must be placed nearly 1.5 km below the base of
the butte. We suggest that the substructure of Ash Creek Butte is an
intrusive plug; although there is no direct evidence for such a conclu
sion, it is geologically reasonable.
The Whaleback. A third set of large anomalies (Fig. 9,, anomaly
B), is associated with The Whaleback, a double-peaked volcanic butte
composed of Quaternary basalts and andesites. A moderately large posi
tive anomaly lies over the main western peak, but the anomaly over the
eastern peak is negative. Geologic reconnaissance suggests that the
eastern peak is somewhat older than the western one, and the negative
aeromagnetic anomaly suggests that it probably is older than 700,000
years, the time of the latest geomagnetic reversal. The picture is
confused, however, by two large anomalies, one negative and the other
positive, which lie just to the south of each peak but too far away to
be related simply to the topography.
29

\ The topography of The Whaleback was approximated digitally (Fig.5 \, , , . .. .. ire >15) and the anomalies were inverted to obtain an optimum magnetization
' vector. The correlation coefficient for this experiment was only 0.56
and the normalized standard deviation was 0.82. This poor fit implies
that the assumption of a uniformly magnetized source confined by the
topography is not adequate. As -a preliminary interpretation, we suggest
that the two northerly anomalies are produced by the two peaks of The
Whaleback and that these are of different ages. The sources of the two
southerly anomalies are postulated to be at shallow depth below the sur
face, and perhaps are buried intrusive bodies. The western buried
source is reversely magnetized.
Summary
Many of the aeromagnetic anomalies of the Mount Shasta area are due
to sources with shapes controlled largely by the topography. The aero
magnetic data suggest however, that there may be buried sources beneath
Rainbow Ridge (ultramafic rocks) and south of The Whaleback (buried
shallow intrusive bodies). A regional feature of the aeromagnetic map
is a nearly linear, north-south trend of anomalies correlated with
volcanic centers from near Everitt Hill through Mount Shasta to The
Whaleback. Within the Wilderness Study Area, there is no evidence from
the aeromagnetic data of any body of igneous rock that might be mineralized,
Hodeling experiments using the anomaly over Mount Shasta (including
Shastina) show that (a) the average direction of magnetization is anoma
lous, and (b) the main peak is substantially less magnetic than Shastina.
The latter observation is tentatively interpreted as a rise in isotherms
under the summit area.
30

I.r J
' The anomaly over Ash Creek Butte is the largest of the survey area,
and model calculations suggest that the source Is concentrated at and
below the topographic base of the butte. The actual source may be a
burled Intrusive mass such as a mafic volcanic plug, but it must be
substantial in size.
Our inverse results are rather complicated when compared with the
more straightforward results from the same technique on seamounts (e.g.,
Harrison and others, 1975). The difference results partly from our
higher density of data (flightlines spaced only 1.6 km apart as compared
typically to a few shiptracks) and from the greater proximity of our
magnetometer to the source (81 m from the summit of Mount Shasta as
compared typically to several hundred meters from seamounts). But at
least part of the difference probably arises because land volcanoes are
indeed more complex than seamounts. Vacquier and Uyeda (1967) made
similar observations when they compared inversion results from nine
Pacific seamounts with those from three land volcanoes in Japan. The
processes building typical stratovolcanoes and typical seamounts are
fundamentally different just as oceanic crust is fundamentally different
from continental crust.
31

RESOURCE POTENTIAL
Geothermal Energy
The only areas of development or active exploration for geothermal
resources in the United States are associated either with young silicic
volcanic rocks or with regions of exceptionally high heat flow in exten-
sional tectonic zones. Such areas include The Geysers, the Imperial
Valley, the Coso Mountains, and Long Valley in California; the region of
northern Nevada, southeastern Oregon, and southern Idaho; Roosevelt Hot
Springs, Utah; and the Valles caldera, New Mexico. To date, the largest
geothermal systems with the highest temperatures in the Unitad States
and elsewhere generally have been found to be associated with young
silicic volcanic fields (Smith and Shaw, 1975). There has been rela
tively little active geothennal interest in the andesitic stratovol-
canoes of the United States, but regions characterized by such volcanoes
are being explored or exploited for geothermal energy in Indonesia, the
Philippines, Japan, Kamchatka, Mexico, Central America, and elsewhere.
None of the Cascade volcanoes has yet been explored or studied
in detail for its geothermal potential, and no significant information
from drilling exists. In the absence of detailed geophysics and good
subsurface data, the only approach to evaluating the potential of a
volcano such as Mt, Shasta for possible geothermal resources is to use
geologic and regional geophysical data to interpret possible subsurface
conditions and to suggest areas for more specific exploration. This is
the approach adopted here for Mt. Shasta.
32

Several geologic and geophysical indications are favorable to the , possibility of a geothermal resource associated with Mt. Shasta. First,
the revised volcanic history and stratigraphic dating indicate that
a major phase of volcanism, the Hot!urn episode, is younger than 3,000-
4,000 years, and perhaps is only 1,000-2,000 years old. The possibility
of an eruption less than 200 years ago has been widely known since the
brief note of Finch (1930). These factors, along with the active small
hydrothermal features near Mt. Shasta's summit, suggest a viable heat
source beneath the summit and northeastern sector. Second, the repeated
history of emplacement of dacitic domes and flows at the summits of each
of the four successive cones of Mt. Shasta, as well as along the flanks
of at least three of them, during their waning stages of activity show
that silicic magma has been introduced repeatedly to shallow levels.
Since such silicic magmas, emplaced during the late stages of cone
building, may represent the products of magmatic differentiation in high-
level magma chambers, and since these silicic magmas (regardless of
origin) are generally more viscous and may tend to accumulate more
readily in crustal magma chambers than the andesites, there is a high
probability that such chambers were formed within or just below the
volcanic edifice during four separate episodes. At least the youngest
of these is likely to still be at solidus temperature, and at least two
of the others are less than 100,000 years old and probably are still hot
although solidified. Third, the presence of two small active fumarolic
areas and an acidic hot spring near the summit clearly indicate high
temperatures at shallow levels within the volcano. The favored aero-
magnetic interpretation suggests that the main cone of Mt. Shasta is
hotter at shallow depths than Shastina, lending credence to the indirect
geological evidence of a viable heat source.
33
Balanced against these favorable indications, additional geological
features tend to indicate that any geothermal resource is more likely to
be within drilling depth around the flanks of the volcano, outside the
Wilderness Study Area, than directly beneath the main cone. First, the
very small hydrothermal features near the summit are the only such
manifestations at the surface anywhere on the stratocone. Any large
hydrothermal convection system at shallow depth within the cone would be
expected to have obvious manifestations. Second, Mt. Shasta is a major
site of precipitation, mainly as a deep winter snowpack, and is a prin
cipal groundwater recharge area of the region. High porosities and
permeabilities of both the lava flows and the blocky pyroclastic flows
that constitute most of the stratocone are indicated by the intermittent
character of most drainages from the mountains. This high permeability
and the lack of significant weathering or alteration in most of the
cone which might have created locally impermeable clay-rich zones-
suggest that precipitation on the stratocone is largely transmitted with
little delay to the groundwater aquifers around it and does not tend to
reside long enough in the cone to favor the development of significant
hydrothermal convection. Third, the elevation, steepness of slopes,
instability of frequently snow-covered slopes, lack of suitable con
struction sites s and greater necessary depth of drillino to any probable
heat sources all make the likelihood of an exploitable geothermal resource
directly beneath the main stratocone and the Wilderness Study Area seem
remote.
34

In combination, the foregoing interpretations suggest that a geo-
thermal resource could exist at depths that could be drilled from Mt.
Shasta's lower flanks, but in the absence of significant surface hydro-
thermal features, heat-flow measurements, or pertinent geoelectric
studies such a possibility cannot be confirmed. One possibility might
be the long-range feasibility of extraction of energy from hot dry rocks
in the pre-Tertiary basement beneath the lower flanks of the volcano,
especially on the north side, where pre-Tertiary rocks are exposed
closest to the youngest part of the stratocone. It is unlikely that any
economic geothermal resource would be located beneath the Mt. Shasta
Wilderness Study Area.
35

Mineral Deposits
Regional distribution and general features. -The "forty-niner" era
of gold mining and exploration inaugurated by the 1848 discovery of gold
at Sutter's Mill, California, along with discoveries on the Trinity
River southwest of Mt. Shasta the same year, gave impetus to exploration
for metal throughout California (Clark, 1966, p. 181). Shortly there
after, Mount Shasta and the surrounding region undoubtedly were pros
pected intensively. It is obvious from the near absence of prospect
pits on Mount Shasta that no favorable indications were found.
Mineral deposits nearest to Mount Shasta include base- and pre
cious-metal, asbestos, chromite, iron, manganese, and quicksilver to
the west and south in the Klamath Mountains province (Albers, 1966,
figs. 4,5). The nearest of these deposits are within 20-25 km of Mount
Shasta, and all are in pre-Cenozoic rocks. Two other precious-metal
districts about 115 km east of Mount Shasta, the Hayden Hill and Winters
districts, are in Tertiary volcanic rocks. Closer by, mining has been
confined to numerous industrial mineral deposits, such as perlite,
pumicite, obsidian, cinders, and sand and gravel (Chesterman, 1956;
Gay, 1966, fig. 2 and p. 97).
Prospect pits and other artificial disturbances common to minera
lized regions are very rare in the study area. The only mining opera
tion in the area is a small volcanic-cinder pit at the south edge of
sec. 34, T. 41 N., R. 3 W., that has been quarried for the road metal
used on some timber access roads. Other cinder pits are located near
but outside the study area.
36
Exposed bedrock on the lower flanks of Mount Shasta within the
study area 1s generally unaltered. Exposed altered areas are mostly 1n
tjie core areas of the four component cones of the stratovolcano, near
the summits of Mount Shasta and Shastina and on the north end of Sar-
gents Ridge and upper Mud Creek. The altered zones examined on Sargents
Ridge consist of widespread iron-oxide-stained rocks and local irregular
patches of weakly siliclfied material. Bleached and weakly propylitlzed
rocks extend northeast across Mud Creek. Some of the altered areas
represent sites of past thermal-spring or fumarolic activity. Cur
rently, fumaroles near the summit of Mt. Shasta are depositing sulfur;
gypsum veins of slightly greater extent occur around the summit areas of
Mt. Shasta and Shastina.
Veins are very scarce; most commonly they are fracture-fillings.
The prevalent filling material is iron oxide, with lesser chalcedony or
vein quartz. None of the veins are large, persistent, or abundant. The
largest ones found are near the head of Brewer Creek (at sample locality
75SK-65, fig. 16 lab. no. LDA-096) and consist of quartz-filled fractures
only a few meters long and a few centimeters thick. Some discontinuous
anastomosing chalcedonic quartz veinlets occur in irregular zones within
flows in the same area.
37

Geochemical Exploration
Methods : A total of 128 samples, Including 48 stream sediments, 53
altered rocks or fracture coatings, 21 unaltered volcanic rocks, and 6
soils, were crushed If necessary and sieved. The minus 80-mesh fraction
was analyzed by a semi quantitative 6-step emission spectrographlc method.
This scan provided initial data on 30 trace elements that are typical of
many metalliferous mineral deposits and data on 5 other common elements
(iron, magnesium, calcium, titanium and manganese). Analytical data for Table 6.- near here"11* 116 **3^ 26^ samples are given in table 6.
Obviously mineralized samples, and samples found by the initial
spectrographic scan to contain unusually large amounts of some trace
metals, were further analyzed by more sensitive methods for antimony,
arsenic, copper, gold, mercury and zinc.
All samples were analyzed in laboratories of the U.S. Geological
Survey. N. M. Conklin of the Analytical Laboratories Branch performed
most of the spectrographic analyses; a remaining seven were analyzed by
L. Mai. J. D. Hoffman of the Field Services Section analyzed for mercury
using a mercury detector; J. Crock did the atomic absorption-analyses
for copper and zinc; G. Riddle and Crock analyzed for arsenic by a
graphite-furnace atomic-absorption method; Burrow analyzed for antimony
by a rhodamine B method; and Crock, Hafftey, and Haubert obtained fire-
assay and atomic-absorption analyses for gold.
The field sampling procedure was to collect stream-sediment samples
systematically and to collect altered rocks or fracture coatings where
ver they were noted. Twenty-one bedrock samples from nonmineralized
localities, including 7 of the more silicic rocks, were selected to re
present the main volcanic units for background contents of trace elements
38

Table 7^x;near her£s'(tab'\e 7). Background values were established by empirically evaluating
the analyses of the unaltered volcanic rocks and by comparison to the
apparently mineralized samples as well as to general backgrounds and
averages for similar intermediate and mafic volcanic rocks of other
areas (Hawkes and Webb, 1962, Rankama and Sahama, 1950, and Parker,
1967).
Fig. 16.--^ Figure 16 indicates the sample density for all types of samples; near here/
/ coverage of the area is fairly uniform. Nonuniform distribution of
certain sample types results from the localized absence of collectable
materials rather than from a nonuniform distribution of sample localities
The stream sediments represent integrated samples of the upper
parts of the stratocone; however, not all streams heading in the moun
tain were sampled. Stream-sediment samples were taken at a general
spacing of about 400-800 m along the major stream courses,, with a range
in spacing of 200-2,000 m. Each stream-sediment sample generally is a
composite of material selected from along about 3-15 m of stream course.
Some samples are from a single site; others are composites from several
sites scattered along as much as 400 m of stream bottom. Sediments were
taken from the beds of active streams, from terrace deposits adjacent to
active streams, or from beds or terraces of dry stream channels. Fine
material was taken wherever possible. For each sediment sample, an
attempt was made to collect and mix light minerals with concentrations
of heavy minerals. Many samples were collected at or adjacent to natural
riffles or where good sediment traps existed.
39

Altered rocks sampled were either from bedrock in the summit areas
of the four major cones or from random float material in landslide,
colluviurn, or reworked glacial deposits. Such float material is assumed
to represent the higher altered-bedrock parts of the study area.
The main aspects of mineral-deposit trace-element distribution in
the study area are summarized below, and details are shown on accompany
ing maps and tables. These analyses in general corroborate the field-
geologic appraisal of an absence of significant mineral deposits.
Precious Metals (gold and silver). No precious metals were detec
ted in any samples at sensitivity levels of 0.7 ppm for silver and 0.05
ppm for gold.
Base Metals (lead, zinc, and copper). The highest lead and zinc
contents obtained are barely above background. In most samples, lead
and zinc were not detected in the initial spectrographic scans. SamplesFig. 17.->near herewith lead contents as great as 20-30 ppm are rare (fig. 17). The high
est highest lead content (225 ppm) was found in a sample (LDA-103) with
secondary copper-bearing minerals on a fracture coating in an andesite
flow. Another similar sample (LDA-104) contained 70 ppm lead. A "soil"
sample (LDA-048) contained 150 ppm.
Zinc was detected during routine emission spectrographic analysis
in only one sample (LDA-103), which contained visible copper minerals.Table 8^>>near here/Subsequent atomic-absorption analyses of selected samples (table 8}
showed zinc contents ranging from 8 to 283 ppm in unaltered volcanic
rocks or fracture coatings, stream sediments, and soils. There is
little difference in the average zinc content of the different types of
samples. Background values for Mt. Shasta are considered to be less
than 70 ppm, lower than for mafic igneous rocks in general, given as 130
ppm by Hawkes and Webb (1962, p. 376).
40

Four of 26 samples of altered rocks or fracture coatings contain
zinc contents above local background (table 8). The data indicate that
zinc is low everywhere; even the highest of the four anomalous values is
only 283 ppm, and it was obtained from a sample carrying secondary
copper minerals in veinlets. Seven of 15 stream-sediment samples contain
zinc above background. Five of the seven lie in the southeastern qua
drant of the study area (fig. 17), in the Mud Creek drainage, which is
the most deeply eroded part of Mt. Shasta and has the highest proportion
of altered and mineralized rocks. Only one soil sample (LDA-049) of a
total of 6 contains zinc above the 70 ppm background; the sample local
ity lies just south of the Wilderness Study Area and, like the stream-
sediment samples with relatively high zinc, is the Mud Creek drainage.
Copper was detected in a number of samples during the routine spec-
trographic scan, and in others during subsequent atomic-absorption
near here /analyses (table 9). Background copper values lie below about 32 ppm.
One-half of 26 samples of altered volcanic rocks or fracture coatings
contain no more than background copper, and most of the rest contain no
more than 62 ppm. Samples with the highest values come from the north
end of Sargents Ridge and upper Mud Creek; the two highest are from
samples with fracture coatings of secondary copper minerals. Most of
the relatively high values are from the southeastern quadrant of the Fig. 18.~> neer here /study area (fig. 18) in a belt trending north from near Red Butte to the
summit of Mount Shasta. In the Sargents Ridge-upper Mud Creek area
sparse bedrock and float samples are found containing secondary copper
minerals such as malachite, azurite, and chrysocolla(?). Two samples
(LDA-103 and -104) were collected from coatings along minor fractures
and as disseminated minerals within a few centimeters of the fractures.
Table
41

Stream-sediment samples generally contain only background copper values;
one sample (LDA-014) having 34 ppm copper, is slightly above the some
what arbitrarily defined background threshold and also came from near
Sargents Ridge. The copper content of sampled soils is not especially
great; the highest value is 48 ppm, and the 3 of 5 samples with above-
background copper are from widely scattered localities.
Arsenic and antimony. Arsenic and antimony can be useful geoche-
mical indicators of precious metals, and arsenic commonly is associated
with copper and cobalt in sulfide deposits (Hawkes and Webb, 1962). In
the Mount Shasta Wilderness Study Area, arsenic and antimony in all
analyzed samples are below the limit of detectibility by the emission
spectrographic method. More sensitive analytical methods were used on
51 samples, atomic-absorption for arsenic and rhodamine B for antimonyFig. 19-\,near here>(f1g. 19)-
Only 6 of the 51 samples contain more than 2.4 ppm arsenic, which
is considered to be background threshold. All the arsenic values are
low. By far the highest, 24 ppm in sample no. LDA-048 is from a very
small area of friable altered regolith material in the Misery Hill
summit dome. This sample also contains the highest antimony (0.9 ppm)
of any sample. Antimony in the 51 samples ranges from <0.1 to 0.9 ppm;
7 samples contain values slightly above the background of 0.4 ppm. Four
altered volcanic rocks have slightly anomalous quantities of both ar
senic and antimony. Most samples with arsenic or antimony above back
ground lie near the central vents of the four main cones of Mt. Shasta,
particularly on the Sargents Ridge cone.
42

Table near here\
Fig. 20.- near here
Other metals (Mo, Bi, Sn, Be, Hg, Ni, Cr and V). Slightly high
amounts of molybdenum were found in several samples collected in the
summit areas and in the Mud Creek drainage. Five of the determined
values of molybdenum are considered to be barely above background for
the area, ranging from 3 to 10 ppm (fig. 18). Repeat analyses on four
other samples with 3-5 ppm molybdenum did not detect any of the metal.
The sample with the highest content (10 ppm, LDA-096) came from a mildly
altered dacite in the Brewer Creek drainage. Nearby samples of similar
rocks contained only background amounts of molybdenum. A "soil" sample
(LDA-048) with relatively high molybdenum was collected in the summit
area of Shastina. This sample also contains the only detectable bismuth
(10 ppm), as well as one of the highest lead, arsenic, and antimony values
of all the samples. The "soil" is actually intensely decomposed and
argillized rock from an inactive fumarolic area. Tin was detected at 20
ppm in a single sample bearing visible disseminated specularite, an
amount well above the average of 6 ppm in mafic igneous rocks (Hawkes
and Webb, 1962, p. 373). About a dozen samples carried detectable
beryllium, which generally did not exceed 2 ppm (table 10, fig. 21).
The background value is considered to extend up to about 3 ppm, because
Be in several unaltered rock samples approaches this limit. Lanthanum
was detected in four float rock samples from the Sargents Ridge area at
20 to 30 ppm; three unaltered rock samples also contained about 22-25
ppm La. The amounts are slightly high for the study area, but are
within background values for volcanic rocks (Hawkes and Webb, 1962, p.
367). Ten samples of rock carry relatively high amounts of mercury, »'ranging from about 0.10 to 0.40 ppm (fig. 20). Nearly all the samples
43
with relatively high mercury are associated with the central-vent areas
near the summits of Shasta and Shastina, where anomalously high contents
of other metallic elements are noted and where boron was also detected.
The mercury as well as boron probably relate to fumarolic or thermal-
\ spring activity. Numerous samples contain slightly high quantities ofFig. 21-\near here/nickel and chromium (table 6, fig. 21); vanadium (table 6, fig. 21) is
present in quantities as large as 700 ppm. All these values for chro
mium, nickel, and vanadium are background amounts, but some are slightly
high backgrounds.
Nonmetallic deposits. Of the nonmetallic elements, boron proved
the most interesting. Twelve samples yielded 30 or more ppm, and five Fig. 22--^near hereof these samples contained 100-250 ppm (fig. 22, table 11). These are Table ll-> near hereyill associated with vent areas near the summits of the four cones of Mt.
Shasta and probably relate directly to thermal-spring or fumarolic
activity. However boron does not occur on the mountain in large volumes or high concentrations. Sulfur is present in megascopic quantities
around a few of the known thermal springs, where it has precipitated in
a crystalline form admixed with siliceous sinter.
Conclusions. The results of geochemical-exploration sampling in
the Mt. Shasta Wilderness Study Area reflect alteration patterns related
mainly to the central-vent areas of the four major volcanic cones.
Samples with relatively high amounts of trace metals are mostly clus
tered in (or derived from) these altered areas. None of the trace
metals analyzed are exceptionally high in concentration, but they do
suggest a spotty low-grade mineralization of the volcanic centers. No
orebodles of metallic minerals are likely to be present.
44

Rocks beneath the study area, even at considerable depth, are
almost entirely parts of the volcanic complex of Mount Shasta. Metallic
mineral deposits are no more likely to be concealed at depth than to
occur at the surface. It is not possible to discount the presence of
buried nonmetallic deposits, but the low value per production unit ofi
the kinds of industrial minerals likely to occur makes economic recovery
of buried nonmetallic deposits infeasible.
45

Economic Mineral Appraisal ' ;
The Mount Shasta Wilderness Study Area has been prospected for
mineral deposits by prospectors, but no commercial-grade material has
been found. Volcanic-cinder deposits just outside the area have been
mined for many years, but almost none occur within it. Sulfur occurs
around fumaroles on the summit dome of Mount Shasta but is not in suf
ficient amounts to be a resource.
Three unpatented placer claims, located primarily for platinum, arehltX- &**" r£mC.Z
in, or partially within, the study area. The claimsAare- inactive/x A
Samples from them contained no platinum. None of the world's commercial
platinum deposits is known to occur in a similar geologic environment.
Sampling and Analytical Techniques. Twenty four grab or random
chip samples were taken from the claimed areas. No mineralized struc
tures were observed on any of the claims. All samples were analyzed for
gold, silver, platinum, and checked for radioactivity and fluorescence.
Seven were analyzed by semiquantitative spectrographic methods for 43
elements.
Mining Claims. Courthouse records at Yreka, California, show that
\three placer claims were located at least partly within the study area Fig. 23-\near here/(fig. 23). The three claims, located in 1924, 1925, and 1956, cover 480
acres (194 h) or 160 acres (65 h) each. No prospect pits or mine work-
Ings were observed on any of the claims. No lode claims were found in
the area.
46
Name.: Glacier No. 1 placer
Index Map No.: 1-A and 1-B
Location; This claim consists of two parcels, 6 miles (9.7 km) apart.
One parcel, 1-A, is in the study area on the west boundary. The second
parcel, 1-B, is about 1 mile (1.6 km) east of the boundary.
Elevation: Parcel 1-A at 9,000 to 10,000 feet (2,743 to 3,048 m), 1-B
at 6,000 feet (1,829 m).
Access: Logging roads within 1.25 miles (2 km) of parcel 1-A, and cross
parcel 1-B.
History: Claim located by G. H. Thompson, Nov. 3, 1924, for platinum.
Previous production: None
Geology of deposit: Parcel 1-A - rhyolite, dacite, andesite, and tuffs
ranging in color from dark gray to light reddish brown. Parcel 1-B -
light-gray to dark-gray andesite and light-gray pumice. No mineralized
rock observed.
Development: None
Sampling: Eight samples were taken from outcrops and float on parcel
1-A and two samples were taken from outcrops at parcel 1-B. The
samples contained no platinum or other metallic values.
Conclusions: The property has no economic mineral potential.
47

Name: Glacier No. 2 placer
Index Map No.: 2
Location: The claim is near the east boundary, within the study area.
Elevation; 7,000 to 7,600 feet (2,134 to 2,316 m).
Access: Logging roads within one-fourth mile (0.4 km) of claim.
History; Claim located by G. H. "Thompson, Jan. 12, 1925, for platinum.
Previous production: None
Geology of deposit: Light-gray to dark-gray andesite. No mineralized
rock observed.
Development; None.
Sampling: Three samples taken from rock exposed contained no platinum
or other metallic values.
Conclusions; The property has no economic mineral potential.
48

Name:' Lotus placer
Index Map No.: 3
Location: The claim is mostly outside the southern boundary of the
study area.
Elevation: 7,700 to 9,800 feet (2,347 to 2,987 m).
Access: Paved road to ski lodge located on claim.
History: Claim located by Thomas D. Chace, September 23, 1956, for
platinum.
Previous production: None
Geology of deposit: Glacial outwash and moraines consisting of rhyolite,
dacite, and andesite. No mineralized rock observed.
Development: Ski area
Sampling: Twelve samples taken of float contained no platinum or other
metallic values.
Conclusions: The property has no economic mineral potential.
49

REFERENCES CITED
Alters, J. P., 1966, Economic deposits of the Klamath Mountains, in
Bailey, E. H., ed., Geology of northern California: Calif. Div.
Mines and Geology Bull. 190, p. 51-62.
Anderson, A. T., Jr., 1974, Evidence for a picritic volatile-rich magma
beneath Mt. Shasta, California: Jour. Petrol., v. 15, p. 243-267.
Blakely, R. J., and Christiansen, R. L., 1976, The magnetization of
Mt. Shasta [abs]: Am. Geophys. Union Trans. (EOS), v. 57, p. 903.
Chapman, R. H., and Bishop, C. C., 1967, Bouguer gravity map of California,
Alturas sheet: Sacramento, Calif. Div. Mines and Geol.
Chesterman, C. W., 1956, Pumice, pumicite, and volcanic cinders in
California: Calif. Div. Mines Bull. 174, 119 p.
Christiansen, R. L., and Miller, C. D., 1976, Volcanic evolution of Mt.
Shasta, California: Geol. Soc. America, Abstracts with Programs, v. 8,
no. 3, p. 360-361.
Clark, W. B., 1966, Gold i_n_ Mineral and water resources of California: Pt.
1: Committee Print. 89th Congress, 2d session, 450 p.
Condie, K. C., and Swenson, D. H., 1973, Compositional variation in three
Cascade stratovolcanoes: Jefferson, Rainier, and Shasta: Bull. Vole.,
v. 37-2, p. 205-230.
Crandell, D. R., 1971, Postglacial lahars from Mount Rainier Volcano,
Washington: U.S. Geol. Survey Prof. Paper 677, 75 p.
Crandell, D. R., 1973, Hot pyroclastic-flow deposits of probably Holocene
age west of Mount Shasta volcano, California: Geol. Soc. America,
Abstracts with Programs, v. 5, no. 1, p. 28.
50

Crandell, D. R., and Mullineaux, D. R., 1975, Technique and rationale of
volcanic-hazards appraisals in the Cascade Range, Northwestern United
States, iii Environmental Geology: New York, Springer-Verlag, p. 23-32.
Eichelberger, J. C. 1975, Banded andesitic bombs of Mt. Shasta, California:
Geol. Soc. America, Abs. with Programs, v. 7, no. 7, p. 1065-1066.
Finch, R. H., 1930, Activity of a California volcano in 1786: Volcano letter,
no. 308, p. 3.
Gay, T. E., Jr., 1966, Economic mineral deposits of the Cascade Range,
Modoc Plateau, and Great Basin region of northeastern California, in
Bailey, E. H., ed., Geology of northern California: Calif. Div. Mines
and Geol. Bull. 190, p. 97-104.
Harrison, C. G. A., Jarrard, R. D., Vacquier, V., and Larson, R. L.,
1975, Paleomagnetism of Cretaceous Pacific seamounts: Geophys. J.,
v. 42, p. 859-882.
Hawkes, H. E., and Webb, J. S., 1962, Geochemistry in mineral exploration:
Harper & Row, N. Y., 415 p.
Heiken, G., 1976, Depressions surround volcanic fields: A reflection of
underlying batholiths?: Geology, v. 4, p. 568-572.
Irwin, W. P., and Bath, G. D., 1962, Magnetic anomalies and ultramafic rock
in northern California, in Short Papers in the Geologic and Hydrologic
Sciences: U.S. Geol. Survey Prof. Paper 450-B, p. B65-B67.
Kirn, C. K., and Blank, H. R., Jr., 1972, Bouguer gravity map of California,
Weed Sheet: Sacramento, Calif. Div. Mines and Geol.
LaFehr, T. R., 1965, Gravity, isostasy, and crustal structure in the southern
Cascade Range: Jour. Geophys. Res., v. 70, p. 5581-5597.
51
Miller, C. D., and Crandell, D. R., 1975, Postglacial pyroclastic-flow depo
sits and lahars from Black Butte and Shastina, west of Mt. Shasta, Cali
fornia: Geol. Soc. America, Abstracts with Programs, v. 7, no. 3, p. 347-
348.
Parker, R. L., 1967, Chapt. D. Composition of the earth's crust, in
Data of Geochemistry, Sixth-Ed.: U. S. Geol. Survey Prof. Paper
440-T, 19 p.87 86 Peterman, Z. E., Carmichael, I. S. E., and Smith, A. L., 1970, Sr /Sr
ratios of Quaternary lavas of the Cascade Range, northern California:
Geol. Soc. America Bull., v. 81, p. 311-317.
Peters, L. J., 1949, The direct approach to magnetic interpretation and its
practical application: Geophysics, v. 14, p. 290-320.
Plouff, D., 1975, Derivation of formulas and Fortran programs to compute
magnetic anomalies of prisms: U.S. Dept. Commerce N.T.I.S. Rep.
PB-243, 525 p.
Plouff, D., 1976, Gravity and magnetic fields of polygonal prisms and
application to magnetic terrain corrections: Geophys., v. 41, p. 727-
741.
Rankama, Kalervo and Sakama, Th. G., 1950, Geochemistry: Univ. Chicago
Press, Chicago, 912 p.
Shapiro, L., 1975, Rapid analysis of silicate, carbonate, and phosphate rocks-
revised edition: U.S. Geol. Survey Bull. 1401, 76 p.
Smith, A. L., and Carmichael, I. S. E., 1968, Quaternary lavas from the
southern Cascades, Western U.S.A.: Contr. Mineral, and Petrol., v.
19, p. 212-238.
52

Smith,' R. L., and Shaw, H. R., 1975, Igneous-related geothermal systems j£
White, D. E., and Williams, D. L., eds., Assessment of geothermal re
sources of the United States 1975: U.S. Geol. Survey Circ. 726, p. 58-
83.
Steinborn, T. L., 1972, Trace element geochemistry of several volcanic
centers in the High Cascades: Univ. Oregon, unpub. M. S. thesis.
Strand, R. G., compiler, 1963, Geologic map of California, Weed Sheet:
Sacramento, Calif. Div. Mines and Geology.
Talwani, M., 1965, Computation with the help of a digital computer of
magnetic anomalies caused by bodies of arbitrary shape: Geophysics,
v. 30, no. 5, p. 797-817.
Vacquier, V., and Uyeda, S., 1967, Paleomagnetism of nine seamounts in
the western Pacific and of three volcanoes in Japan: Bull. Earth
quake Res. Inst., v. 45, p. 815-848.
Williams, H., 1932, Mount Shasta, a Cascade volcano: Jour. Geol., v. 45,
p. 417-429.
Williams, H., 1934, Mount Shasta, California: Zeitschr. Vulkan., v. 15,
p. 225-253.
53

us 1
- 4-S*
BRITISH COLUMBIA

MILITARY PASS ROAD
WEED
SIM4&Cen**oic.
Volcanic, rocks
4-1'3o'

' I.
Figure 8. Photograph of the Hot!urn cone. Aerial view from the north
showing lava flow from central vent emerging from beneath
Hot!urn Glacier. Summit is dome that fills the central-vent
crater.
Figure 9. Aeromagnetic map of the area surrounding Mount Shasta. Contours
represent total field anomaly calculated by subtracting the
IGRF regional field updated to 1975. Contour interval is 20
gammas, and flight altitutde was 2,600 m above sea level.
Figure 10. Aeromagnetic map of Mount Shasta. Contours represent total
field anomaly calculated by subtracting the IGRF regional field
updated to 1975. Contour interval is 5 gammas, and flight alti
tude was 4,400 m above sea level.
Figure 11. Digitized approximation to the topography of Mount Shasta.
Numbers identify layers. Elevations in feet of the tops of
the layers, in order of increasing layer number, are 14,080,
13,920, 13,600, 13,200, 12,800, 12,400, 12,000, 12,240, 12,240,
12,000, 11,600, 11,200, 10,800, 10,000, and 9,200. The four
X symbols locate the corners of the residual map of Figure 12.
Figure 12. Residual field resulting from inverse model of Mt. Shasta aero-
magnetic data using layers 1 through 15 of figure 11. Contour
interval is 25 gammas. Plus symbols show the location of field
points used in the inversion.
Figure 13. Digitized approximation of the topography of Ash Creek Butte.
Numbers identify layers. Elevations in feet of the tops of
the layers, in order of increasing layer number are 8,240, 8,000,
7,600, 7,600, 7,200, 6,800, 6,400, and 6,000. The four X symbols
locate the corners of the residual map of Figure 14.

FIGURE CAPTIONS
Figure 1. Index map showing Mt. Shasta In relation to the Cascade chain.
Stipple, Quaternary volcanic rocks of the Cascade Chain.
Figure 2. Generalized geologic map of Mt. Shasta.
Figure 3. Geologic map of the Mt. Shasta Wilderness Study Area.
Figure 4. Bouguer gravity map of Mt. Shasta and the surrounding region.
After LaFehr (1965), Chapman and Bishop (1967), and Kirn and
Blank (1972).
Figure 5. Photograph of Sargents Ridge and upper Mud Creek. Aerial view
northward across the eroded crater of the Sargents Ridge cone,
overlapped at head of Mud Creek by flows of the Misery Hill cone.
Ridge left of center is Sargents Ridge; point at upper end of
Sargents Ridge, profiled against Konwakiton Glacier, is Thumb
Rock. Lavas and breccias beneath Thumb Rock dip- away from the
camera toward the summit of Mt. Shasta.
Figure 6. Photograph of Misery Hill, upper Avalanch Gulch, and the Mt.
Shasta summit. Aerial view northeastward showing eroded crater
rim of Misery Hill cone on the left. Misery Hill, below the
summit snowfield and left of the large southeast-facing snow-
field, is a dome within the Misery Hill crater, mantled by
pumice flows of the Red Banks.
Figure 7. Photograph of Shastina and the Mt. Shasta summit. Aerial view
from the northwest showing cone of Shastina (foreground, just
below horizon); the Whitney Glacier, just behind, lies between
the Mt. Shasta summit and the eroslonally breached crater rim
of the Misery Hill cone. Prominent oblique line on the slope
of Shastina just above timber!ine is margin of flow from the
Shastina central vent deflected westward by high levees of older
Shastina flow.

'Figure 14. Residual field resulting from inverse model of Ash Creek Butte
aeromagnetic data using only layers 7 and 8 of Figure 13. Con
tour interval is 200 gammas. Plus symbols show the location of
field points used in the inversion.
Figure 15. Digital approximation to the topography of The Whaleback. Num
bers identify layers. Elevations in feet of the top of the
layers, in order of increasing layer number, are 8,440, 8,400,
8,200, 8,000, 7,800, 7,600, 8,000, 7,800, 7,400, 7,000 and
6,400 feet.
Figure 16. Locations, sample numbers, and types of geochemical-exploration
samples, Mount Shasta Wilderness Study Area. Outline of study
area is indicated.
Figure 17. Lead and zinc in samples. Outline of Mount Shasta Wilderness
Study Area is indicated.
Figure 18. Copper and molybdenum in samples. Outline of Mount Shasta
Wilderness Study Area is indicated.
Figure 19. Arsenic and antimony in samples. Outline of Mount Shasta Wilder
ness Study Area is indicated.
Figure 20. Mercury in samples. Outline of Mount Shasta Wilderness Study
Area is indicated.
Figure 21. Chromium, nickel, and vanadium in samples. Outline of Mount
Shasta Wilderness Study Area is indicated.
Figure 22. Beryllium and boron in samples. Outline of Mount Shasta Wilder
ness Study Area is indicated.
Figure 23. Map of Mount Shasta Wilderness Study Area showing claim locations,


r i
V *>.*^N ,* V , \ » t.i» l. . - * "f- \ ,

ACftOMMNCrtC **
CMTtt ! 1MMMM ftllATlV* 1» Ml MWTMMV WTVM H*Om>C TKH* H ICATI JIMM 0» LOVC1I IMTCWMTT.
RESIDUAL MAGNETIC INTENSITY
MT. SHASTA, CALIFORNIA
U.4 WOLOOKAL SUffVCT
AttEA >*
I I I I I Io 2 t

SSfd

FIG. A)
KH..H.TION l-KlP MMIMKTIC
MMNETK CONTOlim SHOWIN* TOTAL INTEMWTY MMNETC FIELD OF
THE EANTM W CAMMAS KLATIVE TO Ml AMITRAHV DATUM. HACHUME TKKS .NDICATE AftEA, OF LOWB. .HTEH.TY.
A MCBIONAL TMENO OF T.Tt CAMMAS/MILE MONTH MM *«« 8AIHMSAB1E FLI4MT LINE tMClM ONE MILEEA»T «M MEMOVEO UWM» M.H.F. UTOATCD TO JOLT l»Tt. MAP SNOW* TITIIBB ---.-. -OWMINAL COMPUTE* DftAWN COHTOtMS. ruiwtl MLIIIUHK ....... . . ... .l«^*>
FLO«N COMPILED. ......... JOLT MTSDATUM *»! OF U.SM.4 AT LOW EM LEFT HAND COKMCM.
AEMAL MWVtrt. *. L.C. , UTAH
IM.LE. RESIDUAL MAGNETIC INTENSITY
SHASTA, CALIFORNIA
^ U.S.GCOLOGICAL SURVEY
AREA >'
FLMMT PATH JMOWINtt LOCATION AND SPACIM OF MTA
km

N


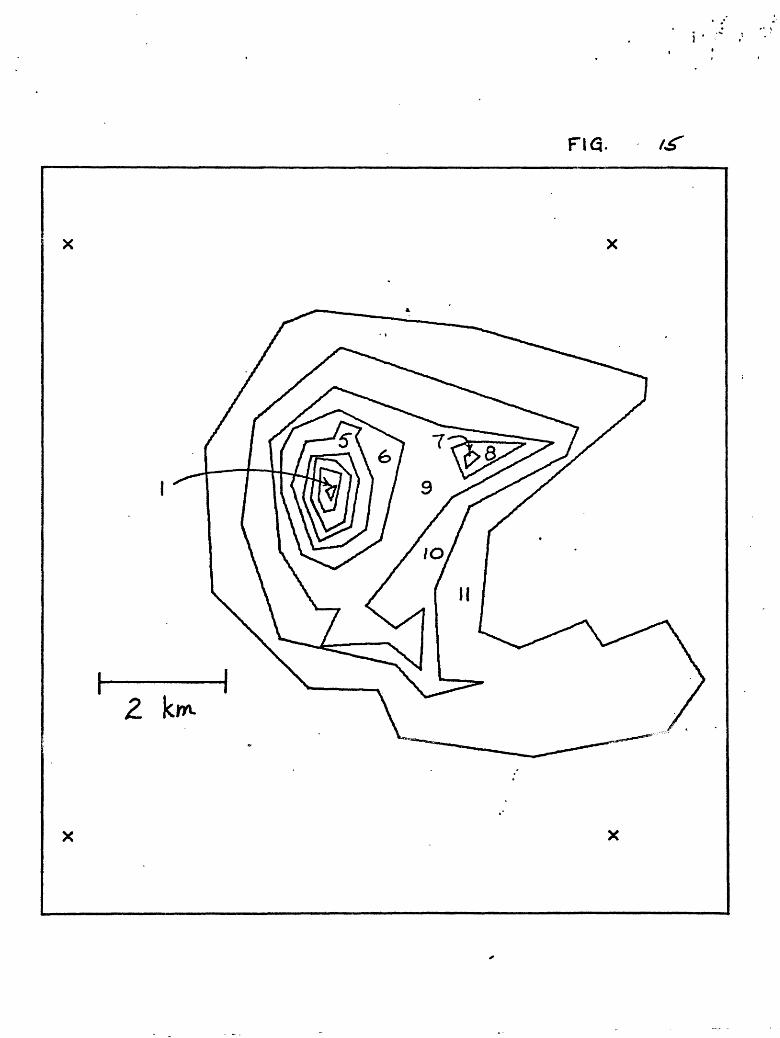
FIG.
2 k

JlCOr
-i»
*>
* *»
rO tf>>
" I *»
5* SI
+
.ut
'ix;
^'-
<
M- J t »,^
V


EX
PL
AN
AT
ION
Ifacft
cilie
J
SAM
PLE
LOCA
LITY
AND
TYP
EO
I
1
3 *
B

EX
PL
AN
AT
ION
o
Stre
am
SAM
PLE
TYPE
O I
Z.
9
ft3.
16

y
EX
PL
AN
AT
ION
D
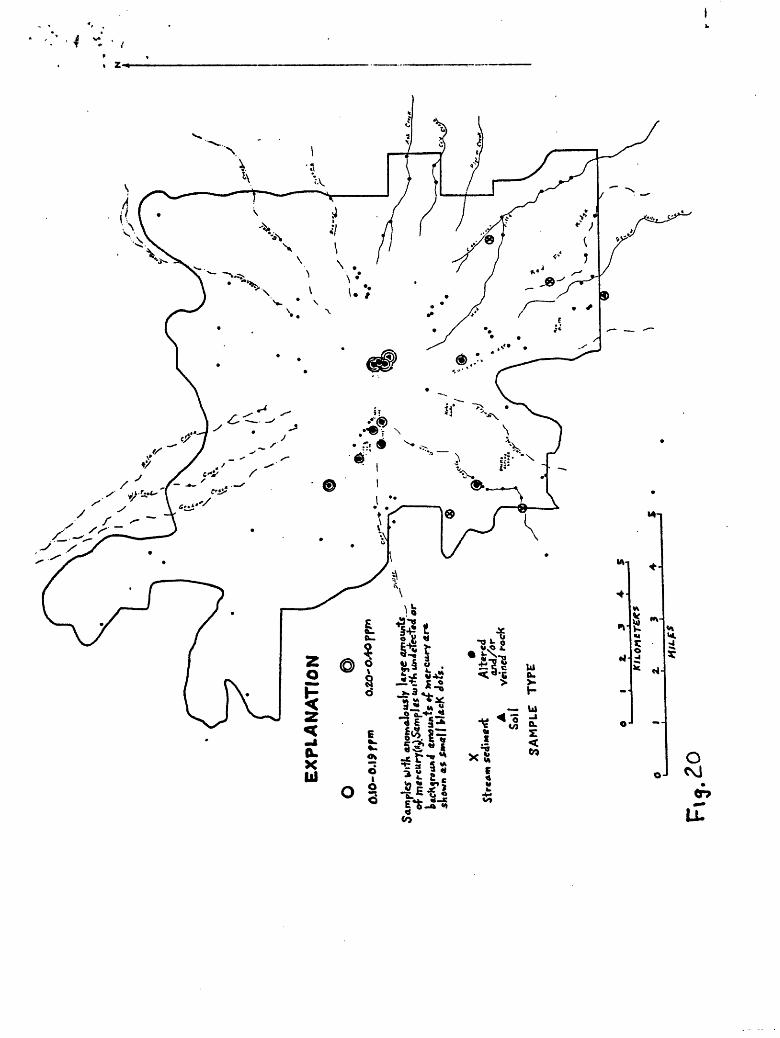
EX
PL
AN
AT
ION

Fit. 2.3
CX PL A N AT I ON
(P Oibmd mat
2 UUcicr Na.23 LMU* PUc«

EX
PL
AN
AT
ION
. ,
Uno
Jttr
«avo
lc«j
.iC
Ve-i
ned
roc
k
rocK
Fig.

"TV
to' io-
fr
IS-
+£'I't
*>'+<>
(**»
W00'
z/v
K-J
&i
jar*
+ri
Z&Ll
to-
tr*)'£?
+ Q
.
-rt-
fi*
'
£'
O'Z
<J-II'L
I
**+
.'*
'-11
)
fZ'
05
'
J'lJi'L
l
4001
W
JO
'
IrIzO
'tl
li-tt
10'
+I-
>£
U-z-z
crz L-1\
Tl
\ It
\ 01
to-
u-
£+'
Z7
L'E
-rr +1*'*
to
/C'
z<rl
+L
Z1
Lr
AS'
1Z'
£1"?
(**»}
+Z
'
JL'
jr& */
10'
IT#
S-<rl
fl-1
*/'£ inX
S'll
to-10"irQ
'l
Jfll
ve
SLc-tl
)9'
90
' U
'
^"/ *
irIL'
o+
TV
r//
i L^JL^U
^'-^Ji
(99+
1?
ITo£'
Lf-vl
»<>«* *r<L

' I* ,
Table 1. Major component cones of Mt. Shasta stratovolcano
Major cone Central vent Principal flank vents Estimated age limits (years)
Hot!urn
Shastina
Misery Hill
Mt. Shasta summit
Shastina summit
Misery Hill saddle
Sargents Ridge Head of Mud Creek
None
Black Butte
Southwest of North Gate, Gray Butte
Red Butte, south of Gray Butte, McKenzie Butte, North Gate, northwest flank, Spring Hill
<4,500-190(7)
<12,000-9,400
<100,000-<12,000
>100,000
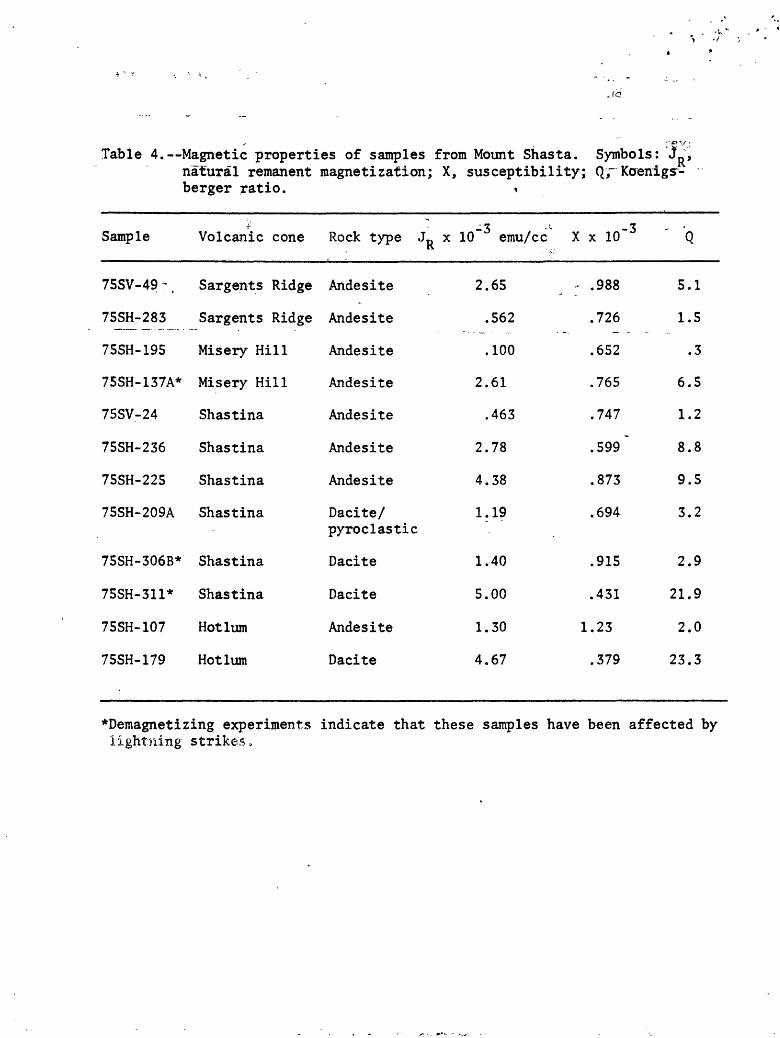
Table 4. Magnetic properties of samples from Mount Shasta. Symbols: JR , natural remanent magnetization; X, susceptibility; Q,~ Kcrenigs~- berger ratio. *
Sample
75SV-49 - .
75SH-283
75SH-195
75SH-137A*
75SV-24
75SH-236
75SH-225
75SH-209A
75SH-306B*
75SH-311*
75SH-107
75SH-179
Volcanic cone
Sargents Ridge
Sargents Ridge
Misery Hill
Misery Hill
Shastina
Shastina
Shastina
Shastina
Shastina
Shastina
Hotlum
Hotlum
Rock type JD xK
Andesite
Andesite
Andesite
Andesite
Andesite
Andesite
Andesite
Dacite/ pyroclastic
Dacite
Dacite
Andesite
Dacite
-3 10 emu/cc
2.65
.562
.100
2.61
.463
2.78
4.38
1.19
1.40
5.00
1.30
4.67
X x 10" 3
- .988
.726
.652
.765
.747
.599*
.873
.694
.915
.431
1.23
.379
Q
5.1
1.5
.3
6.5
1.2
8.8
9.5
3.2
2.9
21.9
2.0
23.3
*Demagnetizing experiments indicate that these samples have been affected by lightning strikes ,

Taljle 3.' Inverse modeling results of aeromagnetic anomaly over Mt. Shasta. Symbols: J, intensity of magnetization; I,"incli nation; D, declination; R, correlation coefficient; S, nor malized standard deviation.
Layers J x 10" -emu/cc
1
4
1
1
1
- 15
- 15
- 13
- 11
- 23
1.
1.
2.
3.
1.
713 '
748-
342
641 ~
666
45
45
38
31
25
I
.0
.7
.2
.3
.8
P
51
51
49
39
-14
.3
.4
.5
.3
.3
R
.93
.92
.88
- .77
.51
S
.37
.38
.47
.64
.86

Table 5. Inverse modeling results of aeromagnetic anomaly over Ash Creek Butte. Symbols, same as table 3.
Layers
7 -
5 -
1 -
1 -
8
8
8
7
_J x 10" emu/cc " I
/s 2.973 '' '\ ' $*'1.663
4.331
1.349
'-"- 31.3
31.4
33.2
35.8
r D
23.0j *
21.6
23.7
23.1
R
.92
.87
.82
.63
S
.39
.48
.57
.77
"i 1 ""I." > .

??v $ . .h ' n^w IP
.' -, + * " "'-. 4 ~.. v ^
1 "r
"C3U "^ '^ * >'&
' 5 * : : *.'
^»

/./_ (f/J
tOf/
(irJOC
(l<
>#
<t
.0*
-M ,*
fa"
J
t

Table 8. Zinc contents of selected samples. Anal/zed by atomic-absorption method except values in parentheses by emission-spectrographic method. Values in ppm.
Laboratory sample no.
Sample Material
Unaltered Altered volcanic Stream Soils volcanic rocks or fracture sediments rocks coatings
LDA-579 S6"|IDA- 581 63 1 Average 59LDA-584 57 ( range 56-63LDA-585 60LDA-586 59 J
W- 191374 f45.7)"IV-191375 f45.8)IV-191376 f41.61'".'-191379 (64.81'V- 191 380 (39.31K- 191381 (61. 01I','- 191383 (33. 9) J
Average of above 54.range 39-65
LDA-054I.DA-055LDA-057F.PA-058LDA-060I.PA-06SLPA-066LPA-06"I.PA-069I.PA-070LPA-0-1[.PA- 075I.PA-0'6LDA-0"9I.PA-080I DA- 081: PA-083I PA-084'PA- 086'PA-038 ru-rwo.
.Average 50range 39-65
5
49
48"6*
492470*>953663549?5*
6087*
5152i:-2.0
178
15!P \-091 'r^-C?? I PA-094 'PA-105 '.PA-104
67
28365
57.5
IfV-998 :CV-999
'.'.' OU :.p \-O\Al'A-022
::. \-OZA:.p\-o2SI.PA-030!.PA-03f^p^-032I HA -035 ..r>.V159 '. r!A-045
686385*6565
86* 67 67 92*?:*113* 10 63
'PA-04S I. PA-049 'DA-050
- U5
3535106*6065
Average 60 fnnge? 33-106
' Marks tmonalous!y large quantities of rinc for the area studied.

Table 7. Averages and ranges of selected trace elements in'unaltered volcanic rocks of Mt. Shasta. Analyzed by emission-spectro- graphic method, and where noted by*, by atomic-absorption method. <, less than limit of detectibility, as indicated. Values in ppm.
Element Fourteen unaltered andesites Seven unaltered dacites
BBaBeBiCoCrCuLaMoNiPbSbScSnSrVZnZr
Range
<4.2-20200-300
<0.7<515-2030-1007-30 (12-32)*<5<2
30-70<3.5-10
<2015-20<2
1000-2000150-200(56-63)*70-150
Average
<4.2286<0.7<515.47117.6 (21)*<5 <2
67<3.5
<2015.4<2
1429175(59)*89
Average
25450
2<4.6127819
<19<2.6418.7
<6814
<1567011350
200
Range
12-35230-6901.6-2.6<4.611-1334-150
5.6-28<15-25
<2.2-4.819-80
5.2-13<6813-15<15
400-1000100-13039-65
110-250

Table 10. Beryllium contents of samples with highest backgroundquantities. Analyzed by emission-spectrographic method. Values in ppm.
Laboratory sample no.
W191374
W191375
W191376
W191379
W191380
W191381
W191383
LDA-057
LDA-067
LDA-080
Sample Material
Unaltered Altered volcanic rocks or volcanic rocks fracture coatings
2.1
1.8
2.1
2.4
1.6
1.8
2.6
1.5 1.25I/ -
1.2si/
Average of 2 analyses

Table 9. Copper contents of selected samples. Anml/ses by atomic-absorption method except values in parentheses by emission-spectrographic Method. Values in ppm.
Laboratory sample no.
Sample Material
Unalteredvolcanicrocks
Altered volcanic rocks or fracture coatings
Stream sediments
Soils
W- 191 374W-191375W-191376W- 19 1379W- 191380W-191381W-191383
(24.8) 1(17.4)( 5. 59)(23.7)(10.2)(23.3)(28.4) J
> average 19
LDA-S79 LDA-S81 IDA-584 LDA-585 LDA-586
Average of above 20.1 range 5.6-32LDA-OS4 LDA-055 LDA-057 LDA-058 IDA-060 LDA-065 LDA-066 LDA-067 LDA-069 LDA-070 LDA-071 LDA-075 LDA-076 LDA-079 LDA-080 LDA-081 LDA-083 LDA-084 I.DA-086 LDA-088 LDA-090 LDA-091 LDA-093 LDA-094 LDA-103 LDA-104
LCY-998 LDY-999
LDA-006 I.DA-011 LDA-013 LDA-014 IDA-022 LDA-024 I.DA-027 I.DA-030 LDA-031 LDA-033 LDA-03S LDA-039 LDA-04S
LDA-047 LDA-048 I.DA-049 LDA-OSO I.DA-OS1
average 21.2
16102626
(701 46323436
(70) 50 (951 54 (70) 40
28 (50) 36
30(70) 48 (85) 50
1016
(50) 26 <102026
(70) 48(70) 62
(5,000) 3500(6,200) 3870
Average 312; range <10-3780Average, excluding -103 and -104, 31; range <10-62
3028
26282834223024262626303224
Average 27.6 Range 22-34
(65) 40(65) 38(35) 48
2426
Average 35.2 Range 24-48

Table 11. --Boron contents of samples with values above background. Analyzed by emission spectrographic method. Values in ppm.
Laboratory sample no. -
LDA-054
LDA-055
LDA-060
LDA-067
LDA-079
LDA-081
LDA-083
LDA-086
LDA-088
LDA-090
LDA-096
LDA-100
Sample Material
Altered rocks or Fracture Coatings
2S<>i/
8si/
6fli/
30
7oi7
isoi/
isol/7oiX
2Soi/
isoi/
30
70
Average of 2 analyses


< \