UNIT I NDT NON- DESTRUCTIVE TESTING · • Ultrasonic testing(UT) is the one of the popular flaw...
137
NON- DESTRUCTIVE TESTING DEPARTMENT OF MECHANICAL ENGINEERING INSTITUTE OF AERONAUTICAL ENGINEERING (Autonomous) DUNDIGAL, HYDERABAD - 500 043 B. Tech VI semester (IARE R16) BY Mr. A. VENUPRASAD, Associate Professor Mr. A. ANUDEEP KUMAR, Assistant Professor 1
Transcript of UNIT I NDT NON- DESTRUCTIVE TESTING · • Ultrasonic testing(UT) is the one of the popular flaw...

NON- DESTRUCTIVE TESTING
DEPARTMENT OF MECHANICAL ENGINEERING
INSTITUTE OF AERONAUTICAL ENGINEERING
(Autonomous)DUNDIGAL, HYDERABAD - 500 043
B. Tech VI semester (IARE R16)
BY
Mr. A. VENUPRASAD, Associate Professor
Mr. A. ANUDEEP KUMAR, Assistant Professor
1

UNIT I
NDT
NON- DESTRUCTIVE
TESTING
2

Other terms used in NDT
Non-destructive examination (NDE)
Non-destructive inspection (NDI)
Non-destructive evaluation (NDE)
3

OBJECTIVE OF NDT
• Material sorting
• Material characterization
• Property monitoring (for process control)
• Thickness measurement
• Defect Detection/ Location and
• Defect characterization.
However the major task of NTD is to detect and identify the
range of defects. Defects can include production flaws such as
heat treatment cracks, grinding cracks, voids(pores), and
fatigue cracks (Generated during service).
4

NDT(Non-destructive testing )?
Non-destructive testing (NDT) is the process of inspecting,
testing, or evaluating materials, components or assemblies for
discontinuities, or differences in characteristics without
destroying the serviceability of the part or system.
In other words, when the inspection or test is completed the part
can still be used.
5

Non-destructive testing
“NDT is an examination that is performed on an object of any
type, size, shape or material to determine the presence or
absence of discontinuities, or to evaluate other material
characteristics”
6

7

Types of NDT
8

Visual Inspection
• Visual inspection is the simplest, fastest and most widely used NDT
method.
• Visual inspection is commonly defined as “the examination of a
material component, or product for conditions of non conformance
using light and eyes, alone or in conjunction with various aids.
• Visual inspection often also involves shaking, listening, feeling ,
and sometimes even smelling the component being inspected.
• Visual inspection is commonly employed to support/ compliment
other NDT methods.
• Digital Detector and computer technology have made it possible to
automate some visual inspections. This is known as machine vision
inspection.
9

Characteristics Detected(Applicility)
This visual inspection is commonly used:
i. To detect surface characteristics such as finish, Scratches,
cracks or colour.
ii. To check stain in transparent materials.
iii. To inspect corrosion.
10

Principle
• Seeing is believing and the art of seeing is the visual
inspection technique.
• Visual testing requires adequate illumination of the
test surface and proper eye-sight of the tester.
• The test specimen is illuminated and the test surface
is observed and examined. Whenever required, the
optical aids such as mirrors, magnifying glasses,
microscopes, video cameras and computer- vision
system can be employed.
11

Advantages of VT
• Simple and easy to use.
• Relatively inexpensive.
• Testing speed is high.
• Testing can be performed on components which
are in –service.
• Permanent record are available when latest
equipment is used.
12

Limitation
• The test result depend on skill and knowledge
of tester.
• Limited to detection of surface flaws.
• Eye resolution is weak.
• Eye fatigue.
13

Applications
• Checking of the surface condition of the
component.
• Checking of alignment of surfaces.
• Checking of shape of the component.
• Checking for evidence of leaking.
• Checking for internal side defects.
14

Types of visual testing
Unaided or direct visual testing, and
Aided visual testing.
15

Unaided or direct visual testing
• As the name suggest, the unaided visual
testing is carried out with naked eye(and
without using any optical aids)
• The most important instrument is visual testing
in the human eye.
16

17

MAGNETIC PARTICL TESTING (MT)
• MAGNETIC PARTICL TESTING (MT) is an non-destructive testing to locate surface andsubsurface discontinuities in parts made byferromagnetic materials.
18

MAGNETIC LINES OF FLUX:
• It is the number of magnetic field lines passing through a surface (such as a loop of wire). The magnetic flux through a closed surface is always zero. ...
• The SI unit of magnetic flux is the Weber (Wb)
• The magnetic lines of forces existing in a magnetic field is called magnetic flux.
• The lines of flux ran through the magnets from south to
• north, exiting the north pole and re entering the south pole.
• The lines of flux formed closed loops that never crossed.
19

20

DIRECT MAGNETIZATION
With direct magnetization, current is passed directly through
the component.
The flow of current causes a circular magnetic field to form
in and around the conductor.
When using the direct magnetization method, care must be
taken to ensure that good electrical contact is established and
maintained between the test equipment and the test component
to avoid damage of the component (due to arcing or
overheating at high resistance points).
21

22

Clamping The Component Between Two Electrical Contacts
• One way involves clamping the component between
two electrical contacts in a special piece of
equipment.
• Current is passed through the component and a
circular magnetic field is established in and around
the component.
23

24

CLAMPS OR PRODS
A second technique involves using clamps or
prods, which are attached or placed in contact
with the component.
Electrical current flows through the
component from contact to contact.
The current sets up a
c path of the current.
25

INDIRECT MAGNETIZATION
•Indirect magnetization is accomplished by using a strong
external magnetic field to establish a magnetic field within the
component. As with direct magnetization, there are several
ways that indirect magnetization can be accomplished.
• 1.PERMANENT MAGNETS:-
The use of permanent magnets is a low cost method of
establishing a magnetic field.
However, their use is limited due to lack of control of the
field strength and the difficulty of placing and removing
strong permanent magnets from the
26

PERMANENT MAGNET ELECTRO MAGNET27

ELECTROMAGNET
Electromagnets in the form of an adjustable horseshoe magnet(called a yoke) eliminate the problems associated withpermanent magnets and are used extensively in industry.
Electromagnets only exhibit a magnetic flux whenelectric current is flowing around the soft iron core.
When the magnet is placed on the component, a magneticfield is established between the north and south poles of themagnet.
28

UNIT-II
ULTRASONIC TESTING
29

INTRODUCTION
• Ultrasonic testing(UT) is the one of the popular flaw detectionnon-destructive testing methods.
• In ultrasonic testing high frequency sound energy is used toidentify surface an sub- surface discontinuities.
• Ultrasonic testing is completely safe method of NDT and it isextensively used in many basic manufacturing and serviceindustries. Especially in applications of inspecting welds andstructural metals.
• Because of its high penetration capacity, inspection of extremelythick sections are possible using Ultrasonic testing.
30
31

Modes of Propagation
Longitudinal waves
Shear waves
Surface waves (Rayleigh), and
Lamb waves (plate)
32

longitudinal waves
• In a longitudinal waves, Particle motion in the medium is
parallel to the direction of the wave front
33

Transverse wave
34

Transverse wave
• A transverse wave is a moving wave that consists of
oscillations occurring perpendicular (right angled) to
the direction of energy transfer (or the propagation of
the wave).
35

Surface waves
• Surface waves represent an oscillating
motion that travels along the surface of a
test piece to a depth of one wavelength.
• Surface waves can be used to detect surface
breaking cracks in a test piece.
36

Terminologies used in UT
37

38

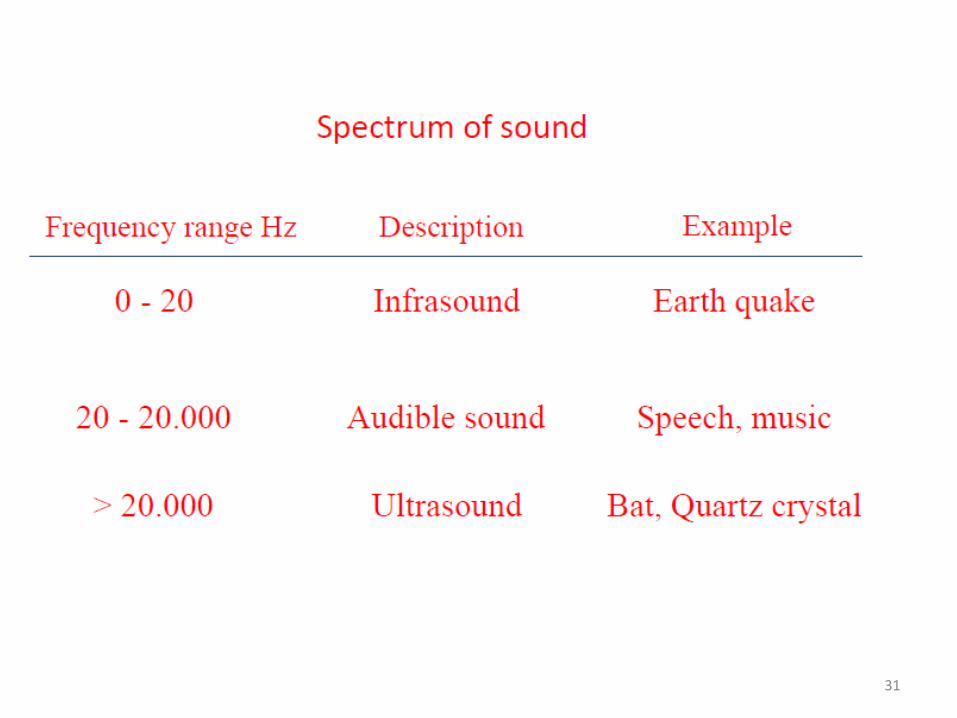
FREQUENCY
• Generally the choice of test frequency depends upon two
factors : the minimum size of defect, which is to be detected
and the medium in which such a defect is situated.
39

• Penetration Depth:
Penetration depth is the maximum depth in a material, the flaws can be located by the ultrasonic waves in testing.
• Scattering:
Scattering is the reflection of sound beam its original direction of propagation.
• Absorption:
Absorption is conversion of sound energy from one form to some another form.
40

41

42

43

44

45

UNIT III
RADIOGRAPHY TESTING
46

RADIOGRAPHY TESTING
• The radiation used in radiography testing is a
higher energy (shorter wavelength) version of the
electromagnetic waves that we
see as visible light. The radiation can come from
an X-ray generator or a radioactive source.
47

High Electrical Potential
Electrons
-+
X-ray Generator or Radioactive Source Creates Radiation
Exposure Recording Device
Radiation Penetrate the Sample
48

Introduction
• This module presents information on the NDTmethod of radiographic inspection or radiography.
• Radiography uses penetrating radiation that isdirected towards a component.
• The component stops some of the radiation. Theamount that is stopped or absorbed is affected bymaterial density and thickness differences.
• These differences in “absorption” can be recorded onfilm, or electronically.
49

outline
• Electromagnetic Radiation
• General Principles of Radiography
• Sources of Radiation
– Gamma Radiography
– X-ray Radiography• Imaging Modalities
–Film Radiography–Computed Radiography–Real-Time Radiography–Direct Digital Radiography–Computed Radiography
• Radiation Safety
• Advantages and Limitations
• Glossary of Terms
50

Electromagnetic Radiation
• The radiation used in Radiography testing is a higher
energy (shorter wavelength) version of the electromagnetic
waves that we see every day. Visible light is in the same
family as x-rays and gamma rays.
51

General Principles of Radiography
• The part is placed between the radiation source and a piece of
film. The part will stop some of the radiation. Thicker and
more dense area will stop more of the. Radiation.
• The film darkness (density) will vary with the amount of
radiation reaching the film through the test object.
52

IDL 2001
Radiography has sensitivity limitations when detecting cracks.
X-rays “see” a crack as a thickness variation and the larger the variation, the easier the crack is to detect.
Optimum
Angle
Flaw Orientation
easy to d= etect
= not easy to detect
When the path of the x-rays is not parallel to a crack, the thickness variation is less and the crack may not be visible.
53

Flaw Orientation
• Since the angle between the radiation beam and a crack or
other linear defect is so critical, the orientation of defect must
be well known if radiography is going to be used to perform
the inspection.
0o 10o 20o
54

Radiation Sources
• Two of the amost commonly used sources of radiation in
industrial radiography are x-ray generators and gamma ray
sources. Industrial radiography is often subdivided into “X-ray
Radiography” or “Gamma Radiography”, depending on the
source of radiation used.
55

Gamma Radiography
• Gamma rays are produced by a radioisotope.
• A radioisotope has an unstable nuclei that does not have enough binding energy to hold the nucleus together.
• The spontaneous breakdown of an atomic nucleus resulting in the release of energy and matter is known as radioactive decay.
56

Gamma Radiography (cont.)
• Most of the radioactive material used in industrial radiography is artificially produced.
• This is done by subjecting stable material to a source of neutrons in a special nuclear reactor.
• This process is called activation.
57

Gamma Radiography (cont.)
Unlike X-rays, which are produced by a machine, gamma rays cannot be turned off. Radioisotopes used for gamma radiography are encapsulated to prevent leakage of the material.
The radioactive “capsule” is attached to a cable to form what is often called a “pigtail.”
The pigtail has a special connector at the other end that attaches to a drive cable.
58

Gamma Radiography (cont.)
A device called a “camera” is used to store, transport and
expose the pigtail containing the radioactive material. The
camera contains shielding material which reduces the
radiographer’s exposure to radiation during use.
59

Gamma Radiography (cont.)
A hose-like device called
a guide tube is connected
to a threaded hole called
an “exit port” in the
camera.
The radioactive material
will leave and return to
the camera through this
opening when performing
an exposure!
60

Gamma Radiography (cont.)
A “drive cable” is connected to the other end of the camera. This cable, controlled by the radiographer, is used to force the radioactive material out into the guide tube where the gamma rays will pass through the specimen and expose the recording device.
61

X-ray Radiography
Unlike gamma rays, x-rays are produced by an X-ray generator system. These systems typically include an X-ray tube head, a high voltage generator, and a control console.
62

X-ray Radiography (cont.)
• X-rays are produced by establishing a very high voltage between two electrodes, called the anode and cathode.
• To prevent arcing, the anode and cathode are located inside a vacuum tube, which is protected by a metal housing.
63

X-ray Radiography (cont.)
•The cathode contains a small filament much the same as in a light bulb.
•Current is passed through the filament which heats it. The heat causes electrons to be stripped off.
•The high voltage causes these “free” electrons to be pulled toward a target material (usually made of tungsten) located in the anode.
•The electrons impact against the target. This impact causes an energy exchange which causes x-rays to be created.
High Electrical Potential
Electrons
-+
X-ray Generator
or Radioactive
Source Creates
Radiation
Exposure Recording Device
Radiation
Penetrate
the Sample
64

Imaging Modalities
Several different imaging methods are available to display the final image in industrial radiography:• Film Radiography
• Real Time Radiography
• Computed Tomography (CT)
• Digital Radiography (DR)
• Computed Radiography (CR)
65

Film Radiography
• One of the most widely used and oldest imaging mediums in industrial radiography is radiographic film.
• Film contains microscopic material called silver bromide.
• Once exposed to radiation and developed in a darkroom, silver bromide turns to black metallic silver which forms the image.
66

Film Radiography (cont.)
• Film must be protected from visible light. Light, just like x-rays and gamma rays, can expose film. Film is loaded in a “light proof” cassette in a darkroom.
• This cassette is then placed on the specimen opposite the source of radiation. Film is often placed between screens to intensify radiation.
67

Film Radiography (cont.)
• In order for the image to be viewed, the film must be “developed” in a darkroom. The process is very similar to phaaotographic film development.
• Film processing can either be performed manually in open tanks or in an automatic processor.
68

Film Radiography (cont.)
Once developed, the film is typically referred to as a “radiograph.”
69

Digital Radiography
• One of the newest forms of radiographic imaging is “Digital Radiography”.
• Requiring no film, digital radiographic images are captured using either special phosphor screens or flat panels containing micro-electronic sensors.
• No darkrooms are needed to process film, and captured images can be digitally enhanced for increased detail.
• Images are also easily archived (stored) when in digital form.
70

Digital Radiography (cont.)
There are a number of forms of digital radiographic
imaging including:
•Computed Radiography (CR)
•Real-time Radiography (RTR)
•Direct Radiographic Imaging (DR)
•Computed Tomography
71

Computed Radiography
Computed Radiography (CR) is a digital imaging process that uses a special imaging plate which employs storage phosphors.
72

Computed Radiography (cont.)
CR Phosphor Screen Structure
X-rays penetrating the specimen stimulate the phosphors.
The stimulated phosphors remain in an excited state.
X-Rays
Phosphor Layer
Protective Layer
SubstratePhosphor Grains
73

Computed Radiography (cont.)
After exposure:
The imaging plate is read electronically
and erased for re-use in a special
scanner system.74

Motor
A/D
Converter
Imaging Plate
Optical Scanner Photo-multiplier Tube
110010010010110
Laser Beam
Computed Radiography (cont.)
As a laser scans the imaging plate, light is emitted where X-
rays stimulated the phosphor during exposure. The light is
then converted to a digital value.
75

Computed Radiography (cont.)
Digital images are typically sent to a computer workstation where specialized software allows manipulation and enhancement.
76

Computed Radiography (cont.)
Examples of computed radiographs:
77

Real-Time Radiography
• Real-Time Radiography (RTR) is a term used to describe a formof radiography that allows electronic images to be captured andviewed in real time.
• Because image acquisition is almost instantaneous, X-rayimages can be viewed as the part is moved and rotated.
• Manipulating the part can be advantageous for several reasons:
– It may be possible to image the entire component with oneexposure.
– Viewing the internal structure of the part from differentangular prospectives can provide additional data for analysis.
– Time of inspection can often be reduced.
78

Real-Time Radiography (cont.)
• The equipment needed for an RTR includes:
• X-ray tube
• Image intensifier or other real-time detector
• Camera
• Computer with frame grabber board and software
• Monitor
• Sample positioning system (optional)
79

Real-Time Radiography (cont.)
• The image intensifier is a device that converts the radiation that passes through the specimen into light.
• It uses materials that fluoresce when struck by radiation.
• The more radiation that reaches the input screen, the more light that is given off.
• The image is very faint on the input screen so it is intensified onto a small screen inside the intensifier where the image is viewed with a camera.
80

Real-Time Radiography (cont.)
• A special camera which captures the light output of the screen is located near the image intensifying screen.
• The camera is very sensitive to a variety of different light intensities.
• A monitor is then connected to the camera to provide a viewable image.
• If a sample positioning system is employed, the part can be moved around and rotated to image different internal features of the part.
81
Real-Time Radiography (cont.)
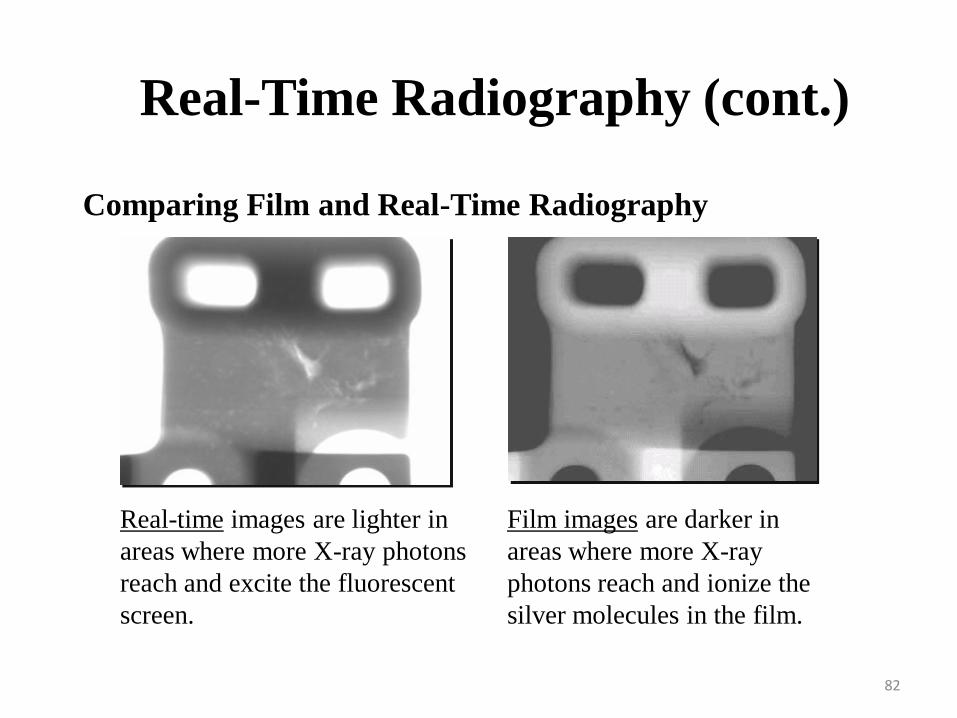
Comparing Film and Real-Time Radiography
Real-time images are lighter in
areas where more X-ray photons
reach and excite the fluorescent
screen.
Film images are darker in
areas where more X-ray
photons reach and ionize the
silver molecules in the film.
82

Radiographic Images
83

Radiographic Images
84

Radiographic Images
85

Advantages of Radiography
• Technique is not limited by material type or density.
• Can inspect assembled components.
• Minimum surface preparation required.
• Sensitive to changes in thickness, corrosion, voids, cracks, and material density changes.
• Detects both surface and subsurface defects.
• Provides a permanent record of the inspection.
86
Disadvantages of Radiography
• Many safety precautions for the use of high intensity radiation.
• Many hours of technician training prior to use.
• Access to both sides of sample required.
• Orientation of equipment and flaw can be critical.
• Determining flaw depth is impossible without additional angled exposures.
• Expensive initial equipment cost.
87

UNIT IV
ADVANCED NDE TECHNIQUES -I
88

What is PAUT?
• Phased Array Ultrasonic Testing is anadvanced ultrasonic technique used for flawdetection, sizing, and imaging
• Uses multi-element (array) probes forincreased beam steering and focusingcompared to conventional UT
• Like having many small conventional UTprobes in one pulsed at predeterminedintervals
89

How Phased Array Works
• Each individual wave generated within the scan goes
through the pulse/receive cycle as shown below
90

How Phased Array Works
• Each received analogA-Scan is digitized andrendered into 2D display formats• Signals from the entireequence are compiled into various image formats for evaluation
91

PAUT Views
• A data view is a
2D graphic
rendering of
the ultrasonic
data
• Data views
• A-Scan
• B-Scan
• C-Scan
• S-Scan
• ToFD
• Ray Tracing
• Strip Charts
92

A-Scan View• Source by which all
other views are created
• Amplitude vs time
• An A-Scan exists for
every sound beam
• One for each
segment of a linear
scan
• One for each angle
of an S-Scan
• Rulers allow presentation
of information in time,
sound path, or true depth
• Amplitude is linked
to color pallet
93

B-Scan View
• A side view looking from the back side of the probe
• Represents data collected through the entire scan
length for one A-Scan
• View changes dynamically as angle or VPA is
scrolled
94

C-Scan View
• C-Scan is a plan view/top view
• View is generated based on gate positioning and mode
(may be configured for gate A and B independently)
• Data can be presented in amplitude or position (thickness)
formats
95

S-Scan View
• Presents all A-Scans
within the group in an
angular sector or sweep
range
• A-Scans are converted to
color coded lines
representing amplitude
• May be corrected for
delay and true depth
relative to the ultrasonic
axis as shown here
96

Time of Flight Diffraction (ToFD)
• The ToFD display offers a B-Scan representation of
the diffracted signals detected in “pitch catch”
conventional UT probes
• As with all other image views ToFD is built off
individual A-Scans
97

Ray Tracing View
• Provides 2D representation of the weld, showing
rebounds of the beam path and A gate position for the
first, last and active focal law
• Should only be used as a reporting tool
98

Master Thoughts
• It’s still UT
• Anything UT can do PAUT can do better
• Technology enabled
• UT is not new, neither is PAUT
• Computer assistance of proven technology
• Advancements in transducer material/design
• Medical use and capability perfected
• Adapted for use in industrial sector
• Key elements
• Multi-dimension sizing offers more accurate assessment of
integrity
• Weld images provided in multiple 2D orientations, giving 3D
of views
• Raises production while reducing costs
99

PAUT for Pipelines
API 1104 21st
Edition
100
UNIT – V
Acoustic Emission Testing and
Application
101

Acoustic Emission Testing
Loaded the structure and cracks are
formed
Oscillatory movement in atoms
& molecules
Generate elastic stress wave in the
sample and come out
102
Sensor- Piezoelectric element
102

Load- No load (no cracks) no emission
• Controlled load – Part of the structure has to be loaded by
controlled load
• Load bearing structure – loaded anyway
Inspect a big area/volume – Very Big area inspection
can be done in a single examination by placing a number
of sensors at different location, where could be a
potential source of damage
103
CONDITION FOR AE
103

Sources of AE
104
Stress field- stress wave propagate through the
sample and received by the sensors
For example Metal
Micro and macro crakes initiating and propagating
Micro dynamical events such as twinning or slip
It happen due to lattice defect which known as dislocation
loaded the metallic system dislocation will move and due to that
movement, it create slip
Slip is the movement of atomic planes over one another as results
dislocation move which lead theAE
104

Sources of AE
105
Fracture of brittle inclusions
Chemical action like corrosion
Phase Transformation due to change in volume
and strain effect due to temperature change
105

AE source from phase transformation
106
Example Martensite in steel, at high temperature
phase called Austenite
• When we heat it and quench it fast in liquid like water
• Two phase are very different kind of properties and structure
• Hence, the volume of parent phase and transformed phase are
different and due to that some stresses can be generated which may
lead to acoustic emission
106

Composite Materials
107
Fiber fracture at medium strain level
Delamination at high strain level
Fiber pull out
Matrix cracking and fibers debonding at low strain level
Concrete
• Micro and macro cracks
• Separation of reinforcement members
• Mechanical rubbing of separated surfaces
107
Parameter ofAE
σ σ
108
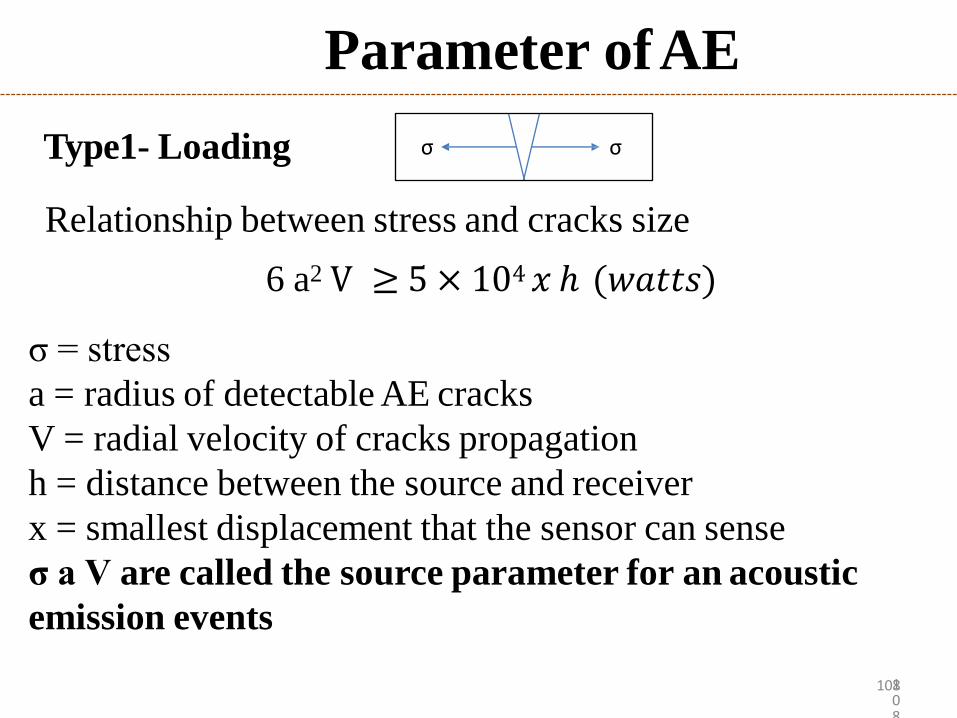
Type1- Loading
Relationship between stress and cracks size
6 a2 V ≥ 5 × 10⁴ 𝑥 ℎ (𝑤𝑎𝑡𝑡𝑠)
σ = stress
a = radius of detectable AE cracks
V = radial velocity of cracks propagation
h = distance between the source and receiver
x = smallest displacement that the sensor can sense
σ a V are called the source parameter for an acoustic
emission events
108

9
Stress change,
where,
∗
I = n × n square matrix
c = stiffness tensor
c + ∆𝑐 = stiffness tensor of product phase
∆𝑐 = change in the stiffness
𝛽 = unconstrained shape
𝛽𝑜= pre – existing stress or residual stress
D = shape matrix
V = volume of transformed phase
If the stiffness ∆𝒄 << c and there is no residual strength that means 𝛽𝑜 = 0
Change in stress will depend on shape change
(transformation one material another material) , c is the
constant which is the material property
This parameter will control the intensity or the level of
acoustic emission
∆𝜎 𝑡∗
= 𝑐𝛽 𝑉 𝑡
∆𝜎(𝑡) =− ∗
𝐼 + ∆𝑐𝐷 [(c + ∆𝑐)𝛽 −∆𝑐𝛽𝑜] 𝑉(𝑡)
109

10
Characteristics of AE signal
Cover the wide range of energy levels which depend on types of
sources and frequencies
Two types of basic source
• Continuous emission-signals coming from rapidly occurring
source
• Burst type- continuous emission source and suddenly burst
Radiation pattern same as ultrasonic wave
Radiate the energy in all direction, for a cracks of sufficient length it
can become directional
Frequency is generally broadband
Received frequencies cover a wide range from available to 400 KHz
or higher 110

Kaiser and Felicity effects
111
It describe a relationship between AE events and the previous
load history
Kaiser describe AE events occurring when the structure
first loaded to threshold, unloaded and loaded again
It states no AE is generated until the previous maximum
load is exceeded and the structure that inspecting is still
sound
Emission that occurs in the later loading below the
previous maximum load is due to structural damage
Kaiser effects -No emission before the previous maximum
load
Felicity effects – Emission before the previous maximum load

Felicity
effects
Kaiser
effects
AB- loading
BC- unloading
CB – reloading
BD – loading
DE – unloading
ED – reloading
F < D emission are occurring
before the previous
112
maximum load
Steep rise in the emission
GH - always happening with
no increment in the load, this
is known as load hold
It is the particular value ,
load is not increasing but lot
of emission coming out,
which indicate some kind of
damage

Emission before the previous maximum load
Felicity ratio, Fr=𝑃𝑒 (𝑒𝑥𝑖𝑠𝑡𝑖𝑛𝑔 𝑙𝑜𝑎𝑑)
113
𝑃𝑚(𝑝𝑟𝑒𝑣𝑖𝑜𝑢𝑠 𝑚𝑎𝑥𝑖𝑚𝑢𝑚 𝑙𝑜𝑎𝑑)
Fr > 1 – there is no damage has occurred since the last
inspection
Fr < 1 – indicate of cumulative or permanent damage
Felicity effects

Threshold
114
Time
Counts N- Number of expression above the threshold is
considered asAE
Below the threshold, it is considered as noise
It is the function of the threshold and frequency
It depends of the magnitude of the AE sources
It also depend upon the properties of the sample and the
sensor
Volts
Signal Parameter

Time
Highest measured voltage or amplitude
Express in dB
Directly related to the energy in the AE signal
Threshold
Volts
PeakAmplitude
115
Peak Amplitude

Duration (D)Duration
Volts
Threshold
Time
It will depends on the magnitude and frequency of the AE
source
Duration can be used to identify different types of emission
source
The noise which are coming out from the some other
source, which are not related to the defect hence useful for
filtering the noise11
6

Threshold
Rise time
Volts
Rise Time (R)
117
Time
Time interval between first threshold crossing and the
signal peak
Related to the propagation of the wave between the source
and the sensor

Measured Area Under The RectifiesSignal Envelope
(MARSE)
It used to qualify AE signal and filter out noise
This the measure of the signal strength
Sensitive to the duration and peak amplitude but does not take into
account the user defined threshold and the operating frequency
Volts
Time
MARSE
Time
118
Volts

19
Data DisplayCount or Energy v/s time
Counts
or
energy
Hit signal – A
Time
Signal
above the thresholds
If signal above the
counts thethresholds,
signal
Below thresholds counts
as noise
Count
rate or
Energy
rate
Count rate or Energy rate
v/s time
Time
At particular instant, we
know what is going inside
the component
At given time, how much
acoustic emission or
signals coming out at
certain location119

20
Counts or energy vs Load
indicate that structure is good
Counts
or
energy
Load
By the figure we have to know that lot of emission happen or lower
amount of emission happen
Very steep curve- small amount of increase in load lead a lot of
emission
With increasing the load very high emission generate which would
indicate bad structure
Gradual slop- Gradual increase in load with respect to load which
Bad
Good
120

Hit v/s Amplitude
Hits
Amplitude
Differential Plot
If we considered
many hits are
how
above
particular amplitude is
known as cumulative plot
Amplitude
1000
Hits100
10
At given hit with particular
amplitude is known as
Differential plot
121
Cumulative Plot

Source location
122
This technique is primarily qualitative, it does not give
quantitative information
Location of source is very important to know about the
zone from which these emission coming out
Hence we provide some corrective measure around the
particular area

Linear location scheme
If, t1<t2
velocity of sound wave inside the sample V
X= V t
Difference t1 and t2 = ∆𝑡X = V ∗ ∆𝑡
t1 L t2
X
123

24
Zonal location techniqueA , t1
C, t3
• B, t2
More than two sensor
Placement of sensor is important- Potential source of
AE
Sensor should be placed in a pattern or geometric
shaped
Based on the possible source of location then, we
target those area while inspecting and taking
correctivemeasure
t1= t2 =t3
Source of emission at the
center of the triangle
Because sensor receiving
signal at the same time
t1≠ t2 ≠ t3
124

26
Elastic Wave Method – Principle
Source: Ref.5 125

27
Elastic Wave MethodNDT Method Principle Advantage Disadvantage
Corrosion Evaluation
Specific Equipment
Ultrasonic pulse velocity
(UPV)
Mechanical energy
propagates through the concrete as stress waves
and converted into electrical energy by a
second transducers
A large penetration
depth and it is easy to use
for estimating the size,
shape, and nature of concrete damage
The evaluation of UPV data is a
highly specialized task, which
requires careful data
collection and expert
analysis
Pulse velocity (V)
Transducers( transmitter
and receiver), amplifier, and
oscillator
Acoustic emission(AE)
Elastic wave are generated due to rapid
release of energy from a
localized source within
an RC structure
A cost-effective and
sensitive technique that can
detect and locate the
active cracks
Passive defects can
not be effectively detected
AE parameter
Transducers, preamplifier,
filter amplifier, and
storage equipment , mechanical impactors126

Elastic Wave Method
127
NDT Method Principle Advantage DisadvantageCorrosionEvaluation
SpecificEquipment
Impact echo Stress wave A simple fast The reliability Wave Velocity Highly-(IE) are reliable of IE method (Vp) friendly
propagated method for decrease with receiver andwithin the RC inspecting the an increase in datastructure concrete is to thickness acquisitionthrough impact thevibrations and surface with aimpact load hammer and
listen to theresult

In the below figure AE activity observed corresponds to the
corrosion loss of steel reinforcement in a marine environment (
Melcher and Li)
Phase 1- Onset of corrosion is initiated and the phase is dominated by
the presence of oxygen and water
Phase 2- Corrosion loss decrease and stabilize
Phase 3 – corrosion penetrates inside
Phase 4 – expansion of corrosion products occurs due to anaerobic
corrosion
Based on the above phase corrosion activity are characterized
Onset of corrosion and the growth of corrosion products (
nucleation of cracks)
On the basis of above phase AE technique could detect the
corrosion at an early stage 128
Hits-Detection of an AE signal

Corrosion loss of steel reinforcement due to chloride immersion and cumulative AE hits and
number of AE events during corrosion test
Source- Ref.5
AE hits to be one of the AE parameters used to study the onset of
corrosion and the nucleation of cracks in RC structure
It observed that AE hits increased with an increase in the degreeof
corrosion12
9

formation due to corrosion13
0
Signal strength (SS) is one of the AE parameter, it is defined as the
area under the voltage signal of AE over the duration of the
waveforms.
Since it provides a measure of the waveform energy released by the
specimen, it is rational damage indicator (Velez et al.)
The SS of prestressed specimen is attributed to the nucleation of
cracks caused by the accumulation of corrosion products at the steel
concrete interface
The SS non prestressed specimen it could be indicator of early cracks
Signal strength (SS) and Cumulative Signal Strength (CSS)

32
The CSS exhibits a clear rate change before the onset of corrosion
according to electrochemical method, which suggest that the AE
technique could detect the onset of corrosion
The CSS rate increase slowly in Phase 1 indicating de-passivation of
the layer surrounding the steel reinforcement and the onset of steel
corrosion
• The presence of sudden rise at the end of phase 1 might indicate crack
initiation due to steel corrosion
The rise of Phase 2 indicates corrosion activity
• The sudden rise at the end of phase 2 indicate cracks propagation
leading to macro- crack.
If the sudden rise excluded from the CSS curve, dotted line will be
obtained and it is the agreement with conventional curve131

33
The variation in the CSS parameter
Source- Ref.5
AE detects the sudden release of micro-fractures in the RC structure.
Increasing the steel diameter due to corrosion is found to increase
the absolute energy of AE (Ing et al.) 132

34
Rise amplitude (RA) and Average Frequency
RA value = Rise Time/Amplitude
Average Frequency = Counts/Duration
Classification of cracks by AE indexes
Source- Ref.5
Tensile type cracks –
When AE signal with
high average frequency
and low RA value
Shear type cracks – low
average frequency and
high RA value
133

36
Earthquake AE
Principle
Vibration of the earth produced by
the rapid release energy
Measured the intensity (energy
released) of the source
Parameter
Shocks, epicenter, origin, time,
depth, magnitude and intensity
Threshold, peak amplitude, rise time ,
duration, measure area under the
rectifies signal envelope
Instrument
Seismograph, Richer scale,
Mercalli scalePiezoelectric sensor
134

AE method, the same principle can be applied to determine the scaling
of the amplitude distribution of the AE waves during the fracture process
DIFFERENCE BETWEEN CONVENTIONAL ANDPROPOSED AE METHODOLOGY
Conventional AE technique for
seismic diagnosis of pilesAE technique proposed for seismic
diagnosis of railway structures

Schematic illustration of procedure forAE experiment
in an inverted model pile
Source- Xiu Luo at al. STUDY ON SECONDARY AE TECHNIQUE FOR SEISMIC DIAGNOSIS OF RAILWAY SUBSTRUCTURES. 13th World Conferenceon Earthquake Engineering Vancouver, B.C., Canada 13
6

A set-up for secondary AE monitoring
under simulated train Lloading
137