Sci5#59 Review Unit 5 and Unit 7 and End of Course Assessment of Unit 5 and Unit 7.
Upload
rob-fogertyCategory
view
116download
0
Unit 5 Research Project
Worthing College Sports Science
Alfie Dunk
2015

Is there a relationship between body composition and short, medium and long term injury rates in
rugby?
P2: Carry out / P4: Produce

Abstract
The aim of this research study was to investigate if there a relationship between body composition and short, medium and long term injury rates in rugby. The BMIs of 36 male 16-19 year old rugby players was taken. Following this the participants filled out a survey (appendix 1) to obtain data on their short, medium and long term injury records. The results show that BMI and short term injuries have a moderate positive correlation (0.41). The results show that BMI and medium term injuries have a moderate negative correlation (-0.58). The results show that BMI and long term injury have a very strong negative correlation (-1.03). The scatter graph results show that body composition and short term injuries may have a link therefore further research may be needed. In terms of medium and long term injuries the scatter graph results show that body composition does not have a definite factor on medium and long term injuries.
P2: Carry out / P4: Produce
Contents: General
Page 2- My project aim. Page 19- Review 2/3
Page 3- Abstract of my project. Page 20- Review 3/3
Page 4- Contents page ( general) Page 21-Future recommendations 1/5
Page 5- Contents page (appendices) Page 22-Future recommendations 2/5
Page 6- Contents page ( figures and tables) Page 23-Future recommendations 3/5
Page 7- Acknowledgements. Page 24-Future recommendations 4/5
Page 8- Introduction to my project. Page 25-Future recommendations 5/5
Page 9- Literature review and references.
Page 10- Project hypothesis.
Page 11- Method.
Page 12- Date collection.
Page 13- Data analysis.
Page 14- Results.
Page 15- Discussion.
Page 16- Conclusion.
Page 17- Assessment criteria ( pages 19 -26)
Page 18-Review 1/3
P2: Carry out / P4: Produce

Contents: Appendices
In this section you need to write a page by page contents page (correctly numbered for pages 27-32)
Page 25 - Appendices title page
Page 26 - Appendix 1 ( link to my survey )
Page 27 - Appendix 2 ( link to body fat percentages)
P2: Carry out / P4: Produce

Contents: Figures and Tables
Page 28 - Figures and tables title page.
Page 29- Figures and tables 1 ( correlation between ST rank and BMI)
Page 30 - Figures and tables 2 ( correlation between MT and BMI)
Page 31 - Figures and tables 3 ( correlation between LT and BMI)
Page 32- Figures and tables 4 (raw data chart)
Page 33- Figures and tables 5 (BMI and ST rank data)
Page 34 - Figures and tables 6 ( BMI and MT rank data)
Page 35 - Figures and tables 7 (BMI and LT rank data)
P2: Carry out / P4: Produce
Acknowledgements
I would firstly like to thank my teachers Paul Cox and Mark Sambrook for the help they have given me with my research project. Secondlyy I would like to thank the Worthing college rugby team for there participation in my research project. Finally I would like to thank surveymonkey.com for supplying a simple and effective way to comprise a survey and analyse the data.
P2: Carry out / P4: Produce

Introduction
To determine if a relationship exists between body composition and short, medium and long term injury occurrence rates in male 16-19 year old participation level rugby players.I chose this project because I was interested in the subject of injuries in rugby. I was always wondering what are the factors that leads towards injury, especially in rugby because of the nature of the sport. I myself have suffered with various short, medium and long term injuries that have stopped me from playing, therefore I decided to see if there was a correlation between body composition and injury rates in male 16-19 year old rugby players. The reason I chose body composition as my variable was because of the variety of body composition in my population (my college rugby team). I decided to use my college rugby team as they are easily assessable and when comprising my primary data it can be collected with ease. I started my project on the 6th of march and finished on the 27th. On the 8th I made a survey monkey called ‘ sport science injury survey‘. On the 19th I collection all this raw data, on the 20th I then analysed all this data and comprised it. On the 20th I followed on my primary research and collected all the BMIs of the people who completed the survey.
P2: Carry out / P4: Produce

Literature Review and References
My literature review can be found below.
https://worthingsportscience.wordpress.com/2015/02/26/unit-5-literacy-review-alfie-dunk/
P2: Carry out / P4: Produce
Project Hypothesis
Hypothesis 1- That there is a relationship between BMI and injury rates in male 16-19 year old rugby players.
Hypothesis 2- That BMI has a significant relationship with short term injury rates.
P2: Carry out / P4: Produce
Method
Firstly I started by posting a online survey to my population, which I comprised myself (appendix 1). I created and posted this on the 6th of march and collected the data on the 19th.
On the 20th I collected and comprised this data. Following this on the 20th I also collected the BMIs of my population. On the 24th I used excel to make a spreadsheet to compare the two variables against each other.
On excel I ranked the BMIs and short, medium and long term goals, Idid this because I used the Spearmans rank to then rank my data. (figures and tables 4)
I then went onto comparing BMI to short, medium and long term goals separately( figures and tables 5,6 and 7). After this I was able to create three scatter graphs (figures and tables 1,2 and 3). My write up for the research project will be completed on the 27th.
P3: Collect and record / M2: Correctly analyse & describe techniques / D1: Correctly analyse & explain techniques

Data Collection
• My data is primary as I will comprise the sports injury survey myself and I will collecting the height and weight of my participants to calculate their BMI. My data is nominal data as I will be categorising my participants into position and then further into body composition groups. My data is quantitative as I will be using a survey to get information from a large group of people. My data is experimental and comparative as I will be looking at the effects of an independent variable (body composition) on a dependent variable (injury rates). I will also be looking at the affects of position and BMI against injury rates. My data is both lab and field based. I will be collecting my participants height and weight in a lab based environment. I will then be asking them to complete the survey in their own time.
P3: Collect and record / M2: Correctly analyse & describe techniques / D1: Correctly analyse & explain techniques
Data Analysis
For my research I had to analyse the data I collected myself from my primary data. I used Microsoft excel to collate this raw data, I used Spearmans rank in order to see if there was any correlation between the BMIs I collected and the results from my survey. I used this process to create three scatter graphs in relation to BMI and short medium and long term injuries. The benefits of a scatter graph is that is shows any relationship between two variables for a set pair of data e.g. BMI and medium term injuries have a strong negative correlation. A scatter graph was suitable for my data as i was comparing a independent variable against a dependent variables.
P3: Collect and record / M2: Correctly analyse & describe techniques / D1: Correctly analyse & explain techniques
ResultsThe results show that BMI and short term injuries have a moderate positive correlation (0.41) (Figures and tables 1 and 5) . The results show that BMI and medium term injuries have a moderate negative correlation (-0.58) (Figures and tables 2 and 6). The results show that BMI and long term injury have a very strong negative correlation (-1.03) (Figures and tables 3 and 7). My results found differ from each dependent variable (short, medium and long term), the main judgment from my results is that BMI has the most effect on short term injuries.• Hypothesis one is supported as my results generally show a
moderate correlation between body composition and injury rates (figures and tables 1,2 and 3).
• Hypothesis two was supported as I found body composition and short term injuries have the strongest relationship ( figures and tables 1)
P3: Collect and record / M2: Correctly analyse & describe techniques / D1: Correctly analyse & explain techniques

Discussion
All my results had moderate or greater correlation’s whether they were positive or negative. My scatter graphs only showed that there was more of a relationship between body composition and short term injuries ibelieve this was because short term injuries are more common in rugby than medium and long. I believe justifying my short ,medium and long term injuries results is hard as when i collected the answers i was relying on peoples memory, therefore my results may be unreliable and thats why i found it hard to analyse the data.
P2: Carry out / P4: Produce
ConclusionMy aim Is to look at if there a relationship between body composition and short, medium and long term injury rates in rugby.
The first key trend from my literacy review is that all of my research found are about male athletes, this can be seen as an disadvantage to my validity and reliability as I do not account for body compositions link to injury in female athletes. This key trend is helpful to me though as my study is only looking at males. 6 out of 10 of my research pieces looks at elite sport, they are all longitudinal studies as well which is helpful to me as I can replicate the detail and precision shown in these studies. 8 out of 10 of my pieces looked at rugby based research which is good as my study looks at male 16-19 year old rugby players.
My results didn't really give me a indication for my first hypothesis as there was some correlation between body composition and injury rates I think if I had a bigger sample my data would be more reliable. My results did show that there is more of a correlation between body composition and short term injuries therefore supporting hypotheses two and three. I believe I found this because short term injuries were the most common within my population, I think with a bigger population more medium and long term injuries would be found.
P2: Carry out / P4: Produce

Review (1/3)I believe project conclusions met project aims well as I met my aims and hypotheses even though the results were not at strong as I thought.
My first aim was to Establish body composition of players in sample. I believe this was achieved as I successfully collected the BMIs of all of my participants.
My second aim was to Classify injury type by players in sample and body composition. I believe that this wasn’t really met as in my survey I asked questions about duration more which links to my third aim more than aim two. I asked a question about acute injury's but didn’t ask about other types of injuries, I also didn’t really relate the degree of the injury in my research project just the duration.
My third aim was to Record injury duration, injury type by players in sample and body composition I believe that I met this aim as I successfully record injury duration in my survey (appendix 1 ).
P5: Describe / M3: Explain / D2: Justify

Review (2/3)
I believe the strengths of my research project was my ability to stick to deadlines and make sure I planned myself enough time to do the project. Another strength was the validity and reliability of my BMI data as collected this myselfI also collect the height and weight twice to ensure reliability.
P5: Describe / M3: Explain / D2: Justify
Review (3/3)
I think my knowledge of excel was weak, therefore Ihad to gain external help this put my slightly behind on my time scale. I think another area of improvement for my research project was that Irelied on peoples memory to get results of there injury records (appendix 1) therefore I would think an area for improvement would to make the study longer and keep a injury record log for players and games through out a season.
P5: Describe / M3: Explain / D2: Justify

Future Recommendations (1/5)
If this project was to be repeated again I would recommend using other ways to determine Body composition as BMI is not accurate for rugby players as my average BMI in my study was 26.3 which is seen as overweight and classed as unhealthy. I don't think this a true representation of my participants as due to the nature of theconditioning of rugby players they tend to be heavier.
When calculating BMI is doesn't take into account muscle mass and other factors e.g. one of my athletes had a BMI of 25 which is seen as over weight but only has a body fat percentage of 11% body fat which is seen in the good category according to (appendix 2). Therefore suggesting other means of calculating body composition would give more valid and reliable results.
P4: Produce / P5: Describe / M3: Explain / D2: Justify

Future Recommendations (2/5)
The benefits of measuring body composition in other ways rather than BMI would be more reliability. Hydrostatic Weighing would give better results and make the project more valid in the future.The only negative is that piece of equipment isn't very accessible to the general public. This type of measuring will give a true representation of body composition.Hydrostatic Weighing is the most effect way of measuring body composition.
P4: Produce / P5: Describe / M3: Explain / D2: Justify

Future Recommendations (3/5)
If my research project was to be carried out again I would recommend extending the length of the project to a whole rugby season and keep a injury log because in my project I was asking people to recall there injuries over the season this is unreliable as peoples memory can sometimes not recall all the information or the wrong information therefore when using a survey and recording injury records the data can be backed up with the injury log, this would make the project more reliable.
P4: Produce / P5: Describe / M3: Explain / D2: Justify

Future Recommendations (4/5)
If my project was to be repeated again I would recommend making the population larger as the more participants would make the results more reliable and valid. If the population increased there would be a wider range of people in my data the more participants there are the more representative of the population, gender, ethnicity, religion and age can all effect the results and the more participants the research has the more true the statistical analysis is.
P4: Produce / P5: Describe / M3: Explain / D2: Justify
Future Recommendations (5/5)
My final recommendation would to do the research project on different participations as to fully determine if body composition has a effect on injury records, this would be benefit as it would make the project more valid and reliable. I would also suggest doing research with males and females as again this would give more data therefore making a more reliable research project.
P4: Produce / P5: Describe / M3: Explain / D2: Justify

Research Project Appendices

Appendix 1
https://www.surveymonkey.com/create/?sm=mAYpHHxcKGLHDuRyZgP01jjRYpp3z56vJHHINjltxug%3d
This is a link to the survey I created.
Appendix 2
http://www.humankinetics.com/excerpts/excerpts/normal-ranges-of-body-weight-and-body-fat

Research Project Figures and Tables
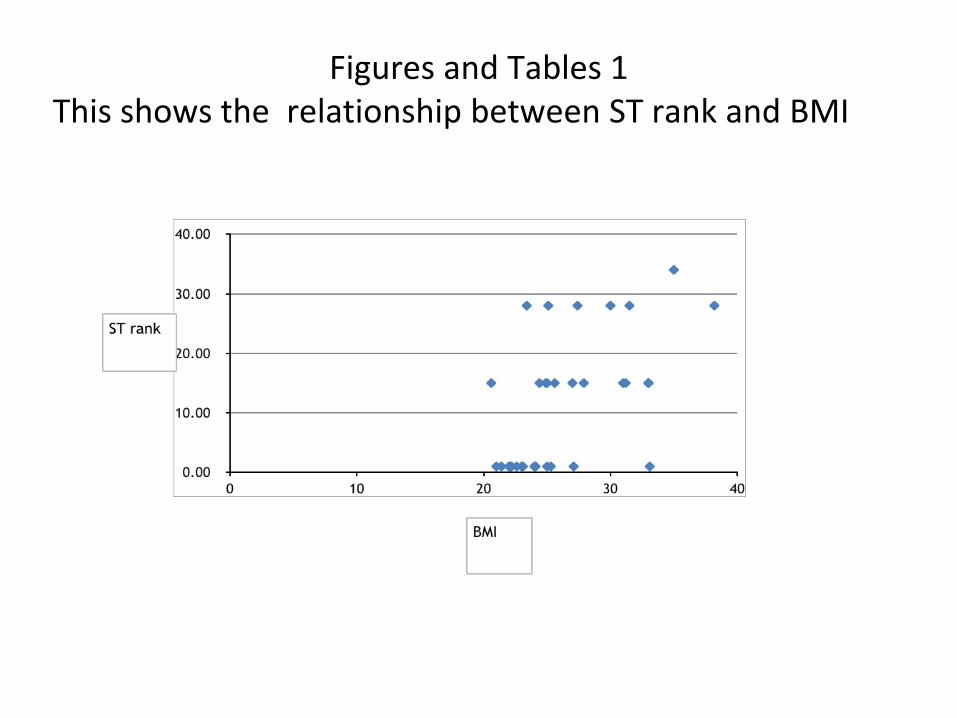
Figures and Tables 1This shows the relationship between ST rank and BMI
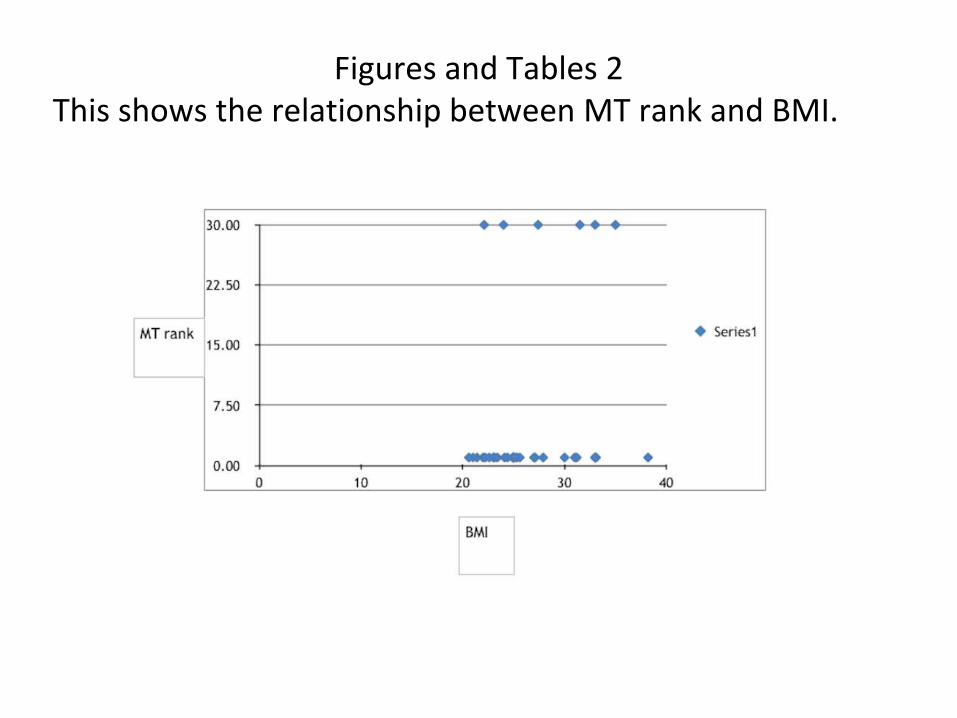
Figures and Tables 2This shows the relationship between MT rank and BMI.
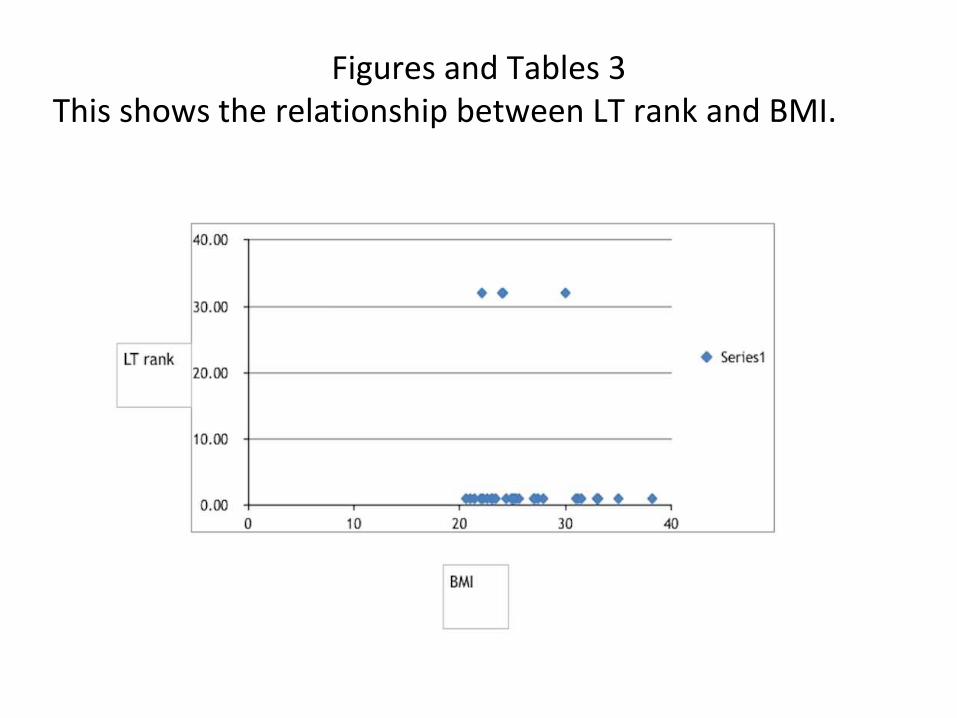
Figures and Tables 3This shows the relationship between LT rank and BMI.

Figures and Tables 4This shows my initial raw data and ranking.
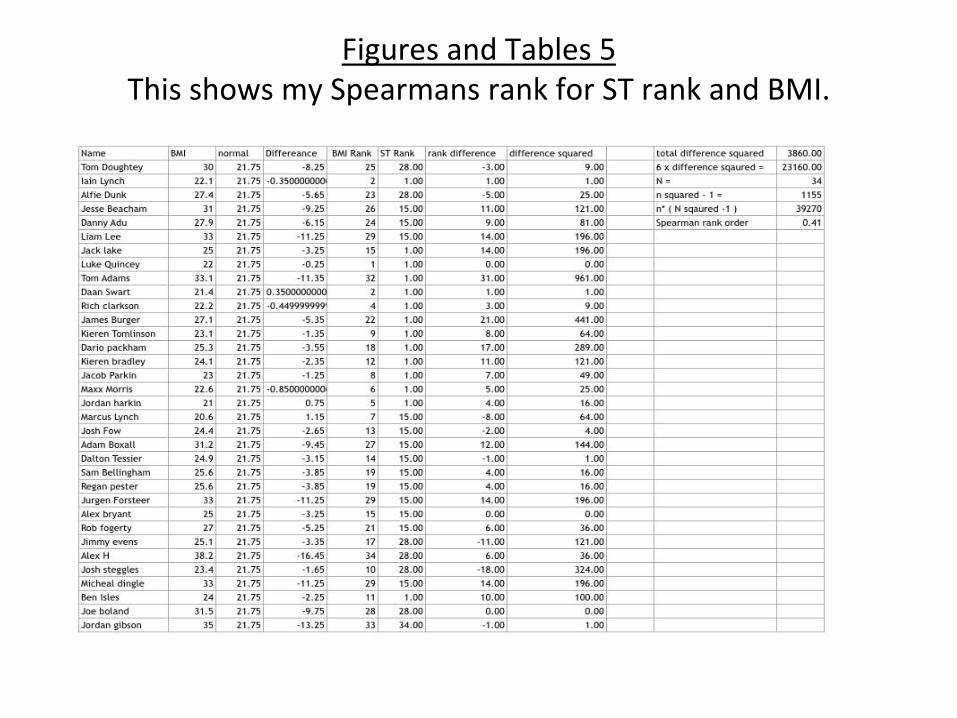
Figures and Tables 5This shows my Spearmans rank for ST rank and BMI.

Figures and tables 6This shows my Spearmans rank for MT rank and BMI.
34
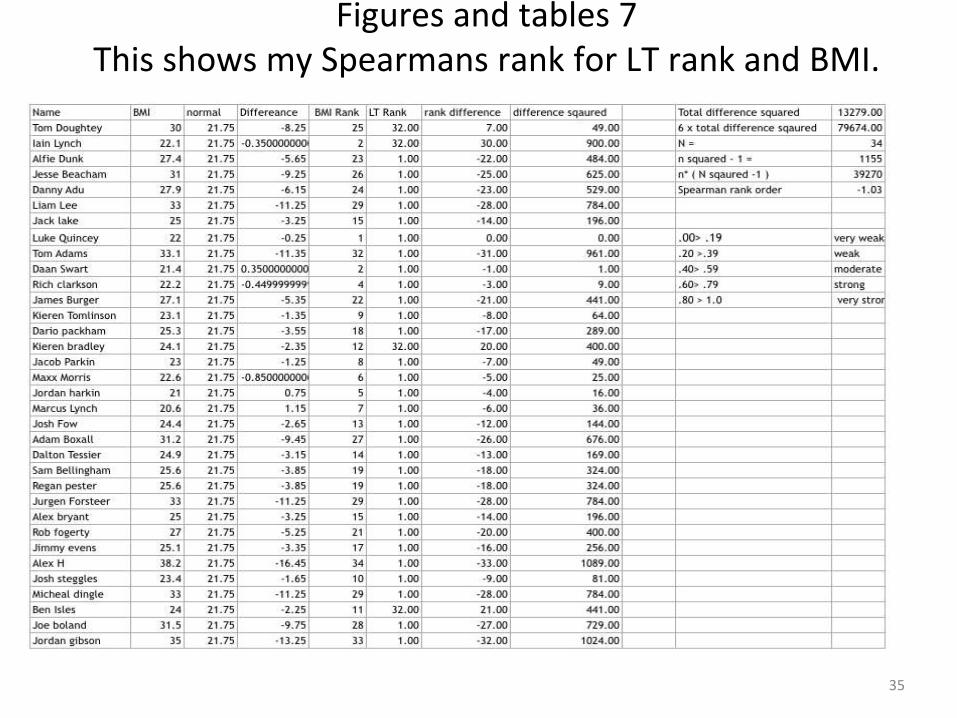
Figures and tables 7This shows my Spearmans rank for LT rank and BMI.
35


![Complete Unit 5 Notes [5]](https://static.fdocuments.us/doc/165x107/55cf8ec3550346703b956163/complete-unit-5-notes-5.jpg)