Union Pacific Corporation 2019 INVESTOR FACT BOOK
36
Union Pacific Corporation 2019 INVESTOR FACT BOOK
Transcript of Union Pacific Corporation 2019 INVESTOR FACT BOOK
Union Pacific Corporation
2019 INVESTOR FACT BOOK

2019 Union Pacific Fact Book OVERVIEW
1
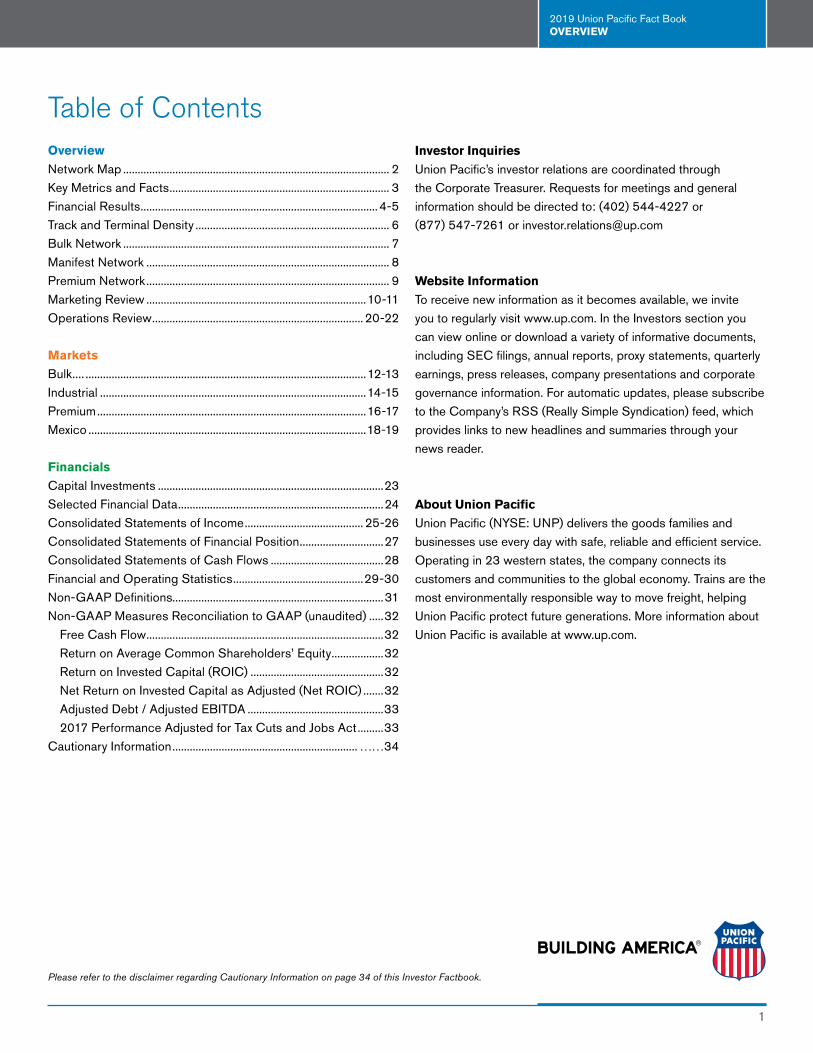
Table of ContentsOverview
Network Map ............................................................................................ 2
Key Metrics and Facts ............................................................................ 3
Financial Results .................................................................................. 4-5
Track and Terminal Density ................................................................... 6
Bulk Network ............................................................................................ 7
Manifest Network .................................................................................... 8
Premium Network .................................................................................... 9
Marketing Review ............................................................................10-11
Operations Review ......................................................................... 20-22
Markets
Bulk.... .................................................................................................12-13
Industrial ............................................................................................14-15
Premium .............................................................................................16-17
Mexico ................................................................................................18-19
Financials
Capital Investments ..............................................................................23
Selected Financial Data .......................................................................24
Consolidated Statements of Income ......................................... 25-26
Consolidated Statements of Financial Position .............................27
Consolidated Statements of Cash Flows .......................................28
Financial and Operating Statistics .............................................29-30
Non-GAAP Definitions.........................................................................31
Non-GAAP Measures Reconciliation to GAAP (unaudited) .....32
Free Cash Flow ..................................................................................32
Return on Average Common Shareholders’ Equity ..................32
Return on Invested Capital (ROIC) ..............................................32
Net Return on Invested Capital as Adjusted (Net ROIC) .......32
Adjusted Debt / Adjusted EBITDA ...............................................33
2017 Performance Adjusted for Tax Cuts and Jobs Act .........33
Cautionary Information ................................................................ ……34
Investor Inquiries
Union Pacific’s investor relations are coordinated through
the Corporate Treasurer. Requests for meetings and general
information should be directed to: (402) 544-4227 or
(877) 547-7261 or [email protected]
Website Information
To receive new information as it becomes available, we invite
you to regularly visit www.up.com. In the Investors section you
can view online or download a variety of informative documents,
including SEC filings, annual reports, proxy statements, quarterly
earnings, press releases, company presentations and corporate
governance information. For automatic updates, please subscribe
to the Company’s RSS (Really Simple Syndication) feed, which
provides links to new headlines and summaries through your
news reader.
About Union Pacific
Union Pacific (NYSE: UNP) delivers the goods families and
businesses use every day with safe, reliable and efficient service.
Operating in 23 western states, the company connects its
customers and communities to the global economy. Trains are the
most environmentally responsible way to move freight, helping
Union Pacific protect future generations. More information about
Union Pacific is available at www.up.com.
Please refer to the disclaimer regarding Cautionary Information on page 34 of this Investor Factbook.
2019 Union Pacific Fact Book OVERVIEW
2
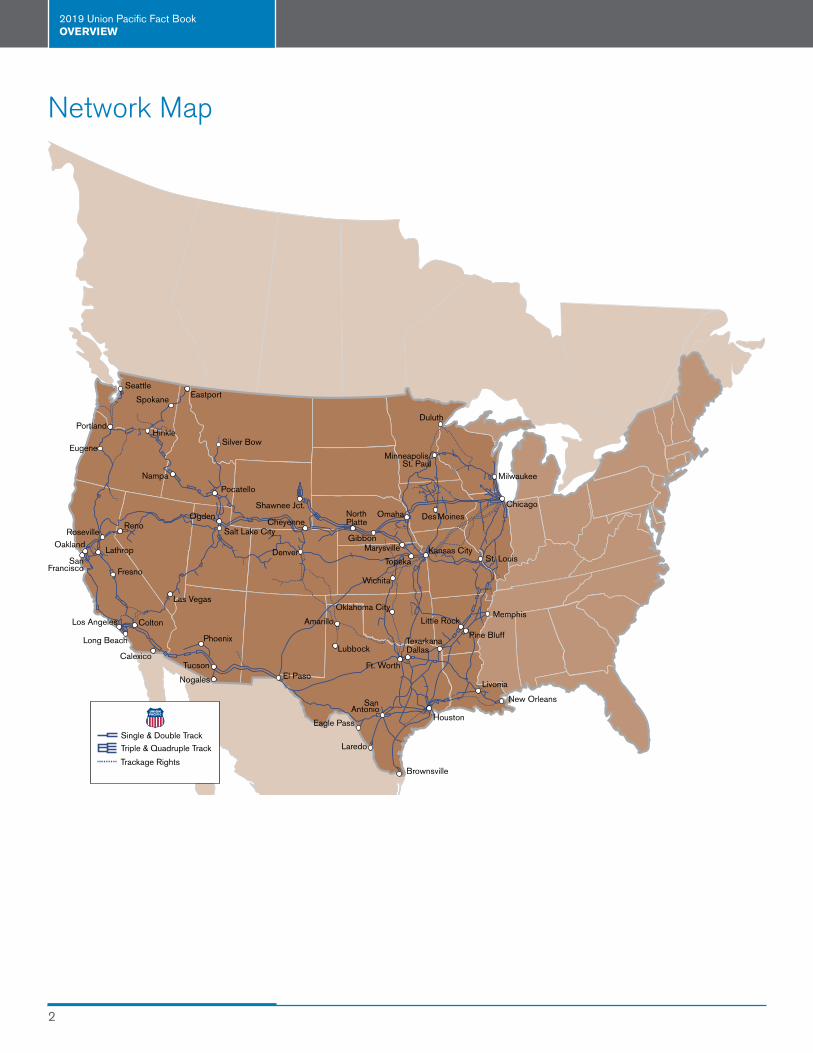
Network Map
SeattleEastportSpokane
Portland
Eugene
Hinkle
Pocatello
RenoRoseville
Lathrop
Fresno
Oakland
SanFrancisco
Las Vegas
Colton
Calexico
Los Angeles
Long Beach
Nogales
Tucson
Phoenix
El Paso
Ogden
Salt Lake City
Denver
CheyenneNorthPlatte
Omaha Des Moines
Minneapolis/ St. Paul
Duluth
Milwaukee
Chicago
Kansas CitySt. Louis
Memphis
Pine Bluff
Little Rock
Texarkana
New Orleans
Livonia
Houston
Brownsville
Laredo
San Antonio
Lubbock
Amarillo
Ft. Worth
Dallas
Eagle Pass
Oklahoma City
Wichita
Topeka
Nampa
Silver Bow
Shawnee Jct.
GibbonMarysville
Single & Double Track
Triple & Quadruple Track
Trackage Rights
2019 Union Pacific Fact Book OVERVIEW
3
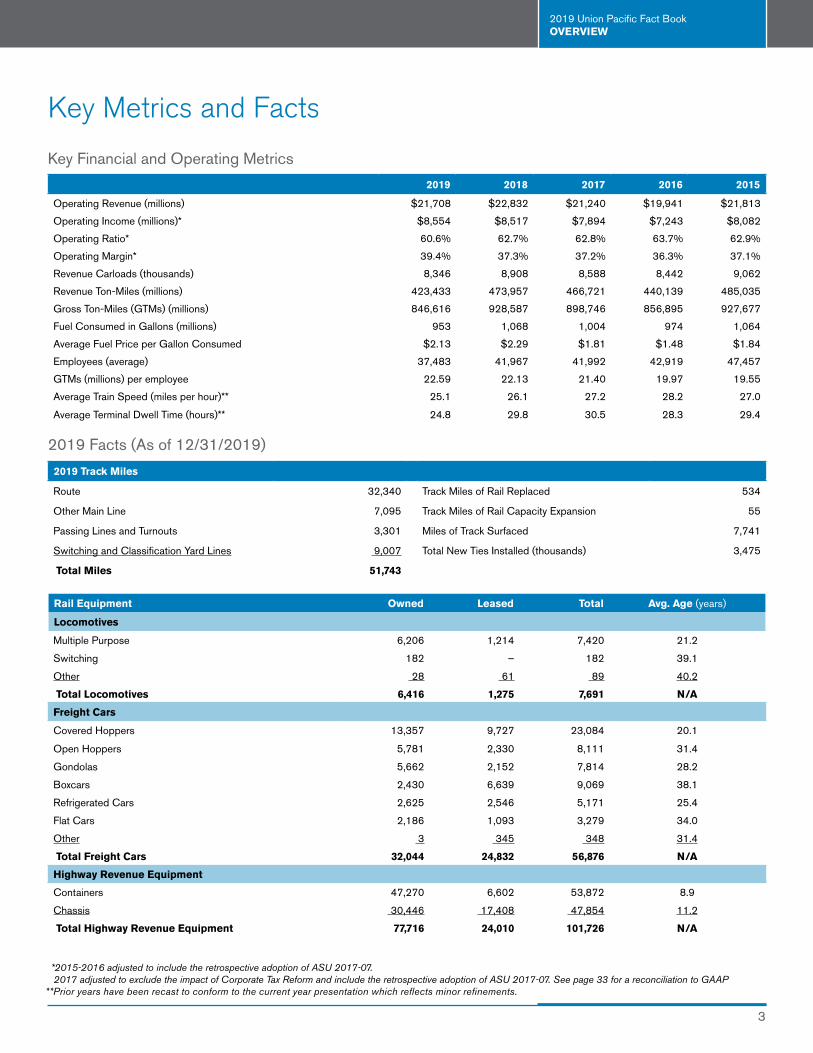
2019 2018 2017 2016 2015
Operating Revenue (millions) $21,708 $22,832 $21,240 $19,941 $21,813
Operating Income (millions)* $8,554 $8,517 $7,894 $7,243 $8,082
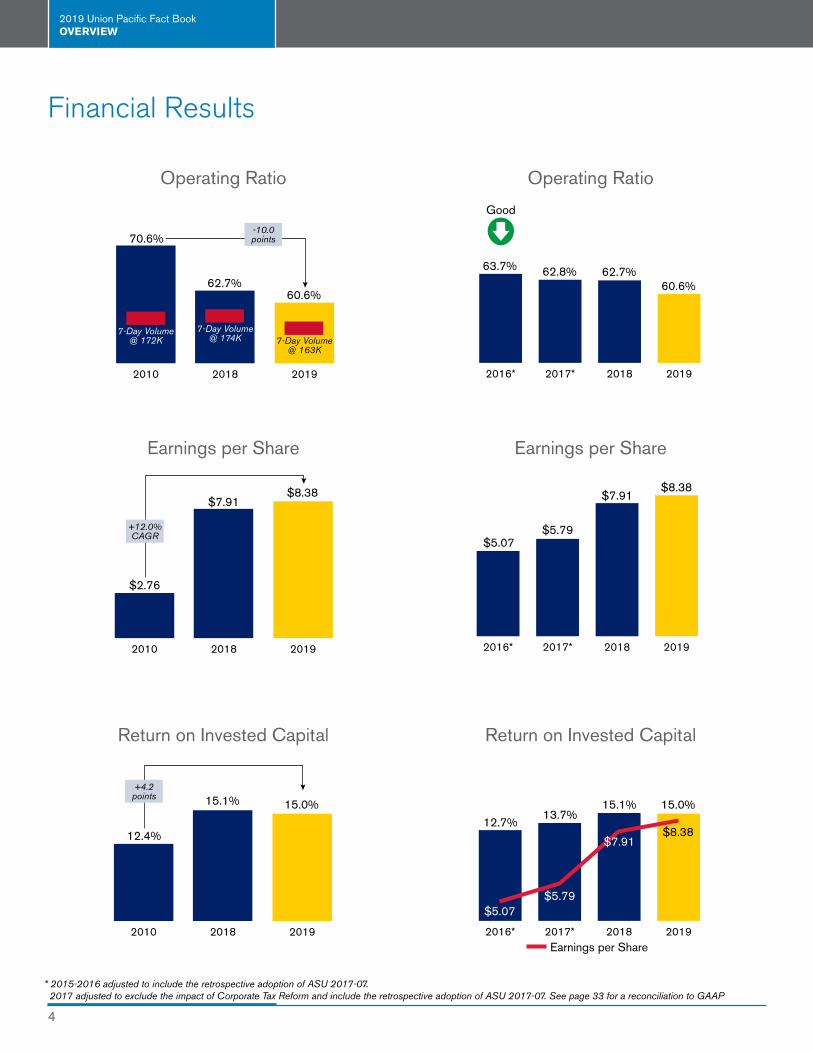
Operating Ratio* 60.6% 62.7% 62.8% 63.7% 62.9%
Operating Margin* 39.4% 37.3% 37.2% 36.3% 37.1%
Revenue Carloads (thousands) 8,346 8,908 8,588 8,442 9,062
Revenue Ton-Miles (millions) 423,433 473,957 466,721 440,139 485,035
Gross Ton-Miles (GTMs) (millions) 846,616 928,587 898,746 856,895 927,677
Fuel Consumed in Gallons (millions) 953 1,068 1,004 974 1,064
Average Fuel Price per Gallon Consumed $2.13 $2.29 $1.81 $1.48 $1.84
Employees (average) 37,483 41,967 41,992 42,919 47,457
GTMs (millions) per employee 22.59 22.13 21.40 19.97 19.55
Average Train Speed (miles per hour)** 25.1 26.1 27.2 28.2 27.0
Average Terminal Dwell Time (hours)** 24.8 29.8 30.5 28.3 29.4
Key Financial and Operating Metrics
Key Metrics and Facts
Rail Equipment Owned Leased Total Avg. Age (years)
Locomotives
Multiple Purpose 6,206 1,214 7,420 21.2
Switching 182 – 182 39.1
Other 28 61 89 40.2
Total Locomotives 6,416 1,275 7,691 N/A
Freight Cars
Covered Hoppers 13,357 9,727 23,084 20.1
Open Hoppers 5,781 2,330 8,111 31.4
Gondolas 5,662 2,152 7,814 28.2
Boxcars 2,430 6,639 9,069 38.1
Refrigerated Cars 2,625 2,546 5,171 25.4
Flat Cars 2,186 1,093 3,279 34.0
Other 3 345 348 31.4
Total Freight Cars 32,044 24,832 56,876 N/A
Highway Revenue Equipment
Containers 47,270 6,602 53,872 8.9
Chassis 30,446 17,408 47,854 11.2
Total Highway Revenue Equipment 77,716 24,010 101,726 N/A
2019 Facts (As of 12/31/2019)
2019 Track Miles
Route 32,340 Track Miles of Rail Replaced 534
Other Main Line 7,095 Track Miles of Rail Capacity Expansion 55
Passing Lines and Turnouts 3,301 Miles of Track Surfaced 7,741
Switching and Classification Yard Lines 9,007 Total New Ties Installed (thousands) 3,475
Total Miles 51,743
*2015-2016 adjusted to include the retrospective adoption of ASU 2017-07. 2017 adjusted to exclude the impact of Corporate Tax Reform and include the retrospective adoption of ASU 2017-07. See page 33 for a reconciliation to GAAP**Prior years have been recast to conform to the current year presentation which reflects minor refinements.
2019 Union Pacific Fact Book OVERVIEW
4
201920182010
$2.76
$7.91
+12.0% CAGR
$8.38
201920182017*2016*
$5.79$5.07
$7.91$8.38
201920182017*2016*
63.7% 62.7%60.6%
62.8%
Good
201920182010
70.6%
62.7%
7-Day Volume@ 172K
-10.0points
60.6%
7-Day Volume@ 163K
7-Day Volume@ 174K
7 Day Volume@ 188K
201920182017*2016*
12.7%
Earnings per Share
13.7%15.1% 15.0%
$5.07
$7.91
$5.79
$8.38
201920182010
12.4%
15.0%
+4.2 points 15.1%
Financial Results
Operating Ratio
Earnings per Share
Return on Invested Capital
Operating Ratio
Earnings per Share
Return on Invested Capital
* 2015-2016 adjusted to include the retrospective adoption of ASU 2017-07. 2017 adjusted to exclude the impact of Corporate Tax Reform and include the retrospective adoption of ASU 2017-07. See page 33 for a reconciliation to GAAP
2019 Union Pacific Fact Book OVERVIEW
5
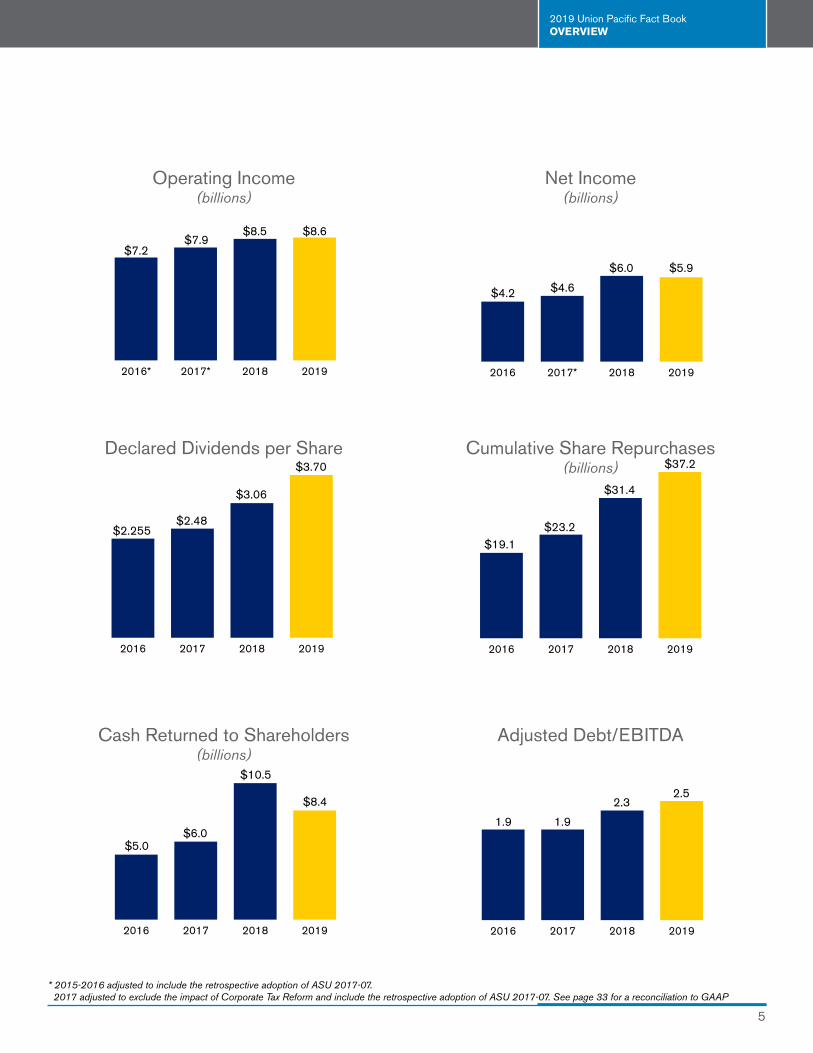
2019201820172016
$19.1
$31.4
$37.2
$23.2
201920182017*2016
$4.2
$6.0 $5.9
$4.6
2019201820172016
1.9 1.9
2.32.5
2019201820172016
$5.0$6.0
$8.4
$10.5
2019201820172016
$2.255
$3.06
$3.70
$2.48
201920182017*2016*
$7.2
$8.5 $8.6$7.9
Net Income (billions)
Cumulative Share Repurchases (billions)
Adjusted Debt/EBITDA
Operating Income (billions)
Declared Dividends per Share
Cash Returned to Shareholders(billions)
* 2015-2016 adjusted to include the retrospective adoption of ASU 2017-07. 2017 adjusted to exclude the impact of Corporate Tax Reform and include the retrospective adoption of ASU 2017-07. See page 33 for a reconciliation to GAAP
2019 Union Pacific Fact Book OVERVIEW
6
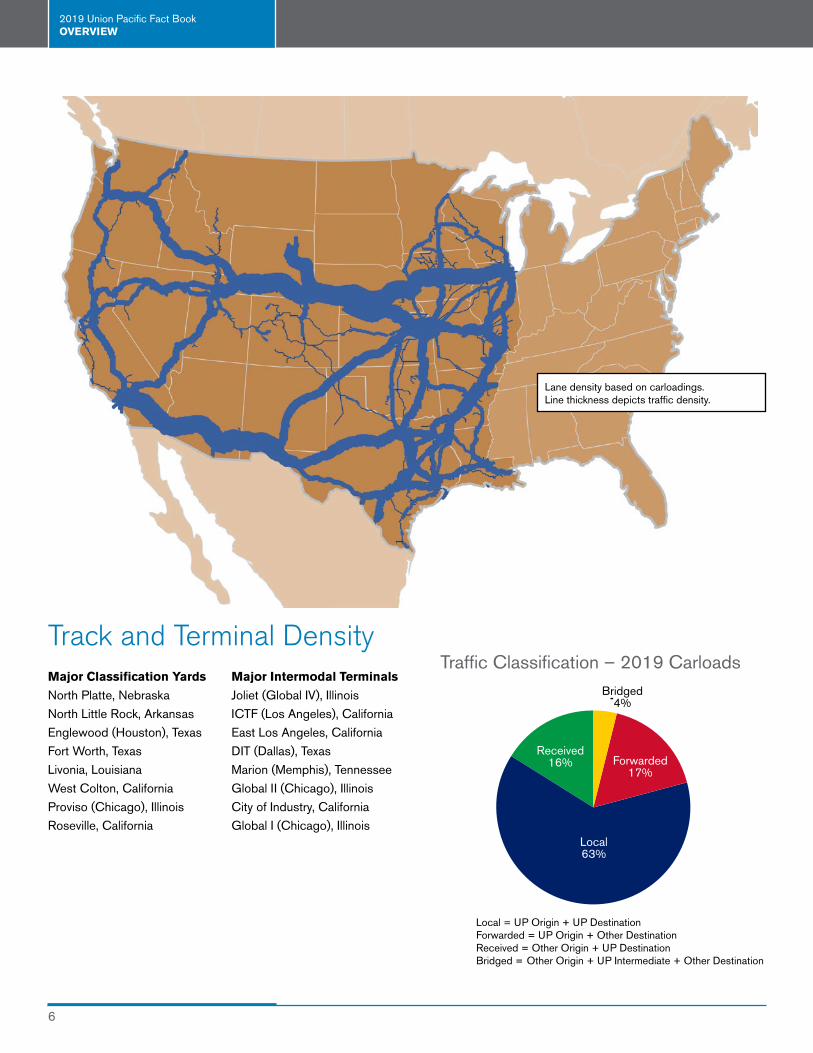
Forwarded17%
Local63%
Received16%
Bridged4%
Traffic Classification – 2019 Carloads
Local = UP Origin + UP DestinationForwarded = UP Origin + Other DestinationReceived = Other Origin + UP DestinationBridged = Other Origin + UP Intermediate + Other Destination
Major Classification Yards
North Platte, Nebraska
North Little Rock, Arkansas
Englewood (Houston), Texas
Fort Worth, Texas
Livonia, Louisiana
West Colton, California
Proviso (Chicago), Illinois
Roseville, California
Major Intermodal Terminals
Joliet (Global IV), Illinois
ICTF (Los Angeles), California
East Los Angeles, California
DIT (Dallas), Texas
Marion (Memphis), Tennessee
Global II (Chicago), Illinois
City of Industry, California
Global I (Chicago), Illinois
Track and Terminal Density
Lane density based on carloadings. Line thickness depicts traffic density.
2019 Union Pacific Fact Book OVERVIEW
7
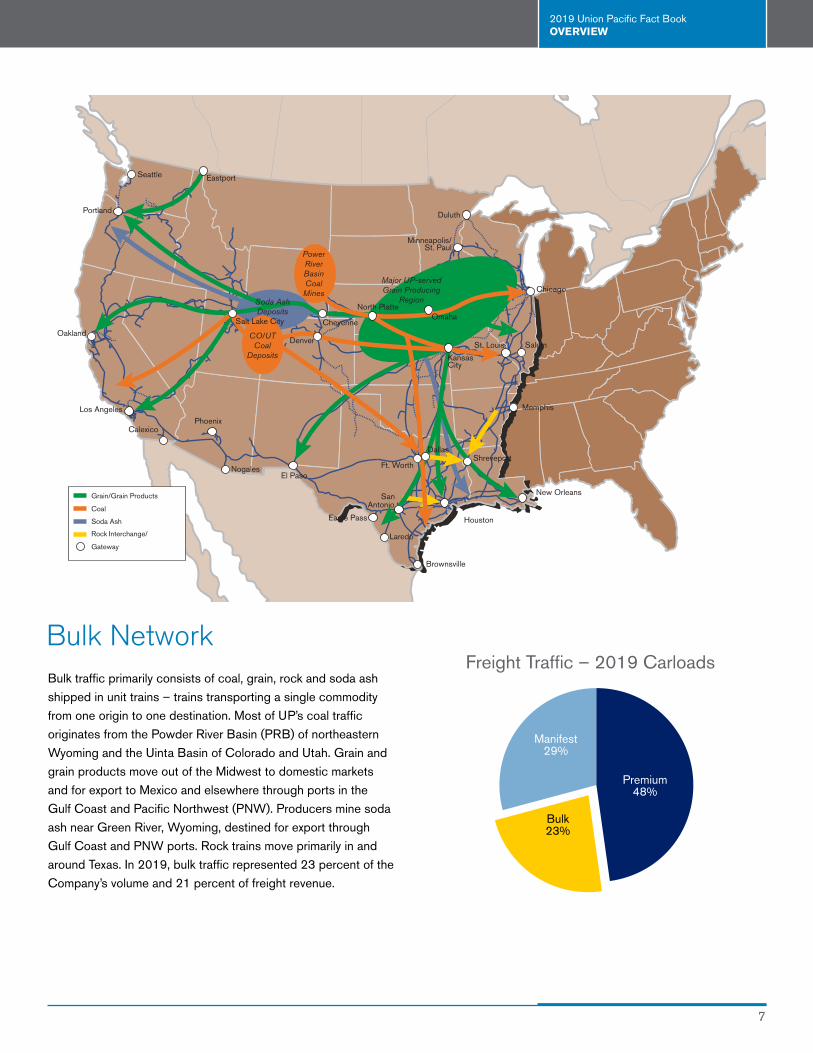
Premium48%
Manifest29%
Bulk23%
Phoenix
Seattle
Salt Lake City
Portland
Denver
El Paso
Laredo
SanAntonio
Brownsville
Houston
New Orleans
Memphis
KansasCity
Chicago
North Platte
Cheyenne
Ft. Worth
Dallas
St. LouisOakland
Los Angeles
Omaha
Duluth
Minneapolis/St. Paul
Eagle Pass
Eastport
NogalesShreveport
Calexico
Major UP-served Grain Producing
Region
PowerRiverBasinCoalMines
CO/UTCoal
Deposits
Soda Ash Deposits
Salem
Grain/Grain Products
Coal
Soda Ash
Rock Interchange/
Gateway
Bulk NetworkBulk traffic primarily consists of coal, grain, rock and soda ash
shipped in unit trains – trains transporting a single commodity
from one origin to one destination. Most of UP’s coal traffic
originates from the Powder River Basin (PRB) of northeastern
Wyoming and the Uinta Basin of Colorado and Utah. Grain and
grain products move out of the Midwest to domestic markets
and for export to Mexico and elsewhere through ports in the
Gulf Coast and Pacific Northwest (PNW). Producers mine soda
ash near Green River, Wyoming, destined for export through
Gulf Coast and PNW ports. Rock trains move primarily in and
around Texas. In 2019, bulk traffic represented 23 percent of the
Company’s volume and 21 percent of freight revenue.
Freight Traffic – 2019 Carloads
2019 Union Pacific Fact Book OVERVIEW
8
Premium48%
Manifest29%
Bulk23%
Phoenix
Seattle
Salt Lake City
Portland
Spokane
Denver
El Paso
Laredo
SanAntonio
Brownsville
Houston
New Orleans
Memphis
KansasCity
ChicagoNorth Platte
Cheyenne
Ft. Worth
Dallas
St. Louis
Oakland
Los Angeles
Omaha
Pocatello
Duluth
Minneapolis/St. Paul
Milwaukee
Eagle Pass
Tucson
Eastport
NogalesShreveport
Calexico
Salem
Longview
Network Terminals
Regional Terminals
Storage-in-Transit
Interchange/Gateway
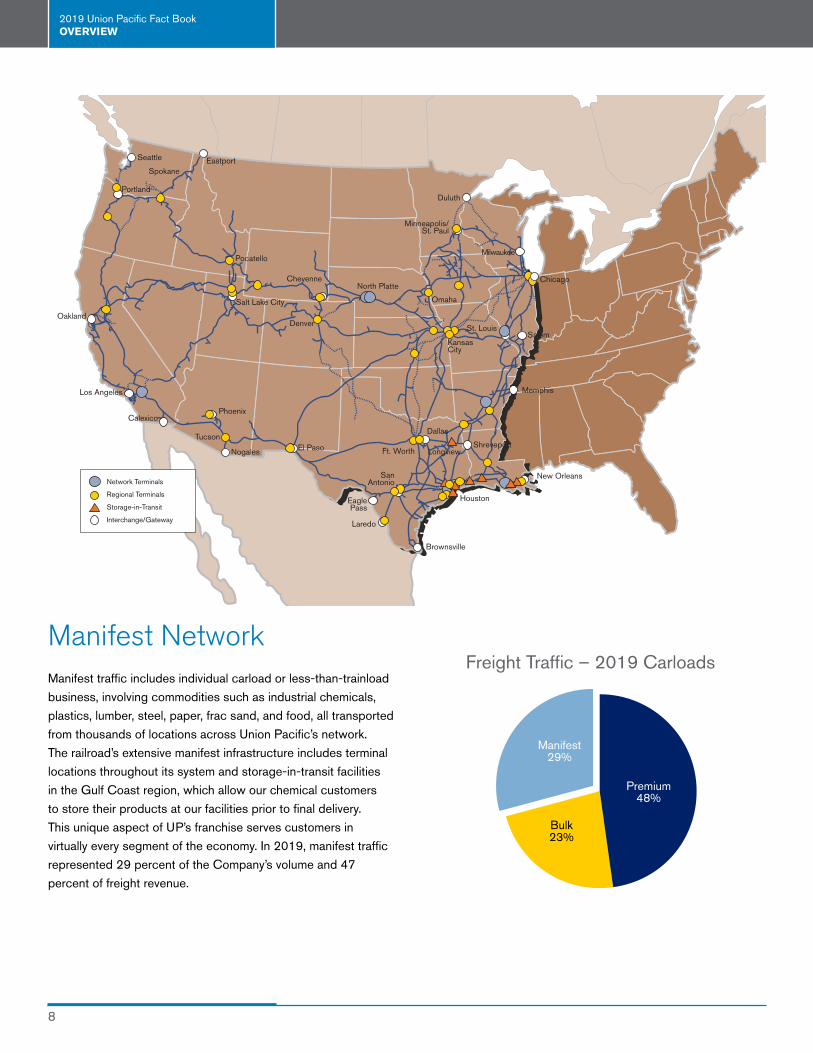
Manifest NetworkManifest traffic includes individual carload or less-than-trainload
business, involving commodities such as industrial chemicals,
plastics, lumber, steel, paper, frac sand, and food, all transported
from thousands of locations across Union Pacific’s network.
The railroad’s extensive manifest infrastructure includes terminal
locations throughout its system and storage-in-transit facilities
in the Gulf Coast region, which allow our chemical customers
to store their products at our facilities prior to final delivery.
This unique aspect of UP’s franchise serves customers in
virtually every segment of the economy. In 2019, manifest traffic
represented 29 percent of the Company’s volume and 47
percent of freight revenue.
Freight Traffic – 2019 Carloads
2019 Union Pacific Fact Book OVERVIEW
9
Premium48%
Manifest29%
Bulk23%
Phoenix
Seattle
Salt Lake City
Portland
Spokane
Denver
El Paso
Laredo
SanAntonio
Brownsville
Houston
New Orleans
Memphis
KansasCity
Chicago
Ft. Worth
Dallas
St.Louis
Oakland
Los Angeles
Council Bluffs
Las Vegas
Minneapolis/St. Paul
Sparks
Lathrop
Oklahoma City
Eagle Pass
Shreveport
Tucson
Long Beach
Nogales
Silver Bow
CalexicoSanta
Teresa
Santa Rosa
Salem
Intermodal Terminals
Ports
Interchange Points
Automotive Distribution Centers
Automotive Assembly Centers
Cross-Border Gateways
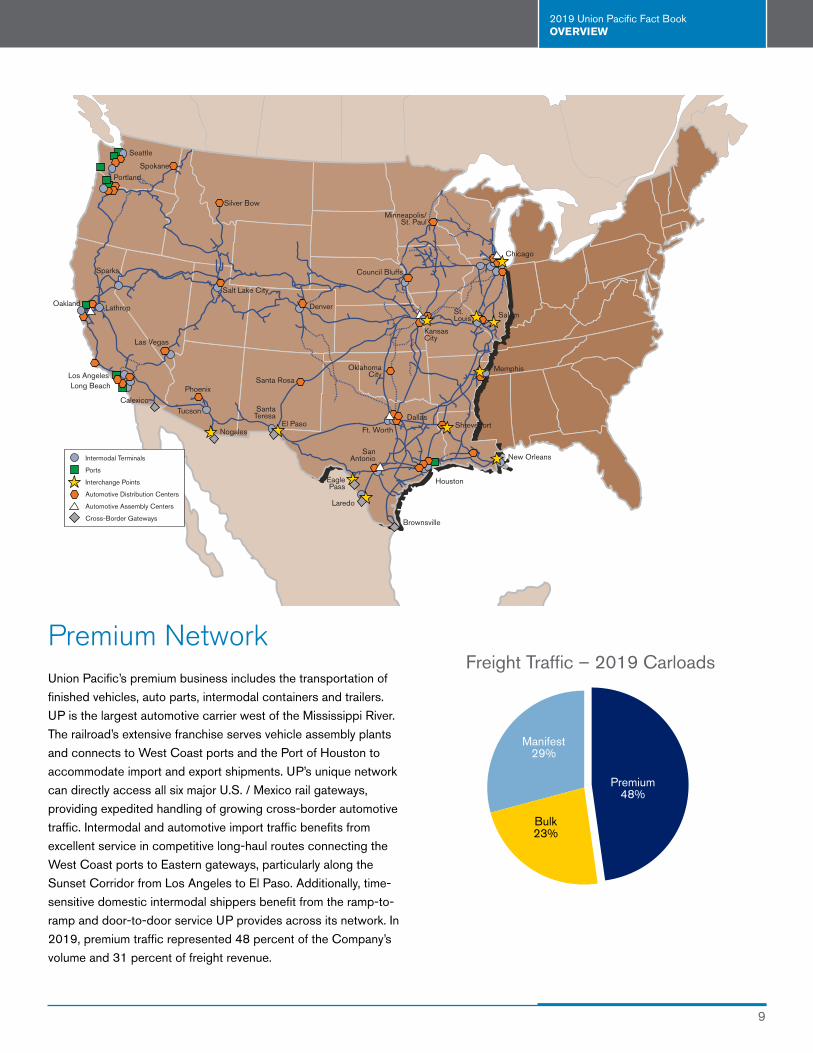
Premium NetworkUnion Pacific’s premium business includes the transportation of
finished vehicles, auto parts, intermodal containers and trailers.
UP is the largest automotive carrier west of the Mississippi River.
The railroad’s extensive franchise serves vehicle assembly plants
and connects to West Coast ports and the Port of Houston to
accommodate import and export shipments. UP’s unique network
can directly access all six major U.S. / Mexico rail gateways,
providing expedited handling of growing cross-border automotive
traffic. Intermodal and automotive import traffic benefits from
excellent service in competitive long-haul routes connecting the
West Coast ports to Eastern gateways, particularly along the
Sunset Corridor from Los Angeles to El Paso. Additionally, time-
sensitive domestic intermodal shippers benefit from the ramp-to-
ramp and door-to-door service UP provides across its network. In
2019, premium traffic represented 48 percent of the Company’s
volume and 31 percent of freight revenue.
Freight Traffic – 2019 Carloads
2019 Union Pacific Fact Book MARKETS
10
0000000000000000000000000000000
2019201820172016
8,442
ManifestPremium
8,908
Bulk
48% 49%
25% 25%
27% 26%8,346
48%
23%
29%
8,588
48%
25%
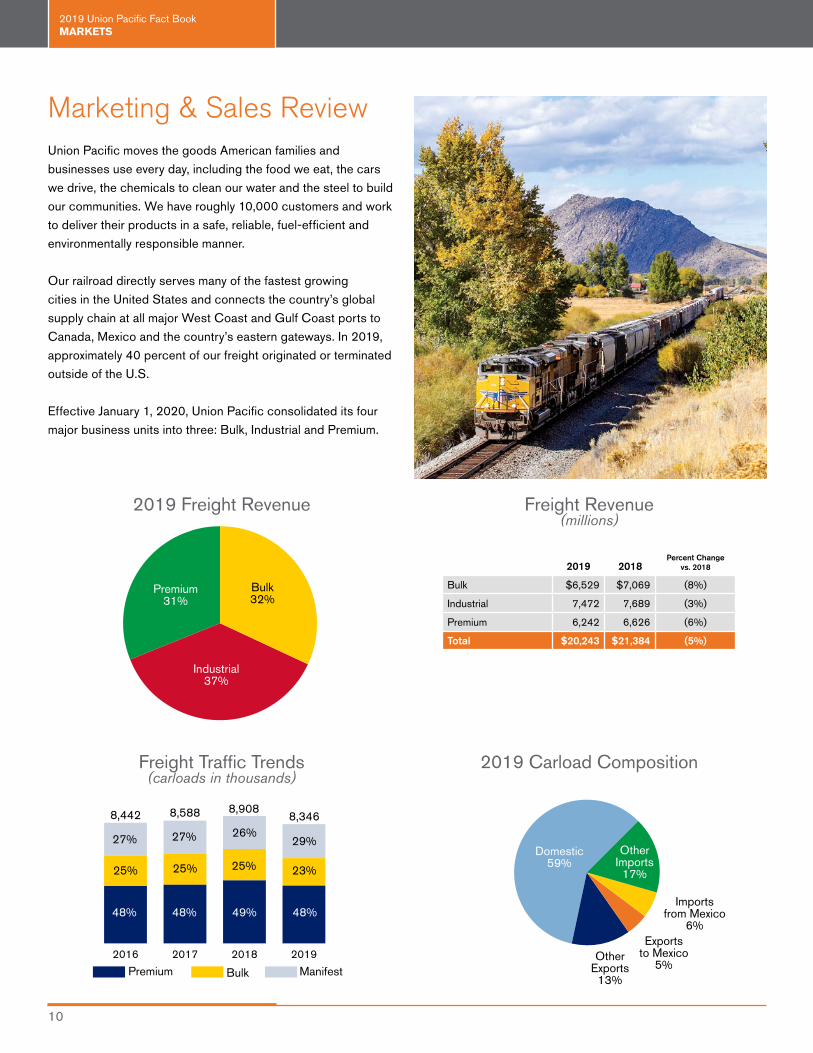
27%Other
Imports17%
Exportsto Mexico
5%Other
Exports13%
Importsfrom Mexico
6%
Domestic59%
Bulk32%
Industrial37%
Premium31%
Freight Revenue (millions)
2019 Carload Composition
2019 Freight Revenue
Freight Traffic Trends (carloads in thousands)
2019 2018Percent Change
vs. 2018
Bulk $6,529 $7,069 (8%)
Industrial 7,472 7,689 (3%)
Premium 6,242 6,626 (6%)
Total $20,243 $21,384 (5%)
Marketing & Sales ReviewUnion Pacific moves the goods American families and
businesses use every day, including the food we eat, the cars
we drive, the chemicals to clean our water and the steel to build
our communities. We have roughly 10,000 customers and work
to deliver their products in a safe, reliable, fuel-efficient and
environmentally responsible manner.
Our railroad directly serves many of the fastest growing
cities in the United States and connects the country’s global
supply chain at all major West Coast and Gulf Coast ports to
Canada, Mexico and the country’s eastern gateways. In 2019,
approximately 40 percent of our freight originated or terminated
outside of the U.S.
Effective January 1, 2020, Union Pacific consolidated its four
major business units into three: Bulk, Industrial and Premium.
2019 Union Pacific Fact Book MARKETS
11
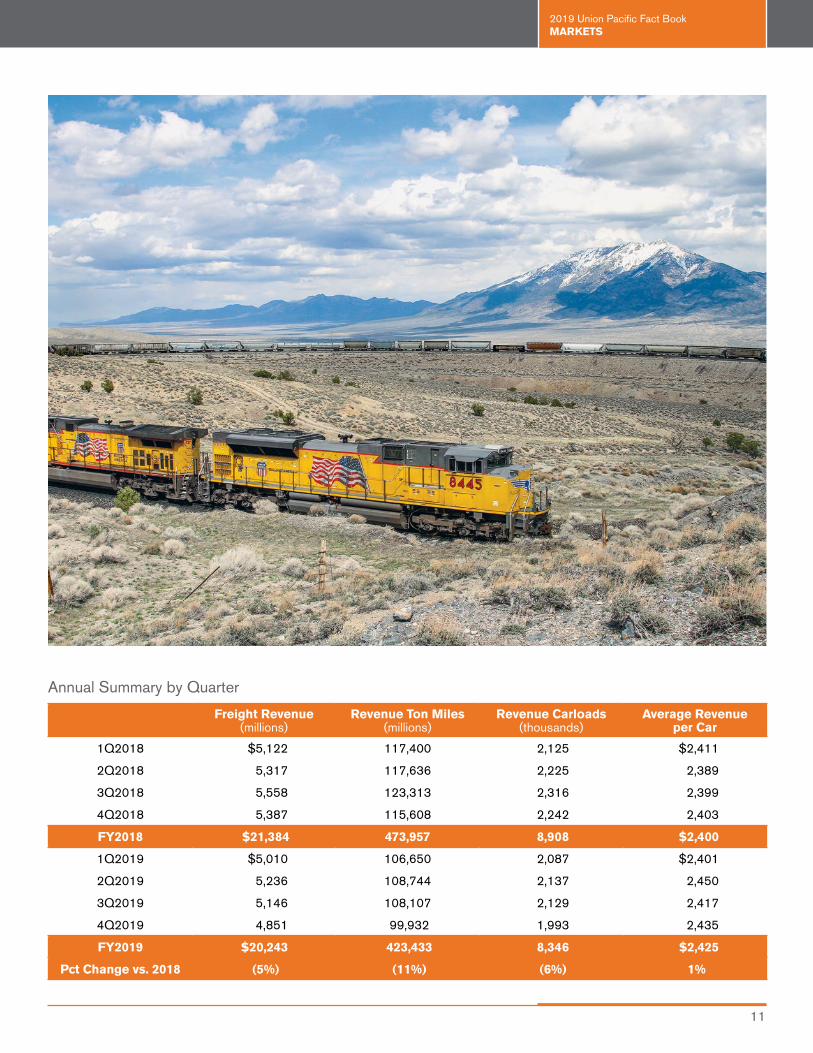
Freight Revenue (millions)
Revenue Ton Miles (millions)
Revenue Carloads (thousands)
Average Revenue per Car
1Q2018 $5,122 117,400 2,125 $2,411
2Q2018 5,317 117,636 2,225 2,389
3Q2018 5,558 123,313 2,316 2,399
4Q2018 5,387 115,608 2,242 2,403
FY2018 $21,384 473,957 8,908 $2,400
1Q2019 $5,010 106,650 2,087 $2,401
2Q2019 5,236 108,744 2,137 2,450
3Q2019 5,146 108,107 2,129 2,417
4Q2019 4,851 99,932 1,993 2,435
FY2019 $20,243 423,433 8,346 $2,425
Pct Change vs. 2018 (5%) (11%) (6%) 1%
Annual Summary by Quarter
2019 Union Pacific Fact Book MARKETS
12
30,000
40,000
50,000
DNOSAJJMAMFJ
2019
20182017
Grain & GrainProducts
34%Coal &
Renewables48%
Fertilizer9%
Food &Refrigerated
9%
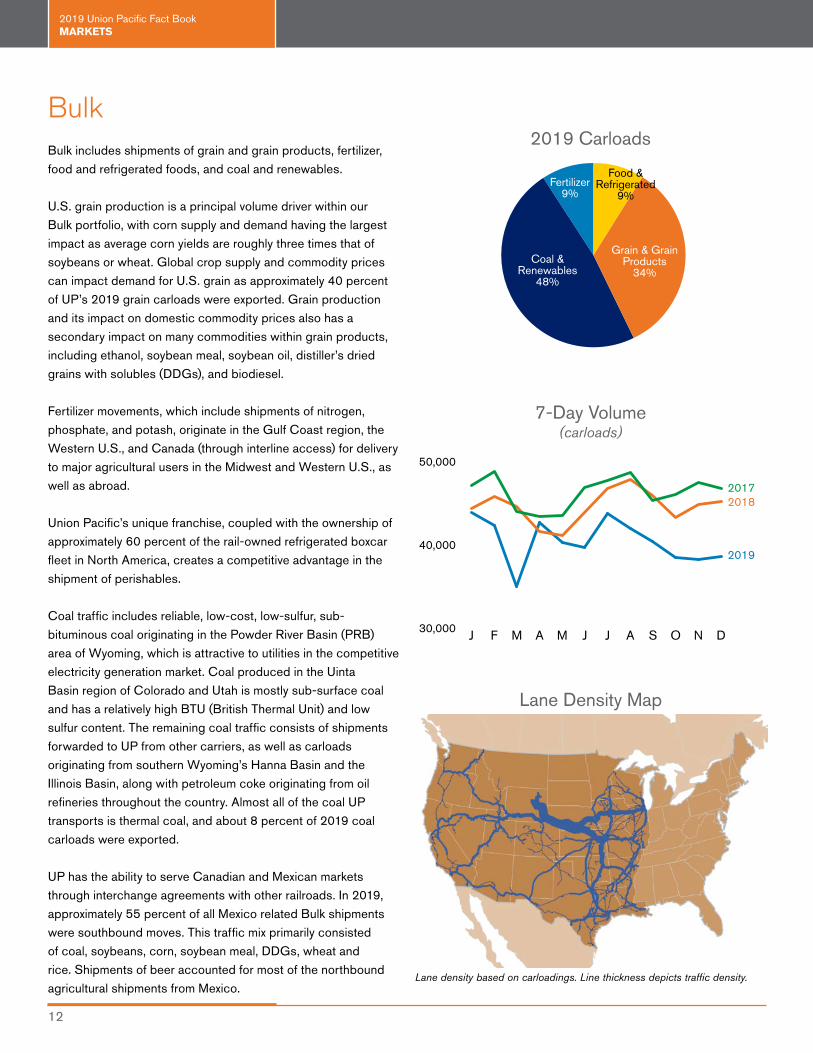
BulkBulk includes shipments of grain and grain products, fertilizer,
food and refrigerated foods, and coal and renewables.
U.S. grain production is a principal volume driver within our
Bulk portfolio, with corn supply and demand having the largest
impact as average corn yields are roughly three times that of
soybeans or wheat. Global crop supply and commodity prices
can impact demand for U.S. grain as approximately 40 percent
of UP’s 2019 grain carloads were exported. Grain production
and its impact on domestic commodity prices also has a
secondary impact on many commodities within grain products,
including ethanol, soybean meal, soybean oil, distiller’s dried
grains with solubles (DDGs), and biodiesel.
Fertilizer movements, which include shipments of nitrogen,
phosphate, and potash, originate in the Gulf Coast region, the
Western U.S., and Canada (through interline access) for delivery
to major agricultural users in the Midwest and Western U.S., as
well as abroad.
Union Pacific’s unique franchise, coupled with the ownership of
approximately 60 percent of the rail-owned refrigerated boxcar
fleet in North America, creates a competitive advantage in the
shipment of perishables.
Coal traffic includes reliable, low-cost, low-sulfur, sub-
bituminous coal originating in the Powder River Basin (PRB)
area of Wyoming, which is attractive to utilities in the competitive
electricity generation market. Coal produced in the Uinta
Basin region of Colorado and Utah is mostly sub-surface coal
and has a relatively high BTU (British Thermal Unit) and low
sulfur content. The remaining coal traffic consists of shipments
forwarded to UP from other carriers, as well as carloads
originating from southern Wyoming’s Hanna Basin and the
Illinois Basin, along with petroleum coke originating from oil
refineries throughout the country. Almost all of the coal UP
transports is thermal coal, and about 8 percent of 2019 coal
carloads were exported.
UP has the ability to serve Canadian and Mexican markets
through interchange agreements with other railroads. In 2019,
approximately 55 percent of all Mexico related Bulk shipments
were southbound moves. This traffic mix primarily consisted
of coal, soybeans, corn, soybean meal, DDGs, wheat and
rice. Shipments of beer accounted for most of the northbound
agricultural shipments from Mexico.
7-Day Volume (carloads)
2019 Carloads
Lane Density Map
Lane density based on carloadings. Line thickness depicts traffic density.
2019 Union Pacific Fact Book MARKETS
13
Freight Revenue (millions)
Revenue Carloads (thousands)
Average Revenue per Car
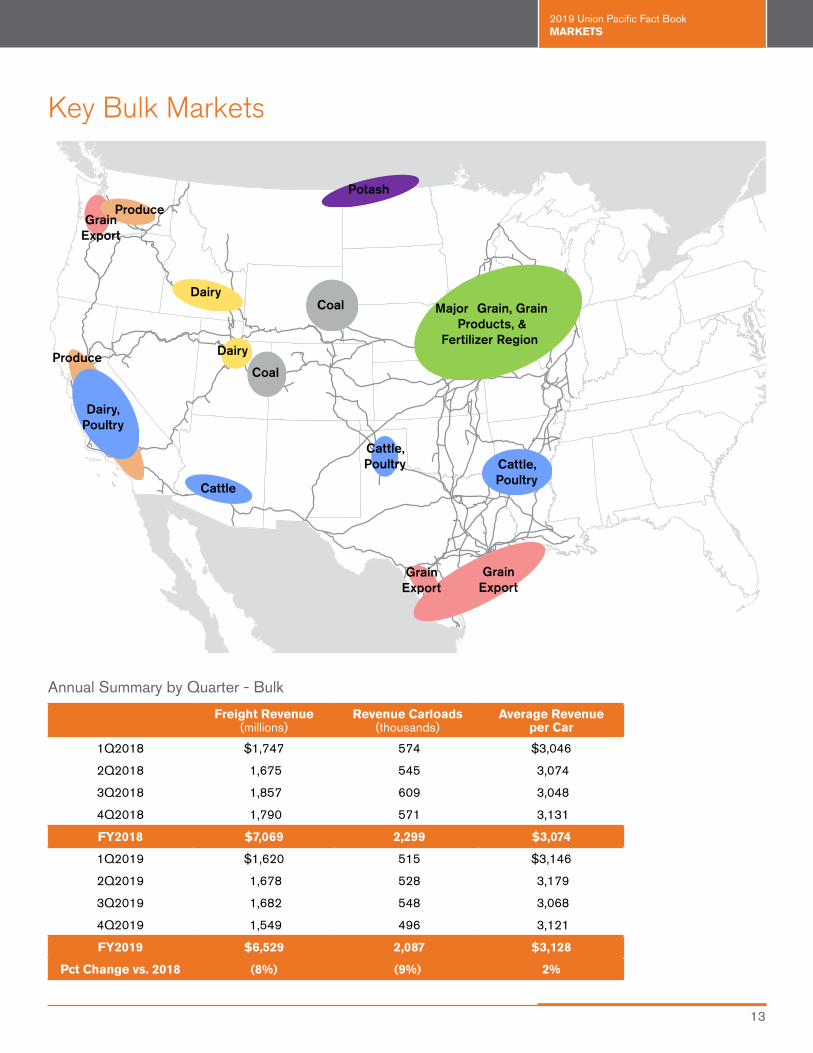
1Q2018 $1,747 574 $3,046
2Q2018 1,675 545 3,074
3Q2018 1,857 609 3,048
4Q2018 1,790 571 3,131
FY2018 $7,069 2,299 $3,074
1Q2019 $1,620 515 $3,146
2Q2019 1,678 528 3,179
3Q2019 1,682 548 3,068
4Q2019 1,549 496 3,121
FY2019 $6,529 2,087 $3,128
Pct Change vs. 2018 (8%) (9%) 2%
Annual Summary by Quarter - Bulk
Produce
Major Grain, Grain Products, &
Fertilizer Region
Cattle, Poultry
Cattle, Poultry
Cattle
Dairy, Poultry
GrainExport
GrainExport
ProduceGrain
Export
Potash
Dairy
Dairy
Coal
Coal
Key Bulk Markets
2019 Union Pacific Fact Book MARKETS
14
IndustrialChemicals& Plastics
28%
ForestProducts
10%Energy &Specialized Markets
28%
Metals &Minerals
34%
36,000
41,000
46,000201920182017
DNOSAJJMAMFJ
20182019
2017
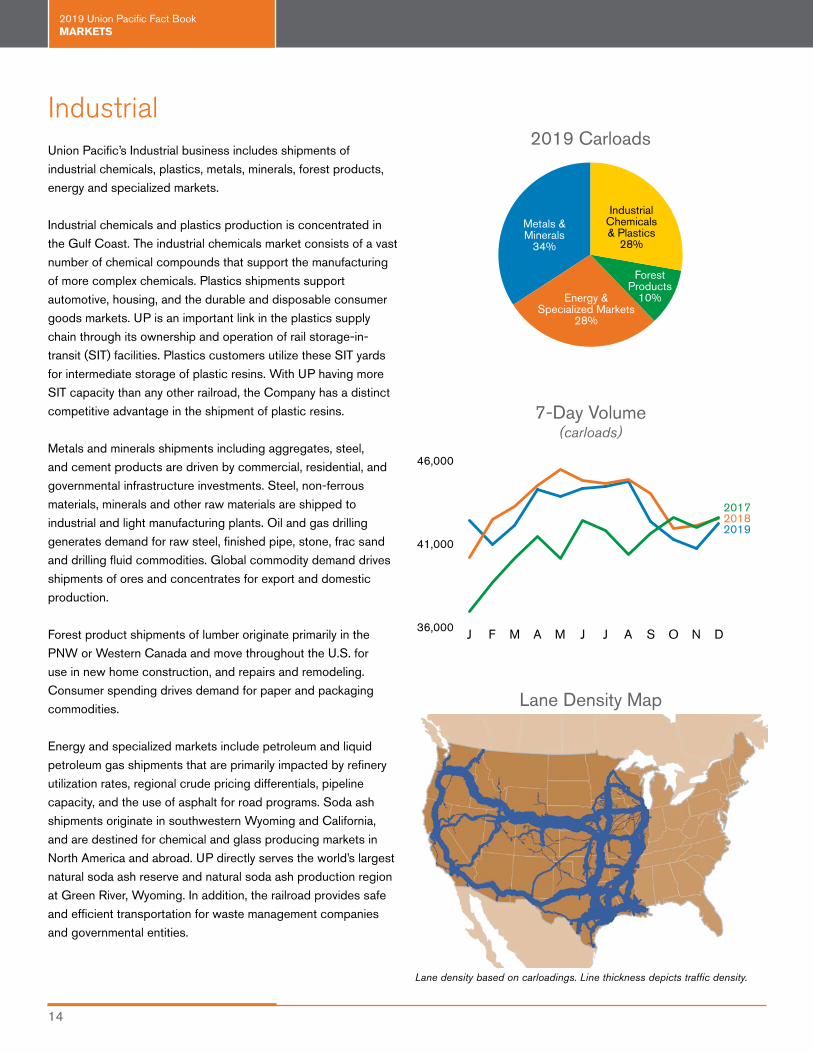
Industrial Union Pacific’s Industrial business includes shipments of
industrial chemicals, plastics, metals, minerals, forest products,
energy and specialized markets.
Industrial chemicals and plastics production is concentrated in
the Gulf Coast. The industrial chemicals market consists of a vast
number of chemical compounds that support the manufacturing
of more complex chemicals. Plastics shipments support
automotive, housing, and the durable and disposable consumer
goods markets. UP is an important link in the plastics supply
chain through its ownership and operation of rail storage-in-
transit (SIT) facilities. Plastics customers utilize these SIT yards
for intermediate storage of plastic resins. With UP having more
SIT capacity than any other railroad, the Company has a distinct
competitive advantage in the shipment of plastic resins.
Metals and minerals shipments including aggregates, steel,
and cement products are driven by commercial, residential, and
governmental infrastructure investments. Steel, non-ferrous
materials, minerals and other raw materials are shipped to
industrial and light manufacturing plants. Oil and gas drilling
generates demand for raw steel, finished pipe, stone, frac sand
and drilling fluid commodities. Global commodity demand drives
shipments of ores and concentrates for export and domestic
production.
Forest product shipments of lumber originate primarily in the
PNW or Western Canada and move throughout the U.S. for
use in new home construction, and repairs and remodeling.
Consumer spending drives demand for paper and packaging
commodities.
Energy and specialized markets include petroleum and liquid
petroleum gas shipments that are primarily impacted by refinery
utilization rates, regional crude pricing differentials, pipeline
capacity, and the use of asphalt for road programs. Soda ash
shipments originate in southwestern Wyoming and California,
and are destined for chemical and glass producing markets in
North America and abroad. UP directly serves the world’s largest
natural soda ash reserve and natural soda ash production region
at Green River, Wyoming. In addition, the railroad provides safe
and efficient transportation for waste management companies
and governmental entities.
7-Day Volume (carloads)
2019 Carloads
Lane Density Map
Lane density based on carloadings. Line thickness depicts traffic density.
2019 Union Pacific Fact Book MARKETS
15
Freight Revenue (millions)
Revenue Carloads (thousands)
Average Revenue per Car
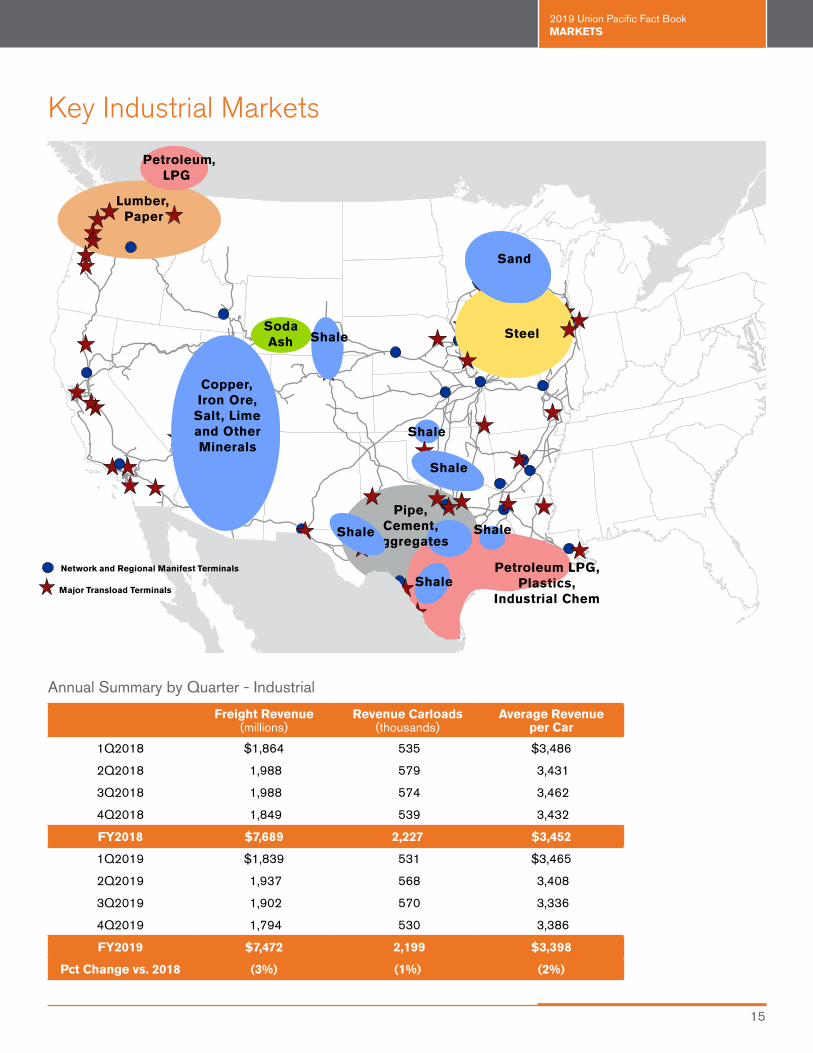
1Q2018 $1,864 535 $3,486
2Q2018 1,988 579 3,431
3Q2018 1,988 574 3,462
4Q2018 1,849 539 3,432
FY2018 $7,689 2,227 $3,452
1Q2019 $1,839 531 $3,465
2Q2019 1,937 568 3,408
3Q2019 1,902 570 3,336
4Q2019 1,794 530 3,386
FY2019 $7,472 2,199 $3,398
Pct Change vs. 2018 (3%) (1%) (2%)
Annual Summary by Quarter - Industrial
Key Industrial Markets
Network and Regional Manifest Terminals
Major Transload Terminals
Pipe, Cement,
Aggregates
Lumber, Paper
Copper, Iron Ore,
Salt, Lime and Other Minerals
SodaAsh
Sand
Shale
Shale
Shale
Shale
Shale
Shale
Steel
Petroleum,LPG
Petroleum LPG, Plastics,
Industrial Chem
2019 Union Pacific Fact Book MARKETS
16
70000
75000
80000
85000
90000
95000201720182019
DNOSAJJMAMFJ
2019
2018
2017
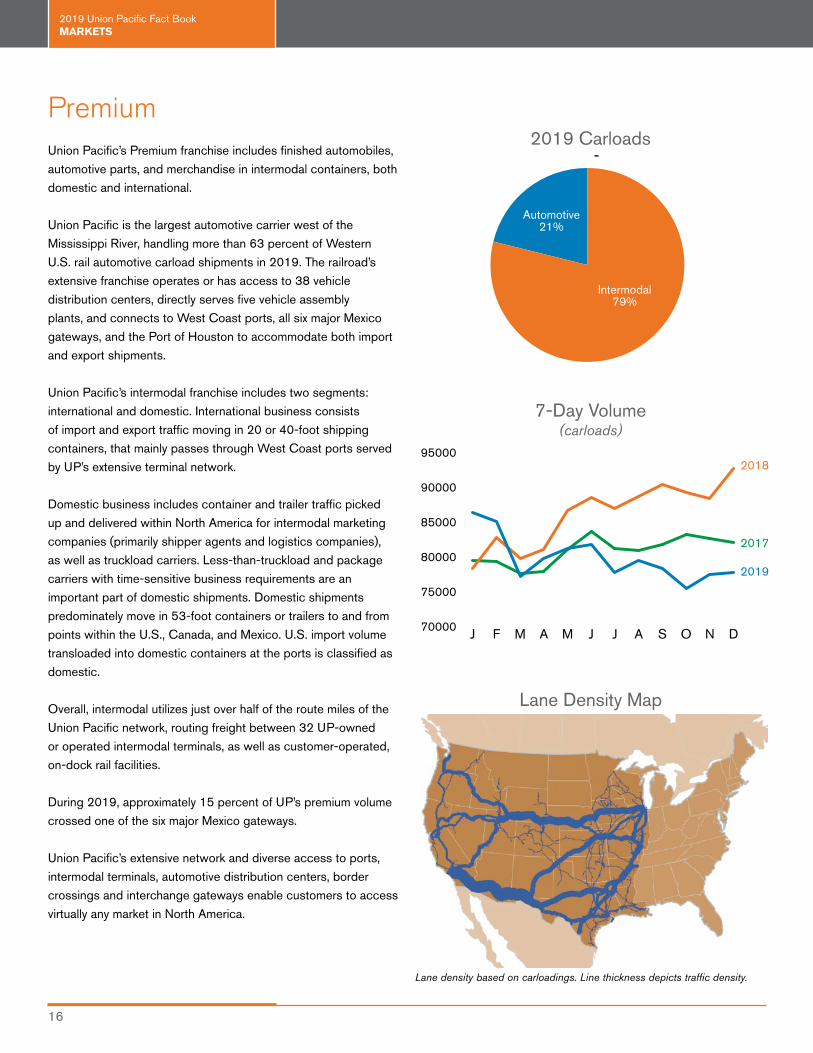
Automotive21%
Intermodal79%
PremiumUnion Pacific’s Premium franchise includes finished automobiles,
automotive parts, and merchandise in intermodal containers, both
domestic and international.
Union Pacific is the largest automotive carrier west of the
Mississippi River, handling more than 63 percent of Western
U.S. rail automotive carload shipments in 2019. The railroad’s
extensive franchise operates or has access to 38 vehicle
distribution centers, directly serves five vehicle assembly
plants, and connects to West Coast ports, all six major Mexico
gateways, and the Port of Houston to accommodate both import
and export shipments.
Union Pacific’s intermodal franchise includes two segments:
international and domestic. International business consists
of import and export traffic moving in 20 or 40-foot shipping
containers, that mainly passes through West Coast ports served
by UP’s extensive terminal network.
Domestic business includes container and trailer traffic picked
up and delivered within North America for intermodal marketing
companies (primarily shipper agents and logistics companies),
as well as truckload carriers. Less-than-truckload and package
carriers with time-sensitive business requirements are an
important part of domestic shipments. Domestic shipments
predominately move in 53-foot containers or trailers to and from
points within the U.S., Canada, and Mexico. U.S. import volume
transloaded into domestic containers at the ports is classified as
domestic.
Overall, intermodal utilizes just over half of the route miles of the
Union Pacific network, routing freight between 32 UP-owned
or operated intermodal terminals, as well as customer-operated,
on-dock rail facilities.
During 2019, approximately 15 percent of UP’s premium volume
crossed one of the six major Mexico gateways.
Union Pacific’s extensive network and diverse access to ports,
intermodal terminals, automotive distribution centers, border
crossings and interchange gateways enable customers to access
virtually any market in North America.
7-Day Volume (carloads)
2019 Carloads
Lane Density Map
Lane density based on carloadings. Line thickness depicts traffic density.
2019 Union Pacific Fact Book MARKETS
17
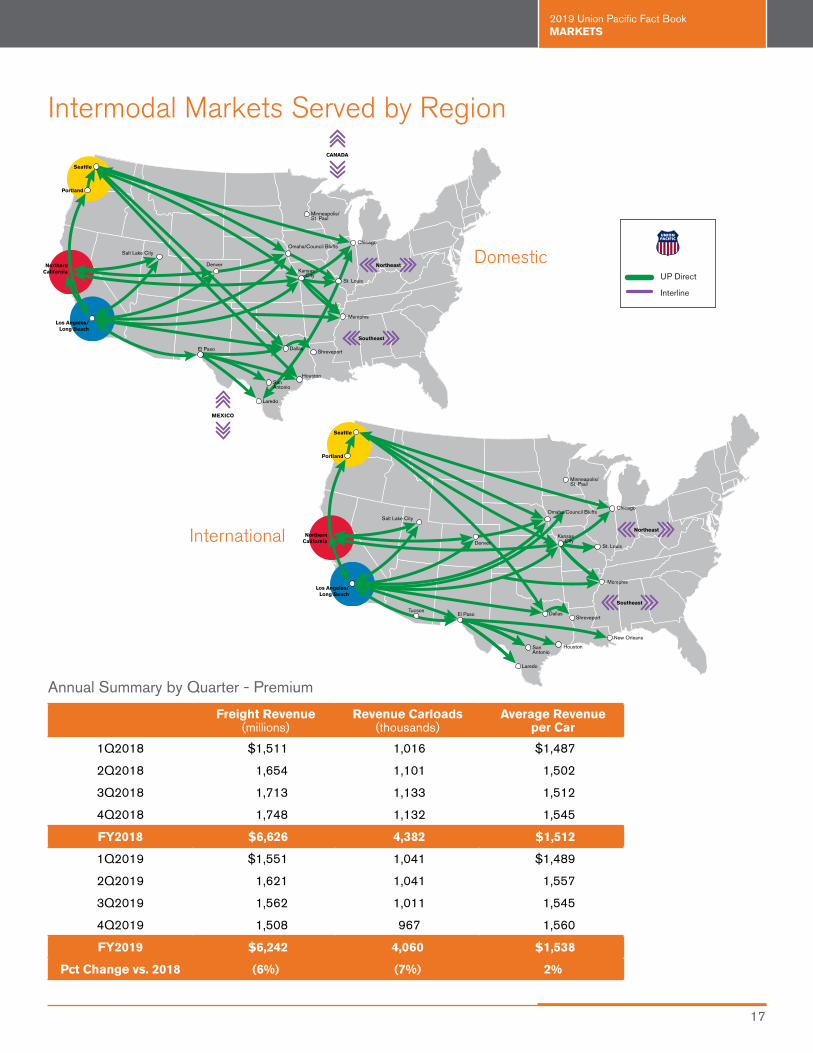
Freight Revenue (millions)
Revenue Carloads (thousands)
Average Revenue per Car
1Q2018 $1,511 1,016 $1,487
2Q2018 1,654 1,101 1,502
3Q2018 1,713 1,133 1,512
4Q2018 1,748 1,132 1,545
FY2018 $6,626 4,382 $1,512
1Q2019 $1,551 1,041 $1,489
2Q2019 1,621 1,041 1,557
3Q2019 1,562 1,011 1,545
4Q2019 1,508 967 1,560
FY2019 $6,242 4,060 $1,538
Pct Change vs. 2018 (6%) (7%) 2%
Annual Summary by Quarter - Premium
Intermodal Markets Served by Region
Seattle
Salt Lake City
Portland
Denver
El Paso
Laredo
SanAntonio
Houston
Memphis
Kansas City
Chicago
Dallas
St. Louis
Northern California
Los Angeles/Long Beach
Omaha/Council Bluffs
Minneapolis/St. Paul
CANADA
Northeast
Shreveport
MEXICO
Southeast
Seattle
Salt Lake City
Portland
Denver
El Paso
Laredo
SanAntonio
Houston
Memphis
Kansas City
Chicago
Dallas
St. Louis
Northern California
Los Angeles/Long Beach
Omaha/Council Bluffs
Minneapolis/St. Paul
Shreveport
Northeast
Southeast
New Orleans
Tucson
International
DomesticUP Direct
Interline
2019 Union Pacific Fact Book MARKETS
18
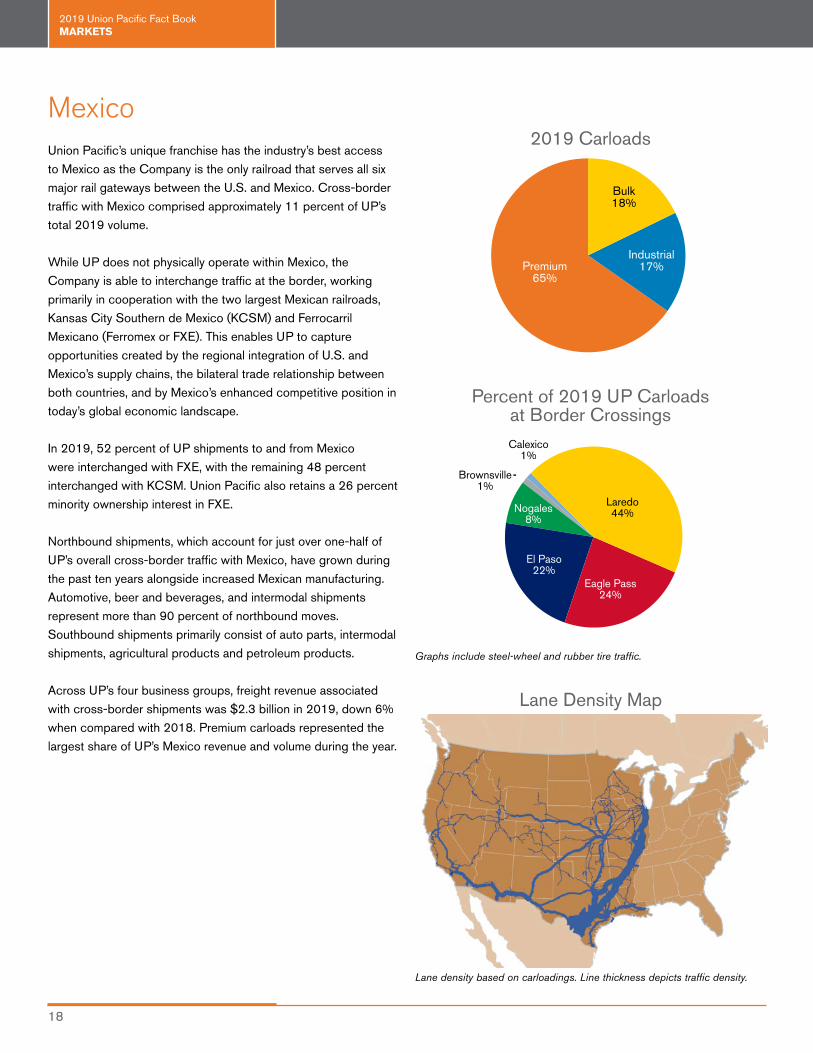
Bulk18%
Premium65%
Industrial17%
Laredo44%
Brownsville1%
El Paso22%
Nogales8%
Eagle Pass24%
Calexico1%
MexicoUnion Pacific’s unique franchise has the industry’s best access
to Mexico as the Company is the only railroad that serves all six
major rail gateways between the U.S. and Mexico. Cross-border
traffic with Mexico comprised approximately 11 percent of UP’s
total 2019 volume.
While UP does not physically operate within Mexico, the
Company is able to interchange traffic at the border, working
primarily in cooperation with the two largest Mexican railroads,
Kansas City Southern de Mexico (KCSM) and Ferrocarril
Mexicano (Ferromex or FXE). This enables UP to capture
opportunities created by the regional integration of U.S. and
Mexico’s supply chains, the bilateral trade relationship between
both countries, and by Mexico’s enhanced competitive position in
today’s global economic landscape.
In 2019, 52 percent of UP shipments to and from Mexico
were interchanged with FXE, with the remaining 48 percent
interchanged with KCSM. Union Pacific also retains a 26 percent
minority ownership interest in FXE.
Northbound shipments, which account for just over one-half of
UP’s overall cross-border traffic with Mexico, have grown during
the past ten years alongside increased Mexican manufacturing.
Automotive, beer and beverages, and intermodal shipments
represent more than 90 percent of northbound moves.
Southbound shipments primarily consist of auto parts, intermodal
shipments, agricultural products and petroleum products.
Across UP’s four business groups, freight revenue associated
with cross-border shipments was $2.3 billion in 2019, down 6%
when compared with 2018. Premium carloads represented the
largest share of UP’s Mexico revenue and volume during the year.
Percent of 2019 UP Carloads at Border Crossings
2019 Carloads
Lane Density Map
Lane density based on carloadings. Line thickness depicts traffic density.
Graphs include steel-wheel and rubber tire traffic.
2019 Union Pacific Fact Book MARKETS
19
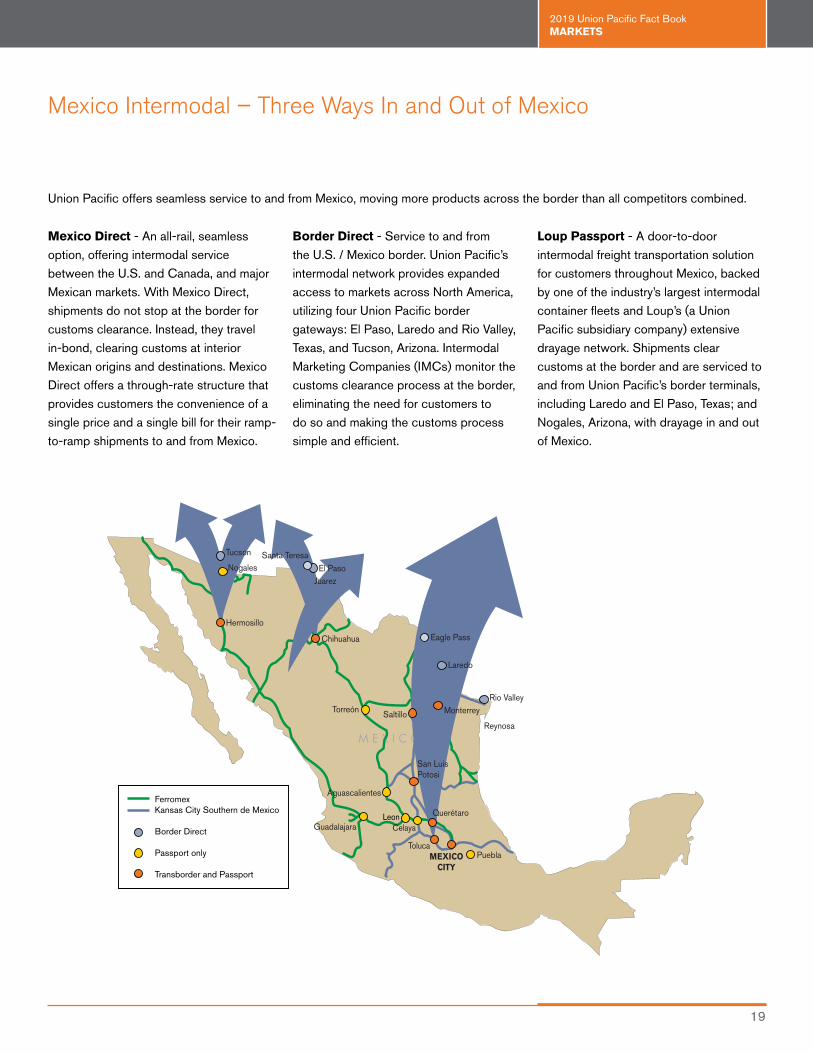
Mexico Intermodal – Three Ways In and Out of Mexico
Mexico Direct - An all-rail, seamless
option, offering intermodal service
between the U.S. and Canada, and major
Mexican markets. With Mexico Direct,
shipments do not stop at the border for
customs clearance. Instead, they travel
in-bond, clearing customs at interior
Mexican origins and destinations. Mexico
Direct offers a through-rate structure that
provides customers the convenience of a
single price and a single bill for their ramp-
to-ramp shipments to and from Mexico.
Border Direct - Service to and from
the U.S. / Mexico border. Union Pacific’s
intermodal network provides expanded
access to markets across North America,
utilizing four Union Pacific border
gateways: El Paso, Laredo and Rio Valley,
Texas, and Tucson, Arizona. Intermodal
Marketing Companies (IMCs) monitor the
customs clearance process at the border,
eliminating the need for customers to
do so and making the customs process
simple and efficient.
Loup Passport - A door-to-door
intermodal freight transportation solution
for customers throughout Mexico, backed
by one of the industry’s largest intermodal
container fleets and Loup’s (a Union
Pacific subsidiary company) extensive
drayage network. Shipments clear
customs at the border and are serviced to
and from Union Pacific’s border terminals,
including Laredo and El Paso, Texas; and
Nogales, Arizona, with drayage in and out
of Mexico.
Union Pacific offers seamless service to and from Mexico, moving more products across the border than all competitors combined.
MEXICOCITY
LeonCelaya
Hermosillo
Torreón
Aguascalientes
Guadalajara
Querétaro
San Luis Potosi
Saltillo Monterrey
Chihuahua
Laredo
Rio Valley
Eagle Pass
El PasoNogalesSanta Teresa
Toluca
Tucson
Puebla
Reynosa
Juarez
FerromexKansas City Southern de Mexico
Border Direct
Passport only
Transborder and Passport
2019 Union Pacific Fact Book OPERATIONS
20
Union Pacific exited 2019 as a much different, much better
company than we started the year. The implementation of
Unified Plan 2020 transformed how we do business – making
us more efficient and reliable for our customers.
Unified Plan 2020 includes several initiatives focused on
increasing the reliability of our service product, reducing variability
in network operations, and improving resource utilization. It is
based on precision scheduled railroading (PSR) principals that
emphasizes on-time service performance for every rail car,
execution accountability, and lean resource utilization, while at
the same time improving total safety performance.
As a part of Unified Plan 2020, we continued working through
a terminal rationalization process to more fully optimize our
operations. We curtailed operations at four hump yards as
well as other smaller regional terminals, began streamlining
intermodal operations, and continually adjusted our transportation
plan with customer demand. These changes, combined with
other G55+0 initiatives, better align our management structure
and decision making processes in conjunction with our Unified
Plan 2020 operating model.
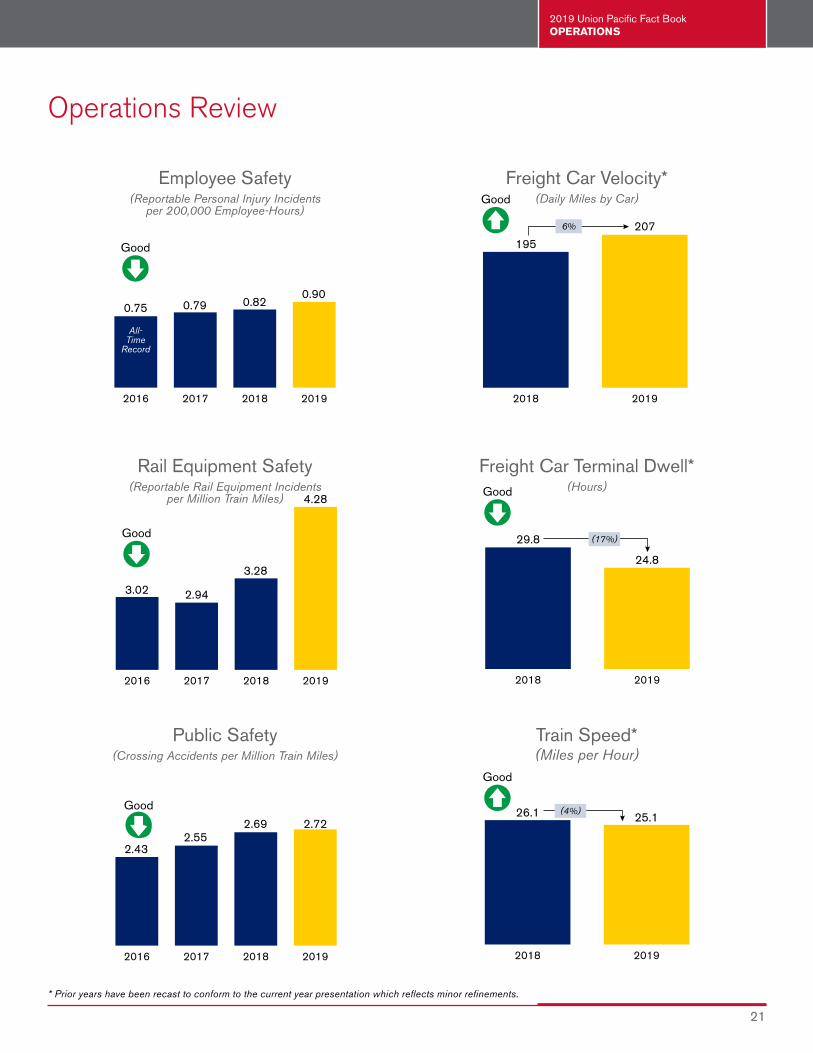
Everything we do must be done safely and reliably. Unfortunately,
our 2019 safety results were not good enough. Our reportable
personal injury rate was 0.90, compared to 0.82 in 2018, our
reportable derailment rate was 4.28, compared to 3.28 in 2018,
and our crossing incident rate was 2.72, compared to 2.69 in
2018. We want every employee to return home safely every day
and to eliminate all derailments. We are committed to doing
better in 2020.
We did, however, make great strides to improve the reliability of
our service product. Trip plan compliance improved 6 points,
demonstrating our commitment to be there when we say we
will. Local service metrics like to and from industry, also showed
solid improvement. Additionally, increased asset utilization and
fewer car classifications led to a 6 percent improvement in
freight car velocity and a 17 percent improvement in freight car
terminal dwell.
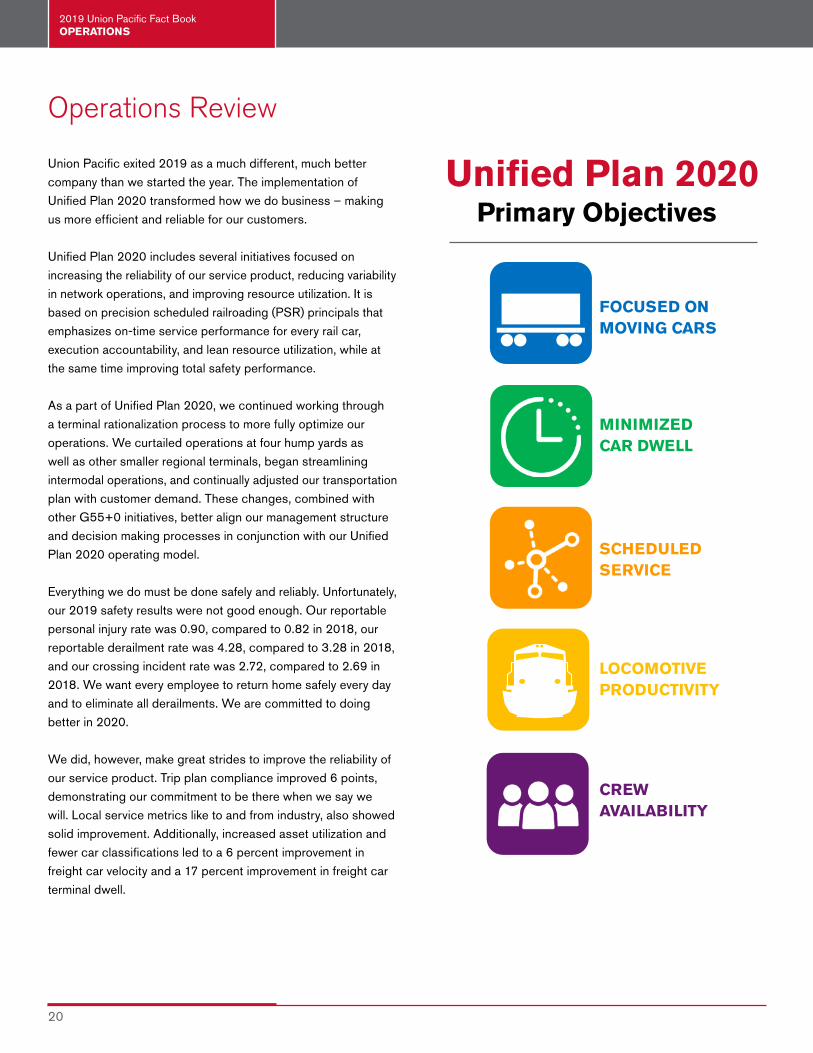
FOCUSED ONMOVING CARS
MINIMIZEDCAR DWELL
SCHEDULEDSERVICE
LOCOMOTIVEPRODUCTIVITY
CREWAVAILABILITY
Unified Plan 2020Primary Objectives
Operations Review
2019 Union Pacific Fact Book OPERATIONS
21
2019201820172016
Good
0.75 0.820.90
All-Time
Record
0.79
2019201820172016
2.552.43
2.69 2.72
Good
2019201820172016
3.02 2.94
Good
3.28
4.28
20192018
29.8
24.8
Good
(17%)
20192018
25.126.1
Good
(4%)
20192018
Good
195
2076%
Operations Review
Freight Car Velocity* (Daily Miles by Car)
Freight Car Terminal Dwell* (Hours)
Train Speed* (Miles per Hour)
Employee Safety (Reportable Personal Injury Incidents
per 200,000 Employee-Hours)
Rail Equipment Safety (Reportable Rail Equipment Incidents
per Million Train Miles)
Public Safety (Crossing Accidents per Million Train Miles)
* Prior years have been recast to conform to the current year presentation which reflects minor refinements.
2019 Union Pacific Fact Book OPERATIONS
22
Good
7,021 7,029 7,044 7,0487,292
7,6527,924
8,185
00
00
00
00
00
4Q193Q192Q191Q194Q183Q182Q191Q18
20192018
Good
106
12013%
20192018
Good
8578392%
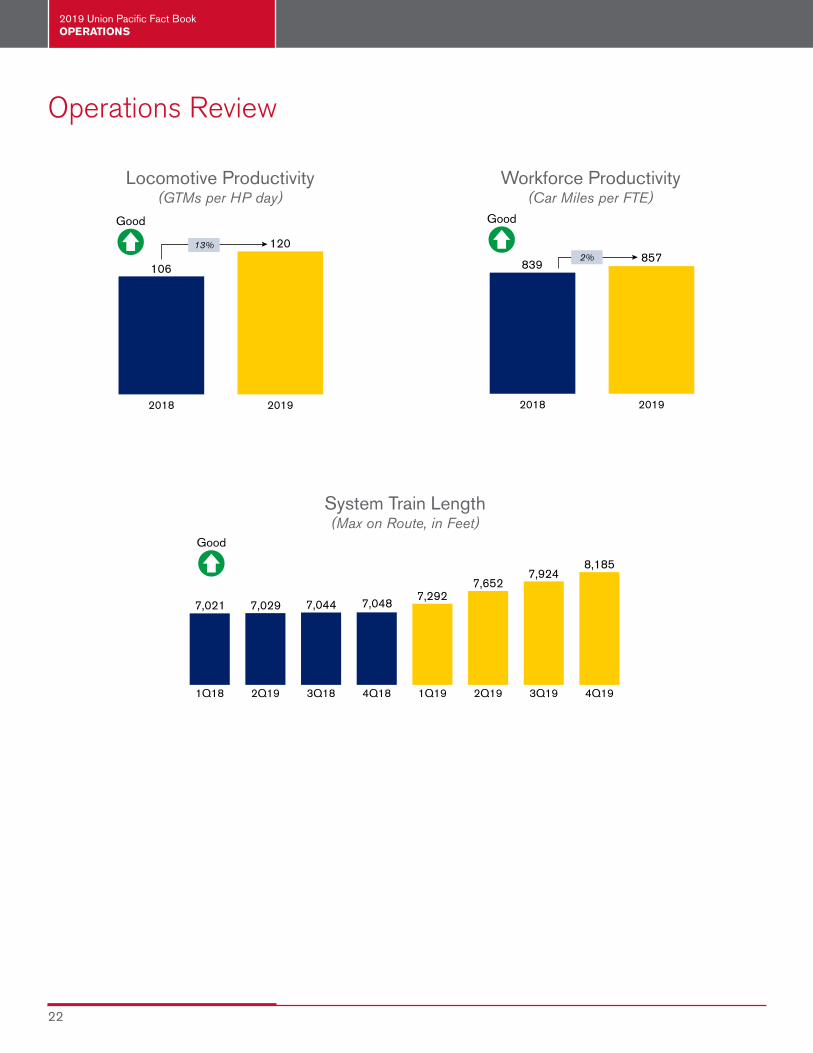
Operations Review
Locomotive Productivity (GTMs per HP day)
Workforce Productivity (Car Miles per FTE)
System Train Length (Max on Route, in Feet)
2019 Union Pacific Fact Book FINANCIALS
23
0
000
000
000
000
000
PTCTech/Oth
CP/CFLoco/EquipInf Repl
2019201820172016
$3.1$3.5
$3.2 $3.2
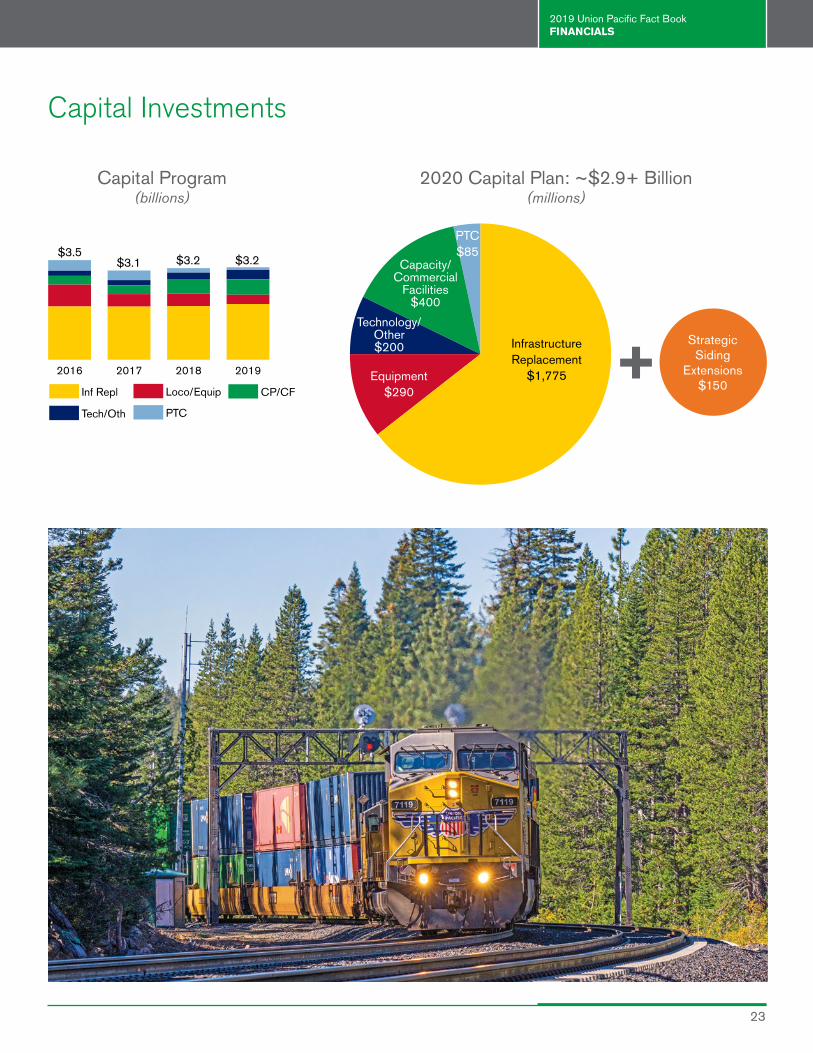
Capital Investments
Capital Program (billions)
2020 Capital Plan: ~$2.9+ Billion (millions)
InfrastructureReplacement
$1,775
Capacity/Commercial
Facilities $400
PTC$85
Equipment$290
Technology/Other$200 Strategic
SidingExtensions
$150

2019 Union Pacific Fact Book FINANCIALS
24
SELECTED FINANCIAL DATA (unaudited)Union Pacific Corporation and Subsidiary Companies
Millions, Except per Share Amounts,
Carloads, Employee Statistics, and Ratios 2019 2018 2017 [a] 2016For the Year Ended December 31
Operating revenues [b] $ 21,708 $ 22,832 $ 21,240 $ 19,941 Operating income 8,554 8,517 8,106 7,243 Net income 5,919 5,966 10,712 4,233 Earnings per share - basic 8.41 7.95 13.42 5.09 Earnings per share - diluted 8.38 7.91 13.36 5.07 Dividends declared per share 3.70 3.06 2.48 2.255 Cash provided by operating activities 8,609 8,686 7,230 7,525 Cash used in investing activities (3,435) (3,411) (3,086) (3,393) Cash used in financing activities (5,646) (5,222) (4,146) (4,246) Cash used for share repurchase programs (5,804) (8,225) (4,013) (3,105)At December 31
Total assets $ 61,673 $ 59,147 $ 57,806 $ 55,718 Long-term obligations [c] 39,194 34,098 29,011 32,146 Debt due after one year 23,943 20,925 16,144 14,249 Common shareholders' equity 18,128 20,423 24,856 19,932 Additional Data
Freight revenues [b] $ 20,243 $ 21,384 $ 19,837 $ 18,601 Revenue carloads (units) (000) 8,346 8,908 8,588 8,442 Operating ratio (%) [d] 60.6 62.7 61.8 63.7 Average employees (000) 37.5 42.0 42.0 42.9 Financial Ratios (%)
Return on average common shareholders' equity [e] 30.7 26.4 47.8 20.8
[a] 2017 includes a $5.9 billion non-cash reduction to income tax expense and $212 million non-cash reduction to operating expenses related to the Tax Cuts and Jobs Act enacted on December 22, 2017.
[b] Includes fuel surcharge revenue of $1.6 billion, $1.7 billion, $966 million, and $560 million for 2019, 2018, 2017, and 2016, respectively, which partially offsets increased operating expenses for fuel. See 2019 SEC Form 10-K for more information.
[c] Long-term obligations is determined as follows: total liabilities less current liabilities. [d] Operating ratio is defined as operating expenses divided by operating revenues. [e] Return on average common shareholders' equity is determined as follows: Net income divided by average common shareholders' equity.
2019 Union Pacific Fact Book FINANCIALS
25
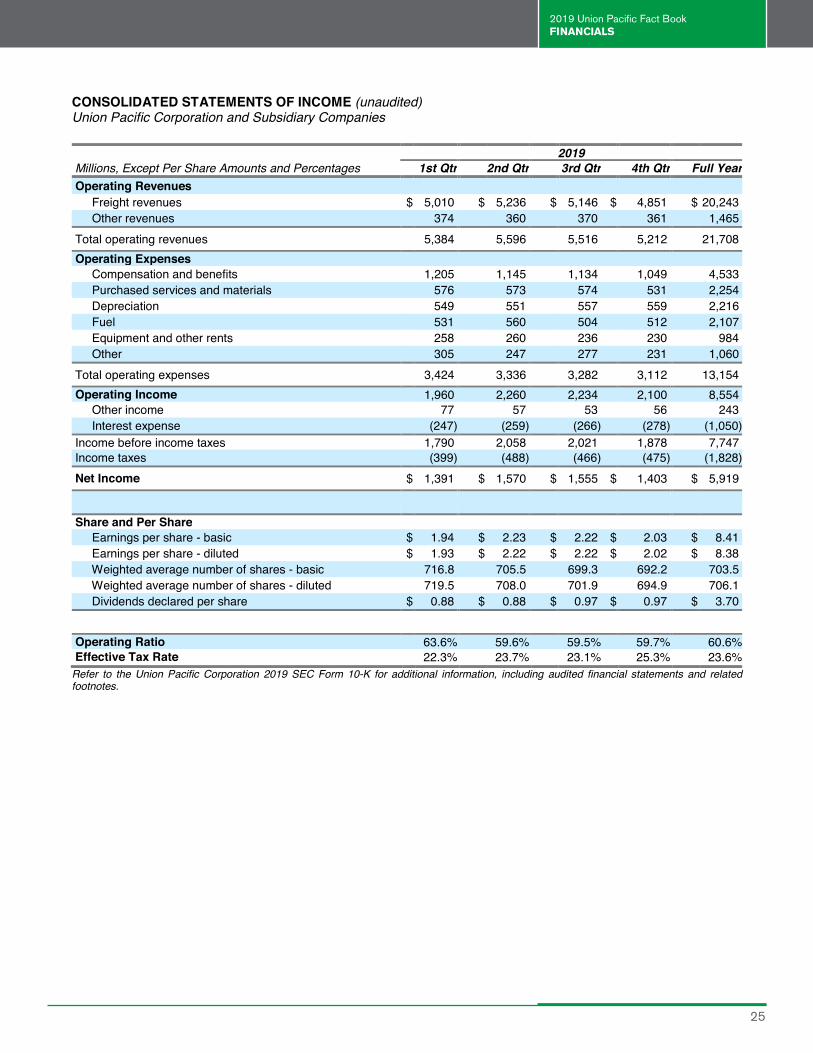
CONSOLIDATED STATEMENTS OF INCOME (unaudited) Union Pacific Corporation and Subsidiary Companies
2019 Millions, Except Per Share Amounts and Percentages 1st Qtr 2nd Qtr 3rd Qtr 4th Qtr Full Year Operating Revenues Freight revenues $ 5,010 $ 5,236 $ 5,146 $ 4,851 $ 20,243 Other revenues 374 360 370 361 1,465 Total operating revenues 5,384 5,596 5,516 5,212 21,708 Operating Expenses
Compensation and benefits 1,205 1,145 1,134 1,049 4,533 Purchased services and materials 576 573 574 531 2,254 Depreciation 549 551 557 559 2,216 Fuel 531 560 504 512 2,107 Equipment and other rents 258 260 236 230 984 Other 305 247 277 231 1,060 Total operating expenses 3,424 3,336 3,282 3,112 13,154 Operating Income 1,960 2,260 2,234 2,100 8,554
Other income 77 57 53 56 243 Interest expense (247) (259) (266) (278) (1,050) Income before income taxes 1,790 2,058 2,021 1,878 7,747 Income taxes (399) (488) (466) (475) (1,828) Net Income $ 1,391 $ 1,570 $ 1,555 $ 1,403 $ 5,919
Share and Per Share
Earnings per share - basic $ 1.94 $ 2.23 $ 2.22 $ 2.03 $ 8.41 Earnings per share - diluted $ 1.93 $ 2.22 $ 2.22 $ 2.02 $ 8.38 Weighted average number of shares - basic 716.8 705.5 699.3 692.2 703.5 Weighted average number of shares - diluted 719.5 708.0 701.9 694.9 706.1 Dividends declared per share $ 0.88 $ 0.88 $ 0.97 $ 0.97 $ 3.70 Operating Ratio 63.6% 59.6% 59.5% 59.7% 60.6%
Effective Tax Rate 22.3% 23.7% 23.1% 25.3% 23.6%Refer to the Union Pacific Corporation 2019 SEC Form 10-K for additional information, including audited financial statements and related footnotes.
2019 Union Pacific Fact Book FINANCIALS
26
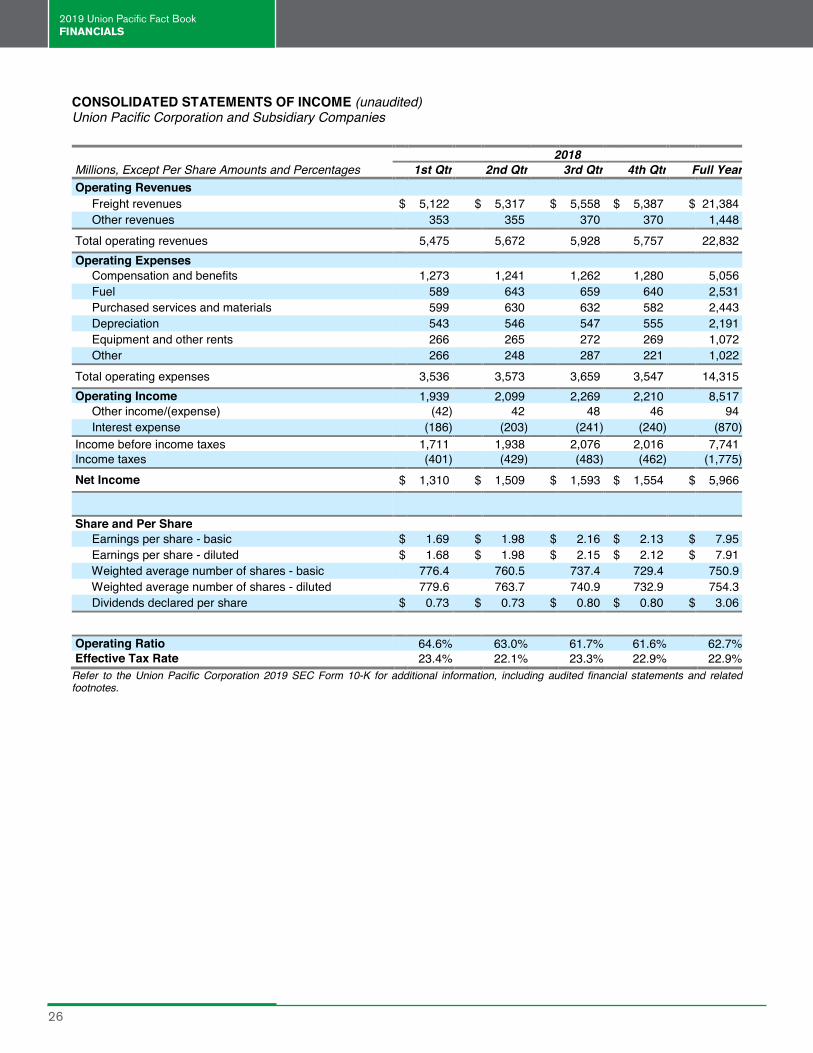
CONSOLIDATED STATEMENTS OF INCOME (unaudited) Union Pacific Corporation and Subsidiary Companies
2018 Millions, Except Per Share Amounts and Percentages 1st Qtr 2nd Qtr 3rd Qtr 4th Qtr Full Year Operating Revenues Freight revenues $ 5,122 $ 5,317 $ 5,558 $ 5,387 $ 21,384 Other revenues 353 355 370 370 1,448 Total operating revenues 5,475 5,672 5,928 5,757 22,832 Operating Expenses
Compensation and benefits 1,273 1,241 1,262 1,280 5,056 Fuel 589 643 659 640 2,531 Purchased services and materials 599 630 632 582 2,443 Depreciation 543 546 547 555 2,191 Equipment and other rents 266 265 272 269 1,072 Other 266 248 287 221 1,022 Total operating expenses 3,536 3,573 3,659 3,547 14,315 Operating Income 1,939 2,099 2,269 2,210 8,517
Other income/(expense) (42) 42 48 46 94 Interest expense (186) (203) (241) (240) (870) Income before income taxes 1,711 1,938 2,076 2,016 7,741 Income taxes (401) (429) (483) (462) (1,775) Net Income $ 1,310 $ 1,509 $ 1,593 $ 1,554 $ 5,966
Share and Per Share
Earnings per share - basic $ 1.69 $ 1.98 $ 2.16 $ 2.13 $ 7.95 Earnings per share - diluted $ 1.68 $ 1.98 $ 2.15 $ 2.12 $ 7.91 Weighted average number of shares - basic 776.4 760.5 737.4 729.4 750.9 Weighted average number of shares - diluted 779.6 763.7 740.9 732.9 754.3 Dividends declared per share $ 0.73 $ 0.73 $ 0.80 $ 0.80 $ 3.06 Operating Ratio 64.6% 63.0% 61.7% 61.6% 62.7%
Effective Tax Rate 23.4% 22.1% 23.3% 22.9% 22.9%Refer to the Union Pacific Corporation 2019 SEC Form 10-K for additional information, including audited financial statements and related footnotes.
2019 Union Pacific Fact Book FINANCIALS
27
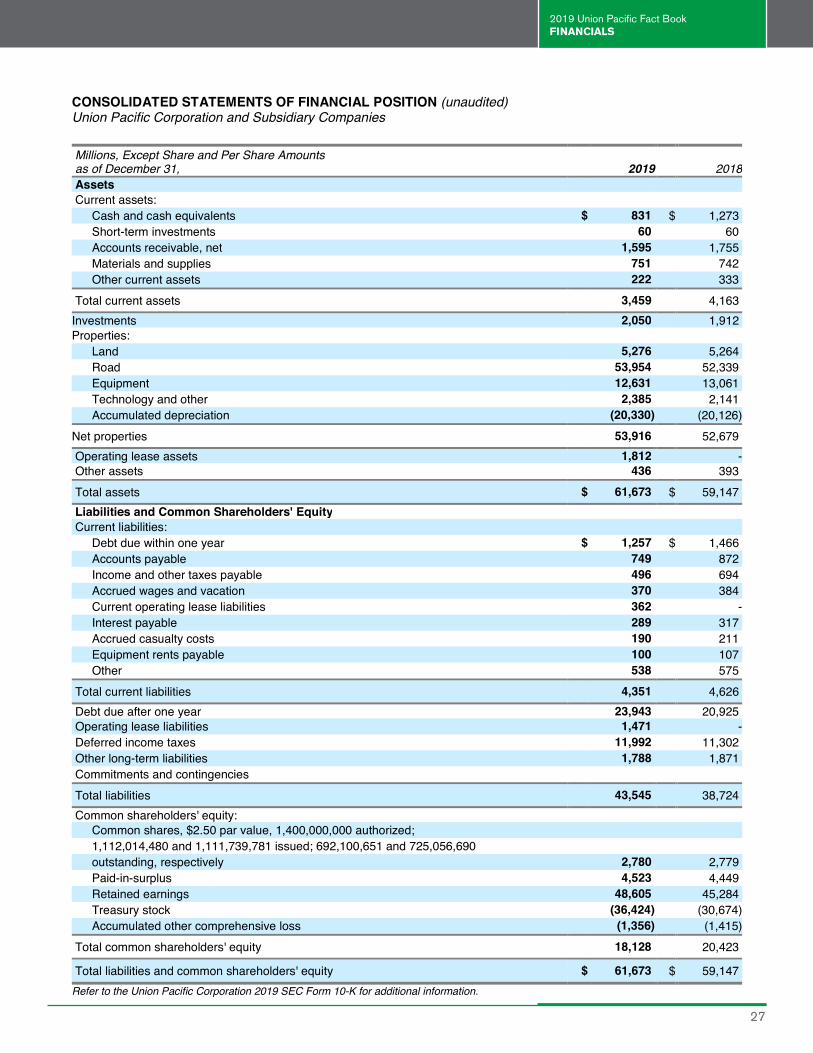
CONSOLIDATED STATEMENTS OF FINANCIAL POSITION (unaudited)Union Pacific Corporation and Subsidiary Companies
Millions, Except Share and Per Share Amounts as of December 31, 2019 2018Assets
Current assets: Cash and cash equivalents $ 831 $ 1,273 Short-term investments 60 60 Accounts receivable, net 1,595 1,755 Materials and supplies 751 742 Other current assets 222 333 Total current assets 3,459 4,163 Investments 2,050 1,912 Properties: Land 5,276 5,264 Road 53,954 52,339 Equipment 12,631 13,061 Technology and other 2,385 2,141 Accumulated depreciation (20,330) (20,126)Net properties 53,916 52,679 Operating lease assets 1,812 - Other assets 436 393 Total assets $ 61,673 $ 59,147 Liabilities and Common Shareholders' Equity
Current liabilities: Debt due within one year $ 1,257 $ 1,466 Accounts payable 749 872 Income and other taxes payable 496 694 Accrued wages and vacation 370 384 Current operating lease liabilities 362 - Interest payable 289 317 Accrued casualty costs 190 211 Equipment rents payable 100 107 Other 538 575 Total current liabilities 4,351 4,626 Debt due after one year 23,943 20,925 Operating lease liabilities 1,471 - Deferred income taxes 11,992 11,302 Other long-term liabilities 1,788 1,871 Commitments and contingencies Total liabilities 43,545 38,724 Common shareholders' equity: Common shares, $2.50 par value, 1,400,000,000 authorized; 1,112,014,480 and 1,111,739,781 issued; 692,100,651 and 725,056,690 outstanding, respectively 2,780 2,779 Paid-in-surplus 4,523 4,449 Retained earnings 48,605 45,284 Treasury stock (36,424) (30,674) Accumulated other comprehensive loss (1,356) (1,415) Total common shareholders' equity 18,128 20,423
Total liabilities and common shareholders' equity $ 61,673 $ 59,147 Refer to the Union Pacific Corporation 2019 SEC Form 10-K for additional information.
2019 Union Pacific Fact Book FINANCIALS
28
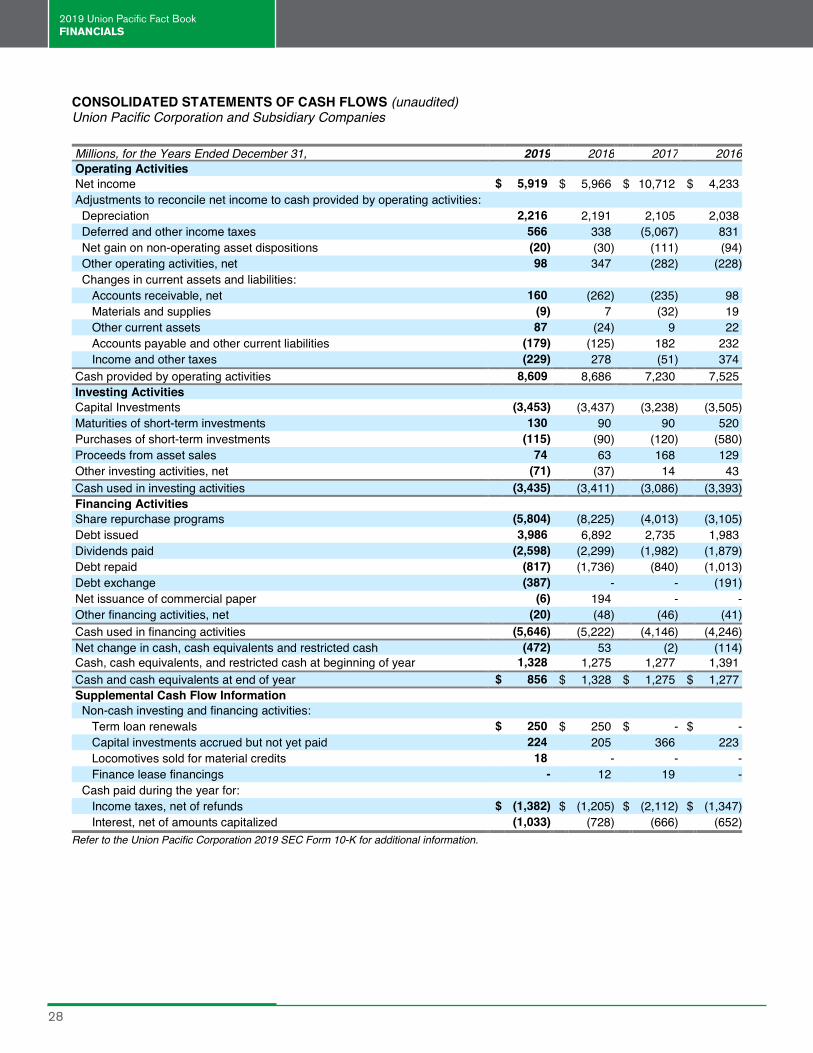
CONSOLIDATED STATEMENTS OF CASH FLOWS (unaudited)Union Pacific Corporation and Subsidiary Companies
Millions, for the Years Ended December 31, 2019 2018 2017 2016Operating Activities
Net income $ 5,919 $ 5,966 $ 10,712 $ 4,233 Adjustments to reconcile net income to cash provided by operating activities: Depreciation 2,216 2,191 2,105 2,038 Deferred and other income taxes 566 338 (5,067) 831 Net gain on non-operating asset dispositions (20) (30) (111) (94) Other operating activities, net 98 347 (282) (228) Changes in current assets and liabilities: Accounts receivable, net 160 (262) (235) 98 Materials and supplies (9) 7 (32) 19 Other current assets 87 (24) 9 22 Accounts payable and other current liabilities (179) (125) 182 232 Income and other taxes (229) 278 (51) 374 Cash provided by operating activities 8,609 8,686 7,230 7,525 Investing Activities
Capital Investments (3,453) (3,437) (3,238) (3,505) Maturities of short-term investments 130 90 90 520 Purchases of short-term investments (115) (90) (120) (580) Proceeds from asset sales 74 63 168 129 Other investing activities, net (71) (37) 14 43 Cash used in investing activities (3,435) (3,411) (3,086) (3,393)Financing Activities
Share repurchase programs (5,804) (8,225) (4,013) (3,105) Debt issued 3,986 6,892 2,735 1,983 Dividends paid (2,598) (2,299) (1,982) (1,879) Debt repaid (817) (1,736) (840) (1,013) Debt exchange (387) - - (191) Net issuance of commercial paper (6) 194 - - Other financing activities, net (20) (48) (46) (41) Cash used in financing activities (5,646) (5,222) (4,146) (4,246) Net change in cash, cash equivalents and restricted cash (472) 53 (2) (114) Cash, cash equivalents, and restricted cash at beginning of year 1,328 1,275 1,277 1,391 Cash and cash equivalents at end of year $ 856 $ 1,328 $ 1,275 $ 1,277 Supplemental Cash Flow Information
Non-cash investing and financing activities: Term loan renewals $ 250 $ 250 $ - $ - Capital investments accrued but not yet paid 224 205 366 223 Locomotives sold for material credits 18 - - - Finance lease financings - 12 19 - Cash paid during the year for: Income taxes, net of refunds $ (1,382) $ (1,205) $ (2,112) $ (1,347) Interest, net of amounts capitalized (1,033) (728) (666) (652)Refer to the Union Pacific Corporation 2019 SEC Form 10-K for additional information.
2019 Union Pacific Fact Book FINANCIALS
29
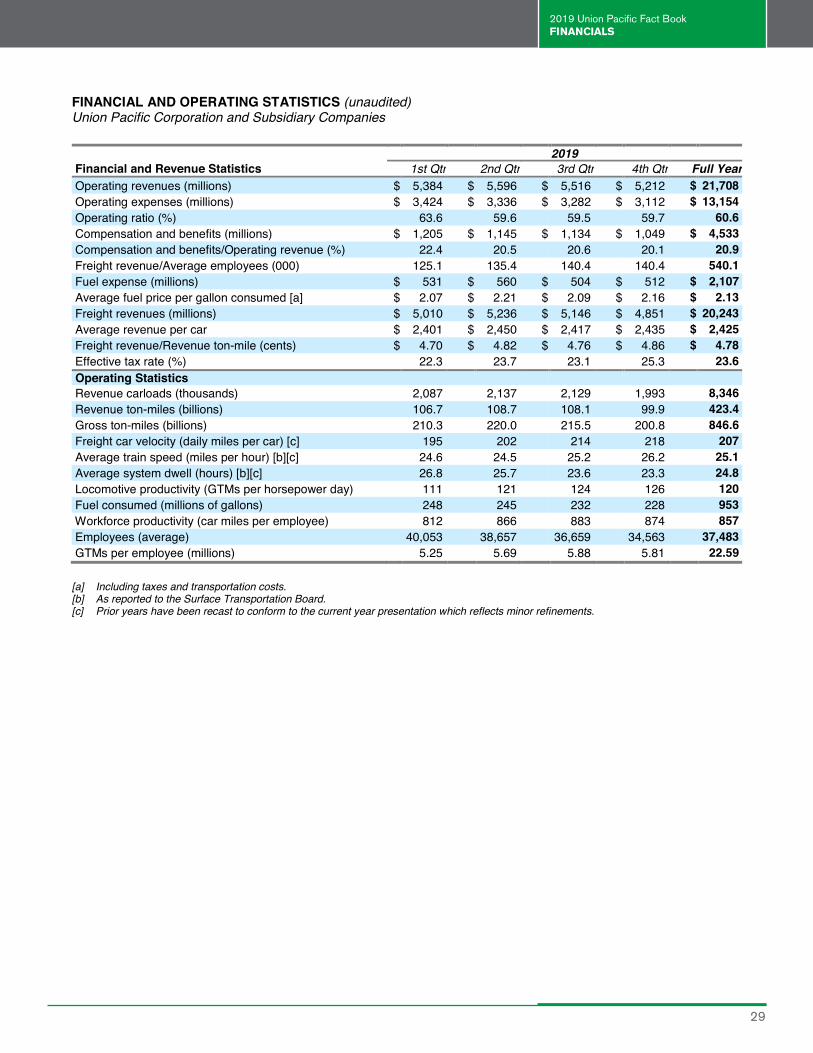
FINANCIAL AND OPERATING STATISTICS (unaudited)Union Pacific Corporation and Subsidiary Companies
2019 Financial and Revenue Statistics 1st Qtr 2nd Qtr 3rd Qtr 4th Qtr Full Year
Operating revenues (millions) $ 5,384 $ 5,596 $ 5,516 $ 5,212 $ 21,708 Operating expenses (millions) $ 3,424 $ 3,336 $ 3,282 $ 3,112 $ 13,154 Operating ratio (%) 63.6 59.6 59.5 59.7 60.6 Compensation and benefits (millions) $ 1,205 $ 1,145 $ 1,134 $ 1,049 $ 4,533 Compensation and benefits/Operating revenue (%) 22.4 20.5 20.6 20.1 20.9 Freight revenue/Average employees (000) 125.1 135.4 140.4 140.4 540.1 Fuel expense (millions) $ 531 $ 560 $ 504 $ 512 $ 2,107 Average fuel price per gallon consumed [a] $ 2.07 $ 2.21 $ 2.09 $ 2.16 $ 2.13 Freight revenues (millions) $ 5,010 $ 5,236 $ 5,146 $ 4,851 $ 20,243 Average revenue per car $ 2,401 $ 2,450 $ 2,417 $ 2,435 $ 2,425 Freight revenue/Revenue ton-mile (cents) $ 4.70 $ 4.82 $ 4.76 $ 4.86 $ 4.78 Effective tax rate (%) 22.3 23.7 23.1 25.3 23.6 Operating Statistics
Revenue carloads (thousands) 2,087 2,137 2,129 1,993 8,346 Revenue ton-miles (billions) 106.7 108.7 108.1 99.9 423.4 Gross ton-miles (billions) 210.3 220.0 215.5 200.8 846.6 Freight car velocity (daily miles per car) [c] 195 202 214 218 207 Average train speed (miles per hour) [b][c] 24.6 24.5 25.2 26.2 25.1 Average system dwell (hours) [b][c] 26.8 25.7 23.6 23.3 24.8 Locomotive productivity (GTMs per horsepower day) 111 121 124 126 120 Fuel consumed (millions of gallons) 248 245 232 228 953 Workforce productivity (car miles per employee) 812 866 883 874 857 Employees (average) 40,053 38,657 36,659 34,563 37,483 GTMs per employee (millions) 5.25 5.69 5.88 5.81 22.59
[a] Including taxes and transportation costs. [b] As reported to the Surface Transportation Board.[c] Prior years have been recast to conform to the current year presentation which reflects minor refinements.
2019 Union Pacific Fact Book FINANCIALS
30
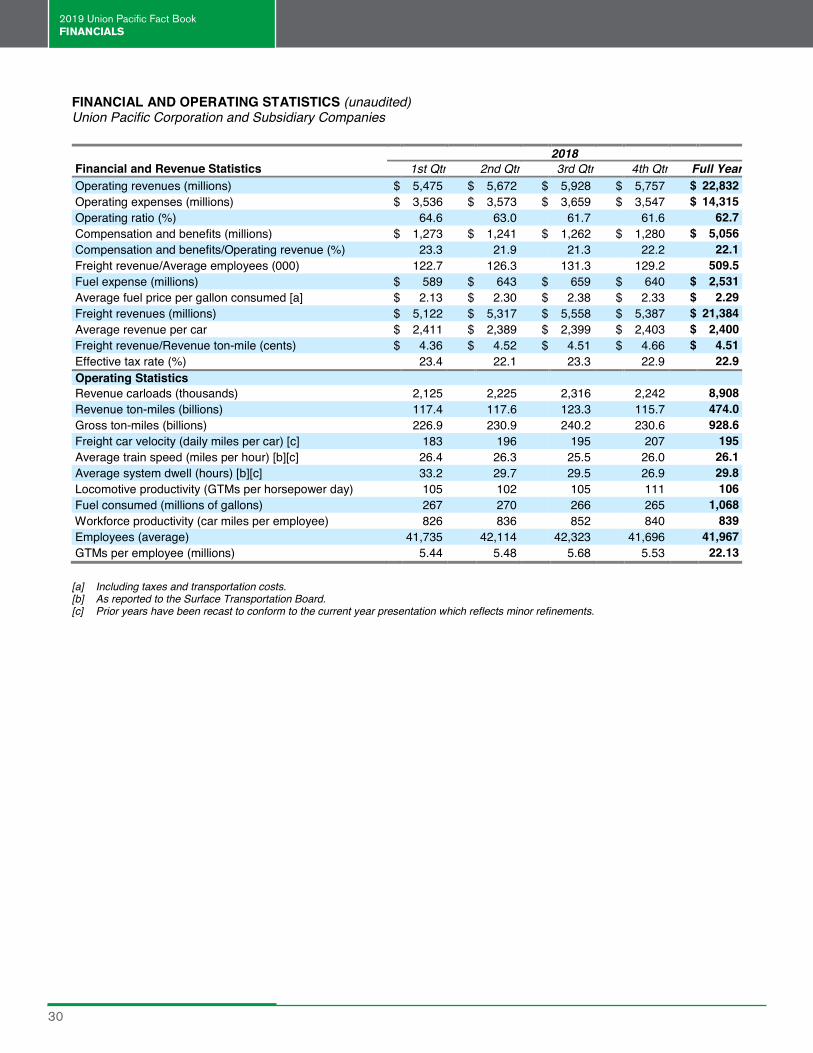
FINANCIAL AND OPERATING STATISTICS (unaudited) Union Pacific Corporation and Subsidiary Companies
2018 Financial and Revenue Statistics 1st Qtr 2nd Qtr 3rd Qtr 4th Qtr Full Year
Operating revenues (millions) $ 5,475 $ 5,672 $ 5,928 $ 5,757 $ 22,832 Operating expenses (millions) $ 3,536 $ 3,573 $ 3,659 $ 3,547 $ 14,315 Operating ratio (%) 64.6 63.0 61.7 61.6 62.7 Compensation and benefits (millions) $ 1,273 $ 1,241 $ 1,262 $ 1,280 $ 5,056 Compensation and benefits/Operating revenue (%) 23.3 21.9 21.3 22.2 22.1 Freight revenue/Average employees (000) 122.7 126.3 131.3 129.2 509.5 Fuel expense (millions) $ 589 $ 643 $ 659 $ 640 $ 2,531 Average fuel price per gallon consumed [a] $ 2.13 $ 2.30 $ 2.38 $ 2.33 $ 2.29 Freight revenues (millions) $ 5,122 $ 5,317 $ 5,558 $ 5,387 $ 21,384 Average revenue per car $ 2,411 $ 2,389 $ 2,399 $ 2,403 $ 2,400 Freight revenue/Revenue ton-mile (cents) $ 4.36 $ 4.52 $ 4.51 $ 4.66 $ 4.51 Effective tax rate (%) 23.4 22.1 23.3 22.9 22.9 Operating Statistics
Revenue carloads (thousands) 2,125 2,225 2,316 2,242 8,908 Revenue ton-miles (billions) 117.4 117.6 123.3 115.7 474.0 Gross ton-miles (billions) 226.9 230.9 240.2 230.6 928.6 Freight car velocity (daily miles per car) [c] 183 196 195 207 195 Average train speed (miles per hour) [b][c] 26.4 26.3 25.5 26.0 26.1 Average system dwell (hours) [b][c] 33.2 29.7 29.5 26.9 29.8 Locomotive productivity (GTMs per horsepower day) 105 102 105 111 106 Fuel consumed (millions of gallons) 267 270 266 265 1,068 Workforce productivity (car miles per employee) 826 836 852 840 839 Employees (average) 41,735 42,114 42,323 41,696 41,967 GTMs per employee (millions) 5.44 5.48 5.68 5.53 22.13
[a] Including taxes and transportation costs. [b] As reported to the Surface Transportation Board. [c] Prior years have been recast to conform to the current year presentation which reflects minor refinements.
2019 Union Pacific Fact Book FINANCIALS
31
Non-GAAP DefinitionsThe following are non-GAAP financial measures under SEC Regulation G and Item 10 of SEC Regulation S-K, and may not be
defined and calculated by other companies in the same manner. We believe these measures provide an alternative presentation of the
results that more accurately reflect ongoing Company operations. These should be considered in addition to, not a substitute for, the
reported GAAP results.
Free Cash Flow
Cash provided by operating activities less cash used in investing activities and dividends paid. Free cash flow is considered a non-
GAAP financial measure by SEC Regulation G and Item 10 of SEC Regulation S-K, and may not be defined and calculated by
other companies in the same manner. We believe this measure is important to management and investors in evaluating our financial
performance and measures our ability to generate cash without additional external financing. Free cash flow should be considered in
addition to, rather than as a substitute for, cash provided by operating activities.
Return on Invested Capital as Adjusted (ROIC)
Net income plus interest expense and interest on average operating lease liabilities less taxes on interest divided by average equity
plus average debt plus average operating lease liabilities. ROIC is considered a non-GAAP financial measure by SEC Regulation G
and Item 10 of SEC Regulation S-K, and may not be defined and calculated by other companies in the same manner. We believe this
measure is important to management and investors in evaluating the efficiency and effectiveness of the Company’s long-term capital
investments. In addition, we currently use ROIC as a performance criteria in determining certain elements of equity compensation for
our executives. ROIC should be considered in addition to, rather than as a substitute for, other information provided in accordance
with GAAP. The most comparable GAAP measure is Return on Average Common Shareholders’ Equity. At both December 31, 2019
and December 31, 2018, the incremental borrowing rate on operating leases was 3.7%. At December 31, 2017 and 2016, operating
leases were discounted using our effective interest rate on debt of 4.6% and 4.7%, respectively.
Net Return on Invested Capital as Adjusted (Net ROIC)
Net ROIC is considered a non-GAAP financial measure by SEC Regulation G and Item 10 of SEC Regulation S-K, and may not be
defined and calculated by other companies in the same manner. We believe this measure is important to management and investors
in evaluating the efficiency and effectiveness of our long-term capital investments. We use Net ROIC to demonstrate year over year
comparability for significant items. Net ROIC should be considered in addition to, rather than as a substitute for, other information
provided in accordance with GAAP. The most comparable GAAP measure is Return on Average Common Shareholders’ Equity.
Adjusted Debt / Adjusted EBITDA
Total debt plus operating lease liabilities plus after-tax unfunded pension and OPEB obligation divided by net income plus income
tax expense, depreciation, amortization, interest expense and adjustments for other income and interest on operating lease liabilities.
Adjusted debt to adjusted EBITDA (earnings before interest, taxes, depreciation, amortization and adjustments for other income
and interest on operating lease liabilities) is considered a non-GAAP financial measure by SEC Regulation G and Item 10 of SEC
Regulation S-K and may not be defined and calculated by other companies in the same manner. We believe this measure is important
to management and investors in evaluating the Company’s ability to sustain given debt levels (including leases) with the cash
generated from operations. In addition, a comparable measure is used by rating agencies when reviewing the Company’s credit rating.
Adjusted debt to Adjusted EBITDA should be considered in addition to, rather than as a substitute for, net income. The table below
provides reconciliations from net income to adjusted debt to adjusted EBITDA. At both December 31, 2019 and December 31, 2018,
the incremental borrowing rate on operating leases was 3.7%. At December 31, 2017 and 2016, operating leases were discounted
using our effective interest rate on debt of 4.6% and 4.7%, respectively.
2019 Union Pacific Fact Book FINANCIALS
32
UNION PACIFIC CORPORATION AND SUBSIDIARY COMPANIES Non-GAAP Measures Reconciliation to GAAP (unaudited)
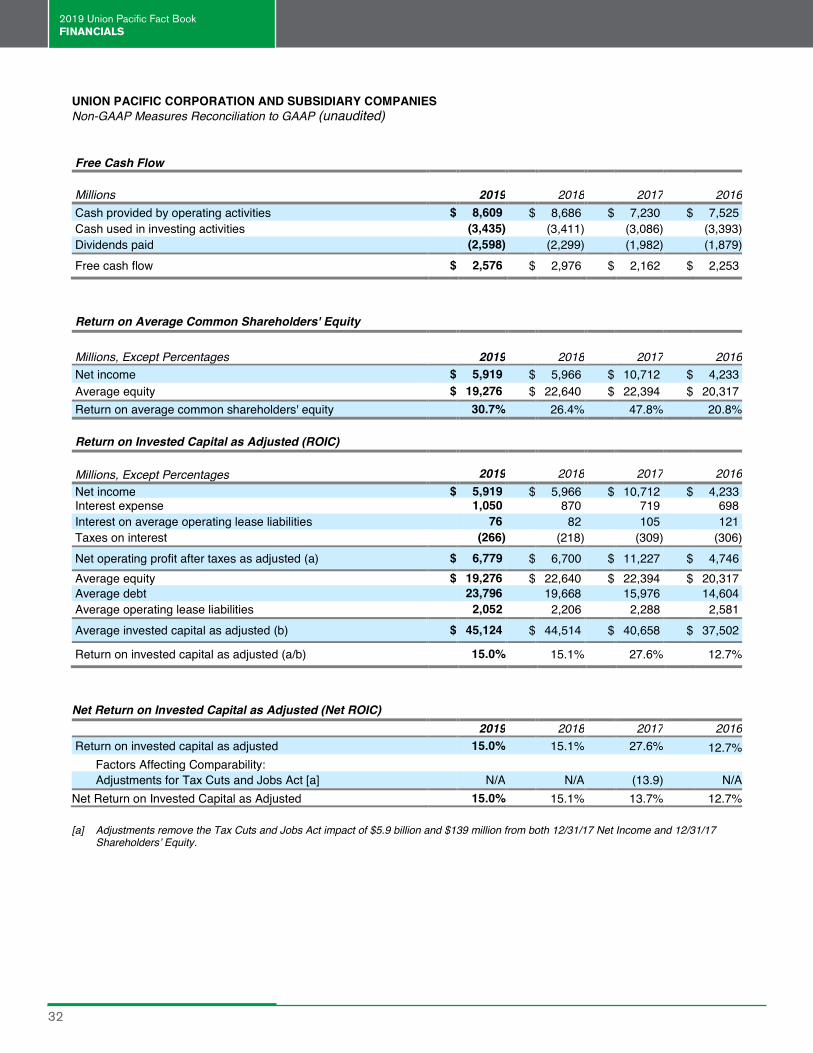
Free Cash Flow
Millions 2019 2018 2017 2016 Cash provided by operating activities $ 8,609 $ 8,686 $ 7,230 $ 7,525 Cash used in investing activities (3,435) (3,411) (3,086) (3,393) Dividends paid (2,598) (2,299) (1,982) (1,879) Free cash flow $ 2,576 $ 2,976 $ 2,162 $ 2,253
Return on Average Common Shareholders' Equity
Millions, Except Percentages 2019 2018 2017 2016 Net income $ 5,919 $ 5,966 $ 10,712 $ 4,233 Average equity $ 19,276 $ 22,640 $ 22,394 $ 20,317 Return on average common shareholders' equity 30.7% 26.4% 47.8% 20.8%
Return on Invested Capital as Adjusted (ROIC)
Millions, Except Percentages 2019 2018 2017 2016Net income $ 5,919 $ 5,966 $ 10,712 $ 4,233
Interest expense 1,050 870 719 698 Interest on average operating lease liabilities 76 82 105 121 Taxes on interest (266) (218) (309) (306) Net operating profit after taxes as adjusted (a) $ 6,779 $ 6,700 $ 11,227 $ 4,746 Average equity $ 19,276 $ 22,640 $ 22,394 $ 20,317 Average debt 23,796 19,668 15,976 14,604 Average operating lease liabilities 2,052 2,206 2,288 2,581 Average invested capital as adjusted (b) $ 45,124 $ 44,514 $ 40,658 $ 37,502
Return on invested capital as adjusted (a/b) 15.0% 15.1% 27.6% 12.7%
Net Return on Invested Capital as Adjusted (Net ROIC) 2019 2018 2017 2016
Return on invested capital as adjusted 15.0% 15.1% 27.6% 12.7%Factors Affecting Comparability: Adjustments for Tax Cuts and Jobs Act [a] N/A N/A (13.9) N/A
Net Return on Invested Capital as Adjusted 15.0% 15.1% 13.7% 12.7%
[a] Adjustments remove the Tax Cuts and Jobs Act impact of $5.9 billion and $139 million from both 12/31/17 Net Income and 12/31/17 Shareholdersʼ Equity.
2019 Union Pacific Fact Book FINANCIALS
33
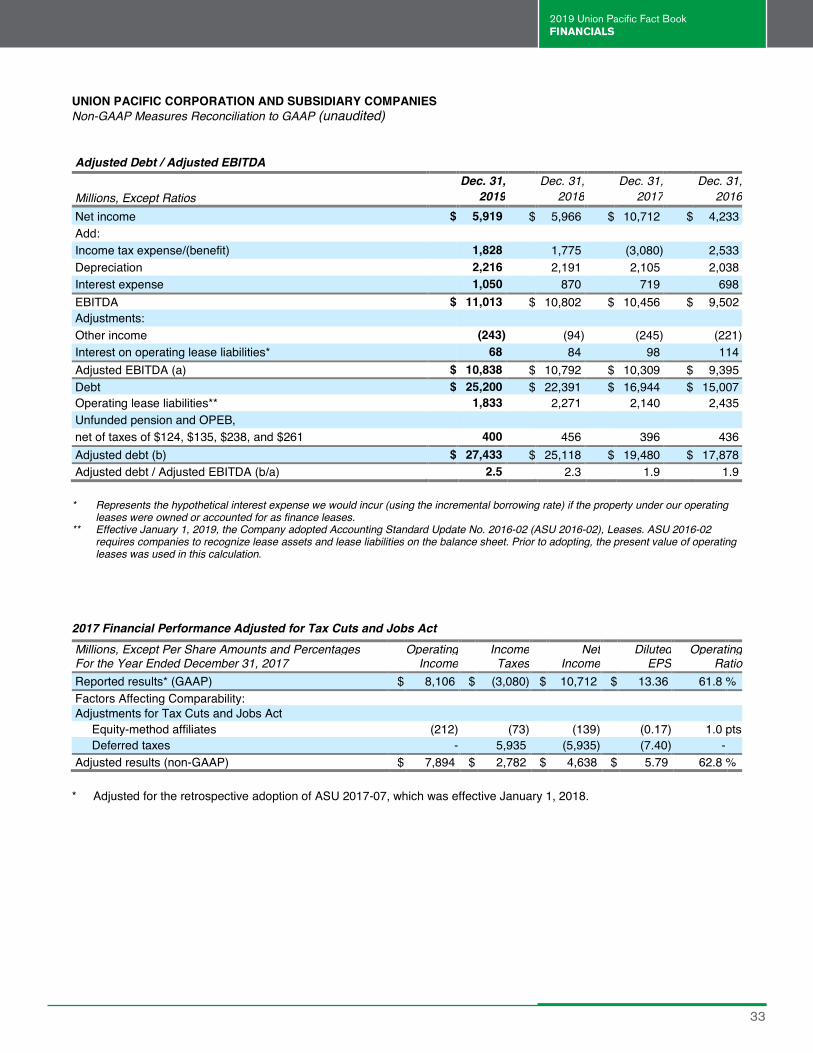
UNION PACIFIC CORPORATION AND SUBSIDIARY COMPANIES Non-GAAP Measures Reconciliation to GAAP (unaudited)
Adjusted Debt / Adjusted EBITDA
Dec. 31, Dec. 31, Dec. 31, Dec. 31, Millions, Except Ratios 2019 2018 2017 2016 Net income $ 5,919 $ 5,966 $ 10,712 $ 4,233 Add: Income tax expense/(benefit) 1,828 1,775 (3,080) 2,533 Depreciation 2,216 2,191 2,105 2,038 Interest expense 1,050 870 719 698 EBITDA $ 11,013 $ 10,802 $ 10,456 $ 9,502 Adjustments: Other income (243) (94) (245) (221) Interest on operating lease liabilities* 68 84 98 114 Adjusted EBITDA (a) $ 10,838 $ 10,792 $ 10,309 $ 9,395 Debt $ 25,200 $ 22,391 $ 16,944 $ 15,007 Operating lease liabilities** 1,833 2,271 2,140 2,435 Unfunded pension and OPEB, net of taxes of $124, $135, $238, and $261 400 456 396 436 Adjusted debt (b) $ 27,433 $ 25,118 $ 19,480 $ 17,878 Adjusted debt / Adjusted EBITDA (b/a) 2.5 2.3 1.9 1.9
* Represents the hypothetical interest expense we would incur (using the incremental borrowing rate) if the property under our operating leases were owned or accounted for as finance leases.
** Effective January 1, 2019, the Company adopted Accounting Standard Update No. 2016-02 (ASU 2016-02), Leases. ASU 2016-02 requires companies to recognize lease assets and lease liabilities on the balance sheet. Prior to adopting, the present value of operating leases was used in this calculation.
2017 Financial Performance Adjusted for Tax Cuts and Jobs ActMillions, Except Per Share Amounts and Percentages Operating Income Net Diluted Operating
For the Year Ended December 31, 2017 Income Taxes Income EPS Ratio Reported results* (GAAP) $ 8,106 $ (3,080) $ 10,712 $ 13.36 61.8 % Factors Affecting Comparability: Adjustments for Tax Cuts and Jobs Act Equity-method affiliates (212) (73) (139) (0.17) 1.0 pts Deferred taxes - 5,935 (5,935) (7.40) - Adjusted results (non-GAAP) $ 7,894 $ 2,782 $ 4,638 $ 5.79 62.8 %
* Adjusted for the retrospective adoption of ASU 2017-07, which was effective January 1, 2018.
2019 Union Pacific Fact Book FINANCIALS
34
2018 Union Pacific Fact Book FINANCIALS
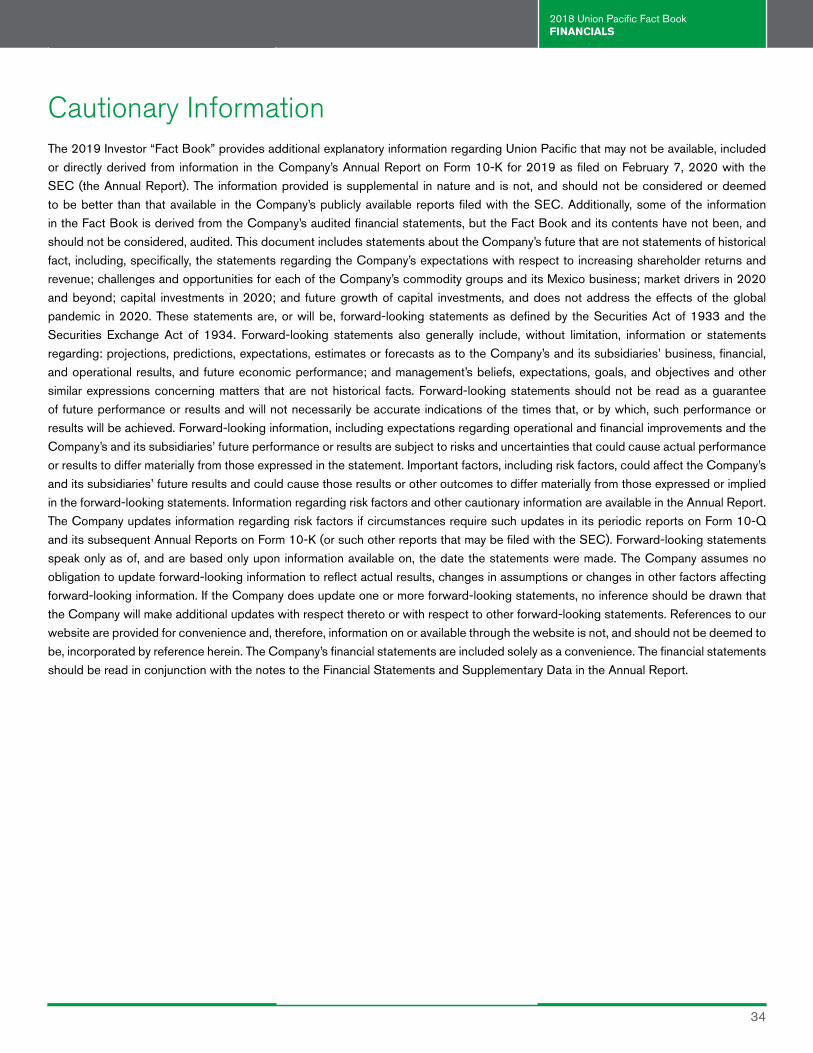
Cautionary InformationThe 2019 Investor “Fact Book” provides additional explanatory information regarding Union Pacific that may not be available, included
or directly derived from information in the Company’s Annual Report on Form 10-K for 2019 as filed on February 7, 2020 with the
SEC (the Annual Report). The information provided is supplemental in nature and is not, and should not be considered or deemed
to be better than that available in the Company’s publicly available reports filed with the SEC. Additionally, some of the information
in the Fact Book is derived from the Company’s audited financial statements, but the Fact Book and its contents have not been, and
should not be considered, audited. This document includes statements about the Company’s future that are not statements of historical
fact, including, specifically, the statements regarding the Company’s expectations with respect to increasing shareholder returns and
revenue; challenges and opportunities for each of the Company’s commodity groups and its Mexico business; market drivers in 2020
and beyond; capital investments in 2020; and future growth of capital investments, and does not address the effects of the global
pandemic in 2020. These statements are, or will be, forward-looking statements as defined by the Securities Act of 1933 and the
Securities Exchange Act of 1934. Forward-looking statements also generally include, without limitation, information or statements
regarding: projections, predictions, expectations, estimates or forecasts as to the Company’s and its subsidiaries’ business, financial,
and operational results, and future economic performance; and management’s beliefs, expectations, goals, and objectives and other
similar expressions concerning matters that are not historical facts. Forward-looking statements should not be read as a guarantee
of future performance or results and will not necessarily be accurate indications of the times that, or by which, such performance or
results will be achieved. Forward-looking information, including expectations regarding operational and financial improvements and the
Company’s and its subsidiaries’ future performance or results are subject to risks and uncertainties that could cause actual performance
or results to differ materially from those expressed in the statement. Important factors, including risk factors, could affect the Company’s
and its subsidiaries’ future results and could cause those results or other outcomes to differ materially from those expressed or implied
in the forward-looking statements. Information regarding risk factors and other cautionary information are available in the Annual Report.
The Company updates information regarding risk factors if circumstances require such updates in its periodic reports on Form 10-Q
and its subsequent Annual Reports on Form 10-K (or such other reports that may be filed with the SEC). Forward-looking statements
speak only as of, and are based only upon information available on, the date the statements were made. The Company assumes no
obligation to update forward-looking information to reflect actual results, changes in assumptions or changes in other factors affecting
forward-looking information. If the Company does update one or more forward-looking statements, no inference should be drawn that
the Company will make additional updates with respect thereto or with respect to other forward-looking statements. References to our
website are provided for convenience and, therefore, information on or available through the website is not, and should not be deemed to
be, incorporated by reference herein. The Company’s financial statements are included solely as a convenience. The financial statements
should be read in conjunction with the notes to the Financial Statements and Supplementary Data in the Annual Report.
34
![Investor Presentation March 2021 [Fact Book 2020]](https://static.fdocuments.us/doc/165x107/617f368323695b358e7526ef/investor-presentation-march-2021-fact-book-2020.jpg)