THE THOMSON CORPORATION 2006 INVESTOR FACT BOOK
54
THE THOMSON CORPORATION 2006 INVESTOR FACT BOOK
Transcript of THE THOMSON CORPORATION 2006 INVESTOR FACT BOOK

THETHOMSON
CORPORATION2006
INVESTOR FACT BOOK

AT THOMSON, WE CREATE VALUE BYLEVERAGING KNOWLEDGE, EXPERTISE ANDTECHNOLOGY ACROSS MARKETS THAT AREFUNDAMENTAL TO THE GLOBAL ECONOMY.
OUR CUSTOMERS BENEFIT FROM THOMSON SOLUTIONS THAT ENABLE THEM TO WORK MORE EFFECTIVELY AND EFFICIENTLY, AND PROVIDE THEM WITH TOOLS FOR CREATING NEW VALUE.
WE BELIEVE THE MOST POWERFUL SOLUTIONS ARE THOSE THAT TRANSFORM INFORMATION INTO KNOWLEDGE.

1The Thomson Corporation 2006 Investor Fact Book
TABLE OF CONTENTS
The 2006 Investor Fact Book is intended to provide a broad-based information set to newinvestors just learning theThomson investment story, and also to serve as a detailedreference guide for our long-term shareholders.
The Investor Fact Book providesan introduction to Thomson,from its overarching strategy to its investment highlights. Italso gives summary and detailedinformation concerning thecompany’s operating segmentsand financial data.
Introduction to Thomson
Overview of Business
2 General Overview5 Investment Highlights
Corporate Strategy
6 Overarching Strategy7 Financial Priorities
Segment Overview
8 Thomson Legal & Regulatory8 Thomson Learning9 Thomson Financial9 Thomson Scientific & Healthcare
Financial Data and Trends
Revenue & Profitability Trends
10 Trends:RevenueOperating ProfitOperating Profit MarginAdjusted EBITDAAdjusted EBITDA MarginCash Flow
11 Trends:Earnings per Common ShareFree Cash Flow/RevenueCapital Expenditures/RevenueReturn on Invested Capital Total DebtNet Debt to Adjusted
EBITDA Ratio
Revenue & Profitability Detail
12 Revenue by Segment13 Operating Profit by Segment 14 Adjusted EBITDA by Segment15 2004/2005 Quarterly Revenue,
Operating Profit and Earnings16 Cash Flow
Acquisitions
17 Schedule of Significant Acquisitions
Financial Position & Ratings
18 Liquidity and Capital Resources18 Normal Course Issuer Bid/
Share Buyback19 Debt Ratings19 Long-term Debt
Share Information
20 Share Price Charts 21 Dividend Schedule
Segment Detail
Thomson Legal & Regulatory
22 Overview 23 Structure & Financial Metrics24 Products & Services27 Competition
Thomson Learning
28 Overview 29 Structure & Financial Metrics30 Products & Services31 Competition
Thomson Financial
32 Overview 33 Structure & Financial Metrics34 Products & Services37 Competition
Thomson Scientific & Healthcare
38 Overview 39 Structure & Financial Metrics40 Products & Services44 Competition
Corporate Information
45 General Information & Contacts46 Senior Management47 Board of Directors48 Forward-Looking Statements
and Non-GAAP FinancialMeasures
Appendix
49 Reconciliations
Note: All dollar values are stated in US dollars except where noted.
All financial information excludes Q1 and Q2 2006 discontinued operations.August 2006

Introduction to Thomson
2 The Thomson Corporation 2006 Investor Fact Book
General Overview
Thomson is one of the world’s leading information servicesproviders to business and professional customers. We generaterevenues by supplying our customers with business-criticalinformation solutions and services.
We make our information more valuable by adding expert analysis,insight and commentary, and couple it with software tools andapplications that our customers can use to search, compare,synthesize and communicate the information. To further enhanceour customers’ workflows, we increasingly deliver information andservices electronically, integrate our solutions with our customers’own data, and tailor the delivery of information to meet specificcustomer needs.
As we integrate critical information with analysis, tools andapplications, we place greater focus on the ways our customersuse our content, rather than simply on selling the content itself.We are increasingly enabling our customers’ decisions in addition to informing them.
OVERVIEW OF BUSINESS

3The Thomson Corporation 2006 Investor Fact Book
Introduction to Thomson
Vision
Be the leading global provider of integratedinformation-based solutions to business and professional customers.
Mission
Deliver superior shareholder value byempowering our people to provide indispensableinformation, insight,productivity tools and services that help ourcustomers succeed.
We serve customers principally in the following sectors:
• law,
• tax,
• accounting,
• higher education,
• reference information,
• corporate e-learning and assessment,
• financial services,
• scientific research and
• healthcare decision support.
We believe these sectors are fundamental to economicdevelopment globally and consequently have the greatestpotential for consistent long-term growth.
We have a leading market position and well recognizedand respected brands in each of our principal markets.Our revenues in 2005 were approximately $8.4 billion and we derived approximately 66% of our revenues from subscription and other similar contractualarrangements, which are generally recurring in nature. In 2005, 84% of our revenues were generated by ouroperations in North America.
Increasingly, our customers are seeking products andservices delivered electronically and are migrating awayfrom print-based products. We deliver informationelectronically over the Internet, through dedicatedtransmission lines, CDs and, more recently, throughhandheld wireless devices. Electronic delivery improvesour ability to provide additional products and services toour existing customers and to access new customersaround the world. In 2005, electronic, software andservices comprised 68% of our revenues.
OVERVIEW OF BUSINESS

Introduction to Thomson
4 The Thomson Corporation 2006 Investor Fact Book
2005 Revenue Highlights
OVERVIEW OF BUSINESS
Revenue by Segment
Revenue by Media
Revenue by Region
11%Scientific & Healthcare
4% Asia Pacific
1% Latin America
84%North America
68%Electronic,software &services
41%Legal &Regulatory
26%Learning
22%Financial
11%Europe
32%Print
Legal & Regulatory Learning Financial Scientific & Healthcare
$3.4 billion revenue17,300 employees22 countries
$2.2 billion revenue9,400 employees39 countries
$1.9 billion revenue8,700 employees22 countries
$0.9 billion revenue4,700 employees26 countries
Our corporate center initiates and executes strategy andmanages other company-wide functions. By centralizingkey functions in our corporate center, we foster acompany-wide approach while allowing our segmentssufficient operational flexibility and scope for initiative indealing with customers. In addition to identifying new
business opportunities and acquisitions, our corporatecenter oversees the planning processes of our segmentsand their implementation of strategy and assesses theirperformance. Our corporate center develops and executescapital strategy, including tax planning, and determinesour overall direction on technology.
Thomson Structure
We organize our operations in four segments that are structured on the basis of the customers they serve:
5The Thomson Corporation 2006 Investor Fact Book
Introduction to Thomson
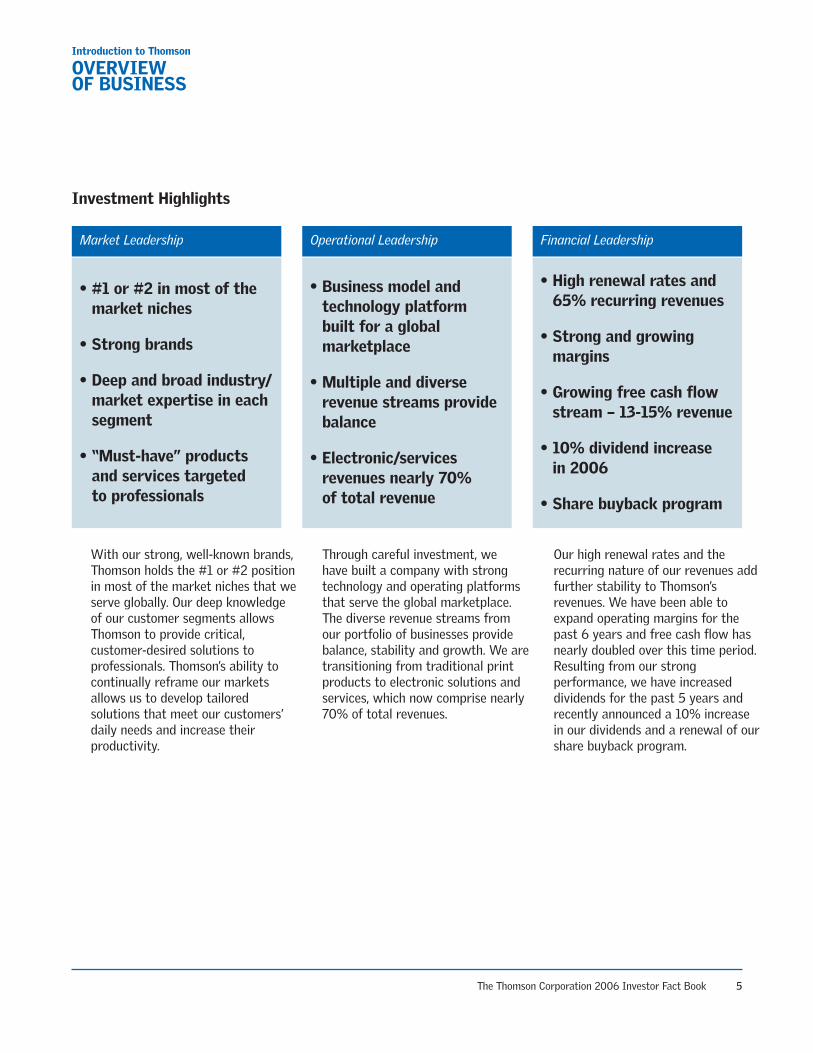
Investment Highlights
OVERVIEW OF BUSINESS
Market Leadership Operational Leadership Financial Leadership
• #1 or #2 in most of themarket niches
• Strong brands
• Deep and broad industry/market expertise in eachsegment
• “Must-have” productsand services targeted to professionals
• Business model andtechnology platformbuilt for a globalmarketplace
• Multiple and diverserevenue streams providebalance
• Electronic/servicesrevenues nearly 70% of total revenue
• High renewal rates and65% recurring revenues
• Strong and growingmargins
• Growing free cash flowstream – 13-15% revenue
• 10% dividend increase in 2006
• Share buyback program
With our strong, well-known brands,Thomson holds the #1 or #2 positionin most of the market niches that weserve globally. Our deep knowledgeof our customer segments allowsThomson to provide critical,customer-desired solutions toprofessionals. Thomson’s ability tocontinually reframe our marketsallows us to develop tailoredsolutions that meet our customers’daily needs and increase theirproductivity.
Through careful investment, we have built a company with strongtechnology and operating platformsthat serve the global marketplace.The diverse revenue streams fromour portfolio of businesses providebalance, stability and growth. We aretransitioning from traditional printproducts to electronic solutions andservices, which now comprise nearly70% of total revenues.
Our high renewal rates and therecurring nature of our revenues addfurther stability to Thomson’srevenues. We have been able toexpand operating margins for thepast 6 years and free cash flow hasnearly doubled over this time period.Resulting from our strongperformance, we have increaseddividends for the past 5 years andrecently announced a 10% increasein our dividends and a renewal of ourshare buyback program.

Enableresults
Platform
Content
Components of Workflow Solutions
From
Inf
orm
ing
Deci
sions
to E
nabl
ing
Resu
lts
Higher Recurring Revenue, Greater Leverage and Higher Margins
Content
The first is content, which – notmany years ago – used to be themajor source of value creation in
our industry. We built our businesson value-added content and, indeed,content still forms the foundationof our workflow solutions today.
Platform
Second, we add more value, and inturn increase revenues, when we
deliver that content viasophisticated technology platforms
that enable customers to accessand apply our information at the
point of decision.
Enable results
The third and highest level of valueconsists of high-end analytics,
decision support and transactiontools, services and consulting.
These offerings help our customersincrease their productivity, boost
their performance and innovate toremain competitive in their
changing markets.
Introduction to Thomson
6 The Thomson Corporation 2006 Investor Fact Book
CORPORATE STRATEGY
Overarching Strategy
For the past several years, we have been building size and scale in our chosen markets. To keep growing, we will keep moving up our customers’ value chain. We believe that our emphasis on workflow solutions
reflects a major shift in value creation for the informationindustry, and a key to our company’s sustained growth. Asimple way to think about the value chain is to imaginethree sources, or levels, of value.
Moving up the value pyramid
Our workflow solutions combine content, technology and, increasingly, high-end analytical tools andservices. When those solutions are integrated into our customers’ systems, they deliver a much higher level
of value than content alone. Our role changes from content provider to business partner as we move upthe value chain from informing our customers’ decisions to enabling their actions.

7The Thomson Corporation 2006 Investor Fact Book
Introduction to Thomson
2005 Results
Our strategy to move from being a content provider todeveloping state-of-the-art information-based solutions isproducing strong financial results. 2005 revenues were up8% to more than $8.4 billion, consistent with our long-term goal of 7–9% revenue growth annually. Organicgrowth, which accelerated throughout the year, was 4%.
Revenue from electronic solutions, software and servicesincreased 12%, accounting for nearly 70% of totalrevenues. Approximately half of the revenue fromelectronic products came from workflow solutionstailored to our customers’ needs. Workflow solutions areclearly becoming the engine of our long-term growth.
Operating margins were up again in 2005 for the sixthconsecutive year, and have increased by more than 500basis points since 2001. Earnings per share (EPS) were$1.42 in 2005, compared to $1.54 in 2004. After adjustingfor discontinued operations and one-time items, underlyingEPS increased 17%, following a similar increase in 2004.
In 2005, we generated $1.9 billion of cash fromoperations. And, over the past five years, our free cashflow has more than doubled, to $1.2 billion in 2005. Onthe back of this strength, we returned more than $760million of cash to shareholders in the form of dividendsand share repurchases in 2005 – an increase over 2004of more than 50%.
CORPORATE STRATEGY
Growth agenda Return on capital Financial policies
7-9% Revenue Growth13-15% FCF/Revenue
Improving ROIC≈ 40% Dividend payout
“A” rating
Consistent organic growth
Disciplined acquisitionstrategy
Portfolio optimization
Focus on capital efficiency:
CapEx as percentage of revenues
Working capital
Disciplined investmentstrategy
Strong and flexible capital structure
Attractive dividend payout
Share buybacks
Balancegrowth and returns to
deliver superior shareholder value
Financial Priorities
The illustration below depicts our financial priorities fordriving shareholder value. We believe balanced
growth and returns is the best approach to generatingsustainable, long-term shareholder value.

Introduction to Thomson
8 The Thomson Corporation 2006 Investor Fact Book
SEGMENTOVERVIEW
Thomson Legal & Regulatory
Thomson Legal & Regulatory is a leading provider ofinformation solutions to legal, tax, accounting, intellectual property, compliance and other businessprofessionals, as well as government agencies.
Major Brands
Major brands include Westlaw, Aranzadi, BAR/BRI,Carswell, Checkpoint, Compu-Mark, Creative Solutions,Thomson Elite, FindLaw, Gee, Lawbook, LIVEDGAR, RIA,Sweet & Maxwell and Thomson & Thomson.
Structure
Thomson Learning
Thomson Learning is a leading provider of learningsolutions to colleges, universities, professors, students,libraries, reference centers, government agencies,corporations and professionals.
Major Brands
Major brands include Thomson Course Technology,Thomson Delmar Learning, Thomson Gale, Thomson Heinle,Thomson Nelson, Thomson NETg, Thomson Prometric,Thomson South-Western and Thomson Wadsworth.
Structure
27.0% 28.4% 27.6% 28.1% 28.9%15.0% 15.3%
17.2%15.6% 15.6%
2,634 2,772 2,9533,207 3,410
1,6641,891 1,911
2,030 2,177
2001 2002 2003 2004 2005 2001 2002 2003 2004 2005
2001 2002 2003 2004 2005
Revenuein millions of US dollars
Revenuein millions of US dollars
Segment Operating Profit Margin
Segment Operating Profit Margin
2001 2002 2003 2004 2005
16%Thomson Tax and Accounting
68%NorthAmericanLegal
16%TLR International
7%Corporate e-Learning
19%International HigherEducation
16%Global Library Reference
44%Domestic Higher Education
14%e-Testing
as a percentageof revenue
as a percentageof revenue

9The Thomson Corporation 2006 Investor Fact Book
Introduction to Thomson
Thomson Financial
Thomson Financial is a leading provider of products and integration services to financial and technologyprofessionals in the corporate, investment banking,institutional, retail wealth management and fixed income sectors of the global financial community.
Major Brands
Its flagship brand is Thomson ONE. Other majorbusinesses and brands include AutEx, Baseline, BETASystems, Datastream, First Call, I/B/E/S, Investext, IRChannel, SDC Platinum, StreetEvents and TradeWeb.
Structure
Thomson Scientific & Healthcare
Thomson Scientific & Healthcare is a leading provider ofinformation and services to researchers, physicians andother professionals in the healthcare, academic, scientific,corporate and government marketplaces.
Major Brands
Major businesses and information solutions includeDerwent World Patents Index, Medstat, Micromedex,MicroPatent, PDR (Physicians’ Desk Reference), ThomsonPharma, ISI Web of Science and Web of Knowledge.
Structure
14.4% 15.0% 15.1%16.9% 17.6%
17.0% 18.4%20.2%
21.8% 23.1%
1,704 1,622 1,5261,738
1,897
689 696 743 798921
SEGMENTOVERVIEW
2001 2002 2003 2004 2005 2001 2002 2003 2004 2005
Revenuein millions of US dollars
Revenuein millions of US dollars
Segment Operating Profit Margin
Segment Operating Profit Margin
2001 2002 2003 2004 2005 2001 2002 2003 2004 2005
27%InvestmentManagement
11%Corporate
12%Fixed Income/TradeWeb
12%Investment Banking
25%Retail WealthManagement
24%PharmaR&D
14%Payers
12%Physicians/PDR
12%Providers
18%Corporate
20%Academic &Government
6%Equity
7%Omgeo/Other
as a percentageof revenue
as a percentageof revenue

Financial Data & Trends
10 The Thomson Corporation 2006 Investor Fact Book
Adjusted EBITDA2
in millions of US dollarsAdjusted EBITDA Margin2 Cash Flow
in millions of US dollarsNet cash provided by operating activitiesFree Cash Flow3
REVENUE & PROFITABILITY TRENDS1
1 Certain non-GAAP financial measures are presented herein and the related reconciliations are contained in the appendix.
2 Adjusted EBITDA is defined as earnings from continuing operations before interest, taxes, depreciation, amortization and net other income (expense). We also useadjusted EBITDA Margin which we define as adjusted EBITDA as a percentage of revenue.
3 Net cash provided by operating activities less net capital expenditures, other investing activities and dividends paid on preference shares.
805
1,113 1,1721,320
1,447
807
1,108
1,171
1,330
1,461
6,672 6,956 7,1087,749
8,383
6,744
7,065
7,221
7,876
8,519
Revenuein millions of US dollars
Operating Profitin millions of US dollars
Operating Profit Margin
2001 2002 2003 2004 2005
1,7091,900 2,003
2,1952,350
1,720
1,720
1,907
2,013
2,373
2001 2002 2003 2004 2005
25.6%27.3% 28.2% 28.3% 28.0%
2001 2002 2003 2004 2005
2001 2002 2003 2004 2005
12.1%
16.0% 16.5% 17.0% 17.3%
12.0%
15.7%
16.2%
16.9%
17.1%
2001 2002 2003 2004 2005
580
980 9831,123
1,194
1,651 1,691 1,6541,808
1,879
2001 2002 2003 2004 2005
Revenue increased by 8% in 2005 to$8.4 billion, driven by 12% growth inelectronic solutions, software and services.
Operating profit increased 10% in2005, as a result of higher revenuesand improved efficiencies.
Operating profit margin increased to17.3% in 2005, the sixth consecutiveyear of margin expansion.
Adjusted EBITDA increased by 7% in2005 to nearly $2.4 billion.
Adjusted EBITDA margin declinedslightly in 2005, but is 240 basispoints higher than in 2001.
Free cash flow, a key measure offinancial strength, has more thandoubled over the past five years.

11The Thomson Corporation 2006 Investor Fact Book
Financial Data & Trends
Earnings per Common Share Earnings per common shareAdjusted EPS from continued operations1
Free Cash Flow/Revenue Capital Expenditures/Revenue
REVENUE & PROFITABILITY TRENDS
1 Excludes one-time items.
8.1% 8.0%7.4% 7.6% 7.8%
4,744
4,121 4,255 4,315 4,2832.6x
1.9x1.7x 1.7x 1.6x
1.18
0.91
1.34
1.541.42
0.98 0.971.07
1.21
1.42
2001 2002 2003 2004 2005
2001 2002 2003 2004 2005
2001 2002 2003 2004 2005
9.9%
7.2%7.9% 7.8% 7.5%
2001 2002 2003 2004 2005
2001 2002 2003 2004 2005 2001 2002 2003 2004 2005
8.7%
14.1% 13.8%14.5% 14.2%
Strong operating performance drove adjusted earnings up 17% in 2005 to $1.42 per share.
Free cash flow as a percentage ofrevenue has increased significantlysince 2001.
Capital expenditures as a percentageof revenue declined further in 2005 to 7.5% due to investmentefficiency efforts.
ROIC increased in 2005 and is a measure receiving increasedmanagement focus as size and scale has been established in oursegments.
Total debt has steadily been in therange of approximately $4.3 billionover the past three years.
At 1.6 times in 2005, net debt toadjusted EBITDA reflects Thomson’sstrong capital position.
Return on Invested Capital Total Debtin millions of US dollars
Net Debt to Adjusted EBITDA Ratio

Financial Data & Trends
12 The Thomson Corporation 2006 Investor Fact Book
Revenue by Segment
in millions of US dollars 2001 2002 2003 2004 2005
Legal & Regulatory 2,634 2,772 2,953 3,207 3,410
% increase 5% 5% 7% 9% 6%
% of total revenue 40% 40% 42% 41% 41%
Learning 1,664 1,891 1,911 2,030 2,177
% increase 20% 14% 1% 6% 7%
% of total revenue 25% 27% 27% 26% 26%
Financial 1,704 1,622 1,526 1,738 1,897
% increase (decrease) 10% (5%) (6%) 14% 9%
% of total revenue 25% 23% 21% 23% 22%
Scientific & Healthcare 689 696 743 798 921
% increase 0% 1% 7% 8% 15%
% of total revenue 10% 10% 10% 10% 11%
Total Revenue1 6,672 6,956 7,108 7,749 8,383
% increase 9% 4% 2% 9% 8%
1 Total revenue is after inter-company eliminations.
Revenue by Segment – Percent Electronic, Software & Services
2001 2002 2003 2004 2005
Legal & Regulatory 59% 62% 63% 66% 68%
Learning 31% 32% 30% 32% 35%
Financial 97% 98% 98% 98% 98%
Scientific & Healthcare 81% 82% 83% 84% 86%
Total 64% 64% 64% 66% 68%
REVENUE & PROFITABILITY DETAIL

13The Thomson Corporation 2006 Investor Fact Book
Financial Data & Trends
Operating Profit by Segment
in millions of US dollars, except per common share amounts 2001 2002 2003 2004 2005
Legal & Regulatory 712 788 816 902 986
% increase 10% 11% 4% 11% 9%
% of total 54% 54% 53% 54% 52%
Learning 250 289 329 316 339
% increase (decrease) 16% 16% 14% (4%) 7%
% of total 19% 20% 22% 19% 18%
Financial 246 244 230 294 334
% increase (decrease) 19% (1%) (6%) 28% 14%
% of total 18% 17% 15% 17% 18%
Scientific & Healthcare 117 128 150 174 213
% increase 0% 9% 17% 16% 22%
% of total 9% 9% 10% 10% 12%
Total Segment Operating Profit 1,334 1,451 1,529 1,701 1,889
% increase 17% 38% 5% 13% 10%
Corporate & other (75) (70) (97) (98) (128)
Amortization (415) (262) (256) (268) (297)
Restructuring & Y2K costs (30) (4) — — —
Total Operating Profit 805 1,113 1,172 1,320 1,447
% increase 17% 37% 6% 14% 10%
Other income (expense) 252 (135) 61 24 (28)
Net interest expense and other financing costs (236) (291) (252) (235) (223)
Income taxes (159) (154) (123) (255) (277)
Earnings from continuing operations 662 533 858 854 919
Discontinued operations, net of tax 106 71 28 157 15
Net earnings 768 604 886 1,011 934
Preference dividends (27) (19) (9) (3) (4)
Earnings attributable to common shares 741 585 877 1,008 930
Basic and diluted earnings per common share
From continuing operations $1.01 $0.80 $1.30 $1.30 $1.40
From discontinued operations $0.17 $0.11 $1.04 $0.24 $1.02
Basic and diluted earnings per common share $1.18 $0.91 $1.34 $1.54 $1.42
Weighted average diluted shares outstanding 628.2 641.5 654.2 655.9 655.0
REVENUE & PROFITABILITY DETAIL

Financial Data & Trends
14 The Thomson Corporation 2006 Investor Fact Book
Adjusted EBITDA1 (Earnings Before Interest, Taxes, Depreciation & Amortization) by Segmentin millions of US dollars
2001 2002 2003 2004 2005
Operating Profit 805 1,113 1,172 1,320 1,447
Depreciation 459 521 575 607 606
Amortization 415 262 256 268 297
Restructuring and Y2K costs 30 4 – – –
Adjusted EBITDA 1,709 1,900 2,003 2,195 2,350
Adjusted EBITDA by Segment
Legal & Regulatory 849 940 989 1,097 1,185
Learning 387 448 508 502 525
Financial 400 413 406 476 511
Scientific & Healthcare 148 156 183 206 247
Corporate & other (75) (57) (83) (86) (118)
Adjusted EBITDA 1,709 1,900 2,003 2,195 2,350
REVENUE & PROFITABILITY DETAIL
849940 989
1,0971,185
2001 2002 2003 2004 2005
387448
508 502 525
2001 2002 2003 2004 2005
400 413 406476 511
2001 2002 2003 2004 2005
148 156 183 206 247
2001 2002 2003 2004 2005
Legal & Regulatory Learning Financial Scientific & Healthcare
1 Adjusted EBITDA is defined as earnings from continuing operations before interest, taxes, depreciation, amortization and net other income (expense).

15The Thomson Corporation 2006 Investor Fact Book
Financial Data & Trends
2004/2005 Quarterly Revenue, Operating Profit and Earnings
The following table presents a summary of our consolidated operating results for each of the eight quarters ended March31, 2004 through December 31, 2005.
Quarter ended Quarter ended Quarter ended Quarter ended
in millions of US dollars,March 31 June 30 September 30 December 31
except per common share amounts 2005 2004 2005 2004 2005 2004 2005 2004
Revenues 1,769 1,604 1,966 1,775 2,304 2,143 2,344 2,228
Operating profit 199 105 344 247 582 492 619 476
Earnings from continuing operations 74 47 296 176 299 331 250 300
Discontinued operations, net of tax (1) (10) 6 16 10 13 – 138
Net earnings 73 37 302 192 309 344 250 438
Dividends declared on preference shares (1) (1) (1) (1) (1) – (1) (1)
Earnings attributable to common shares 72 36 301 191 308 344 249 437
Basic and diluted earnings (loss) per common share
From continuing operations $0.11 $0.07 $0.45 $0.27 $0.46 $0.51 $0.38 $0.46
From discontinued operations – ($0.02) $0.01 $0.02 $0.01 $0.01 – $0.21
$0.11 $0.05 $0.46 $0.29 $0.47 $0.52 $0.38 $0.67
REVENUE & PROFITABILITY DETAIL
We typically derive a much greater portion of ouroperating profit in the second half of the year ascustomer buying patterns are concentrated in the secondhalf of the year, particularly in the learning andregulatory markets. Costs are incurred more evenlythroughout the year. As a result, our operating marginsgenerally increase as the year progresses. In general, ouryear-over-year performance reflected increased operatingprofit driven by higher revenues from existing businessesand contributions from acquired businesses.
In the quarters ended September 30, 2004, December 31,2004 and June 30, 2005, earnings from continuingoperations and net earnings reflected the recognition ofcertain tax credits. In the quarter ended December 31,2005, earnings from continuing operations and netearnings reflected a $125 million tax charge associatedwith repatriated profits.

Financial Data & Trends
16 The Thomson Corporation 2006 Investor Fact Book
Cash Flow
in millions of US dollars 2001 2002 2003 2004 2005
Cash flow provided by operating activities 1,651 1,691 1,654 1,808 1,879
Additions to property and equipment, less proceeds from disposals (continuing operations) (662) (499) (564) (601) (630)
Additions to property and equipment of discontinued operations (22) (24) (13) (21) (12)
Other investing activities (359) (166) (83) (60) (39)
Dividends on preference shares (28) (22) (11) (3) (4)
Free Cash Flow 580 980 983 1,123 1,194
Taxes (refunded) paid (103) 72 215 270 445
Pre-tax free cash flow 477 1,052 1,198 1,393 1,639
REVENUE & PROFITABILITY DETAIL
Cash Flow Provided by Operating Activitiesin millions of US dollars
Pre-tax Free Cash Flowin millions of US dollars
Free Cash Flowin millions of US dollars
1,651 1,691 1,6541,808 1,879
2001 2002 2003 2004 2005
477
1,0521,198
1,393
1,639
2001 2002 2003 2004 2005
580
980 9831,123 1,194
2001 2002 2003 2004 2005

17The Thomson Corporation 2006 Investor Fact Book
Financial Data & Trends
Acquisitions
We completed the following acquisitions during 2005 and 2004: Year ended December 31
2005 2004
Number of Cash Number of Cash in millions of US dollars transactions consideration transactions consideration
Businesses and identifiable intangible assets acquired 34 232 56 1,551
Contingent consideration payment – TradeWeb LLC 1 50 – –
Minority investments in businesses 3 15 1 6
38 297 57 1,557
The following provides a brief description of major acquisitions completed during 2005 and 2004:
Date Company
July 2005 Global Securities Information, Inc.
February 2005 Tax Partners, LLC
November 2004 Information Holdings Inc.
October 2004 Capstar
September 2004 KnowledgeNet Inc.
May 2004 TradeWeb LLC
May 2004 Starquote
March 2004 CCBN.com, Inc.
January 2004 BIOSIS
REVENUE & PROFITABILITY DETAIL
Acquiring segment Description
Legal & Regulatory A provider of online securities and securities-related information and research services
Legal & Regulatory A provider of sales and use tax complianceservices primarily servicing thetelecommunications industry in the U.S.
Scientific & Healthcare A provider of intellectual property andregulatory information
Learning A provider of competency assessment, learningand measurement and testing solutions
Learning A provider of a learning platform that offers acombination of self-paced, instructor-led andmobile learning
Financial An online global trading platform for fixedincome securities
Financial A provider of financial information to theCanadian retail equity market
Financial A provider of web-based communicationssolutions for the investment community
Scientific & Healthcare A provider of custom and standard informationresources for biological researchers

Financial Data & Trends
18 The Thomson Corporation 2006 Investor Fact Book
FINANCIAL POSITION & RATINGS
Liquidity and Capital Resources
Financial Position
At December 31, 2005, our total assets were $19,438million, which represented a 1% decrease from the totalof $19,645 million at December 31, 2004. This decreasewas primarily due to the impact of foreign currencytranslation and the effect of depreciation and amortization,
which more than offset increases in assets related tonewly acquired intangible assets and capital expenditures.
Our total assets by segment as of June 30 and December31, 2005 were as follows:
2005 Assets by Segment Year ended
Jun 30 Dec 31 in millions of US dollars 2006 2005
Thomson Legal & Regulatory 7,234 7,320
Thomson Learning 5,161 5,269
Thomson Financial 3,494 3,346
Thomson Scientific & Healthcare 1,677 1,700
Corporate and other 1,381 1,440
Discontinued operations 283 363
Total assets 19,230 19,438
37% Legal & Regulatory
27% Learning
18% Financial
9% Scientific & Healthcare
9% Corporate
Normal Course Issuer Bid/Share Buyback
Thomson views its buyback program as an integral partto enhancing long-term shareholder value. In May 2005,we initiated a normal course issuer bid to repurchase upto 15 million of our common shares. Under this firstprogram, which terminated on May 4, 2006, werepurchased and subsequently cancelled 13.3 millionshares for $482 million.
In May 2006, we renewed our normal course issuer bid.Under this second program, we may purchase up to 15million of our common shares, which will be cancelled.Purchases commenced on May 5, 2006 and will terminateno later than May 4, 2007 We may purchase shares inopen market transactions on the Toronto Stock Exchangeor the New York Stock Exchange.
The following summarizes our repurchases for this second program.
in millions of US dollarsNumber of shares
Three-month period ended Shares Repurchased Average Price per Share available for repurchase
June 30, 2006 1,640,000 $39.90 13,360,000

19The Thomson Corporation 2006 Investor Fact Book
Financial Data & Trends
Debt Ratings
The following table sets forth the ratings that we have received for our outstanding debt securities.
Moody’s Standard & Poor’s Dominion Bond Rating Service
Long-term debt A3 A- A (low)
Commercial paper – – R-1 (low)
Trend/Outlook Stable Stable Stable
Long-term Debt
The following is a summary of our long-term debt:
Carrying Amount Fair Value
in millions of US dollars Primary debt Currency swap Hedged Primary debt Currency swap Hedged As at December 31, 2005 instruments instruments debt instruments instruments debt
Bank and other 208 - 208 205 - 205
6.50% Debentures, due 2007 215 (36) 179 223 (46) 177
4.35% Notes, due 2009 258 (12) 246 259 (22) 237
4.50% Notes, due 2009 215 (31) 184 217 (33) 184
5.20% Notes, due 2014 516 (24) 492 542 (57) 485
6.85% Medium-term notes, due 2011 344 (90) 254 386 (108) 278
5.75% Notes, due 2008 400 - 400 406 - 406
4.25% Notes, due 2009 200 - 200 195 - 195
4.75% Notes, due 2010 250 - 250 247 - 247
6.20% Notes, due 2012 700 - 700 736 - 736
5.25% Notes, due 2013 250 - 250 249 - 249
5.50% Debentures, due 2035 400 - 400 387 - 387
Private placements, due 2006-2010 125 - 125 133 - 133
4,081 (193) 3,888 4,185 (266) 3,919
Current portion (98) - (98)
3,983 (193) 3,790
FINANCIAL POSITION & RATINGS
The maturity dates for our long-term debt are well balanced with no significant concentration in any one year.

Financial Data & Trends
20 The Thomson Corporation 2006 Investor Fact Book
Our common shares are listed and traded on the New York Stock Exchange and the Toronto Stock Exchange under thesymbol “TOC.” Of the two marketplaces, the greatest volume of trading in 2005 occurred on the Toronto Stock Exchange.
SHARE INFORMATION
20
25
30
35
40
Jun02
Dec02
Dec03
Dec04
Jun03
Jun04
Jun05
Dec05
Mar06
0
5
10
15
20
25
30
Dec95
Dec96
Dec97
Dec98
Dec99
Dec00
Dec01
Dec02
Dec03
Dec04
Dec05
Dec95
Dec96
Dec97
Dec98
Dec99
Dec00
Dec01
Dec02
Dec03
Dec04
Dec05
0
10
20
30
40
50
60
70
1996 1997 1998 1999 2000 2001 2002 2003 2004 2005
$0.56 $0.59$0.63
$0.66$0.69 $0.70 $0.71 $0.73
$0.76 $0.79
Share Price Chart and Dividend Schedule
TOC Share Price and Volume History on the Toronto Stock Exchange (TSX)
Price(CDN$)
High/Low Close
Volumemillions of shares

21The Thomson Corporation 2006 Investor Fact Book
Financial Data & Trends
TOC Share Price History on the New York Stock Exchange (NYSE)
Price($)
High/Low Close
Listed on NYSE on June 12, 2002
10 Year Common Share Dividend History
Thomson and its predecessor companies haveconsistently paid dividends for over 30 yearsand we view dividends as a critical componentof total shareholder return. In the first quarterof 2006, we announced a 10% increase in ourquarterly dividend payments to $0.88 pershare annually which is representative ofThomson’s strong and increasing free cash flow generation. Thomson targets to pay out in the range of 40% of free cash flow individends annually.
SHARE INFORMATION
20
25
30
35
40
Jun02
Dec02
Dec03
Dec04
Jun03
Jun04
Jun05
Dec05
Mar06
0
5
10
15
20
25
30
Dec95
Dec96
Dec97
Dec98
Dec99
Dec00
Dec01
Dec02
Dec03
Dec04
Dec05
Dec95
Dec96
Dec97
Dec98
Dec99
Dec00
Dec01
Dec02
Dec03
Dec04
Dec05
0
10
20
30
40
50
60
70
1996 1997 1998 1999 2000 2001 2002 2003 2004 2005
$0.56 $0.59$0.63
$0.66$0.69 $0.70 $0.71 $0.73
$0.76 $0.79
20
25
30
35
40
Jun02
Dec02
Dec03
Dec04
Jun03
Jun04
Jun05
Dec05
Mar06
0
5
10
15
20
25
30
Dec95
Dec96
Dec97
Dec98
Dec99
Dec00
Dec01
Dec02
Dec03
Dec04
Dec05
Dec95
Dec96
Dec97
Dec98
Dec99
Dec00
Dec01
Dec02
Dec03
Dec04
Dec05
0
10
20
30
40
50
60
70
1996 1997 1998 1999 2000 2001 2002 2003 2004 2005
$0.56 $0.59$0.63
$0.66$0.69 $0.70 $0.71 $0.73
$0.76 $0.79
1 Excludes a special dividend of $0.428 related to the sale of our 20% interest in Bell Globemedia Inc.
1

Segment Detail
22 The Thomson Corporation 2006 Investor Fact Book
Overview
Thomson Legal & Regulatory is a leading provider of informationsolutions to legal, tax, accounting, intellectual property, complianceand other business professionals, as well as government agencies.We offer a broad range of products and services that utilize ourelectronic databases of legal, regulatory and business informationand news.
We are also one of the largest publishers of legal textbooks andmaterials. Our offerings also include software to assist lawyers and accountants with practice management functions, includingdocument management, case management and other back officefunctions, and software that assists tax professionals withpreparing and filing tax returns.
THOMSON LEGAL & REGULATORY
23The Thomson Corporation 2006 Investor Fact Book
Segment Detail
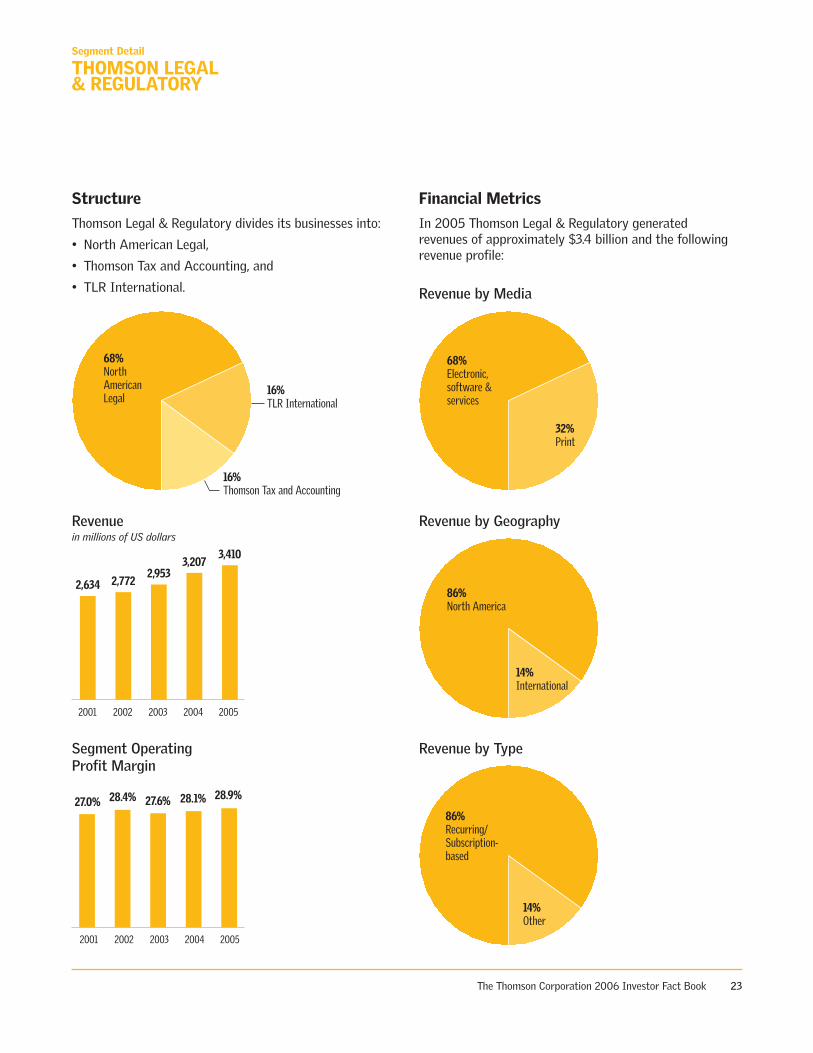
Structure
Thomson Legal & Regulatory divides its businesses into:
• North American Legal,
• Thomson Tax and Accounting, and
• TLR International.
Financial Metrics
In 2005 Thomson Legal & Regulatory generated revenues of approximately $3.4 billion and the followingrevenue profile:
68%Electronic, software & services
32%Print
86%North America
14%International
86%Recurring/Subscription-based
14%Other
THOMSON LEGAL & REGULATORY
Revenue by Geography
Revenue by Media
Revenue by Type
27.0% 28.4% 27.6% 28.1% 28.9%
2,634 2,7722,953
3,2073,410
2001 2002 2003 2004 2005
2001 2002 2003 2004 2005
Revenuein millions of US dollars
Segment Operating Profit Margin
16%Thomson Tax and Accounting
68%NorthAmericanLegal
16%TLR International

Segment Detail
24 The Thomson Corporation 2006 Investor Fact Book
Products and Services
North American Legal
As a result of our West business, we are the leadingprovider in the United States of legal information-basedproducts and services. The following provides informationabout our major North American Legal brands.
Major Brands Principal Products and Services
West
Westlaw
LIVEDGAR
Carswell (Canada)
Thomson Elite
West km
ProLaw
Hildebrandt International
FindLaw
HubbardOne
LegalWorks
Foundation Press
West Law School Publishing
BAR/BRI
West LegalEdcenter
Business Intelligence
NewsEdge
Profound
We provide legal and regulatory solutions to virtuallyevery large law firm, significant government institutionand law school in the United States and to small andmedium-sized law firms and corporate in-house legal
professionals. Our information includes case law, statutes,administrative material, law reviews and treatises, lawyerprofiles, legal commentary, news, public records and legalforms, in electronic and print formats. Our NorthAmerican Legal businesses offered our customers theinformation they need from over 28,000 databases as ofDecember 31, 2005.
Our West business publishes cases, statutes and otherlegal information and enhances them with headnotes,synopses, key numbers and other editorial enhancementsprepared by our staff of lawyers and editorialprofessionals. These editorial enhancements facilitatemore productive research by our customers.
Westlaw is our primary online delivery platform. Westlawoffers numerous search features and navigation tools thatenable our customers to search relevant databases and toresearch points of law, build tables of authorities orsearch for other topically related commentary. Usingmywestlaw.com, our customers can customize Westlawby focusing on specific jurisdictions or practice areas. Ouroffering of mywestlaw.com, together with increased useof the Internet, has allowed us to further penetrate themarket for smaller and specialized law firms. We continueto enhance Westlaw Litigator, a service designed toassist attorneys in evaluating and investigating cases andpreparing for trial. Our acquisition of Global SecuritiesInformation (GSI)’s LIVEDGAR in 2005 enhanced ourability to provide corporate and transactional lawyerswith value-added services for preparing and completingcommercial transactions.
Carswell provides integrated knowledge and businesssolutions for the legal, finance and human resourcesmarkets in Canada. Online delivery to the legal market isprovided through eCarswell.
Thomson Elite offers a broad range of software thatassists law firms and government agencies of all sizes withfront and back office management functions, includingdocument management, case management, general ledgeraccounting, timekeeping, billing and records management.We have integrated Thomson Elite with our ProLaw andWest km businesses to offer a broad legal software suiteof products. While our software customers are primarilybased in the United States, Thomson Elite is currentlyexpanding internationally.
THOMSON LEGAL & REGULATORY
Legal information-based productsand services
Law firm management software
Strategic consulting advisoryservices
Web-based legal directory,website creation and hostingservices and law firm marketingsolutions
Textbooks, study aids, bar reviewcourses, continuing educationmaterials and seminars
Online collection of databases andtools to support news, brokerresearch and market research

25The Thomson Corporation 2006 Investor Fact Book
Segment Detail
THOMSON LEGAL & REGULATORY
Featured Solution
WESTLAWLITIGATOR
Westlaw for Litigators is aworkflow-centric productthat combines relevant case-law research with practicaltools for case evaluation,pre-trial investigation,settlement negotiation, andtrial preparation andpresentation. It gives thelitigation attorney a fullrange of research includingprofessional profiles, juryverdicts, public records,forms and more. WestlawLitigator has grown to over$77 million in revenue in2005 since its marketintroduction in 2003.
Our FindLaw business offers client development servicesin the United States that include legal directories, websitedevelopment, marketing solutions, legal news, a legalcareer center and other legal resources. FindLaw chargeslaw firms a fee to be included in its online legaldirectories but users may search its legal directories andother products and services free of charge. FindLawprovided website design and hosting services to morethan 6,500 law firms in 2005.
Hildebrandt International is a leading provider ofstrategic consulting advisory services to the legalindustry. Hildebrandt provides strategic advice to lawfirms, corporate law departments and government lawdepartments throughout the world.
Our West Education Group is a leading provider ofeducational solutions to legal professionals and lawstudents in the United States. Through BAR/BRI, weprovide bar examination review courses and materials.We also have a legal textbook publishing business withover 1,600 titles in 2005, making us a leading provider ofcasebooks and other learning materials to law students inthe United States. Our West LegalEdcenter providesonline continuing legal education materials and offers oneof the largest selections of video and audio continuinglegal education programs on the Internet, includingapproximately 19,000 hours of U.S.-accredited content asof December 31, 2005.

Segment Detail
26 The Thomson Corporation 2006 Investor Fact Book
Thomson Tax and Accounting
We provide tax and accounting professionals withregulatory information, software, services, tools andapplications to assist them in their daily work. We are oneof the leading online suppliers of this type of informationin the United States. The following provides informationabout our major tax and accounting brands.
Major Brands Principal Products and Services
RIA
Quickfinder
Checkpoint
PPC
Creative Solutions
InSource
GoSystem
Fast-Tax
UltraTax
Tax Partners
Our tax and accounting information is available in bothprint and electronic formats. Our online tax product,Checkpoint, provides our customers with increased speedof service and the flexibility to link to a broad collectionof databases. We continue to add new content andembedded tools in this area.
Through Creative Solutions, we offer software productsthat perform payroll, write-up, bookkeeping, audit andpractice management functions and enable our customersto interact with their clients through the Internet. Inaddition, our UltraTax software assists our customers inthe preparation of tax returns and enables them to filetax returns electronically. Through our Fast-Tax business,we provide our customers with a specialized range ofproducts for managing trust accounting, from taxpreparation software to complete tax preparationservices. In 2005, we acquired Tax Partners to providesales and use tax outsourcing services. Our tax andaccounting business is currently focused on developingintegrated research and workflow solutions utilizing
products from our software business and our informationbusinesses to create a broader offering to tax andaccounting professionals.
While our tax and accounting customers are primarily inthe United States, we also sell our products internationallyon a limited basis through our RIA business and otherThomson companies.
TLR International
Through TLR International, we provide services to anumber of markets primarily outside of North America.The following provides information about TLRInternational’s major brands.
Major Brands Principal Products and Services
Westlaw (1)
Sweet & Maxwell (U.K., Asia)
ELLIS (The Netherlands)
Aranzadi (Spain)
Civitas (Spain)
Karnov (Denmark and Sweden)
Lawbook (Australia)
Brookers (New Zealand)
La Ley (Argentina)
Sintese (Brazil)
Lawtel (U.K.)
Consult GEE (U.K.)
Compu-Mark (Europe)
Brandy (Japan)
O. Gracklauer (Germany)
Thomson & Thomson
(1) United Kingdom, Australia, Canada, Denmark, Hong Kong, Spain and Sweden.
THOMSON LEGAL & REGULATORY
Legal information-basedproducts and services
Trademark search andprotection information services
Tax and accounting information-based products and services
Tax and accounting software andservices

27The Thomson Corporation 2006 Investor Fact Book
Segment Detail
TLR International operates legal information businessesin Argentina, Australia, Brazil, Canada, Denmark, France,Hong Kong, Ireland, the Netherlands, New Zealand, Spain,Sweden and the United Kingdom through local operations.Through these businesses, we provide a range of primarymaterials, such as case law and statutes, and secondarymaterials, including treatises and legal commentaryspecific to the countries in which we operate.
Westlaw UK offers a combination of legal informationfrom the United Kingdom and the European Union thatwe derive from our legal publishing businesses in thosejurisdictions, together with information licensed fromthird parties. We also operate Lawtel, the leading U.K.online current awareness and legal information service.As a result of the continued growth of Westlaw andLawtel, 99 of the largest 100 U.K. law firms subscribed toour online services in 2005.
In addition, we offer country-specific online legal servicesin Argentina, Australia, Denmark, Hong Kong, Spain,Sweden and the United Kingdom. In each case, we offerlocal content, owned or licensed by our operations in thatregion, supplemented with relevant information fromother regions of the world, such as our databases ofEuropean Council directives maintained by our ELLISbusiness unit.
In addition to launching customized online legal servicesin various countries, we also provide a basic Westlawservice, known as Westlaw International. ThroughWestlaw International, we are able to offer our currentonline products and services to customers in marketswhere we may not have an existing publishing presenceor have not yet developed a fully customized Westlawservice. As of December 31, 2005, we provided WestlawInternational in 42 countries.
Through Thomson Compu-Mark, we operate varioustrademark-related businesses – Compu-Mark, Brandy, O.Gracklauer and Thomson & Thomson. Through thesebusinesses, we maintain databases containing all currenttrademark registrations in the United States, Australia,Canada, Japan, Malaysia, Mexico, Singapore, South Koreaand most European countries. We also offer a wide rangeof products and services that cover all aspects ofdeveloping and protecting trademarks, including enablingcustomers to screen them, determine their availability,protect them from infringement and search domain names.
Competition
Our primary global competitors in the legal andregulatory information market are Reed Elsevier (whichoperates Lexis-Nexis) and Wolters Kluwer NV with whichwe compete in the United States and in most of the othercountries in which we operate. Our major competitorscontinued to pursue acquisitions in 2005, primarily inNorth America and Europe. We also compete with otherdomestic competitors in the United States and in ourinternational markets for legal and regulatoryinformation, practice management and tax software andclient development services.
In the business information and news market, wecompete with other business information and newsaggregators, such as Factiva (a joint venture betweenReuters Group PLC and Dow Jones) and Nexis.
THOMSON LEGAL & REGULATORY

Segment Detail
28 The Thomson Corporation 2006 Investor Fact Book
Thomson Learning provide tailored learning solutions for colleges,universities, professors, students, libraries, reference centers,government agencies, corporations and professionals around theworld. We deliver these solutions through specialized content,applications and services that foster academic excellence,professional development and measurable competitive advantage.While printed materials continue to be the most widely usedlearning resource, instructors and students are increasinglyseeking electronic resources from us. Thomson Learning is madeup of complementary, yet diverse businesses that provide theproducts and services that our customers need for learning.
THOMSON LEARNING

29The Thomson Corporation 2006 Investor Fact Book
Segment Detail
Structure
Thomson Learning divides its businesses into:
• Academic publishing and reference; and
• Lifelong learning and international.
Financial Metrics
In 2005 Thomson Learning generated revenues ofapproximately $2.2 billion. The following charts provideadditional information regarding Thomson Learning’srevenues in 2005.
THOMSON LEARNING
35%Electronic, software & services
65%Print
84%North America
16%International
23%Recurring/Subscription-based
77%Others
Revenue by Geography
Revenue by Media
Revenue by Type
15.0%15.3%
17.2%15.6% 15.6%
1,6641,891 1,911
2,030 2,177
2001 2002 2003 2004 2005
Revenuein millions of US dollars
Segment Operating Profit Margin
2001 2002 2003 2004 2005
7%Corporate e-Learning
19%International HigherEducation
16%Global Library Reference
44%DomesticHigherEducation
14%e-Testing

Segment Detail
30 The Thomson Corporation 2006 Investor Fact Book
Products and Services
Academic Publishing and Reference
We provide textbooks, study guides and teaching guidesin print and electronic formats for use in colleges,universities, technical and vocational schools, tradeschools and trade associations, and for use by professors,students and professionals. In addition, we offerelectronic, print and microfilm reference materials forlibraries, reference centers, schools, colleges, universitiesand corporations. The following table providesinformation about our major academic publishing andreference brands.
Major Brands Principal Products and Services
Thomson Wadsworth
Thomson South-Western
Thomson Brooks/Cole
Thomson Course Technology
Thomson Delmar Learning
Thomson Gale
While our academic publishing and reference businessderives a majority of its revenues from print materials atthis time, we have been increasingly accelerating the shift todigital and hybrid solutions. In creating customized digitalsolutions, we work closely with our customers to ensurethat our solutions meet their needs and integrate into theirworkflows. For example, we supplement a number of ourmajor textbooks with electronic teaching aids, such as onlineinteractive supplements and websites. We publish inselected disciplines that we believe offer the highest long-term growth and where we have or believe we can attainsubstantial market share, such as in the humanities, socialsciences, languages, science, mathematics, business andeconomics fields. We create proprietary reference material,aggregate periodical content and primary source researchinformation and integrate this information into a broadarray of sophisticated online reference libraries. We alsomaintain academic microfilm collections that we provide toour library customers.
We also offer textbooks, teaching guides, study guides andpractice tests to professionals who are seeking to maintainor upgrade their credentials and to professors and studentsin degree-granting technical and vocational schools. Wecreate our offerings for a wide variety of disciplines,including administration, automotive, computer-assisteddrafting, cosmetology, education, electronics, fire rescue,healthcare, security, travel and other trades.
Lifelong Learning and International
We provide electronic and print-based learning,certification and testing solutions to corporations,government agencies, students and professionals. We alsooffer our information technology (IT) and business skillstraining products and services to corporate ITdepartments and corporate e-learning departments andgovernment agencies worldwide.
One of the strengths of our learning and testing businessis the breadth of our offerings. As of December 31, 2005,we maintained a repository of more than 85,000electronic learning objects, which are self-containedinstruction modules to teach specific skills (primarilyfocused on IT and business), and more than 3,500 e-training courses. These learning objects are used to createflexible and personalized training programs tailored to theneeds of students.
THOMSON LEARNING
Textbooks and electronic coursematerials in the humanities andsocial sciences
Textbooks and electronic coursematerials in business andeconomics
Textbooks and electronic coursematerials in mathematics andsciences
Textbooks and print andelectronic materials forinformation technologyinstruction
Textbooks and learningmaterials for technology, trade,healthcare, professional andcareer education
Print and electronic referencematerials, electronic databasesof magazine, newspaper andperiodical content, microfilmcollections and encyclopedias

31The Thomson Corporation 2006 Investor Fact Book
Segment Detail
The following table provides information about our majorlifelong learning and international brands.
Major Brands Principal Products and Services
Thomson Prometric
Thomson NETg
Thomson Heinle
Thomson Nelson (Canada/Australia)
Groupe Modulo (Canada)
Thomson Paraninfo (Spain/Portugal)
We offer comprehensive test creation, management anddelivery capabilities within the government andprofessional segments. In addition, we providecomprehensive training solutions for corporate andgovernment customers. In particular, we are creatingtraining solutions that are mandatory to maintainprofessional certifications and licenses and to complywith federal, state, and local government regulations. Weare also expanding our capabilities to develop customcourses to meet our clients’ specific business needs.
We also distribute our publishing, reference, e-learningand e-testing products internationally.
Competition
Our primary competitors in the higher educationpublishing market in the United States and internationallyinclude Pearson Education (a division of Pearson Plc), TheMcGraw-Hill Companies, Houghton Mifflin Company, JohnWiley & Sons, Inc. and Georg von Holtzbrinck GmbH.
In the global library print reference market, we primarilycompete with Océano Grupo Editorial and the Grolier unitof Scholastic Inc. In the global library electronic referencemarket, our principal competitors include ProQuestCompany and EBSCO Industries, Inc.
Our primary competitors include Pearson VUE (a divisionof Pearson Plc) in the global lifelong learning market,Promissor (also part of Pearson Plc) in the computer-based testing market and SkillSoft PLC, DigitalThink, Inc.,Element K LLC, and MindLeaders.com, Inc. in the highly-fragmented electronic and print-based training markets.
THOMSON LEARNING
Technology-based testdevelopment, delivery, andresults management
Online and instructor-ledinformation technology andbusiness skills training
Textbooks and electronic coursematerials for English, modernlanguages and English-languagetraining
Textbooks and electronic coursematerials for the school andhigher education markets
French language publisher ofinstructional materials for theCanadian primary andsecondary school markets
Spanish language highereducation textbooks in business,economics and vocationalsubjects

Segment Detail
32 The Thomson Corporation 2006 Investor Fact Book
Thomson Financial is a leading provider of integrated informationand technology applications to the global financial services industry.We offer a broad range of financial data and develop workflowsolutions and services to assist trading professionals, portfoliomanagers, investment bankers, stockbrokers, financial planners,corporate executives and treasury and investor relations professionals.
THOMSON FINANCIAL

33The Thomson Corporation 2006 Investor Fact Book
Segment Detail
Structure
Thomson Financial divides its core business into three groups:
• Corporate, Investment Banking & Investment Management;
• Equities, Fixed Income & Retail Wealth Management; and
• Omgeo.
Financial Metrics
In 2005 Thomson Financial generated revenues ofapproximately $1.9 billion. The following charts provideadditional information regarding Thomson Financial’srevenues in 2005.
THOMSON FINANCIAL
98%Electronic, software & services
2%Print
80%North America
20%International
77%Recurring/Subscription-based
23%Other
Revenue by Geography
Revenue by Media
Revenue by Type
14.4% 15.0% 15.1%16.9% 17.6%
1,704 1,622 1,5261,738
1,897
2001 2002 2003 2004 2005
2001 2002 2003 2004 2005
Revenuein millions of US dollars
Segment Operating Profit Margin
27%InvestmentManagement
11%Corporate
12%Fixed Income/TradeWeb
12%Investment Banking
25%Retail WealthManagement
6%Equity
7%Omgeo/Other

Segment Detail
34 The Thomson Corporation 2006 Investor Fact Book
Products and Services
Thomson Financial offers a variety of content, analyticalapplications and transaction platforms to financialprofessionals worldwide in the following segments:
• Investment management;
• Wealth management;
• Investment banking;
• Fixed income;
• Corporate management;
• Institutional equities;
• Equity research; and
• Private equity and consultants.
While we continue to sell many of our products andservices separately, our applications are also combinedunder the Thomson ONE brand to provide integratedworkflow solutions. Thomson ONE is a flexible openarchitecture framework that allows for easy integrationand delivery. This platform provides us with the flexibilityto customize our content offering to our customers. Ourcurrent Thomson ONE workflow solutions are designed tomeet the distinct needs of professional users in eachsegment that we serve.
In 2005, the number of Thomson ONE workstationsincreased 45% to 118,000 from 81,000 at the end of 2004as a result of user migration from legacy products and newclient wins. In 2005, we completed the rollout of over24,000 Thomson ONE workstations in approximately 550Merrill Lynch offices in the United States. In 2006, weplan to expand the capabilities of our Thomson ONEsolutions and achieve continued growth in Thomson ONEworkstations.
THOMSON FINANCIAL
Featured Solution
THOMSON ONEINVESTMENTMANAGEMENT
Thomson ONE InvestmentManagement gives buy-sideprofessionals a single,powerful, company-widesolution built around theportfolios managed by eachclient. This integrated solutioncombines real-time andhistorical information, newsand tools, tailored to meet theneeds of a client’s workflow.Thomson ONE InvestmentManagement addresses the fullrange of market and corporateinformation on a global basis.Start every day with a clearview of the market. Trackactivity with alerts and targeted news. Evaluatecompanies with research on fundamentals, ownership,filings and company guidance. Perform in-depth peeranalysis and track major economic indicators. Conduct
portfolio analysis, access performance attribution and understand your sources of risk. With Thomson ONEInvestment Management, all this and more is availablewith a single, integrated desktop.

35The Thomson Corporation 2006 Investor Fact Book
Segment Detail
THOMSON FINANCIAL
Corporate, Investment Banking & InvestmentManagement
Our Corporate, Investment Banking & InvestmentManagement group focuses on providing investmentbankers, private equity professionals, corporateexecutives, investor relations personnel and assetmanagers with integrated information solutions toassist them in analyzing markets and pursuing andcompleting transactions, including precedent analysis,company and market due diligence, financial analysisand modeling, preparation of presentation materials andsecurities offerings. Our products are offered both asdistinct modules as well as through a comprehensiveinformation solution.
The Corporate, Investment Banking & InvestmentManagement group provides online financial data andresearch on companies, industries and markets that allowour customers to develop and analyze financial forecasts,market share, competition, industry trends, economicclimates and key industry participants. We offer a rangeof customizable products and services that help ourcustomers work through each phase of the investmentprocess, including research and analysis, investmentdecisions and stock selection. We also offer institutionalsecurities ownership information that enables ourcustomers to analyze who may be buying, selling andholding securities as well as mergers and acquisitionstransaction data that our customers use to identifycomparable transactions, business opportunities andbusiness trends. In addition, our customers can accessnews, stock price information and SEC filings and analyzethis information with a set of comprehensive tools.
For corporations, we provide information solutionsprimarily to investor relations professionals and financialexecutives. We provide online access to financialinformation such as broker research, ownership and peeranalysis, news, stock quotes, institutional profiles andcontact data.
The following table provides information about our majorCorporate, Investment Banking and InvestmentManagement brands.
Major Brands Principal Products and Services
Thomson ONE Investment Banking
SDC Platinum
Investext
Global Access
Thomson Research
Thomson ONE Investment Management
Datastream
I/B/E/S
Baseline
StreetEvents
Thomson ONE Corporate
IR Channel
First Call Wire
Capital Markets Intelligence (CMI)
Analytical tools and databasesof brokerage research,transactional data, institutionalholdings data, current andhistorical earnings estimates,pricing information, SEC filingsand news
Security and portfolio analyticaltools as well as databases ofreal-time equity and fixedincome brokerage research,current and historical analystforecast estimates, investorpresentations, companyaccounts data, pricing data,global aggregated forecast dataat the country, sector andindustry levels, market indicesdata, institutional holdings data,SEC filings and news
Internet-based softwareapplications providing corporatenews and information, stocksurveillance services andoutbound communicationsservices
Market intelligence andanalytical services for marketvaluation analysis

Segment Detail
36 The Thomson Corporation 2006 Investor Fact Book
Electronic financialinformation, including real-timemarket data such as pricingdata, company information,news and analytics
Online marketplace for fixedincome securities
Back office data processingservices
Electronic database and real-time network for trade orderindications and trade executions
Equities, Fixed Income & Retail WealthManagement
Our Equities, Fixed Income & Retail Wealth Managementgroup focuses on providing wealth managers, brokers andequity and fixed income traders with integrated informationsolutions to assist them in managing client portfolios,analyzing securities and executing securities transactions.
We provide wealth managers with workflow solutionsthat combine market data, news and analysis, togetherwith sophisticated financial planning and portfolio andclient management tools. These workflow solutions aredesigned specifically to meet the needs of financialadvisors, brokers and sales support staff requiring real-time market data, news, charts and quotes.
TradeWeb is the leading online multi-dealer-to-customerinstitutional marketplace for fixed income securities andderivatives. As of December 31, 2005, its multi-dealerauction model linked the trading desks of 36 of theworld’s leading fixed income dealers with more than2,200 buy-side institutions in North America, Europe andAsia. By the end of 2005, TradeWeb was averagingapproximately $200 billion in daily trading volume.TradeWeb is also a leading electronic “straight-through-processing” (STP) network for fixed income markets,providing dealers and buy-side institutions with paperlesstrade allocations and confirmations.
BETA Systems allows brokerage firms to outsource themajority of their back office data processing activities,such as processing orders for securities and maintainingcustomer and firm accounts. Through BETA, ourcustomers are able to generate a range of customeraccount documents including monthly customerstatements, trade confirmations and real-time portfolios.BETA interfaces with major clearing services, depositoriesand exchanges to process orders for securities.
We also offer AutEx, which is a database and online real-time network for trade order indications and executionsfor listed and over-the-counter securities. Through AutEx,a broker/dealer is able to send a real-time indication ofinterest to buy or sell securities to portfolio managers.
The following table provides information about our majorEquities, Fixed Income & Retail Wealth Management brands.
Major Brands Principal Products and Services
Thomson ONE Wealth Management
Thomson ONE Equity Research
Thomson ONE Fixed Income
Global Topic
ILX
TradeWeb
BETA
AutEx
Omgeo
In 2001, we formed Omgeo, a partnership with TheDepository Trust & Clearing Corporation, to meet theexpanding information and processing needs of ourcustomers in the financial services industry resulting froma proposal to move from a three day (T+3) to a one dayglobal settlement cycle (T+1). While the T+1 initiative hasnot yet been implemented, Omgeo is able to provideclients with a managed transition to a new and moreefficient way of processing trades for straight-throughprocessing and increasing trade settlement capabilities.
THOMSON FINANCIAL

37The Thomson Corporation 2006 Investor Fact Book
Segment Detail
Competition
Thomson Financial faces competition in each of themarket segments in which it operates. ThomsonFinancial’s two major competitors are Bloomberg L.P. andReuters Group PLC, which compete in all of its marketsegments. Both Bloomberg and Reuters are principalcompetitors in fixed income, institutional equities andinvestment management, while Reuters is a principalcompetitor in investment banking.
Thomson Financial also competes with FactSet ResearchSystems Inc., Standard & Poor’s (a division of TheMcGraw-Hill Companies), SunGard Data Systems Inc. andMarketAxess Holdings Inc., plus a number of othersmaller firms, each of which focuses primarily on specificproduct and service areas within the various financialmarket segments.
THOMSON FINANCIAL

Segment Detail
38 The Thomson Corporation 2006 Investor Fact Book
Thomson Scientific & Healthcare is a leading provider ofinformation and services to researchers, physicians and otherprofessionals in the healthcare, academic, scientific, corporate andgovernment marketplaces.
Our scientific solutions assist scientists and other research-orientedprofessionals in all stages of the research and development (R&D)cycle from scientific discovery to product release.
Our healthcare solutions provide critical drug and clinicalinformation to physicians and other healthcare professionalsenabling them to improve the quality of care their patients receive.We also provide integrated decision support solutions that enablehealthcare managers and practitioners to more effectively managethe cost and quality of healthcare.
THOMSON SCIENTIFIC & HEALTHCARE

39The Thomson Corporation 2006 Investor Fact Book
Segment Detail
Structure
Thomson Scientific & Healthcare divides its core business into two groups:
• Scientific and
• Healthcare.
Financial Metrics
In 2005 Thomson Scientific & Healthcare generatedrevenues of approximately $0.9 billion. The followingcharts provide additional information regarding Thomson Scientific & Healthcare’s revenues in 2005.
THOMSON SCIENTIFIC & HEALTHCARE
86%Electronic, software & services
14%Print
81%North America
19%International
69%Recurring/Subscription-based
31%Other
Revenue by Geography
Revenue by Media
Revenue by Type
17.0% 18.4%20.2%
21.8%23.1%
689 696743
798921
2001 2002 2003 2004 2005
2001 2002 2003 2004 2005
Revenuein millions of US dollars
Segment Operating Profit Margin
24%PharmaR&D
14%Payers
12%Physicians/PDR
12%Providers
18%Corporate
Scientific Healthcare
20%Academic &Government

Segment Detail
40 The Thomson Corporation 2006 Investor Fact Book
Products and Services
Scientific
Our scientific business operates primarily in thesecondary publishing market. Secondary publishersenhance the value of primary publication information byabstracting, indexing and ranking the information so it ismore accessible to their customers. Our products andservices add further value by providing integratedworkflow solutions that enable access to, andmanagement of, the highest quality and most relevantpublished materials for researchers, informationspecialists and administrators in diverse fields.
Our scientific solutions are used by many of the leadingacademic institutions and research libraries around theworld. Additionally, many of the largest globalpharmaceutical, biotechnology, chemical, electronics andother high-technology companies also use our scientificinformation solutions to monitor competitors, developresearch and business strategies, and protect patentportfolios.
The following table provides information about our majorscientific brands.
Major Brands Principal Products and Services
ISI Web of Knowledge
Web of Science
Thomson Pharma
Liquent InSight
Delphion/MicroPatent PatentWeb
Derwent World Patents Index
Master Data Center
Dialog DataStar
THOMSON SCIENTIFIC & HEALTHCARE
Comprehensive and integrated platformthat includes the Web of Science as wellas third-party hosted content, editoriallyselected websites, and tools to access,analyze and manage research information
Comprehensive database for researchscientists and scholars providing asource for journal article-citedreferences and access to abstractedand indexed journals
Integrated web platform for thepharmaceutical and biotechnologyindustries that delivers scientificliterature, patents, commercial andregulatory information, company newscommunications, professional meetingreports and other relevant content
Global intellectual propertymanagement and regulatorycompliance software
Integrated platform solutions whichenable technical professionals to searchpatents, leverage unique productivitytools to analyze and track marketdevelopments and competitiveactivities, and view, download and printhigh-quality full-text patent images
Comprehensive database of patentabstracts
Intellectual property rights solutionthat processes patent annuity andtrademark renewal payments, andcomprehensive global patent andtrademarks regulations database
Online database of current and archivalscientific and business information

41The Thomson Corporation 2006 Investor Fact Book
Segment Detail
Within our academic and government division, the ISIWeb of Knowledge integrated platform offers a singlepoint of entry for scholarly researchers. This electronicservice extends our users’ access to research informationby offering an integrated collection of databasescovering over 22,000 peer-reviewed professionaljournals, leading scientific and patent informationdatabases, journal citation reports, meetings andconference proceedings, and evaluated scientificwebsites. Our advanced interface enables our customersto search a single database or multiple databasesconcurrently and links customers to full-text journalarticles provided by publishers while also allowing forthe seamless return to our service upon command. Thebibliographic references in our database currently coverthe period from 1900 to the present. Our databases andwebsites are also viewed as important distributionchannels by authors and publishers of journals.
Our Thomson Pharma solution provides extensive drug-specific information throughout their product lifecycles.Thomson Pharma integrates content from many of our keyproducts with information from other businesses acrossThomson. Through powerful search and analytical tools,Thomson Pharma enables our customers in the fields ofbiology, chemistry, licensing, business development andcompetitive intelligence to retrieve critical informationneeded to make informed decisions. Thomson Pharmasupplies information about the R&D portfolios of morethan 16,000 entities involved in drug development,information about therapeutic patents, including links tothe full text of the original patent, the pipeline status ofinvestigational drugs, searchable chemical structures,meeting reports, and bibliographic references.
Our Liquent InSight software enables our scientificcustomers to comply with complex rules and standardspromulgated by regulatory authorities in jurisdictionsaround the world. Liquent InSight software also providesour customers with the ability to create, review andamend regulatory-compliant filings and dossiers toaccelerate the regulatory approval process allowing themto bring their products to market faster. Liquent InSightalso keeps our customers current on internationalregulatory developments.
Thomson Scientific & Healthcare’s corporate business unitdevelops customized information solutions that can beseamlessly integrated into our customers’ dailyworkflows. Through the Derwent World Patents Index,we are one of the world’s leading providers of indexedpatent information and patent abstracts. We assess,classify, summarize and index patent documents from 38international patent-issuing authorities and our databasescover the period from 1963 to the present. Our integratedDelphion and MicroPatent PatentWeb solution providesbusiness and professional researchers with access to full-text international patent documents supported by search,retrieval, analysis and other workflow productivity tools.
THOMSON SCIENTIFIC & HEALTHCARE

Segment Detail
THOMSON SCIENTIFIC & HEALTHCARE
42 The Thomson Corporation 2006 Investor Fact Book
Featured Solution
THOMSON PHARMAThomson Pharma is a dynamic information solution forthe pharmaceutical and biotechnology industries. Itfeatures the best scientific, patent, and financialcontent offered by Thomson businesses. This premiumcontent has been enhanced with powerful search tools
and integrated into a single solution that professionalsworking with all stages of drug development canpersonalize to suit their needs. The key content areasinclude: drugs, intellectual property, literature and news,companies, targets, chemistry, and sequences.
Below gives a brief illustration of the integratedbenefits of Thomson Pharma as it relates to delvinginto the drug development cycle.
Access breaking newsfrom NewsEdge.
Access market sharedata that compares thedrugs to others in thesame therapeutic area.
Study reported andpredicted sales figures.Predictions are based onreports by major analystsat major investmentbanks and brokeragehouses, such as DeutscheBank.
View sales commentsfrom editorial experts.
Sales and market sharedata are available for thetop 600 launched drugsand 100 late-phaseinvestigational drugs.
Obtain information on thedrug’s progress, includingclinical and preclinicaldevelopments, regulatorymilestones, and drug-related collaborations.
View the FDA approvedindications list.
Jump to menu linking youto the content of thereport that is mostrelevant to your needs.
Link to a list of otherdrugs with the sametherapy areas, actions,and technologies.

Healthcare
Our healthcare business provides integrated informationsolutions and knowledge-based tools, often at the point ofcare, to physicians, pharmacists, nurses and other healthprofessionals. Our drug, clinical point of care solutions andpatient education resources enable clinicians to efficientlyaccess the reference resources they need to diagnoseconditions, make decisions during treatment and providepatients with pertinent information regarding theircondition. The demand for point of care information andcost and quality management solutions is driven by acombination of consumer demand for quality healthcare,cost pressures and heightened awareness of medical errors.
The following table provides information about our majorhealthcare brands.
Major Brands Key Products and Services
Micromedex(Healthcare Series)
PDR (Physicians’ Desk Reference)
Medstat (Advantage Suite)
Our Micromedex Healthcare Series represent a set ofcomprehensive databases of drug information, evidence-based acute and chronic disease information, poison andbiohazard information, clinical practice guidelines andprocedures, and patient education information, most ofwhich has been compiled over more than 25 years. Thedatabase has been developed from scientific and clinicalliterature by expert editors and from approved drug-labeling information and was utilized by more than 7,000facilities in over 70 countries during 2005.
The PDR (Physicians’ Desk Reference) product is a drugdatabase created in large part from Food and DrugAdministration approved drug-labeling information and isdistributed in a print directory format, on handheldelectronic devices and through the Internet.Pharmaceutical companies provide us with the drug-labeling information and list their products in thedirectory. Pharmaceutical companies also sponsor theannual delivery of the PDR to approximately 480,000practicing physicians in the United States and we selladditional copies of the directory to other healthcareprofessionals and consumers. Over 200,000 physicians areregistered users to PDR over the Internet and usage of ourhandheld wireless version of the PDR continues to grow.
Through Medstat, we provide decision support systems,market intelligence, benchmarking databases andresearch for managing the purchase, administration anddelivery of health services and benefits. We also developand provide products and methodologies for organizingand understanding the data. Our decision supportsolutions and research provide an extensive collection ofhealthcare information for corporate and governmentalhealthcare purchasers, the managed care and healthinsurance industry, hospitals and integrated deliverynetworks, the pharmaceutical industry and the healthservices research community. This information helps thesecustomers better manage the cost, quality and strategicpositioning of health services and benefits.
THOMSON SCIENTIFIC & HEALTHCARE
Comprehensive database setof drugs, disease information,medical emergency andpoison control procedures,patient education and otherrelevant clinical, toxicologicaland environmental health andsafety information
Database of FDA approveddrug monographs, delivered inprint and electronic format
Decision support productdesigned for managinghealthcare costs and quality
43The Thomson Corporation 2006 Investor Fact Book
Segment Detail

Segment Detail
44 The Thomson Corporation 2006 Investor Fact Book
Competition
Scientific
Our principal competitors in the scientific informationmarket include Reed Elsevier (Science), Wolters KluwerNV, CSA (formerly Cambridge Scientific Abstracts) andQuestel/Orbit, Inc.
Healthcare
Our principal competitors in the clinical and druginformation market are Reed Elsevier (Science), WoltersKluwer and First DataBank (a subsidiary of The HearstCorporation). The remainder of our competition is fromsmall, specialized providers of drug or clinical information.
Our competitors within the healthcare cost and qualitymanagement information markets include Ingenix (adivision of UnitedHealth Group, Inc.), McKesson HealthSolutions (a division of McKesson Corporation), WebMDInc., Solucient, LLC, Electronic Data SystemsCorporation (EDS) and ACS Healthcare Solutions (adivision of ACS, Inc.).
THOMSON SCIENTIFIC & HEALTHCARE

Corporate Information
Corporate Headquarters
Metro Center One Station Place Stamford, Connecticut 06902 United States
tel 203.539.8000
Stock Exchange Listings
Common shares (symbol: TOC): • Toronto Stock Exchange (TSX) • New York Stock Exchange (NYSE)
Series II preference shares (symbol: TOC.PR.B): • Toronto Stock Exchange (TSX)
2006 Financial Calendar
Year end: December 31 Quarterly results: announced on April 27 (Q1), July 27 (Q2) and October 26 (Q3).
Common Share Dividends
At the discretion of the directors. Paid on March 15/June 15/September 15/December 15 or on the firstbusiness day thereafter. Declared in U.S. dollars but can be paid in Canadian dollars or U.K. pounds sterling at the holder’s option.
Further information is available from the registrar.
Dividend Reinvestment Plan
Eligible common shareholders may elect to have cashdividends reinvested in common shares. Furtherinformation is available from the registrar.
Employees
As of December 31, 2005, we had approximately 40,500 employees.
Transfer Agent and Registrar
Computershare Trust Company of Canada 100 University Avenue, 9th Floor Toronto, Ontario M5J 2Y1 Canada
tel 1.800.564.6253 (United States, Canada) tel 514.982.7555 (outside North America)
www.computershare.com
Auditors
PricewaterhouseCoopers LLP
Suite 3000, Box 82 Royal Trust Tower Toronto-Dominion Centre Toronto, Ontario M5K 1G8 Canada
Further Information
Please visit www.thomson.com for corporate andmanagement news and more detailed information onindividual Thomson businesses, products and services.
For investor relations inquiries, call 1.800.969.9974 or e-mail [email protected].
GENERAL INFORMATION &CONTACTS
45 The Thomson Corporation 2006 Investor Fact Book

46 The Thomson Corporation 2006 Investor Fact Book
Corporate Information
Richard J. Harrington
President & Chief Executive Officer, The Thomson Corporation
Richard Benson-Armer
Senior Vice President & Corporate Chief Strategy Officer, The Thomson Corporation
Robert B. Bogart
Executive Vice President, Human Resources, The Thomson Corporation
Gustav Carlson
Senior Vice President, Corporate Communications, The Thomson Corporation
Robert C. Cullen
President & Chief Executive Officer, Thomson Scientific & Healthcare
Robert D. Daleo
Executive Vice President & Chief Financial Officer, The Thomson Corporation
Brian H. Hall
President & Chief Executive Officer, Thomson Legal & Regulatory
Sharon T. Rowlands
President & Chief Executive Officer, Thomson Financial
Ronald H. Schlosser
President & Chief Executive Officer, Thomson Learning
David H. Shaffer
Executive Vice President, The Thomson Corporation
Deirdre Stanley
Senior Vice President & General Counsel, The Thomson Corporation
Michael Wilens
Executive Vice President & Corporate Chief Technology and Operations Officer, The Thomson Corporation
SENIOR MANAGEMENT

Corporate Information
David K.R. Thomson
Chairman, The Thomson Corporation; Deputy Chairman, The Woodbridge Company Limited Member of Finance Committee
W. Geoffrey Beattie
Deputy Chairman, The Thomson Corporation; President, The Woodbridge Company Limited Chairman of Finance Committee; Member of Corporate Governance and Human Resources Committees
Richard J. Harrington
President & Chief Executive Officer, The Thomson Corporation
Ron D. Barbaro
Corporate Director Member of Audit and Corporate Governance Committees
Mary Cirillo
Corporate Director Member of Corporate Governance Committee
Robert D. Daleo
Executive Vice President & Chief Financial Officer, The Thomson Corporation
Steven A. Denning
Managing Partner, General Atlantic, LLC Chairman of Human Resources Committee
V. Maureen Kempston Darkes
Group Vice President, General Motors Corporation & President, GM Latin America, Africa and Middle East Member of Corporate Governance and Human Resources Committees
Roger L. Martin
Dean of the Joseph L. Rotman School of Management, University of Toronto Member of Audit Committee
Vance K. Opperman
President & Chief Executive Officer, Key Investment, Inc. Chairman of Audit Committee
John M. Thompson
Chairman of the Board, The Toronto-Dominion Bank Chairman of Corporate Governance Committee; Member of Audit Committee
Peter J. Thomson
Deputy Chairman, The Woodbridge Company Limited
Richard M. Thomson
Retired Chairman & Chief Executive Officer, The Toronto-Dominion Bank Member of Audit and Human Resources Committees
John A. Tory
President, Thomson Investments Limited Member of Finance and Human Resources Committees
BOARD OF DIRECTORS
47The Thomson Corporation 2006 Investor Fact Book

48 The Thomson Corporation 2006 Investor Fact Book
Corporate Information
Forward-Looking Statements
This Investor Fact Book contains forward-lookingstatements, including statements about the outlook andprospects for Thomson and its segments. Forward-lookingstatements are those which are not historical facts. Theseand other statements that relate to future results andevents are based on Thomson’s current expectations. Ouractual results in future periods may differ materially fromthose currently expected because of a number of risksand uncertainties. The risks and uncertainties that webelieve are material are outlined in the “Risk Factors”section of our annual information form (AIF), which wasfiled with the Canadian securities regulatory authoritiesand is also part of our Form 40-F for the year endedDecember 31, 2005 filed with the SEC. A copy of our AIFand Form 40-F are available at www.thomson.com. Pleaseconsult either of these documents for a more completeunderstanding of these risks and uncertainties. Wedisclaim any intention or obligation to update or reviseany forward-looking statements, whether as a result ofnew information, future events or otherwise.
Non-GAAP Financial Measures
The Investor Fact Book contains disclosures of certainnon-GAAP financial measures. Please see the appendixsection of this document for a reconciliation of each ofthese measures to the most directly comparable GAAPfinancial measure.
FORWARD-LOOKING STATEMENTS AND NON-GAAP FINANCIAL MEASURES

49The Thomson Corporation 2006 Investor Fact Book
Appendix
Segment Operating Profit to Operating Profit
Year ended December 31
Legal & Scientific & CorporateAmounts in millions of U.S. Dollars Regulatory Learning Financial Healthcare and other Total
2001Segment operating profit 712 250 246 177 (75) 1,250
Less: Amortization (175) (99) (107) (34) - (415)
Restructuring charges (7) - (20) (3) - (30)
Operating profit 530 151 119 80 (75) 805
2002Segment operating profit 788 289 244 128 (70) 1,329
Less: Amortization (81) (93) (65) (23) - (262)
Restructuring charges (4) - - - - (4)
Operating profit 695 196 179 105 (70) 1,113
2003 Segment operating profit 816 329 230 150 (97) 1,428
Less: Amortization (97) (67) (64) (28) - (256)
Operating profit 719 262 166 122 (97) 1,172
2004 Segment operating profit 902 316 294 174 (98) 1,588
Less: Amortization (97) (58) (82) (31) - (268)
Operating profit 805 258 212 143 (98) 1,320
2005 Segment operating profit 986 339 334 213 (128) 1,744 Less: Amortization (104) (59) (89) (45) - (297)Operating profit 882 280 245 168 (128) 1,447
Segment Operating Profit Margin to Operating Profit Margin
For the year ended December 31
Legal & Scientific & Regulatory Learning Financial Healthcare Total
2001 Segment operating profit 27.0% 15.0% 14.4% 17.0% 18.7%
Less: Amortization -6.6% -5.9% -6.3% -4.9% -6.2%
Restructuring charges -0.3% 0.0% -1.2% -0.5% -0.4%
Operating profit 20.1% 9.1% 6.9% 11.6% 12.1%
2002 Segment operating profit 28.4% 15.3% 15.0% 18.4% 19.8%
Less: Amortization -2.9% -4.9% -4.0% -3.3% -3.8%
Restructuring charges -0.1% 0.0% 0.0% 0.0% 0.0%
Operating profit 25.4% 10.4% 11.0% 15.1% 16.0%
2003 Segment operating profit 27.6% 17.2% 15.1% 20.2% 20.1%
Less: Amortization -3.3% -3.5% -4.2% -3.8% -3.6%
Operating profit 24.3% 13.7% 10.9% 16.4% 16.5%
2004 Segment operating profit 28.1% 15.6% 16.9% 21.8% 20.5%
Less: Amortization -3.0% -2.9% -4.7% -3.9% -3.5%
Operating profit 25.1% 12.7% 12.2% 17.9% 17.0%
2005 Segment operating profit 28.9% 15.6% 17.6% 23.1% 20.8%Less: Amortization -3.0% -2.7% -4.7% -4.9% -3.6%Operating profit 25.9% 12.9% 12.9% 18.2% 17.2%
RECONCILIATIONS

Appendix
50 The Thomson Corporation 2006 Investor Fact Book
RECONCILIATIONS
Adjusted EBITDAAmounts in millions of U.S. Dollars 2001 2002 2003 2004 2005
Adjusted EBITDA - Thomson Legal & Regulatory 849 940 989 1,097 1,185Adjusted EBITDA - Thomson Learning 387 448 508 502 525Adjusted EBITDA - Thomson Financial 400 413 406 476 511Adjusted EBITDA - Thomson Scientific & Healthcare 148 156 183 206 247Corporate & Other (75) (57) (83) (86) (118)Thomson Adjusted EBITDA 1,709 1,900 2,003 2,195 2,350Less: Depreciation (459) (521) (575) (607) (606)Less: Amortization (415) (262) (256) (268) (297)Less: Restructuring costs and Year 2000 costs (30) (4) - - -
Other income/expense 252 (135) 61 24 (28)Net interest expense and other financing costs (236) (291) (252) (235) (223)Income taxes (159) (154) (123) (255) (277)Earnings from continuing operations 662 533 858 854 919Earnings from discontinued operations, net of tax 106 71 28 157 15Net earnings 768 604 886 1,011 934
Adjusted EBITDA Margin2001 2002 2003 2004 2005
The Thomson Corporation 25.6% 27.3% 28.2% 28.3% 28.0%
Reconciliation of Net Debt Amounts in millions of U.S. Dollars 2001 2002 2003 2004 2005
Short-term indebtedness 620 316 87 7 202Current portion of long-term debt 473 318 484 295 98Long-term debt 3,651 3,487 3,684 4,013 3,983Total debt 4,744 4,121 4,255 4,315 4,283Less: Swaps 238 161 (199) (192) (193)Total debt after swaps 4,982 4,282 4,056 4,123 4,090Less: cash (532) (709) (683) (405) (407)Net debt 4,450 3,573 3,373 3,718 3,683EBITDA 1,769 1,900 2,003 2,195 2,350Net Debt / EBITDA 2.6 1.9 1.7 1.7 1.6
Adjusted Earnings per Share Amounts in millions of U.S. Dollars, except per common share amounts 2001 2002 2003 2004 2005
Earnings attributable to common shares 741 585 877 1,008 930Less: Earnings from discontinued operations (106) (71) (28) (157) (15)Adjust: one-time items, net of tax, resulting from other (income)
expense, restructuring charges, redemption of pref shares, one-time tax benefits, withholding tax on dividends, normalization of tax rate & remove release of tax credits (206) 39 (151) (55) 17
Proportionate share of goodwill impairment recognized by BGM - 67 - - -
Effect of new accounting standard* 188 - - - -
Adjusted earnings from continuing operations 617 620 698 796 932Adjusted basic and diluted earnings per common share from continuing operations $0.98 $0.97 $1.07 $1.21 $1.42
* Under CICA Handbook Section 3062, goodwill and identifiable intangible assets with indefinite useful lives are no longer amortized beginning in 2002. This adjustmentremoves the amortization related to these assets in prior periods.

51The Thomson Corporation 2006 Investor Fact Book
Appendix
Return on Invested Capital 2000 2001 2002 2003 2004 2005
Calculation of Adjusted Operating Profit After TaxesOperating Profit 811 1,121 1,184 1,331 1,447
Add:
Amortization 419 263 257 269 297
Restructuring & Y2K costs 30 4 - - -
Operating profit of discontinued operations 38 111 80 61 37
Adjusted Operating Profit – including discontinued operations 1,298 1,499 1,521 1,661 1,781
Cash taxes paid (continuing operations) (69) (149) (237) (285) (326)
Post-tax adjusted operating profit 1,229 1,350 1,284 1,376 1,455
Calculation of Adjusted Invested CapitalEquity 7,813 8,209 8,961 9,193 9,962 9,963
Total debt 2,862 4,744 4,121 4,255 4,315 4,283
Invested capital 10,675 12,953 13,082 13,448 14,277 14,246
Adjustments:
Cash and other Investments 1 (345) (562) (724) (696) (420) (423)
Debt swaps 2 197 238 161 (199) (192) (193)
Current and long-term defered taxes 1 1,284 1,439 1,413 1,427 1,360 1,310
Accumulated amortization and non-cash goodwill 3 266 623 990 1,336 1,586 1,885
Present value of operating leases 4 639 747 819 879 832 745
Historical intangible asset write-downs 5 - 62 336 248 147 162
Remove net assets of Thomson Newspaper business (115) - - - - -
Other 1 1,083 1,012 1,151 1,072 1,125 821
Adjusted invested capital 13,684 16,512 17,228 17,515 18,715 18,553
Average Invested Capital 15,098 16,870 17,372 18,115 18,634
Return on Invested Capital 8.1% 8.0% 7.4% 7.6% 7.8%
Notes:
1 Items excluded as not deemed components of invested capital; "Other" primarily consists of non-current liabilities.
2 Exclude debt swaps as balances are financing rather than operating related.
3 Exclude accumulated amortization as only gross identifiable intangible assets and goodwill cost is considered component of invested capital. Exclude goodwill arising from adoption of CICA 3465. This goodwill was created via deferred tax liability instead of cash purchase price.
4 Present value of operating leases deemed component of invested capital.
5 Add back writedowns that were not cash transactions
Prior period balance sheet amounts not restated for discontinued operations as calculation of ROIC includes businesses held for sale until disposal date.
RECONCILIATIONS

The Thomson Corporation
Investor Relations
Metro CenterOne Station PlaceStamford, CT 06902
Tel: [email protected]

![Investor Presentation March 2021 [Fact Book 2020]](https://static.fdocuments.us/doc/165x107/617f368323695b358e7526ef/investor-presentation-march-2021-fact-book-2020.jpg)