UNESCO STRATEGY FOR (2016-2021) · PDF fileUNESCO Strategy for TVET ... Ensure relevant skills...
47
UNESCO S TRATEGY FOR TVET (2016 - 2021) United Nations Educational, Scientific and Cultural Organization
Transcript of UNESCO STRATEGY FOR (2016-2021) · PDF fileUNESCO Strategy for TVET ... Ensure relevant skills...

UNESCO STRATEGY FOR TVET (2016-2021)
United Nations Educational, Scientific and
Cultural Organization
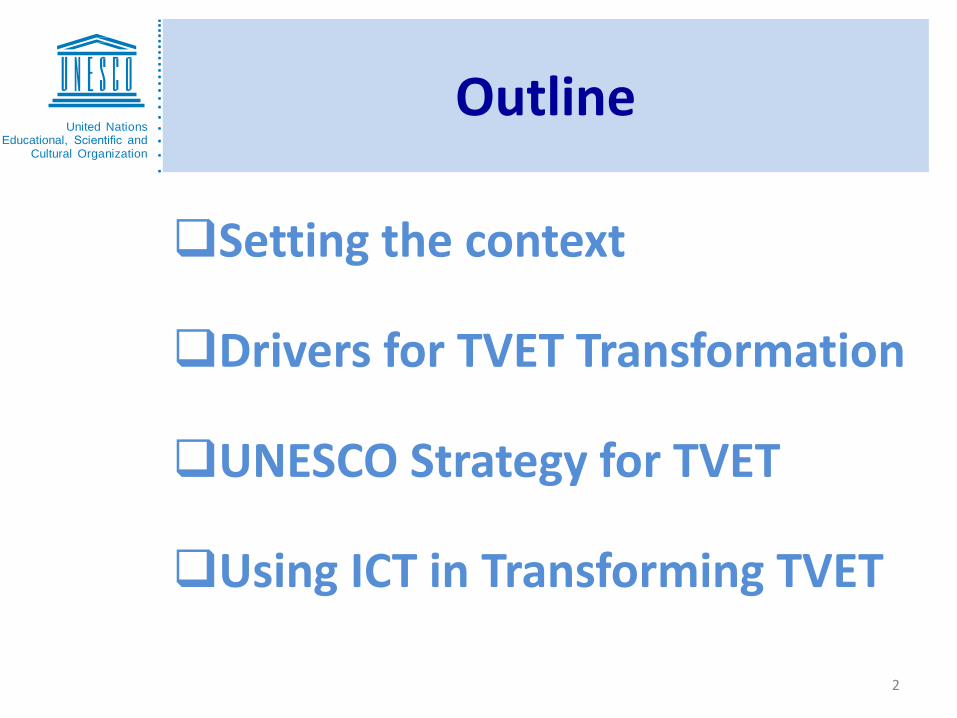
Setting the context
Drivers for TVET Transformation
UNESCO Strategy for TVET
Using ICT in Transforming TVET
2
Outline
United Nations Educational, Scientific and
Cultural Organization

3
I. SETTING THE CONTEXT
United Nations Educational, Scientific and
Cultural Organization

4
2016 – 2030New Goals for Development
United Nations Educational, Scientific and
Cultural Organization

5
2016-2030Education is foundational to the SDGS
United Nations Educational, Scientific and
Cultural Organization
Presenter
Presentation Notes
Education is foundational to all of our sustainable development goals.

Ensure inclusive and equitable quality education and promote lifelong learning opportunities for all.
6
A New Agenda for Education
United Nations Educational, Scientific and
Cultural Organization

Free and equitable primary and secondary education of good qualityUniversal pre-primary educationEnsure relevant skills for employmentUniversal literacy and numeracyMore qualified teachersMake higher education more accessible
7
United Nations Educational, Scientific and
Cultural Organization
Presenter
Presentation Notes
Highlights of SDG4

Three identified targets:Access Labour market outcomes Equity and gender TVET contributes to other SDGs including:SDG3 (health workforce)SDG8 (inclusive growth and decent work), SDG9 (infrastructure),SDG13 (climate).
SDG4/Education 2030: TVET atCentre Stage
8
United Nations Educational, Scientific and
Cultural Organization

Expenditure on secondary and post-secondary non-tertiary vocational as % of govt. total expenditure on education
2013Kazakhstan 4.36
Government expenditure on education as % of GDP (%)
% yearKazakhstan 3.06 2009Kyrgyzstan 6.78 2013Mongolia 4.6 2011Tajikistan 4 2012Turkmenistan 3.05 2012Uzbekistan - -
Source: (UNESCO-UIS, 2016)
Education expenditure:Lower than recommended
9
United Nations Educational, Scientific and
Cultural Organization

ICT, particularly mobile technology, holds great promise for accelerating progress…
10
A New Framework for Action
United Nations Educational, Scientific and
Cultural Organization
Presenter
Presentation Notes
The Education 2030 Framework for Action outlines how to translate SDG4 and the more elaborated Incheon Declaration into practice at the country, regional and global level and provides guidance for implementing Education 2030.
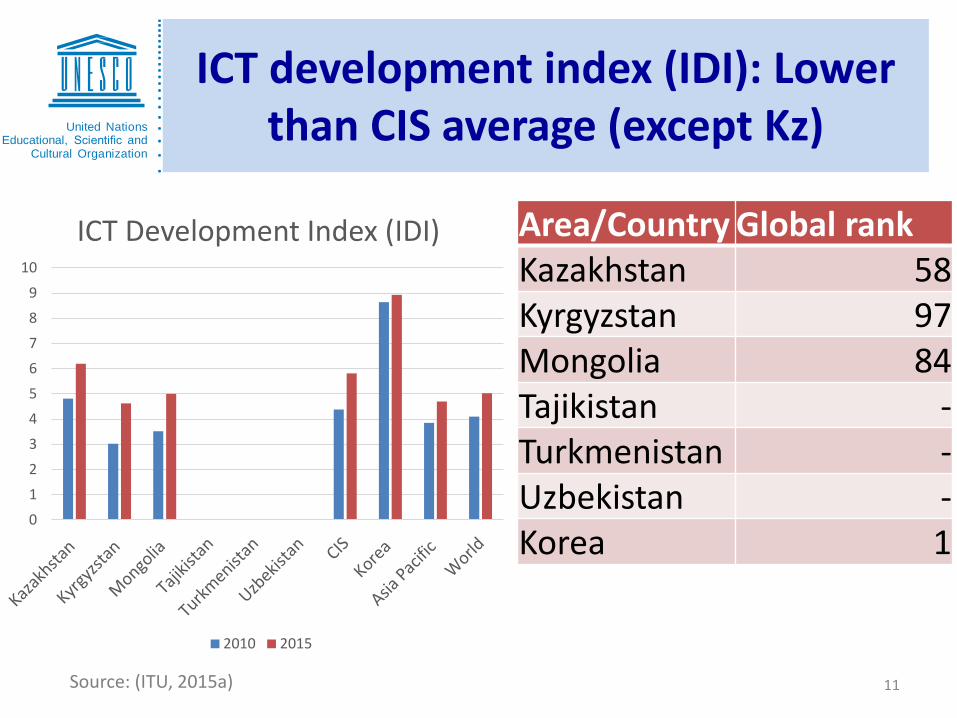
Area/Country Global rankKazakhstan 58Kyrgyzstan 97Mongolia 84Tajikistan -Turkmenistan -Uzbekistan -Korea 1
01
2
345
6789
10
ICT Development Index (IDI)
2010 2015
Source: (ITU, 2015a)
ICT development index (IDI): Lower than CIS average (except Kz)
11
United Nations Educational, Scientific and
Cultural Organization
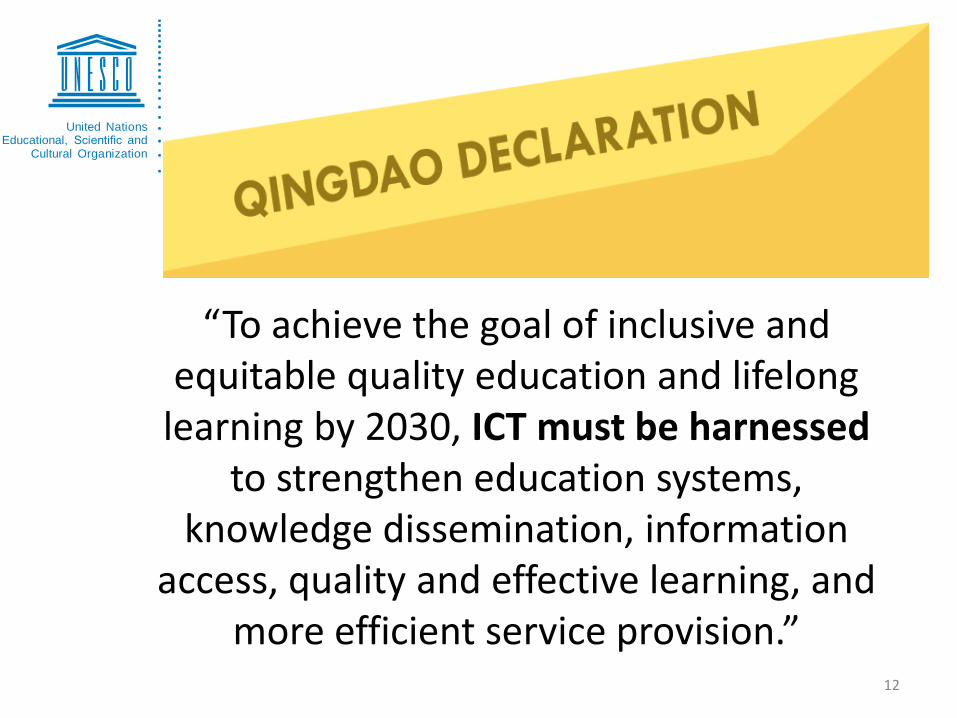
“To achieve the goal of inclusive and equitable quality education and lifelong
learning by 2030, ICT must be harnessed to strengthen education systems,
knowledge dissemination, information access, quality and effective learning, and
more efficient service provision.”12
United Nations Educational, Scientific and
Cultural Organization
13
United Nations Educational, Scientific and
Cultural Organization
Presenter
Presentation Notes
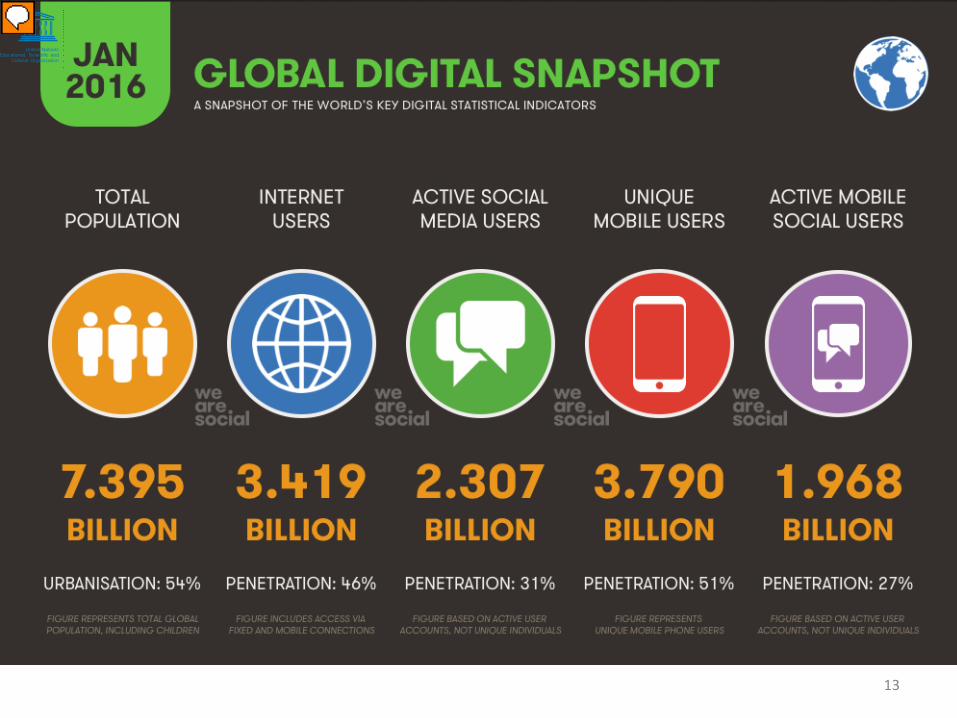
About half of people on Earth have a working and connected mobile device. Mobile phones and mobile networks now reach places where education is scarce or of very low quality. Increasingly, mobile learning provides us a means to reach the unreached.

14
United Nations Educational, Scientific and
Cultural Organization
Presenter
Presentation Notes
Developing countries are seeing the fastest growth. The Asia Pacific saw half a million people use the internet for the fist time every single day in the past twelve months – that’s six new users every second.

Country/Area
Population size* (000) (2015)
Area of Country** (000 km2) (2013)
Population density** (people per km2) (2013)
Youth population* (15-24) (%) (2015)
Rural population* (%) (2015)
Life Expectancy** (years) (2013)
GNI per capita* (current USD) (2014)
Kazakhstan 17625 2724.9 6.3 15 46.8 70 11670
Kyrgyzstan 5940 199.9 29.8 18.3 64.3 70 1250
Mongolia 2959 1564.1 1.8 16.9 28 68 4280
Tajikistan 8482 142.6 58.6 20.2 73.2 67 1080
Turkmenistan 5374 488.1 11.2 19 50 65 8020
Uzbekistan 29893 447.4 71.1 18.8 63.6 68 2090
North and Central Asia 227542 13.2 37.9 10210
Asia Pacific 4414276 16 52 6331
Source: *(UNESCAP, 2015); **(World Bank, 2015)
Population and development indicators:Significant youth and rural population
15
United Nations Educational, Scientific and
Cultural Organization
Presenter
Presentation Notes
Central Asia has a “youth bulge” and may face challenges educating youth and providing jobs.

Area/Country Mobile-cellular subscriptionsper 100 inhabitants (2014)*
Active mobile-broadband subscriptionsper 100 inhabitants (2013)*
Fixed-broadband subscriptionsper 100 inhabitants (2014)*
Percentage of individuals using the Internet (2014)*
Percentage of households with Internet access (2014)*
Computer-pupil ratio**
Proportion of schools with Internet access (%)**
Kazakhstan 168.62 56.6 12.93 54.89 49.4 18 97Kyrgyzstan 134.46 22.7 4.16 28.30 7.2 57 6Mongolia 105.06 18.2 6.85 27.00 21.0 18 91Tajikistan 95.13 - 0.07 17.49 - - -Turkmenistan 135.78 - 0.04 12.20 - - -Uzbekistan 73.79 20.3 1.33 43.55 - - -Asia Pacific 90.6 29.7 8.3 33.8 36.3 - -World 96.1 37.2 10.3 40.6 43.9 - -
Source: *(ITU, 2015a); **(UNESCO-UIS, 2014)
ICT Infrastructure Status
16
United Nations Educational, Scientific and
Cultural Organization

Source: (ITU, 2015b)
Internet Penetration: Lower Than Average of Developed Countries
17
United Nations Educational, Scientific and
Cultural Organization

18
United Nations Educational, Scientific and
Cultural Organization
Presenter
Presentation Notes
Phenomenal growth of mobile data traffic. This white paper has good and up to data facts to complement this slide: http://www.cisco.com/c/en/us/solutions/collateral/service-provider/visual-networking-index-vni/mobile-white-paper-c11-520862.html Here are some highlights from just the past year: -Global mobile data traffic grew 74 percent in 2015. (This figure is impressive, but if we expand our time horizon to the past ten years mobile data traffic has grown 4,000-fold; and if we look back 15 years the growth has been 400-million-fold.) -More than half a billion (563 million) mobile devices and connections were added in 2015 and smartphones accounted for most of that growth. -Mobile network (cellular) connection speeds grew 20 percent in 2015. -Average smartphone usage grew 43 percent in 2015. -Smartphones (including phablets) represented only 43 percent of total global handsets in use in 2015, but represented 97 percent of total global handset traffic.

19
United Nations Educational, Scientific and
Cultural Organization
Presenter
Presentation Notes
People in poor countries are more likely to access the internet via mobile devices than people in wealthy countries. (This is not always a choice per say; in poor countries a mobile device is the only available portal to the internet.) The countries with the highest share of mobile internet traffic are often the poorest as is illustrated by the red circles.

20
Proven Capacity to Help the Poor
United Nations Educational, Scientific and
Cultural Organization
Presenter
Presentation Notes
Year by year, mobile technology is establishing itself as a tool to assist underprivileged people and bring new opportunities to people and communities with too few. This is picture taken in Kiberia, the second largest slum in Africa and home to approximately 200,000 people, many of them living largely without electricity or other basic resources. YET they use mobile money… in fact they use mobile money more than many people in rich communities in Europe or America. Over 15 million users in Kenya 40,000 M-PESA agents Used to pay everything from electricity bills to school fees via a simple text-based menu that is accessible on even the most basic mobile phone. Median transaction amount is about 1USD Profitable because of transaction fees assessed when customers withdraw or transfer cash using the system. We want to ensure mobile technology opens similar lifelines when it comes to learning and education.

21
Data Revolution Implications
United Nations Educational, Scientific and
Cultural Organization

22
The Digital Economy and Society Index (DESI) is a compositeindex that summarises relevant indicators on Europe’s digitalperformance and tracks the evolution of EU Member States indigital competitiveness.
1 Connectivity Fixed Broadband, Mobile Broadband, Broadband speed, and Affordability
2 Human Capital Basic Skills and Usage, Advanced skills and Development
3 Use of Internet Content, Communication and Transactions on line
4 Integration of Digital Technology
Business digitization and eCommerce
5 Digital Public Services eGovernment and eHealth
The five dimensions of the DESI
00.10.20.30.40.50.60.70.8
1 Connectivity 2 Human Capital 5 Digital Public Services 3 Use of Internet 4 Integration of Digital TechnologyDigital Economy and Society Index (DESI), June 2015
Source: European Commission, Digital Agenda Scoreboard
United Nations Educational, Scientific and
Cultural Organization
II. DRIVERS FOR TVET TRANSFORMATION
23
United Nations Educational, Scientific and
Cultural Organization
Presenter
Presentation Notes
Just as mobile technology has transformed payment systems in Kenya and elsewhere, we want to ensure mobile technology opens similar new and expanded opportunities when it comes to learning and education.

Goal 1 Goal 2 Goal 3 Goal 4 Goal 5 Goal 6Early childhood care and education
Universal primary educaiton
Learning needs of all youth and adults
Improving levels of adult literacy
Gender parity in primary and secondary education
Educational quality EFA Development Index (EDI)
Area/Country
GER in pre-primary education (%) (2012)
Primary education ANER (%) (2012)
Youth literacy rate (%) (15-24) (2005-2012)
Adult literacy rate (%) (15 and over) (2005-2012)
GPI in primary (F/M) (2012)
GPI in secondary (F/M) (2012)
survival rate to last grade (%) (2011)
pupil/teacher ratio in primary grade (2012)
High EDI: (.96-1.00)
Kazakhstan 58 99 100 100 1.01 0.97 99 16 0.99
Kyrgyzstan 25 98 100 99 0.98 1 97 24 0.971
Mongolia 86 98 98 98 0.97 1.03 93 29 0.967
Tajikistan 9 99 100 100 0.98 0.9 98 23 0.98
Turkmenistan 100 100
Uzbekistan 25 91 100 99 0.97 0.98 98 16 0.982
Central Asia 33 95 100 100 0.99 0.98 98 16
World 54 91 89 84 0.97 0.97 75 24
Source: (UNESCO, 2015a)
EFA Goals Achievement: All high EDI (Congratulations!)
24
United Nations Educational, Scientific and
Cultural Organization
Presenter
Presentation Notes
all High EDI, have achieved or are close to EFA

Area/Country
Enrolment in secondary education (000) (2010)
Enorolment in TVET (000) (2010)
TVET as a share of secondary enrolment (%) (2010)
Kazakhstan 1680 113 6.73Kyrgyzstan 664 23 3.46Mongolia 276 28 10.14Tajikistan 1032 22 2.13TurkmenistanUzbekistan 4370 1623 37.14Central Asia 10443 1947 18.64World 542684 58371 10.76
0
5
10
15
20
25
Central Asia East Asia andPacific
North Americaand Western
Europe
Central andEastern Europe
world
Technical and vocational education as a share of secondary enrolment
1999 (%) 2012 (%)
Source: (UNESCO, 2012, p. 364, 370)Source: (UNESCO, 2015a)
TVET share of secondary enrolment: Low compared to
other developed regions
25
United Nations Educational, Scientific and
Cultural Organization

ICT Component in
Education Policy
National ICT in Education
Masterplan
Teacher ICT Competency StandardsExisting general/ICT
competenciesPre-service
trainingIn-service training
Kazakhstan General ICT
Kyrgyzstan General
Mongolia General ICT
Tajikistan General (by subject)
Uzbekistan General ICT (in the
process)
Source: (UNESCO, 2015b)
Status of ICT in education policy and teacher ICT competency standards
26
United Nations Educational, Scientific and
Cultural Organization

27
Although Asia-Pacific has relatively low youth unemployment rates, it also has
some of the highest youth-to-adult unemployment ratios.
0
1
2
3
4
5
6
7
Wor
ld
East
Asia
Sout
h-Ea
st A
siaan
d th
e Pa
cific
Sout
h As
ia
Mid
dle
East
Nor
th A
fric
a
2000 2005
Ratios of youth-to-adult unemployment rates (%), by regions, selected years
Youth unemployment rate, by region, 2000-2018p
Source: ILO, World Employment and Social Outlook 2015 database,
Persistent Youth Unemployment
United Nations Educational, Scientific and
Cultural Organization
Presenter
Presentation Notes
The UN defines ‘youth’ as those persons between the ages of 15 to 24 years. Securing decent employment is particularly difficult for young men and women. In South Asia, South-East Asia and the Pacific young people are between four and six times more likely than adults to be unemployed, compared to three times more likely globally.

0
2
4
6
8
10
12
Unemployment rate
2012 2013 2014
0
5
10
15
20
25
Youth (15-24) unemployment rate
2012 2013 2014
Source: (UNESCAP, 2016)
Unemployment rates (Overall and Youth): Higher than Asia-pacific
and World Average
28
United Nations Educational, Scientific and
Cultural Organization

0%
5%
10%
15%
20%
25%
30%
35%
40%
45%
World Sub-SaharanAfrica
South Asia Eastern Europe& Central Asia
East Asia &Pacific
Middle East &North Africa
Latin America& Caribbean
High-incomeOECD
% unskilled workers, out of all production workers
% firms identifying labor regulations as a major constraint
% firms identifying an inadequately educated workforce as a major constraintSource: Enterprise Surveys, 2010
29
Skills are Important Constraintfor Businesses
United Nations Educational, Scientific and
Cultural Organization
Presenter
Presentation Notes
According to the data from the Enterprise Surveys employers list skills as a key constraint. A high proportion of production workers are unskilled (blue bars in the graph). In Sub-Saharan Africa, East Asia, Middle East and North Africa and Latin America the proportion of unskilled production workers is more than 35%� In the Middle East and North Africa and Latin America, more than 2/3 of firms identify an inadequate educated workforce as a major constraint (green bars in the graph)

0
10
20
30
40
50
60
70
80
East and North-East Asia North and Central Asia Pacific South and South-WestAsia
South-East Asia Asia and Pacific World
Value added by sector (% of total value added) in 2003 and 2013
Agriculture 1993 Agriculture2013 Industry 1993 Industry 2013 Service 1993 Service 2013
Source: (UNESCAP, 2016)
Value Added by Sector: Service Sector is Growing Sharply
30
United Nations Educational, Scientific and
Cultural Organization
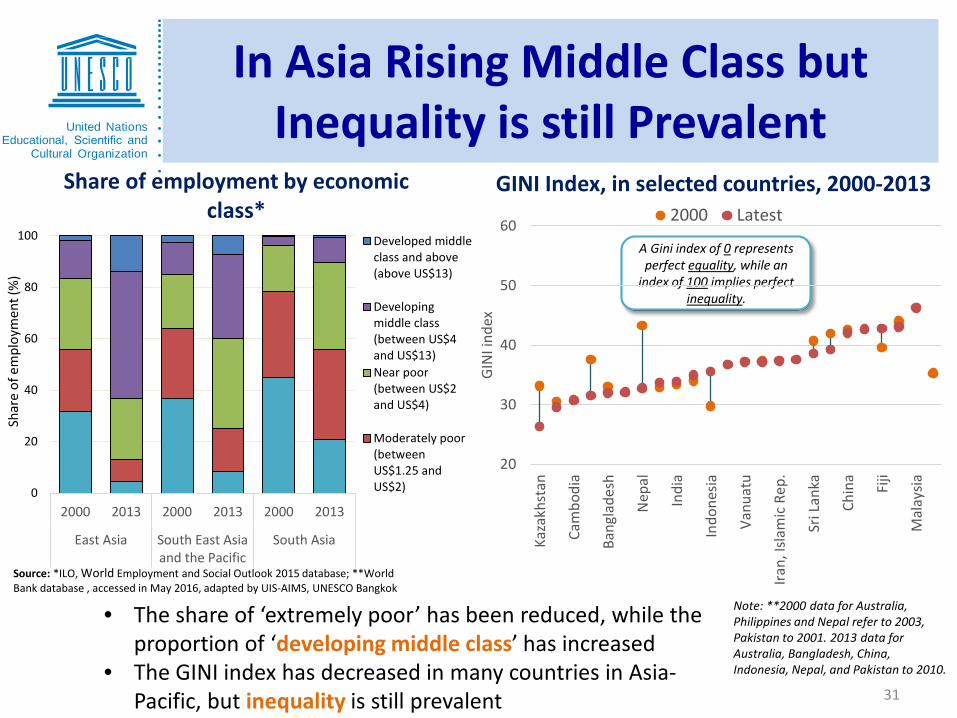
Note: **2000 data for Australia, Philippines and Nepal refer to 2003, Pakistan to 2001. 2013 data for Australia, Bangladesh, China, Indonesia, Nepal, and Pakistan to 2010.
• The share of ‘extremely poor’ has been reduced, while the proportion of ‘developing middle class’ has increased
• The GINI index has decreased in many countries in Asia-Pacific, but inequality is still prevalent
0
20
40
60
80
100
2000 2013 2000 2013 2000 2013
East Asia South East Asiaand the Pacific
South Asia
Shar
e of
em
ploy
men
t (%
)
Share of employment by economic class*
Developed middleclass and above(above US$13)
Developingmiddle class(between US$4and US$13)Near poor(between US$2and US$4)
Moderately poor(betweenUS$1.25 andUS$2)
A Gini index of 0 represents perfect equality, while an
index of 100 implies perfect inequality.
Source: *ILO, World Employment and Social Outlook 2015 database; **World Bank database , accessed in May 2016, adapted by UIS-AIMS, UNESCO Bangkok
20
30
40
50
60
Kaza
khst
an
Cam
bodi
a
Bang
lade
sh
Nep
al
Indi
a
Indo
nesia
Vanu
atu
Iran,
Isla
mic
Rep
.
Sri L
anka
Chin
a
Fiji
Mal
aysia
GIN
I ind
ex
2000 LatestGINI Index, in selected countries, 2000-2013
31
In Asia Rising Middle Class but Inequality is still Prevalent
United Nations Educational, Scientific and
Cultural Organization

Technological advances can generate new opportunities, but also risks.
Source: WDR 2016 team. See figure 2.24 in the full Report for more details. Data at http://bit.do/WDR2016-FigO_18.
Many digitisedeconomies face increasingly polarized labor markets and rising inequality.
Source: World DevelopmentReport 2016: Digital Dividends
Medium-skilled jobs can be at risk from automation.
Need to equip workers with “new skills” to meet demands of the new economy.
32
Digitisation andLabor Market Polarisation
United Nations Educational, Scientific and
Cultural Organization
Presenter
Presentation Notes
The polarization—or “hollowing out”—of the labor market, not only in advanced economies, but increasingly also in many developing countries. The share of employment in high-skilled occupations is up, as is the share of low-skilled jobs. The share of middle-skilled employment, in contrast, is down. High-skilled occupations (intensive in nonroutine cognitive and interpersonal skills) Medium-skilled occupations (intensive in routine cognitive and manual skills) Low-skilled occupations (intensive in nonroutine manual skills) Skills in demand: Nonroutine, higher-order cognitive skills; Technical skills, including information and communication technology (ICT) skills; Nonroutine interpersonal, socioemotional skills (Source: World Development Report 2016: Digital Dividends)

Estimated share of employment that is susceptible to automation (latest year)Technological advances can generate new opportunities, but also risks.
Source: WDR 2016 team. See figure 2.24 in the full Report for more details. Data at http://bit.do/WDR2016-FigO_18.
Many digitisedeconomies face increasingly polarized labor markets and rising inequality.
Source: World Development Report 2016: Digital Dividends
Medium-skilled jobs can be at risk from automation.
Need to equip workers with “new skills” to meet demands of the new economy.
33
Digitisation andLabor Market Polarisation cont.
United Nations Educational, Scientific and
Cultural Organization
Presenter
Presentation Notes
The polarization—or “hollowing out”—of the labor market, not only in advanced economies, but increasingly also in many developing countries. The share of employment in high-skilled occupations is up, as is the share of low-skilled jobs. The share of middle-skilled employment, in contrast, is down. High-skilled occupations (intensive in nonroutine cognitive and interpersonal skills) Medium-skilled occupations (intensive in routine cognitive and manual skills) Low-skilled occupations (intensive in nonroutine manual skills) Skills in demand: Nonroutine, higher-order cognitive skills; Technical skills, including information and communication technology (ICT) skills; Nonroutine interpersonal, socioemotional skills (Source: World Development Report 2016: Digital Dividends)

34
III.UNESCO’S STRATEGYFOR TVET
United Nations Educational, Scientific and
Cultural Organization

Source: Marope, M., Chakroun,B. & Holmes,K (2015) 35
Changing the Role:Three Analytical Lenses
United Nations Educational, Scientific and
Cultural Organization

Normative instruments
Recommendation Concerning Technical and Vocational Education and Training (2015)
Reference DocumentsTransforming TVET: Building skills for work
and life. The Shanghai Consensus (2012)
Qingdao Declaration (2015)26
UNESCO: Setting the Norms and Standards in TVET
United Nations Educational, Scientific and
Cultural Organization
Presenter
Presentation Notes
The 2015 Recommendation Concerning TVET was enthusiastically adopted by Member States at the 38th session of the General Conference held in Paris, in November 2015. It is an up-to-date and comprehensive tool for decision-makers, practitioners, social partners, civil society and other stakeholders in TVET. The Convention on Technical and Vocational Education was adopted in 1989 and entered into force on 29 August 1991. The 17 State Parties to this Convention include Bahrain, Bulgaria, Central African Republic, Indonesia, Iraq, Jordan, Kuwait, Kyrgyzstan, Lithuania, Mongolia, Niger, Oman, Rwanda, United Arab Emirates, Uzbekistan, Zambia and Zimbabwe. The Asia-Pacific Conference on Education and Training’s outcome statement, Kuala Lumpur Declaration, was endorsed by 27 UNESCO Member States, which outlines eight Recommendations and actions for the development of TVET. The Shanghai Consensus contains recommendations that were agreed during the Third International Congress on TVET. More than 500 representatives from 107 countries attended the Congress, which looked at ways of transforming TVET to make it more responsive to the needs of 21st century societies.

37Source: UNESCO Strategy for TVET (2016-2021)
Priority Areas
Fostering Youth Employment and Entrepreneurship
Promoting Equity and
Gender Equality
Facilitating Transition to Green Economies
and Sustainable Societies
- Supporting policy reviews and policy development - Promoting collaborative approaches and capacity building
- Promoting targeted policy measures for disadvantaged groups- Enhancing women’s and girls’ access to relevant TVET and equal opportunities in the world of work
- Fostering cross-sectoral approaches of TVET- Promoting green skills for smooth transition to greening economies - Promoting skills for digitised economies and societies
Programmes
UNESCO Strategy for TVET (2016 – 2021): Support the Efforts of Member States to
Enhance the Relevance of Their TVET Systems
United Nations Educational, Scientific and
Cultural Organization

Anticipating demand for skills
Understanding mobilities and recognising skills and qualifications across borders
Monitoring and evaluating outcomes
38
UNESCO: Cross-cuttingIssues in TVET
United Nations Educational, Scientific and
Cultural Organization

39
IV. USING ICT INTRANSFORMING TVET
United Nations Educational, Scientific and
Cultural Organization

Fostering Youth Employmentand Entrepreneurship
Support Member States in Leveraging ICTs for youth employment and entrepreneurshipProvide support for initiatives that can :Significantly change the teachers’ and
learners’ roles, practices and performance Improve access, equity, learning outcomes,
employment and benefits to industry, the community, etc.
Provide savings and efficienciesAre likely to be widely accepted, replicated
and supported within the TVET system 40
United Nations Educational, Scientific and
Cultural Organization

Fostering the Promotion ofEquity and Gender Equality
Support Member States in Leveraging ICTs for enhancing access to TVET for disadvantaged groups, girls and women: Map learning strategies fostered by the use of ICTs
impact special needs and disadvantaged students, Identify promising practices in addressing issues related
to ICT use for special needs and disadvantaged students through teacher professional development activities,
Examine the promising practices in using ICTs to attract and retain out-of-school and at-risk students (for example, through improved communication and provision of alternative modes of learning) 41
United Nations Educational, Scientific and
Cultural Organization

Anticipating Demand for Skills
Conduct analysis regarding skills requirements for digitized economies and societies
Making use of data analytics to enhance labour market intelligence
42
United Nations Educational, Scientific and
Cultural Organization

Supporting Mobility and Recognition of Skills and Qualifications
Support student mobility and digitalization of learners records
The future of Digital Student Data Portability
Develop approaches for digitised skills passports
43
United Nations Educational, Scientific and
Cultural Organization

Monitoring and Evaluating Outcomes
Support Member States in developing TVET-MIS
Making use of data analytics to improve monitoring and evaluation of outcomes
44
United Nations Educational, Scientific and
Cultural Organization

Implementation Modalities
Leadership capacity developmentCollaboration and networking
particularly through UNEVOC Networkteaching staff Professional
development Mapping and sharing resourcesResearch and evaluation
45
United Nations Educational, Scientific and
Cultural Organization

Forthcoming Publications/Work
UNESCO-COL (forthcoming) - Using ICTs and blended learning in transforming TVETUNESCO (forthcoming) - Leveraging Digital
Technology for Scaling-Up Work-Based Learning to Improve Employment and Entrepreneurship of YouthUNESCO (forthcoming) - Beyond Access: ICT-
enhanced Innovative Pedagogy in TVETUNESCO-UNEVOC (forthcoming) - Using ICTs
for TVET teacher training 46
United Nations Educational, Scientific and
Cultural Organization

International Telecommunication Union [ITU]. (2015a). Measuring the Information Society Report 2015. Retrieved from http://www.itu.int/en/ITU-D/Statistics/Documents/publications/misr2015/MISR2015-w5.pdfInternational Telecommunication Union [ITU]. (2015b). ICT facts and figures. Retrieved from http://www.itu.int/en/ITU-D/Statistics/Documents/facts/ICTFactsFigures2015.pdfUNESCAP. (2015). Population data sheet. Retrieved from http://www.unescap.org/sites/default/files/SPPS%20PS%20data%20sheet%202015%20final%20online.pdfUNESCAP. (2016). Value added by sector: Agriculture, industry and service; unemployment rate; youth unemployment rate [Data file]. Retrieved from http://www.unescap.org/stat/data/statdb/DataExplorer.aspxUNESCO. (2012). EFA Global Monitoring Report 2012: Youth and Skills - Putting Education to Work. Paris: UNESCO. Retrieved from http://unesdoc.unesco.org/images/0021/002180/218003e.pdfUNESCO. (2015). EFA Global Monitoring Report 2015: Education for All 2000-2015-Achievements and Challenges. Paris: UNESCO. Retrieved from http://unesdoc.unesco.org/images/0023/002322/232205e.pdfUNESCO. (2015b). CASIE 2015 outcome document. Retrieved from http://www.unescobkk.org/fileadmin/user_upload/ict/Workshops/casie2015/CASIE_2015_Outcome_Document.pdfUNESCO-UIS. (2016). Government expenditure on education as % of GDP (%); Expenditure on secondary and post-secondary non-tertiary vocational as % of govt. total expenditure on education [Data file]. Retrieved from UNESCO-UIS. (2014). Information and Communication Technology (ICT) in Education in Asia: A comparative analysis of ICT integration and e-readiness in schools across Asia. Information Paper No. 22. Montreal, Canada, UNESCO Institute for Statistics. http://www.uis.unesco.org/Communication/Documents/ICT-asia-en.pdfWorld Bank. (2015). World Development Indicators 2015. Retrieved from http://data.worldbank.org/data-catalog/world-development-indicators/wdi-2015
References
47
United Nations Educational, Scientific and
Cultural Organization