Unemployment and Labor Market Institutions: The...
44
1 September, 2004 Unemployment and Labor Market Institutions: The Failure of the Empirical Case for Deregulation Dean Baker, Andrew Glyn, David Howell, and John Schmitt We thank the International Labor Organization and the Centre for Economic Policy Analysis at the New School University for their financial support for the project
Transcript of Unemployment and Labor Market Institutions: The...

1
September, 2004
Unemployment and Labor Market Institutions: The Failure of the Empirical Case for Deregulation
Dean Baker, Andrew Glyn, David Howell, and John Schmitt
We thank the International Labor Organization and the Centre for Economic Policy Analysis at the New School University for their financial support for the project
2
I. Introduction
It has become widely accepted that poor employment performance can only be effectively addressed with fundamental reforms of national labor market institutions. Prominent economists and leading international organizations have argued that these institutions have produced rigidities that account for the relatively slow employment growth and persistent high unemployment experienced by much of the developed world over the last two decades. In particular, wages for the less-skilled must be made more flexible, reflecting the interplay of demand and supply in local labor markets. This rigidity account has long been a central tenet of orthodox economics, but has attained increasing prominence with the rise in unemployment since 1973. But there is an equally long, if less influential, dissenting position, most famously illustrated by Keynes’ attack on economic orthodoxy during the Great Depression.
A great deal of research effort has been devoted to providing empirical support for the orthodox rigidity explanation. Leading multi-national institutions began to aggressively promote the need for large-scale labor market deregulation in the early 1990s, most notably in the OECD’s massive Jobs Study (1994). The OECD’s subsequent Implementation of the Jobs Strategy reports (OECD 1997, 1999) took, if anything, an even stronger position. The same call for deregulation appears in the very title of the IMF’s Unemployment and Labor Market Institutions: Why Reforms Pay Off (2003). The empirical question has been mainly whether the rigidity account can be best confirmed by modeling it as a problem of the levels of institutional intervention (e.g., Layard, Nickell, and Jackman, 1991), the interaction of 1970s-80s economic shocks with strong institutions (e.g., Blanchard and Wolfers, 2000), or the change in institutional strength between the 1960s and 1990s (e.g., Nickell et al., 2002; IMF, 2003).
This paper extends our earlier assessment of the extent to which this literature’s use of cross-country statistical evidence can reliably account for the pattern of unemployment across the developed world since the 1960s (Baker et al, 2003). We focus here on the IMF study (2003) since it was produced under the auspices of a leading multinational institution whose empirical work and policy recommendations are likely to be highly influential worldwide and because the IMF authors rely heavily on the data and methodology of another important recent study (Nickell et al., 2002).
In the next section, we briefly describe the unemployment experiences of the most economically developed OECD member countries. We then turn to the labor market institutions that have played starring roles as explanatory variables – unemployment benefits, employment protection laws, unions, coordinated bargaining, and labor taxes. We ask why labor market institutions designed to provide social protection might pose efficiency problems, and why they might, on the contrary, actually enhance efficiency. We then take a look at whether there is a simple statistical relationship between the standard measures of these institutions and the cross-country pattern of unemployment.
In section 3, we begin by reviewing the IMF study referred to above, together with another important recent addition to the literature from OECD-based authors (Nicoletti and Scarpetta 2002) in the context of the larger literature of the last decade. In the second part of this section we replicate the results of the IMF study and critically assess their robustness to minor changes and reasonable alternative specifications – those that are quite standard in the literature. Finally in Section 4 we evaluate the evidence, in the IMF study and elsewhere, that unemployment trends in the 1990s, including that of countries widely heralded as “success stories” can be explained by the reform (weakening) of labor market institutions. The final section summarizes our argument that the case for labor market reforms in order to reduce unemployment is not well founded empirically. We conclude with some comments on policy implications.
3
II. Unemployment and Institutions
While welfare state and industrial relations models vary widely across the developed
countries, rising unemployment in the 1970s and 1980s afflicted almost all of them. For 15 European countries (the “EU 15”), unemployment grew from 5.5% in 1978 to 10.5% in 1984, and it stayed at about that level until 1998 – albeit with a dip to 8-9% between 1989-91. Figure 1 shows the levels and spread of unemployment rates for 20 OECD-member countries for each 5-year period between 1960 and 1999, and adds figures for 2000-02. The top two rows of Table 1 show the recent (1998 and 2002) unemployment experience of OECD Europe and six individual countries: four large “high-unemployment” countries (France, Germany, Italy, and Spain), a leading “success story” (the Netherlands) and the “model” country (the U.S.).1 The 1998 gap in performance is striking – while OECD Europe stood at 9.2% and France, Italy and Spain ranged from 11.5 to 15.4%, the Netherlands and U.S. were far below, in the 4.2-4.5% range. The data show strong improvements in employment performance across European countries between 1998 and 2002, leading to considerable convergence with the United States (which experienced an increase in unemployment to 5.8%). But a large gap between the four high-unemployment countries and the U.S. has remained, and the gaps are even larger with the Netherlands. The empirical question is: To what extent can these differences in unemployment (and their change over time) be explained by “bad” labor market institutions? What Do Institutions Do?
The rest of Table 1 presents some commonly used measures of key institutions, most of which have been singled out as potentially “employment-unfriendly.” Before turning to these data, it is worth reflecting on why these labor market institutions exist in the first place – even in the United States. Employment protection laws, union power, and bargaining coordination across firms and industries can destroy the incentive to hire workers, reduce firm-specific flexibility, and undermine workplace productivity. Generous unemployment benefits can raise the reservation wage and reduce the incentive to search for work. Labor taxes may reduce the demand for labor, and government mandated active labor market policies can reduce employer flexibility and raise costs. If these components of the social protection system are too strong, or poorly designed, or poorly matched with one another, it is not hard to imagine that they could have substantial negative effects on employment opportunities.
But there can be benefits as well, and it is notable that these are rarely mentioned in the unemployment-institutions literature. In fact, it is well-known that the case for a strongly regulated labor market has been made on efficiency as well as equity grounds. The Great Depression helped teach the lesson that too much inequality, economic insecurity, and lack of access by large parts of the population to basic needs such as food, health and safety, housing, and education can cripple economic efficiency. The case for a healthy, safe, decently housed, and adequately educated workforce – all of which requires some minimal level of income, which in turn requires
1 The OECD Jobs Study (1994) makes no major recommendation for reform of U.S. institutions, and the IMF (2003) explicitly uses the weakness of U.S. institutions as the benchmark for Europe. For example, as the IMF explains, “Across a range of structural indicators, the EU labor market continues to compare unfavorably to more competitive labor markets. For example, EU unemployment benefits and marginal effective tax rates on additional income are about twice as high as U.S. levels” (p. 139).
4
employment and insurance against job loss - can be traced back to Alfred Marshall’s Principles of Economics (1890s) and even further back to Adam Smith’s Wealth of Nations (1776).
In the last several decades there has been an increasing recognition that imperfect information and bargaining power are inherent to labor markets (Barr 1998; Agell 1999; Gregg and Manning, 1997). In real world labor markets, the right to join a union and bargain collectively can increase worker voice, encourage stability in industrial relations, promote on-the-job training, and reduce the pressure on taxpayers to maintain acceptable standards of living by placing the responsibility for decent income and benefits on the firm (and consumer). Co-ordination of bargaining, which would seem to push wage setting further from the competitive ideal, can cause the externalities from wage pressure to be internalized (Calmfors and Driffil 1988, Soskice 1990). The provision of unemployment insurance and assistance not only can help workers in time of need, but can facilitate job search, and thereby potentially improve the match between jobs and worker skills and interests. As Agell (1999, p. 119) puts it, “the demand for risk-sharing institutions ought to increase with the fraction of the workforce that faces uncertainty about their future position in the wage distribution.” From this perspective, the direction of causation can run from uncertainty (unemployment) to response (institutions), whereas the thrust of the recent deregulation literature has this reversed. Indeed, even the IMF (2003, p.131), citing Blanchard (2002), notes that “it is generally agreed that ‘the labor market will not function well without proper institutions,’ that is, without an appropriate mix of regulations, taxes, and subsidies affecting the relation between workers and employers.”
So the question boils down to whether countries facing high unemployment have the “appropriate mix” of labor market institutions. The IMF’s view, shared by the authors of the OECD’s Jobs Study reports and, in fact, by many economists, is that the U.S. has got the mix and levels of the key institutions about right (see footnote 1 above). As the IMF authors explain, leading international institutions – the IMF, OECD and the European Commission – have long argued that “the causes of unemployment can be found in labor market institutions. Accordingly, countries with high unemployment have been repeatedly urged to undertake comprehensive structural reforms to reduce ‘labor market rigidities’” (IMF, 2003 129). Indeed, they contend that “high and persistent unemployment can only be solved through structural reforms” (ibid. fn 8, 133). In the words of Gregg and Manning (1997 395), this stance reflects less a balanced assessment of the evidence than the “touching faith that many economists have in the view that the de-regulation of the labor market moves it towards the perfectly competitive ideal in which everyone who wants a job can find one at a wage equal to the value of their contribution to society.”
For those who believe that labor markets are inherently and nontrivially imperfect, the solution must be the right mix of strong labor market institutions. But the “right mix” may vary quite significantly across countries. This position has been taken by a number of leading labor market specialists (Freeman 2000; Hall and Soskice, 2001), and the recent country case study evidence strongly suggests that good employment outcomes in this new economic environment can be achieved with a variety of combinations of labor market institutions, with social spending far more generous in some countries than others (see Howell, forthcoming 2004). In sharp contrast, the orthodox view, clearly displayed in the recent IMF study (2003), is that the deregulated labor market of the U.S. must be the benchmark. The Measurement of Institutions
5
Before examining their relation to unemployment it is worth taking a brief look at the construction and quality of some of the standard measures of labor market institutions. After all, if empirical evidence is to be used to support the call for the deregulation, we should have confidence that the measurement of the relevant institutions actually captures in a meaningful way what they are claimed to measure. The good news is that, largely through the work of the OECD, measurement quality has greatly improved for a number of the most frequently used variables. For example, the measure of unemployment benefits duration that was employed extensively in the 1990s was an estimate of the number of years a representative unemployed worker was eligible for benefits. So, for example, Ireland was given a score of 4 (years), while France received 3, the Netherlands 2 and the U.S. just .5 (see Nickell, 1997, Table 4). In many studies, this measure of duration was found to be closely associated with higher unemployment, which lent support to the case for reduced generosity in length of benefits. But with the increasing recognition of the complexity of each nation’s formula for eligibility (previous work experience, contributions, and age), this duration measure now seems largely abandoned. In studies since the late 1990s it has been replaced by a measure of how the longer-term generosity of benefits compares to the one-year replacement rate (see below) or is simply omitted entirely (as in the IMF study).
But the bad news is that even one of most carefully constructed measures, the commonly employed first-year replacement rate, almost certainly does not, by itself, provide a reliable measure of the overall generosity of the benefits system. First, the rules (and their enforcement) covering both eligibility and the duration of benefits are critical elements of the system. There is no cross-country measure of eligibility, but we do know that the share of the unemployed who are receiving unemployment-related benefits varies dramatically across countries.2 As a measure of generosity, the replacement rate must be supplemented with the share of the unemployed eligible for benefits. Second, a single average replacement rate may not capture very well the incentive effects of the rate structure. Thus, younger workers, who in many countries account for a large part of the unemployment problem and who may be most sensitive to work incentives, may be either ineligible for benefits in the first place (e.g., Italy) or they are eligible only for lower levels of benefits. For instance, in France in the mid-1990s, workers under 25 were eligible for full benefits for just 7 months, which then declined at 17% every 4 months for the next 23 months. And third, as the OECD noted in The Jobs Study and has stressed since in their regular Benefits and Wages reports, if we are concerned with work-related incentive effects, we should use net (rather than gross) measures. These produce quite different replacement rate levels and cross-country rankings, since they take into account after-tax outcomes and include various related family and housing benefits.3
2 One attempt was made by the OECD’s Jobs Study (OECD, 1994, Table 8.4). Defining their measure as “all beneficiaries as a percentage of labor force survey unemployment” in 1991 (or for some countries, 1989 or 1990) France gets an “accessibility” score of 98 percent, which suggests a far more generous system than the U.S. (34%) or the U.K. (71%), but a less generous system than Austria (132%), Ireland (107%), or the Netherlands (105%) for example. These high scores (over 100%) reflect, among other things, the fact that some may qualify for benefits but not meet the official labor market survey definition of unemployment. 3 The OECD’s first-year gross replacement rate (for single persons) puts France squarely among the most generous of the 28 OECD countries. France’s replacement rate is 59, while the average rate is just 48, and 18 countries have less generous rates. But on the net measure, France provides almost exactly the average rate, with just 12 countries showing less generous (OECD, 2002, Tables 3.10 and 3.11). Only the gross measure is available for the long run of years used in the empirical studies.
6
Finally, the construction of the standard measure of the strictness of employment protection laws (EPL) – which the IMF uses - is particularly questionable. This variable came to the IMF directly from Nickell et. al. (2002), which in turn relied heavily on Blanchard and Wolfers (2000). The source of Blanchard and Wolfers’ EPL measure was a major project on employment protection by the OECD (1999). This extraordinarily detailed and careful study provides only two data points for major OECD countries, one for “the late 1980s” and another for “the late 1990s.” From these two estimates for each country, Blanchard and Wolfers created another for 1990-94 by interpolating between the OECD’s late 1980s and late 1990s scores, and still another for the early 1980s simply by using the late 1980s figures, on the grounds that they did not have information to suggest that there were any changes between the early and late 1980s. Thus, from two multi-year averages for the late 1980s and late 1990s (OECD), four 5-year averages were created (Blanchard and Wolfers), and from these, annual data points were created for 1980-95 (Nickell et al. 2002). Worse still, the IMF’s EPL data for the remainder of the period they examine (1961-79) comes from another source and is constructed on an entirely different basis, and may be even more suspect.4
For the remainder of this paper, we use these same standard measures (with some minor corrections). But it should be remembered that independently of the econometric results, substantial questions remain about the quality and meaningfulness of the data. Unemployment and Institutions: The Bivariate Evidence
The attempt to show that “employment-unfriendly” labor market institutions are largely, or even entirely, responsible for persistent high unemployment is a research program that took off in the 1990s, following the pioneering work of Layard, Nickell and Jackman (1991). Most of the analysis has taken a multivariate form: using country-level data, unemployment rates are regressed against measures of a number of different institutions, and perhaps other factors. But there has also been frequent resort to bivariate evidence, often in the form of scatter plots. For example, Layard et. al. (1991) present a graph of long run unemployment against the duration of unemployment benefits (the first generation measure discussed above), and imply a causal relationship from duration to unemployment: “It is noticeable… that all the countries where long-term unemployment has escalated have unemployment benefits of some kind that are available for a very long period, rather then running out after 6 months (as in the USA) or 14 months (as in Sweden).” There are other ways to read this evidence, but the point here is that bivariate evidence has often been used to make the case for the unemployment-generating effects of labor market institutions. The data on institutional arrangements in the OECD in Table 1 show a remarkable degree of diversity, with no immediately obvious connection between the levels of individual institutions and national unemployment rates. With respect to employment protection, for example, the data suggest that while EPL is modestly less strict in the Netherlands than it is in the four high-
4 The IMF –via Nickell et. al. (2002) and Blanchard and Wolfers (2000)- use severance pay data from a paper by Edward Lazear for the 1960s and 1970s. Although they are chained together by Blanchard and Wolfers, they are almost certainly not at all comparable. For the late 1980s and late 1990s, the OECD (1999) carefully took into account three dimensions of employment protection: “procedural inconveniences which the employer faces when trying to dismiss; notice and severance pay provisions; and prevailing standards of and penalties for unfair dismissal.” Further, their estimates were designed to cover both white and blue collar workers. In contrast, Lazear's index reflects just "severance pay, and months of advance notice before dismissal for blue-collar workers with 10 years of service."
7
unemployment countries, Dutch levels of EPL are exactly equal to the average for OECD Europe and far higher than that of the United States. Union density (the share of workers who are members of unions) is lowest in France and highest in Italy, both with high levels of unemployment. Unionization rates in the Netherlands are well below the OECD average, but on this score are not much different from Germany, which had far higher unemployment in 1998. It should be noted that on a related measure - workers covered by collective bargaining contracts (not shown in Table 1)- the country rankings look quite different. France, for example, has a high coverage score. On the degree to which wage bargaining involves coordination among employers on one side and unions on the other, Table 1 shows that the high unemployment countries fall between the highly coordinated, low unemployment Netherlands, and the highly atomistic low-unemployment United States.
Similarly, Table 1 shows that on the first-year unemployment benefit replacement rate, the large high-unemployment countries fall between the low-unemployment U.S. (28.5%) and the even lower-unemployment Netherlands (70.2%). The “duration” measure, shows a wide range of benefit reductions for longer unemployment spells, from least generous in Italy to most generous in Germany. But it should also be noted that the Netherlands (62%) is much closer to the high unemployment countries (Germany, France and Spain) than it is to the U.S. (21%). On the other hand, countries with a relatively low tax wedge include high-unemployment Spain (45.8%) as well as low unemployment USA and Netherlands. Finally, on this measure of spending on active labor market policies (e.g., for training and job search programs), the two low-unemployment countries are again at the extremes of the distribution, ranging from three times (the Netherlands) the OECD-Europe average to just one-third of it (the U.S.). Figures 2 through 8 show the simple, bivariate relationships more formally. These figures show scatter plots of unemployment against standard measures of the institutional variables (in the main as employed by the IMF) for three 5-year periods and one 4-year period (1995-98) between 1980 and 1998 . To say the least, the evidence is unsupportive of the conventional rigidity view. There is nothing approaching a significant cross-country relationship between unemployment and the extent of social protection (as measured by employment protection or the replacement rate) or the level of taxation – to take the institutions singled out by the IMF (2003 table 4.1) as representing “popular” measures for reform. Similar plots for union density and bargaining coordination also show no statistical association with unemployment. Only a separate measure of active labor market policies - not available for a long enough time period for inclusion in the empirical studies– “works,” but in this case, more generous ALMPs are associated with lower unemployment.
Simple cross country plots can be very convincing when they suggest a significant relationship, and by the same token the absence of an obvious correlation is disconcerting to those believing that the relationship between the two variables is important. Bivariate relationship certainly vastly oversimplify the complex inter-relationships between labor market institutions, but one robust conclusion that can be safely drawn from the bivariate analysis is that almost any level of unemployment is consistent with almost any observed level of individual labor market institutions. Countries with high levels of employment protection (Portugal), union density (Sweden), and unemployment benefits (Denmark), for example, can have low levels of unemployment. This suggests that countries have a menu of options, many of which will sustain low levels of unemployment, including regimes that provide substantial protections relative to the U.S. "ideal."
8
The empirical literature examining the connection between labor market institutions and unemployment has developed to include much more complex multivariate models that seek to uncover the importance of individual institutional variables whilst controlling for a wide range of other factors. We turn next to the evidence from these models.
III Unemployment and Labor Market Institutions: the econometric evidence A: An Update of the Cross-Country Literature In an earlier paper (Baker et al 2003) we examined in some detail the key studies that are generally cited to support the argument that labor market protections lead to unemployment. Before summarizing our main conclusions, this section examines two new studies that build on this prior work: a study published by the OECD (Nicoletti and Scarpetta, 2002), which examines the interaction of labor market institutions and product market regulation, and a study by the IMF which attempts to explain the rise in unemployment over the last three decades by unfavorable trends in labor market institutions (IMF 2003). After examining the contribution of these new studies, the section reassesses the state of the cross-country literature. Nicoletti and Scarpetta
Nicoletti and Scarpetta (NS) present an interesting departure in this literature. The paper
attempts to merge an analysis of the impact of different types of product market regulation on employment, with a more conventional analysis of labor market protections. In the case of labor market outcomes, the argument is that product market regulations lead to rigidities, which allow for rents in regulated sectors. This can result in wage premiums for workers in these sectors, but lower overall employment.5
NS find evidence consistent with the earlier literature and the view that product market regulation is associated with industry wage premiums. The evidence for this effect is clearer in the case of manufacturing industries than non-manufacturing industries. NS hypothesize that their ambiguous findings for non-manufacturing industries could be explained by the existence of a non-linear relationship, in which government regulators manage to limit wage premiums in the most heavily regulated industries.
For purposes of this discussion, the key question is whether the inclusion of measures of product market regulation strengthen or weaken the evidence linking labor market institutions to unemployment. NS test this hypothesis by running a series of cross-country panel regressions, using annual data for 1982-1998, that include a series of product market regulation variables, in addition to standard labor market variables.
One striking difference between the specification in this regression and the specifications in other studies is that this paper uses non-agricultural employment rates as its dependent variable. The decision to use non-agricultural employment rates, rather than overall employment to population ratios, is explained only briefly in a footnote (#10). Given the large differences in agricultural employment in these countries, and the fact that agricultural employment rates were
5 NS also examine the impact of labor market regulation on innovation and research and development spending.
9
changing during this period (and the declines may be correlated with changes in the institutional variables), there seems little justification for using the more narrow measure of employment rates6.
Two regressions that exclude product market regulation variables find no significant relationship between the size of the tax wedge and the employment rate. However, the three published regressions that include product market regulation variables do find a significant negative relationship between the tax wedge and employment rates. The benefit replacement rate is insignificant in two of the five regressions and only significant at the 10 percent level in the other three. The implied effect in these regressions is relatively small, with a 10 percentage point increase in the benefit replacement rate associated with just a 0.6 percentage point decline in the employment rate. Since employment rates vary considerably more than unemployment rates, this would be equivalent to an approximately 0.3 percentage point rise in the unemployment rate. The union density and employment protection legislation variables are both significant in all the regressions and imply a meaningful economic impact. Overall, however, and bearing in mind their unconventional dependent variable, the NS results do not support a strong link between labor market regulation and unemployment. As NS notes: “the findings are only partly consistent with those of inter alia, Nickell and Layard (1999), Elmeskov et al. (1999), Nicoletti et al. (2001b) and OECD (1999b).”
. The IMF (2003)
This study largely follows the framework laid out in Nickell et al. (2002), with some minor
modifications. Like Nickell et al., it attempts to explain the differences across countries and changes over time in unemployment rates over the period 1960-98 by international differences and changes in institutions, rather than as the result of the interaction between shocks and institutions. Terms reflecting the impact of macro shocks are entered into the regressions separately, and are not interacted with the institutional variables. Like Nickell et al., the IMF also uses annual data. In addition, the IMF study also follows Nickell et al. by including country specific time trends in the regression.
While the basic approach is very similar to Nickell et al., there are some notable differences. First, in addition to using country specific time trends, the IMF also uses country specific terms for the inflation-unemployment trade-off. In other words, unlike prior studies, this one does not impose the restriction that the trade-off between inflation and unemployment is identical for all countries. In a departure from most prior research, the study does not include a benefit duration variable.7 The IMF also includes somewhat novel specifications for the standard set of institutional variables. Specifically, the regressions include a quadratic term for bargaining coordination. This allows for the possibility that the effect of bargaining coordination on
6 Perhaps the most singular aspect of these regressions is the inclusion of a public employment rate variable in the regression. This variable is highly significant in all five regressions and close to 1.0. The implication of this result is that countries that have a higher percentage of their population employed in the public sector have higher employment rates. Furthermore, the fact that the coefficient is not significantly different from one implies that there is no decline in private sector employment in response to an increase in public sector employment. This result implies that a country could increase its employment rate simply by increasing public sector employment or to put it another way that any adverse effects of high taxation on employment in the private sector would be offset if the taxation was spent to create public sector jobs.
7 This is explained by the difficulty in obtaining recent data on benefit duration, which is surprising since it is regularly updated by the OECD.
10
unemployment may not be linear8. It also includes (like Nickell et al.) a lagged dependent variable. However, the IMF also separately includes interaction terms for the lagged unemployment rate multiplied by the benefit replacement rate and the lagged unemployment rate multiplied with the bargaining coordination level. In principle, these additional variables are to allow for the possibility that these institutions affect the persistence of unemployment through time.
The other noteworthy departure of the specifications used by the IMF is the inclusion of a variable for central bank independence. This allows for the possibility that independent monetary policy may either lead to higher unemployment – possibly as a result of shielding central bankers from political pressures to try to reduce unemployment – or alternatively, to lower unemployment as a result of consistent well-planned monetary policy. The regressions with the central bank independence term also include an interaction term between central bank independence and bargaining coordination. This allows for the possibility that the effect of central bank independence may depend on the extent of coordination in wage bargaining.
The study’s authors describe their results as providing compelling evidence that weakening labor market institutions will lead to lower unemployment: “comprehensive and procompetitive reforms can generate substantial gains” (p129). But it is not obvious that this is the case. At the most basic level, the four sets of regression coefficients published in the study (Table 4.3) show substantial differences in the estimated effects of the institutional variables, some of which are directly at odds with the claim that labor institutions lead to unemployment. Table 2 shows the implied impact of particular changes in labor market institutions for each of these specifications.9
For example, the column 1 results from the IMF’s table 4.3 imply that the impact of employment protection is almost three times as large as the results shown in the third column, whereas the results shown in the fourth column actually imply that increased employment protection leads to lower unemployment. Similarly, the published results shown in the first column imply that an increase in the tax wedge will lead to a substantial increase in the unemployment rate, whereas the results shown in column three imply that an increase in the tax wedge will lead to a drop in the unemployment rate. Increases in bargaining coordination, at levels below the mean level of coordination, are found to substantially reduce unemployment in the regression results shown in the first column, and to lead to more modest reductions in the results shown in second and third columns, while the results shown in the fourth column (the one used for the simulations in the paper) imply that higher levels of bargaining coordination have a very small positive effect on the unemployment rate. The implied impact of changes in union density has the same sign in all four sets of regression results, but the magnitude of the implied impact varies substantially. The results from the regression shown in column 2 imply an impact of changes in union density that is nearly twenty times as large as the results from the regression in column four. Only the coefficients for the replacement rate variable are roughly similar across the four regressions.
There are two other striking aspects of the results of the IMF study. The large positive coefficient found on the quadratic bargaining coordination term, coupled with the negative coefficients on the linear terms, imply that the lowest levels of unemployment will be associated with medium levels of coordination, and that very high levels of coordination will lead to high 8 Calmfors and Driffill (1988) and others have posited the existence of a nonlinear relationship, but earlier literature in the style of the IMF paper has generally not included a quadratic term for centralized bargaining. 9 The IMF states that all four specifications are reasonable representations of reality. For example, the IMF writes that "the very simple model [in variant one] does a good job in explaining unemployment variation across countries (although not across time)." (p. 148) The IMF's preferred specification is arguably variant three, but this equation includes complicated interactions between institutions and the lagged dependent variable that make it difficult to use in various simulation exercises. Variant four is based on variant three, but without these interaction terms.

11
unemployment. This result contrasts with a significant body of literature which has generally assumed that greater bargaining co-ordination (as distinct from centralization – see Soskice (1990)) would lead to improved employment outcomes.10
Another striking finding is that greater central bank independence, in the presence of low rates of bargaining coordination, leads to higher unemployment. For example, the regression results in the third column imply that in the United States, which has a measure of 1.0 on the bargaining coordination index, a one standard deviation increase in the measure of central bank independence would lead to a 1.44 percentage point increase in the unemployment rate. If the results in these regressions are taken at face value, then they imply that a simple method of lowering unemployment in the United States and other countries with limited bargaining coordination is to reduce the political independence of the central bank. (This finding is consistent across the three sets of regression results that include a central bank independence variable.)
However, there are reasons to question whether these regression results should be taken at face value. As noted earlier, three of the four published regressions follow the methodology in Nickell et al. of including country specific time trends.11 This appears to be even more problematic in this set of regressions as some of the estimated coefficients are both large and and highly significant. For example, a re-estimation of the regression shown in column three (the preferred regression in IMF (2003)) found that Sweden had a time trend of 0.998 annually. Due to the presence of the lagged dependent variables, a time trend of this size implies that Sweden would have seen an increase of 16 percentage points in its unemployment rate over this period, as a result of factors that are beyond the scope of the analysis. (This increase is at least partially offset by the fact that the estimated value of the country dummy for Sweden is -69.4, implying that factors specific to Sweden lower its unemployment rate by 69.4 percentage points relative to the OECD average.)
The article notes in passing that several high unemployment countries experienced sharp rises in unemployment for reasons unexplained by this analysis (page 141 and figure 4.5), but does not explore at all the implication of this finding. If there are real factors that underlie these large time trends towards increasing unemployment, or that explain the enormous differences in the country dummies, then the focus of research should be to discover what they are. In this vein, it is worth noting that most of the country specific inflation terms also take on implausible values. Our re-estimation of the preferred regression in IMF (2003) found that the coefficient of eleven of the country specific inflation terms were larger in absolute value than -6.0. The coefficient for the United States inflation term was the largest at 18.4, implying that a 1.0 percentage rise in the inflation rate is associated with an18.4 percentage point decline in the unemployment rate. In Phillips curve regressions for the United States, a 1.0 percentage point rise in the inflation rate is typically associated with a 2.0 percent decline in the unemployment rate (e.g. Gordon, 1994). The magnitude of the trade-offs between inflation and unemployment, implied by the coefficients in this regression, are far larger than can be considered plausible.
10 The IMF includes a warning against extrapolating results based on panel regressions using measures of national coordination to coordination at the level of the euro area (footnote 13). This warning seems misplaced. While it may be politically more difficult to achieve coordination across the euro zone than within a nation, presumably the economic effects of a given level of coordination would be the similar. In other words, there is no reason to believe that the economic forces affecting labor markets operate differently in the euro zone taken as a whole, than they would in any individual nation. 11 This discussion relies on the estimated coefficients in our replications of the IMF regressions. The study does not publish its estimates for country specific time trends, country specific inflation terms, or country dummies.
12
There is one final point worth noting about the methodology by the IMF. Our earlier assessment (Baker et al 2003) of Nickell et al. (2002) noted the questionable merits of using annual data, given both the expected lags involved in the impact of institutional changes, and the fact that annual measures did not exist for many of these institutions in any case (the annual data are constructed by interpolating). The IMF methodology is vulnerable to this same criticism, although it compounds the problem by including a lagged bargaining coordination variable (one of the interpolated variables) in two sets of published regression results. While the coefficients of these variables are both highly significant, given the nature of the data, it is difficult to have much confidence in these estimates.
In conclusion, the IMF study does not provide much evidence to support the labor market institutions explanation for unemployment. Contrary to the discussion in the text, there are important differences in the estimates across regressions. Furthermore, there are serious methodological problems – most notably implausible estimated values for country specific time trends, country specific dummies, and country specific inflation terms – that further suggest that the IMF results are unreliable.
Assessment Our prior assessment of this literature led us to question the extent to which it supported the
view that labor market rigidities were a primary cause of unemployment. These two additional studies provide little reason to change this earlier assessment. Table 3, which extends the results reported in Baker et al (2003), shows the implied impacts of specified changes in each of the labor market institutions, base on the regression results from six prior studies and the two additional studies discussed in this section.12 Following the approach in Baker et al we focus only on the most supportive results from each study.
Our earlier assessment noted the fact that the coefficients of the labor market institution variables were not always significant, and even when they were, they took widely differing values. The results from these two additional studies reinforce this assessment. Their findings are not entirely consistent with the prior research and increase the already wide range of estimates found in this literature.
For example, while the preferred regression in the IMF study finds that increasing the tax wedge actually lowers the unemployment rate, the tax rate variable was the only labor market institution variable in the prior studies which consistently had a significant positive coefficient. The coefficient on the employment protection legislation variables are consistently positive and significant, but the implied effects on unemployment differ substantially. The same is true of the union density variable, although most of the prior studies examined found that union density either had no effect or even a negative effect on the unemployment rate (Belot and Van Ours 2002, for example). The coefficient for the replacement rate variables is both positive and highly significant, although the size of the estimated effect is substantially smaller than in most earlier research.
This mixed evidence is consistent with the main conclusions of our prior assessment: 1) The wide range of coefficient estimates for the labor market institution variables
does not provide compelling evidence linking these institutions to unemployment. In many cases, these coefficients are insignificant even in the preferred regression within a study. In the cases where the coefficients are generally significant (e.g. the replacement rate or tax wedge variables), the range of estimates is so large as
12 The appendix table in Baker et al (2003) describes the construction of the variables in each set of regressions.
13
to raise questions about the credibility of the results and particularly to undermine their usefulness for policy. Where trade-offs are involved, policy makers need to know more than just the sign of a coefficient; they must also have a reasonable estimate of the expected economic impact of a policy change.
2) Some of the explanatory power of these regressions is attributable to the positive
impact of “good” labor market institutions. The new studies provided limited evidence to reinforce this conclusion. The NS study excludes both active labor market policy and bargaining coordination variables. The IMF study includes a bargaining coordination variable, but not one for active labor market policies. Three of the IMF's four published set of regression results, but not the fourth set used in the IMF's policy simulations, imply greater bargaining coordination will lead to lower rates of unemployment. This is curious because the beneficial effects of bargaining coordination on unemployment seems one of the more robust findings in this literature.
3) The NS and IMF studies contribute new concerns to the list noted in Baker et al.
In the case of NS, the use of the non-agricultural employment to population ratio, instead of the overall employment to population ratio seems difficult to justify given the set of countries and time-period under examination. Also, the finding that increased public sector employment increases total employment almost one to one is somewhat unusual. In the case of the IMF, the use of country specific time trends (following Nickell et al.) is troubling, especially since the economic importance of the estimated value of these trends is quite large. The fact that this study also includes country specific inflation terms, and finds implausibly large effects, provides further grounds for concern.
In our prior assessment, we concluded by citing Blanchard and Wolfers (2000) on the
possibility that the selection of variables and specifications was influenced by the desire to obtain certain results:
“One must worry however that these results are in part the result of economic Darwinism. The measures used by Nickell have all been constructed ex-post facto, by researchers who were not unaware of unemployment developments. When constructing a measure of employment protection for Spain, it is hard to forget that unemployment in Spain is very high … Also, given the complexity in measuring institutions, measures which do well in explaining unemployment have survived better than those that did not.” (p18)
Our assessment of these two new studies suggests that this warning is still well-taken. We present our own analysis of the cross-country data, which serves to underline these reservations, in the next section.
14
B Robustness of IMF results The preceding discussion emphasized the lack of robustness of major empirical findings across a sample of some of the most prominent studies of the relationship between labor-market institutions and unemployment. In this section, we directly test the robustness of the empirical results summarized in one of the most widely read of these studies, published by the IMF in its April 2003 World Economic Outlook. We choose the IMF study because the IMF plays a particularly influential role in advising national governments on economic policy; the IMF's analytical techniques are also straightforward and lend themselves easily to the series of simple robustness tests we present below.13 Table 4 summarizes our first set of results using the IMF data. As a benchmark for subsequent analysis, the first three columns of the table attempt to replicate the IMF's three most important specifications of the relationship between unemployment and labor market institutions.14 The first column, based on the IMF's "variant one," is essentially identical to the IMF's published results; the second two columns, based on IMF variants three and four, are not identical, but are very close to the IMF's published results.15 Ignoring –for the moment– the estimated size of the coefficients and the interaction effects, the three IMF regressions all suggest that more employment protection, higher union density, and higher taxes raise unemployment.16 The IMF's variant four (column three here), however, differs from the first two variants in two important respects: (1) variant four finds that higher benefit replacement rates raise unemployment, while IMF variants one and three find no effect of benefits on unemployment, except through an interaction term with the lagged dependent variable (using euro zone average values for interacted terms) ; and (2) variant four finds no statistically significant role for bargaining coordination, while the first two IMF variants suggest that bargaining coordination significantly reduces unemployment.17 This lack of robustness across the IMF’s results is particularly important since it is their Variant 4 (which finds a significant effect for benefits and no significant beneficial effect for bargaining co-ordination) which is used by the IMF in their simulations showing the impact of past institutional change and of potential reform packages.
13 We are grateful to the IMF for making the data used in their chapter available to us. 14 These are variants 1, 3, and 4 from the IMF's (2003) Table 4.3. 15 The coefficients on the institutional variables across the three IMF regressions are not directly comparable for two main reasons. First, the second and third columns include a lagged dependent variable, which is not the case in the first column. To put the institutional coefficients in the second and third column on a roughly comparable basis, divide each coefficient in columns two and three by one minus the lagged dependent variable. Second, the second column includes separate interaction terms between the lagged dependent variable and bargaining coordination, and the lagged dependent variable and the benefit replacement rate. Third, other interaction terms also differ across specifications. 16 We present all three specifications here because the IMF defends each as a reasonably good representation of reality. In the case of variant one, the IMF writes: "...this very simple model does a good job in explaining unemployment variation across countries (although not across time)," adding in a footnote that "...if one abstracts from fixed effects, the adjusted R2 remains at 0.56, confirming that heterogeneity in institutions alone explains a good deal of heterogeneity in unemployment rates." (IMF, 2003, p. 148) Our reading of the chapter is that the IMF's preferred specification is variant three, but the IMF produces variant four, because the interactions between two institutions and the lagged dependent variable make it impossible to use variant three in subsequent policy simulations. 17 Our interpretation of variant four differs from that of the IMF, which argues that: "Despite inevitable quantitative changes in the estimated coefficients for bargaining centralization and the benefit replacement ratio, the estimated effects of the other institutions and the macroeconomic variables are not significantly different from those in ... variant [three]." (IMF, 2003, note to Table 4.3, p. 147, emphasis in original)

15
The fourth column of Table 4 presents the results from an alternative regression, based on a composite of specifications used in earlier research in this area.18 The new specification differs from the IMF variants in several important respects. First, the new regression includes common time dummies, rather than country-specific time trends. We include a common set of time dummies in order to remove global shocks (good and bad) and common business-cycle effects over the 1960-98 period. As with other researchers, we see little theoretical justification for imposing a common time trend, and even less justification for allowing for a separate time trend for each country.19 To the extent that unemployment in OECD economies is trended over time, we see the role of this kind of modeling to be precisely to explain such a trend not to control for it. In the same spirit this kind of modeling should seek to use institutions (and other economic variables) to explain differences in trends across countries. A common set of time dummies allows us to control for common global shocks, leaving national institutions to explain deviations from unemployment from the average pattern implied by these shocks. A common time trend or country-specific time trends leaves institutions (and other variables) only the task of explaining deviations from the typically rising trend in unemployment, which is of course the motivation for much of the research in this area.20 A second important difference is that the new regression in column four uses a different set of institutional variables and interactions than were used in the IMF's three variants. The new regression incorporates slightly different versions of the variables for union density, the benefit replacement ratio, and the tax wedge.21 While the differences are minor, typically involving changes to a few countries in a few years, we believe that the new versions of these variables better capture the variations in the institutional variables The new regression also includes a variable for the duration of benefits and two new interaction variables –one interaction between benefit duration and the benefit replacement rate, and another between the tax wedge and bargaining coordination. Other researchers have argued that benefit duration is at least as important as the replacement ratio (see Layard, Nickell, and Jackman, 1991, for example). The interaction between benefit duration and the benefit replacement rate can capture tradeoffs between these aspects of benefit generosity. In addition the interaction between the tax wedge and bargaining coordination, we believe, is a better way to measure the economic interplay between tax reform in unionized economies than the IMF's interaction between the tax wedge and union density. On the other hand our new regression also excludes several interactions used in various versions of the IMF's regressions. These include the interactions between: employment protection and union density; employment protection and benefit replacement; employment protection and the tax wedge; union density and benefit replacement; union density and the tax wedge; and central bank independence and bargaining coordination.
With the new specification, only one of the direct institutional variables is statistically significantly different from zero –the tax wedge, which is significant only at the 10% level. Minor
18 The specification draws on early work reviewed in the preceding literature review. The specific regression in column four follows Baker et al (2003), Table 6, column 3, closely. 19 See Gregg and Manning (1997). 20 We also use a common term for the change in the consumer price index (CPI), rather than country-specific CPI terms. Much of the interest in this kind of research is precisely on the way in which national institutions change the nature of the tradeoff between inflation and unemployment in particular countries. The argument that the data reject the common CPI (or time trend term) is not particularly persuasive since the data almost certainly reject common coefficients for the institutional variables (except in the case where the institutional results themselves are poorly defined). 21 See the data appendix for details.
16
changes to a few variables and reasonable changes in specification consistent with earlier research, therefore, appear to produce results that show no meaningful relationship between labor-market institutions and unemployment in a framework that is otherwise close to the one employed by the IMF in its World Economic Outlook analysis. The fifth column of Table 4 shows an alternative test of the robustness of the IMF specifications. To the extent that the relationships posited in the original IMF model are true in the levels of unemployment and labor-market institutions, these relationships should also hold in changes in unemployment and labor-market institutions.22 Column five shows the results of estimating the IMF's variant four (in column three of this table) in first differences. In this specification, only union density and bargaining coordination have a statistically significant effect on unemployment. Employment protection, benefit replacement, the tax wedge, and the interactions terms have no statistically discernible impact on unemployment. The last column of Table 4 shows an additional test of the robustness of the IMF's main specifications. This last regression is identical to the IMF's variant four, except that it uses the employment-to-population rate, rather than the unemployment rate, as the dependent variable. The employment equation offers a potentially important alternative perspective, since unemployment may decline simply because the unemployed have become discouraged, abandoned their job search, and dropped out of the labor market. Weaker institutions may encourage this dropping out, and stronger institutions will then be associated with more unemployment, but not for conventional rigidity reasons23. If institutions cause unemployment through the rigidities they impose, they should do so by limiting job opportunities. In this case, institutional variables should do a good job of explaining the employment rate.
Our results show that higher levels of union density and higher tax wedges appear to lower employment rates by statistically significant margins (even after factoring in the employment-increasing effects of interacting the two variables). High levels of bargaining coordination also appear to contribute to lower employment (again, even after factoring in the nonlinear bargaining coordination term and the interaction of bargaining coordination with central-bank independence), although the direct bargaining coordination effect is only statistically significant at the 10% level.24 In the same regression, employment protection and benefit replacement rates, which were both statistically significant determinants of the unemployment rate in the IMF's variant four (column three), have no impact on employment rates. Table 5 conducts an additional set of robustness tests, focusing specifically on the IMF's variant four, which served as the basis for their policy simulations in the WEO chapter. For ease of comparison, the first column of the table reproduces our replication of the IMF's variant four. The second column of the table shows the results of the regression in column one, with only one change. This second regression adds a highly significant interaction term for union density and
22 The first-difference specification may also act as a crude guard against problems arising from the possibility that the series regressed here are not stationary and not cointegrated. If the variables follow a random walk with drift, differencing would yield stationary series. The IMF does not present any tests of stationarity or cointegration, but standard theory suggests that the coefficient estimates presented in the WEO and here would be invalid if the series are not stationary or cointegrated (see, for example, Davidson and MacKinnon (1993), Chapter 10). Junakar and Madsden (2004) and Baccaro and Rei (2004) discuss this issue in the context of OECD unemployment. 23 See Blondal and Pearson 1995 24 In the institutional setting prevailing in Europe at the end of the 1990s, a move from European to US levels of bargaining coordination, for example, would raise employment rates in the Euro area by about 0.7 percentage points. From the coefficients in Table 3 and the data for 1998 in Table 1, the calculation is: -2.875*(2.23-1.00) + 0.341*(4.97-1.00) + 2.546*(2.23-1.00)*0.923.

17
bargaining coordination, a variable that appeared in the IMF's variant one, but which was dropped from subsequent regressions. The IMF explains the exclusion of this term and other interactions terms (for employment protection-benefit replacement, employment protection-tax wedge, union density-benefit replacement, and benefit replacement-tax wedge) as reflecting a lack of robustness across alternative specifications, although the union density-bargaining coordination term remains highly significant in column two.25 The addition of the interaction term has relatively little impact on the coefficients for employment protection, benefit replacement, and the tax wedge. The new term, however, lowers the effect of union density by about one-fourth and more than doubles the unemployment-reducing impact of bargaining coordination (the absolute value of the coefficient on bargaining coordination increases from -0.9 to -2.1, while the countervailing squared bargaining coordination term falls from about 0.46 to about 0.35). The union density-bargaining coordination interaction term also lowers the magnitude and eliminates the statistical significance of the central bank independence variable.
The final regression in Table 5 simply drops the insignificant central bank independence term (and the marginally significant central bank independence term) from the regression in column two. Dropping the two variables has only a small quantitative impact on most of the institutional variables in the regression, but does seem to cause a large increase in the economic impact of employment protection (from 1.2 to 1.6) and bargaining coordination (from -2.1 to -2.8). The inclusion of just one highly significant interaction term (especially when two other terms, one insignificant, the other only marginally significant are excluded), has an important impact on the estimated economic effects of key labor institutions. As we shall see later, these changes in the estimated coefficients can produce very different conclusions about the expected effects of labor-market reforms in Europe. Cross-country claims A common conclusion of the research reviewed above, and one probably shared by the IMF (2003), is that the IMF-style models may not succeed well in explaining the rise over time in unemployment in individual OECD countries, but such models do succeed in explaining broad differences in unemployment rates across countries. Table 6 displays the results of a simple test of this claim for the 1990s. Following the example of Nickell (1997), we've organized the IMF's annual data into two periods (1990-94 and 1995-98). For each country in each period, we've calculated the average value of the unemployment rate and all independent variables and used these averages in a regression of unemployment against the IMF's main institutional variables and the change in the consumer price index (as a proxy for macroeconomic conditions). We estimated the equation using generalized least squares without country fixed effects.
To the extent the institutions explain differences in unemployment rates across the OECD, the institutional variables should be statistically significant in the regressions in Table 6. In column one, which uses only the institutional variables contained in the IMF's three main variants, none of the institutional variables appears to have any ability to explain unemployment across countries. Column two adds three institutional variables –benefit duration, union coverage (as opposed to union density), and active labor market policies– which were not included in the IMF's regressions, but have been considered important by other researchers, including Nickell (1997). Again, none of the institutional variables appears to predict unemployment across the OECD economies in the 25 The other interactions, as the IMF reports, are not statistically significant when included in the regression in column two of Table 3.
18
1990s. These two regressions are, essentially, the multivariate counterparts of the bivariate relationships illustrated in Figures 2 to 8. The multivariate findings appear to confirm our conclusions, based on the bivariate plots, that differences in institutions do not explain differences in unemployment rates across the OECD. Assessment In this section we conducted some further experiments with the IMF and closely related data sets. As with our look across major studies in the field, we believe that our re-analysis of the IMF data suggests that policy makers should proceed with caution before attempting to combat unemployment by implementing reforms based on moving European economies toward US-style labor-market institutions. First, perfectly reasonable changes to the core IMF specifications suggest that the magnitudes of any benefits from such reforms are poorly defined. The apparently wide margin of error of the estimates makes it difficult for policy makers to weigh the potential benefits against the welfare costs of reforms. Second, reasonable changes to the core IMF specifications often eliminate altogether the apparent unemployment impacts of the labor-market institutions studied by the IMF. Under these alternative specifications, the IMF's proposed reforms yield no clear benefit and may impose significant social and efficiency costs. In some cases, reasonable specification changes reverse the measured effect on unemployment of key labor-market institutions. We believe that such unrobust results are indicative of the profound difficulties with the overly simplistic models of institutions that have been used to date in most of the empirical literature. Even the most sophisticated of the current empirical models of institutions fail to capture the complex ways in which institutions "hang together" in practice.26 IV. The Pay Off to Labor Market Reforms
The analysis of the impact of labor market institutions on unemployment is frequently taken to justify the advocacy of comprehensive labor market deregulation in Europe. In this section we first examine the simulations of the effects of labor market reforms provided by the IMF. We then derive, from the OECD’s comprehensive assembly and classification of reforms, an indicator of the “volume” of labor market reforms carried out by individual OECD countries in the 1990s and compare this to the OECD’s own estimates of the decline in structural unemployment over the 1990s. Finally we briefly examine two of the spectacular examples of labor market improvement since the mid-1980s –Ireland and Netherlands to see what light they throw on the role of reforms. Simulating the effects of reforms The IMF uses its “Variant 4” (see our Table 4, column three) to simulate the effect on unemployment in the Euro area of three reforms replacing European levels of social protection with US levels – namely reduction in the replacement ratio to US levels (a fall of 22 percentage points), reduction in EPL (the index falling to less than one tenth of its original level) and reduction in labor 26 See Freeman (2000) for a theoretical discussion of the ways in which labor-market and other institutions interact in practice.
19
taxes. According to the IMF simulations, these three changes would reduce European unemployment by 3 ¼%. When we tried to replicate the IMF’s results using their estimates we actually got a rather larger effect (about 5%), mainly because of a bigger impact for taxation. There are two other features of the results (shown in table 7 below) which seem to strengthen the IMF’s conclusions. Firstly reducing union density to the US level would seem to have a further effect in reducing European unemployment. Secondly a reduction in union co-ordination would bring a further large reduction in European unemployment (though the effect is not statistically significant).
However, in the light of the discussion in the previous section it is not surprising that these estimated effects of reforms are not at all robust. Table 7 also shows the result of our slight modification of the IMF’s main specification for simulations to include the highly significant interaction term for union density and bargaining co-ordination, and to exclude the insignificant central bank independence term. The main effect is to reverse the impact of moving to the very low US levels of bargaining co-ordination. This change now has a very large and significant effect in increasing unemployment, nearly canceling out the effects of reductions in EPL and benefits. Finally we present the results of our own alternative specification (which includes benefit duration and makes some other changes in specification mainly in the direction of simplification – see above). Here the coefficients are mainly insignificant, and were they taken literally would imply a major increase in European unemployment stemming in the main from the fall in bargaining coordination.
The IMF also claims that a change in the institutions (in the direction of tighter labor market regulations) was responsible for a substantial part of the rising unemployment trend in individual countries. France seems to fit the argument best of the three major Euro-zone countries, with around 40% of the rise in unemployment since 1970 explained in this way (see IMF figure 4.5.). So what would happen if France switched over to the US labor-market configuration? According to the first panel in Table 8, French unemployment would be totally eliminated (with EPL and taxation doing most of the work, but reduced benefits contributing as well). However on our specification the net effect is much smaller and only taxation has a large significant effect.
Finally an alternative “model” to follow, rather than deregulating along US lines, might be the Netherlands, which has stood out as a European success story. Using the IMF’s preferred model for simulation, a European move to the institutional arrangements in place in the Netherlands at the end of the 1990s would raise unemployment across the Euro area (table 7 bottom panel). However varying this model slightly27 reverses the result – a substantial fall in unemployment from adopting Dutch institutions, with greater co-ordination playing the major role. Similarly variable results are shown in table 8 for simulations showing the effect of Netherlands adopting US institutions.
The main conclusion from this section is that the lack of robustness in the estimates makes it potentially highly misleading to use models, such as those estimated by the IMF, to predict the unemployment effects of particular policy reforms. The Effects of Structural Reform The IMF approach reviewed above was to simulate the impact of policy changes on the basis of the estimated effect on unemployment of the relevant policy variables. An alternative approach is to 27 Including an interaction term between union density and bargaining co-ordination and omitting central bank independence as shown in column 3 of table 3 above.
20
examine directly the labor market reform packages which have been implemented and then compare them to unemployment outcomes. The most comprehensive enumeration of reforms was carried out by the OECD as part of its follow up program on Implementing the Jobs Strategy. Their 1999 survey provide an extremely comprehensive and careful listing of changes in unemployment benefits, EPL, minimum wages and the like, focused on the period from 1995 but with summary data from the earlier 1990s. The OECD listed all the reforms suggested for each country in its labor market reviews, developed a weighting system for assessing their significance, and then analysed whether the reform had been fully implemented, partially implemented, ignored, or even flouted in the sense that policy had moved in the “wrong” direction.
The OECD then constructed a measure showing the degree to which countries had followed their suggestions (so for example, one policy proposal fully adopted , one policy partially adopted (counting as 50%) and one ignored would count as an average “follow-through” rate of 50% - assuming the three policies were of equal significance. The OECD found a significant positive relation between this index of compliance and the extent to which the NAIRU fell in the 1990s (1999 figure 2.7). But such a measure ignores the very different number of suggestions for labor market reforms that countries received from the OECD (varying from 4 in the case of USA and Australia to 21 for Finland and 23 for Germany). The effect of reforms on unemployment should presumably depend on how many were implemented, not simply the proportion of OECD suggestions which were followed. Accordingly we constructed an alternative index showing the “volume” of reforms carried out, which is in effect the OECD’s compliance rate multiplied by the number of reforms advocated by the OECD (see Data Appendix which describes the weighting system used to reflect the significance of the various types of reform measures). We limited our index to reforms connected with the benefit system, employment protection and wage bargaining as these constitute the core of the program for Labor Market Deregulation (see the Appendix).
Figure 9 below compares this index of labor market deregulation in the 1990s with the OECD’s own estimate of change in the NAIRU over the same period. It is clear that there is no significant relationship between these measures of deregulation and the change in unemployment across OECD countries (the t value from a regression is 0.3) 28. Obviously Ireland is an extreme case with the most dramatic fall in the NAIRU accompanied by rather little labor market reform. However even if Ireland is excluded the impact of reforms on structural unemployment still appears very weak (t value of 1.3, significant only at the 20 per cent level and with only about one tenth of the variance in the NAIRU change being “explained”). It appears that the changes in structural unemployment which have occurred in the 1990s are not closely linked to the extent of labor market reform. Two Success stories – Netherlands and Ireland Netherlands and Ireland are two outstanding success stories in European unemployment experience since the mid-1980s. The IMF highlights (on the basis of their simulations using variant IV of their unemployment model), the roles of labor taxation in the Netherlands and replacement ratios in Ireland (p141). The fragility of using these estimates to draw strong policy conclusions is emphasized by the example of Ireland. When we used the coefficients from the IMF-style equation
28 The Fondazione Debeneditti has also assembled a mass of information on European Labor Market reforms which covers the period from 1985 onwards (see Bertola and Boeri 2002): some simple experiments using an index of reforms based on a crude count of reforms from this dataset yielded a similar conclusion of no strong relationship with NAIRU changes.

21
we reported in Table 4 (IMF Var4) this suggested that the long-term effect on unemployment from the changes in labor market institutions over the period 1980 to 1998 was to reduce Irish unemployment by a little over 4% - a significant contribution to the fall in unemployment there, with falling unionization playing a strong part. However when we repeated the exercise using our preferred variant (column 4 in table 4) institutional changes contributed nothing at all to the improvement in joblessness. It is obviously very hazardous to draw conclusions about the impact of such reforms for such shaky estimates. The OECD suggested in the mid-1990s that the Netherlands pursue a large number of “reforms” to labor market institutions. Analysis of the Dutch response is striking. Some of the OECD’s recommendations have been partially or fully carried out (including tightening conditions for receipt of unemployment benefits and sickness benefits and relaxation of restrictions on fixed term contracts and use of agency labor) so that the Netherlands scores quite highly in terms of the extent of labor market reforms (see figure above). But other OECD recommendations, notably cutting benefit replacement rates and duration and modifications to the minimum wage and the system of extending collective agreements, were not acted on (see OECD 1999). In any case, leading contributors to the debate on European unemployment are quite clear that the most important factor behind the decline in Dutch unemployment has been the wage bargaining system: “…in the case of the Netherlands, much informal evidence points to a change in the attitudes of unions as the main factor behind wage moderation: By the early 1980s, the large increase in unemployment led to a national agreement, known as the Wassenaar agreement, in which the unions recognized the need for wage moderation in exchange for a number of concessions from both firms and the state (in particular more generous early retirements and a shorter workweek.) Most observers agree that this agreement played a major role in the reduction of unemployment” (Blanchard and Philippon 2003 p 27).
This echoes the conclusion of Nickell and van Ours (2000 p 173) “Since 1983, the unions in the Netherlands have been very co-operative and they operate within a highly co-ordinated wage bargaining system. As a consequence when the labor market becomes tight, there is no excessive upward pressure on wages and this enables a low level of unemployment to be maintained”.
Ireland has shown an even more spectacular decline in unemployment and estimated NAIRU since the late 1980s than the Netherlands (see Figures 1 and 9). That the early years of expansion could be achieved without much inflationary pressure was not so surprising – unemployment was still very high and additional labor supply was available from the UK (see Blanchard’s comment on Honahan and Walsh 2002). However, the continuation of wage moderation after unemployment had fallen sharply has been more striking and it seems highly likely that the series of co-ordinated social partnership agreements, involving very modest pay increases in return for some tax cuts played a strong supporting role. The outcome was a very slow rate of increase of real wages (hardly more than 1% per year) despite very rapid increase in productivity. This wage moderation was the more striking since profitability was pushed to very high levels as relative unit labor costs in manufacturing halved as compared to Ireland’s competitors (see Glyn 2003 for more discussion). Honahan and Walsh’s authoritative study notes that “most observers regard the coincidence of timing of the reversal of the deteriorating trend in competitiveness with the new approach to pay bargaining as suggestive that the latter did pay dividends” (2002 p 33) and they suggest that the agreements were one of the key elements in the
22
Irish boom. Even the skeptical OECD noted in its 1997 Economic Survey of Ireland that “The central wage agreements have helped to reduce industrial unrest; the number of days lost to labor disputes was the lowest since 1923. Moreover, they may have had a positive effect in moderating pay settlements during a period of rapid growth” (p.91).
Ireland had a relatively deregulated labor market to begin with and OECD did not call for many labor market reforms, and those that were carried through could not possibly explain the huge fall in the NAIRU. Honahan and Walsh report that “there was no radical reform of the Irish welfare system in the 1990s to which the dramatic improvement in the labor market can be attributed” (p 35). There are dissenting voices but it is widely accepted that a significant role should be assigned to the co-ordination of bargaining for sustaining the fall in unemployment in the context of a very strong boom and that structural reforms of the labor market of the orthodox type played very little role.
The analysis of the improvement of employment in Netherlands and Ireland highlights the importance of the wage bargaining system and it might be expected that the IMF and other international bodies would seek to learn the lessons of such successes.
The IMF paper does
acknowledge (2003 p 146) that" wage moderation may have transpired though increased use of social pacts or wage norms" but suggests that to be sustainable such moderation probably needs other structural reforms. This echoes the conclusion of the IMF’s early analysis of European unemployment
which argued “Whilst from a purely economic viewpoint the first-best policy might be to remove the institutional arrangements, such as union monopoly power and job protection legislation, that underpin the bargaining power of insiders, it is usually politically difficult to do so
instantaneously. In this situation, income policies may constitute a useful second-best policy to help ensure that rising demand translates into increasing employment rather than rising real wages for the insiders, while the pertinent reforms are progressively implemented” (IMF 1999 p 116).
Thus far from being discussed as an alternative approach to labor market deregulation, coordinated bargaining is deftly relegated to a temporary holding operation whilst the real business of dismantling the institutional underpinnings of such coordinated labor markets is set in train.
V. Conclusion The rise in the unemployment rate in many major economies over the last three decades is probably the most striking economic phenomena of this era. Economists have struggled to find a compelling explanation for this development. There is a great temptation to blame labor market protection – economists generally believe that interferences with smooth market adjustments lead to less than optimal outcomes. Therefore, it is understandable that they would look to institutions such as employment protection legislation, unemployment benefit generosity, or unions as the villains in this story. This paper critically assesses the evidence for this widespread belief that rigidities generated by labor market institutions lie at the heart of the unemployment crisis. We conclude that the evidence is far from conclusive. Expanding on an earlier review of recent literature, we find that the results of prior studies are in many cases problematic and often contradictory. Many of the results that report significant relationships between unemployment and labor market institutions appear dubious – for example finding large country specific trends in unemployment rates – which would preclude the regression results from being taken literally in other contexts. The extraordinarily wide range of estimates of the economic impact of the labor market institutions
23
leave these estimates of relatively little use for policy purposes, even when the measured effects are found to be statistically significant. In order to intelligently assess the merits of labor market reform, policy makers need a fairly precise range of estimates of the benefits to be expected from reducing specific labor market protections (e.g. employment protections or replacement rates). These benefits can then be weighed against the cost of weakening labor market protections both in the form of reduced security for workers, and also in some cases the reduced labor-market efficiency.29 This literature clearly does not provide such a basis. Furthermore, our general skepticism regarding the quality of the data as well as our own efforts at analyzing them strongly suggests that these cross-country results are highly unreliable. At the most basic level, it is apparent in bivariate regressions that there is no simple relationship between any of the labor market institutions and the unemployment rate. While it is possible to construct multi-variate regressions that find significant relationships between various labor market institutions and the unemployment rate, it is also easy to construct equally plausible regressions that do not find them. In short, the econometric evidence on this issue is at best inconclusive. It is certainly not the sort of evidence that governments should use for making public policy.
Another consistent note throughout the literature on the labor-market effects of labor-market protections is the difficulty surrounding the appropriate quantitative measures of labor-market institutions. Academic researchers cited here, together with the OECD and ILO, have made important contributions to improving such measures, but much work remains to be done. Labor markets and the institutions that shape and regulate them are highly complex. Quantitative measures that will be useful enough to shed light on the real-world workings of key labor-market institutions will have to standardized enough to be meaningful across countries, yet flexible enough to factor in important national differences. Balancing such considerations will not be easy and will undoubtedly involve creation of multidimensional measures of labor-market institutions. Some of the necessary advances can come from ongoing improvements within and continued coordination across national statistical agencies. Some of the needed progress, however, will only come from greater investment in data gathering, analysis, and dissemination. Given the obvious impact on workers of reducing labor market protections, it would seem incumbent upon advocates of labor market deregulation to confirm that the quality of the data are acceptable, that the regression tests are robust, and that both the costs and benefits of deregulation are taken in to account before announcing policy recommendation. A review of the literature on this topic and the recent experience of OECD nations clearly establish that there is not a single path to success, defined as achieving low rates of unemployment or high rates of employment. Countries with very different institutional frameworks have managed to achieve unemployment rates substantially below the OECD average. While the United States and United Kingdom stand out as countries that have achieved low rates of unemployment with relatively weak labor market protections, the OECD also includes examples of countries that have achieved comparable results – Austria, Denmark, Netherlands, Norway, and Sweden – with high levels of labor-market protections. A complete and convincing analysis of the relationship between labor-market institutions and unemployment must be able to explain the success of these more-regulated countries as well. One result that appears relatively robust throughout much of the literature on labor-market institutions and unemployment, including detailed analysis of individual countries, is that the mode
29 Some labor market protections, for example unemployment benefits may increase labor-market efficiency by allowing workers with specific skills the time to search for a job that will fully utilize their skills, rather than taking the first job that it is available.
24
of bargaining coordination appears to have a substantial impact on the unemployment rate. Unfortunately, this finding is largely neglected in the research within the framework reviewed here, including the work by the IMF. Research on the link between bargaining coordination and unemployment, in particular research on how policy can exploit the beneficial effects of bargaining coordination in countries that currently have only low or moderate levels of coordination, seems like an especially fruitful area for further research. As noted before, even if reducing labor-market protections is an effective way to lower unemployment, such a course of action would still entail substantial costs to workers. Increasing bargaining coordination, in contrast may allow for lower unemployment without the same welfare costs for workers. The bulk of the evidence reviewed here does not support the conventional view that high-unemployment countries should restructure their labor-market institutions along the lines of the US model. As noted earlier, countries that have followed the US path have not necessarily seen their unemployment rates fall, a fact that should serve as a caution to other countries that might be tempted to follow the US model. At the same time, many countries have managed to match US performance, without replicating US institutions. While constructing precise formulas for successful alternatives is difficult, the existence of alternative success stories shows that alternative paths are possible.
25
References Agell, J.(1999) “On the Benefits from Rigid Labor Markets: Norms,Market Failures and Social Insurance Economic Journal 109 143-164 Baccaro, L & D.Rei (2004) “Institutional Determinants of Unemployment in OECD Countries: A Time Series Cross-Section Analysis (1960-98) draft ILO, Geneva. Baker, D. , Glyn A., Jowell D. & Schmitt, J. (2003) “Labor Market Institutions and Unemployment: A Critical Assessment of the Cross-Country Evidence”, in David R. Howell, ed., Fighting Unemployment: The Limits of Free Market Orthodoxy, OUP forthcoming, '04 (available on CEPA website) Barr, N. (1998) The economics of the Welfare State, 3rd ed OUP Bertola, G. & T.Boeri (2003) “Product Market Integration, Institutions and the Labor Markets,” mimeo. Belot, M. and Van Ours. J. 2000. “Does the Recent Success of some OECD countries in lowering their unemployment rate lie in the clever design of their economic reforms?” IZA Discussion Paper No. 147. Bertola, M, Guiseppe, Francie D. Blau, and Lawrence M. Kahn. 2001. “Comparative Analysis of Labor Market Outcomes: Lessons for the United States from International Long-Run Evidence”. In Alan B. Krueger and Robert Solow, ed., The Roaring Nineties: Can Full Employment be Sustained? New York: Russell Sage Foundation. Blanchard, O & J. Wolfers. 2000. “The Role of Shocks and Institutions in the Rise of European Unemployment: the Aggregate Evidence.” The Economic Journal 110 (March): C1-C33. Blanchard, O and Philippon T. (2003) “The decline of rents and the rise and fall of European Unemployment” mimeo on Blanchard’s website. S.Blondal & M.Pearson “Unemployment and other Non-Employment Benefits” Oxford Review of Economic Policy 11.1 136-169 Calmfors, L.& Driffill J. 1988. “Centralisation of Wage Bargaining, Corporatism & Macroeconoic Performance” Economic Policy 6. Davidson, R. & McKinnon J.. 1993. Estimation and Inference in Economics. Oxford: Oxford University Press. Elmeskov, J. Martin J. & S.Scarpetta 1998 “Key Lessons for Labor Market Reforms: Evidence from OECD Countries Experience.” Swedish Economic Policy Review 5(2) 205-252.

26
Fitoussi, Jean-Paul, D. Jestaz, E. Phelps, and G. Zoeg.a, 2000. ”Roots of the Recent Recoveries: Labor Reforms or Private Sector Forces?” Brookings Papers on Economic Activity 1. 2000. Freeman , Richard B. 2000. The US Economic Model at Y2K: Lodestar for Advanced Capitalism? NBER Working Paper 7757 (June). Glyn, A. (2003) “ Labor Market Success and Labor Market Reform: Lessons from Ireland and New Zealand” in in David R. Howell, ed., Fighting Unemployment: The Limits of Free Market Orthodoxy, OUP forthcoming, '04 (available on CEPA website) Gordon, R.J. 1994. "Inflation and Unemployment: Where is the NAIRU?" Paper presented to the Board of Governors, Federal Reserve System Meeting of Academic Consultants, December1, 1999, Washington, D.C. Gregg, P. & Manning, A.. 1997. "Labour Market Regulation and Unemployment," in Dennis J. Snower and Guillermo de la Dehesa, eds. Unemployment Policy: Government Options for the Labour Market (Cambridge:Cambridge University Press). Hall, P. & D.Soskice (2001) “An Introduction to Varieties of Capitalism” in Hall and Soskiced (eds)Varieties of Capitalism: The Institutional Foundations of Comparative Advantage, Oxford OUP. Howell, D. (2003) , ed., Fighting Unemployment: The Limits of Free Market Orthodoxy, OUP forthcoming, '04 (available on CEPA website) Honahan, P. & Walsh B. “Catching up with the Leaders: The Irish Hare” Brookings Papers on Economic Activity 2002.1 1-57 IMF, 1999. “Chronic Unemployment in the Euro Area” World Economic Outlook April pp. 88-111. IMF, 2003. “Unemployment and Labor Market Institutions: Why Reforms Pay Off,“ World Economic Outlook April pp. 129-150. Junakar, R. & J.Madsden “Unemployment in the OECD : Models and Mysteries, IZA DP no 1168 Institute for the Study of Labor, Bonn. Layard, R., Nickell, S. Jackman R. (1991) Unemployment, OUP. Nickell, Stephen. 1997. “Unemployment and Labor Market Rigidities: Europe versus North America”. Journal of Economic Perspectives, Summer, Vol. 11, No. 3, pp. 55-74. Nickell, S, L.Nunziata, W.Ochel, G.Quitini. 2001, 2002. “The Beveridge Curve, Unemployment and Wages in the OECD from the 1960s to the 1990s,” (CEP, LSE: London various versions) published in P.Aghion et al (eds) Knowledge, Information and Expectations in Modern Macroeconomics Princeton.
27
Nickell, S & Van Ours, J.(2000) “The Netherlands and the UK: a European unemployment miracle?” Economic Policy April 137-175 Nicoletti, G. and S. Scarpetta. 2002. "Interactions between product and labour market regulations: do they affect employment? Evidence from OECD countries," Paris: OECD Economics Department. OECD, 1994, OECD Jobs Study, Evidence and Explanations, Part I: Labor Market Trends and Underlying Forces of Change. Part II: The Adjustment Potential of the Labor Market. OECD. Paris. OECD. Paris. ______. 1995. OECD Jobs Study, Taxation, Employment and Unemployment. OECD, Paris. ______. 1997. “Economic Performance and the Structure of Collective Bargaining”. OECD Employment Outlook, July. 1997. Implementing the OECD Jobs Strategy: Member Countries’ Experience. ______. 1999. “Employment Protection and Labor Market Perfomance,” OECD Employment Outlook, June. _______1999 Implementing the Jobs Study OECD, 1999. OECD Employment Outlook, chapter 2: “Employment Protection and Labor Market Performance.” OECD, 2002. Benefits and Wages: OECD Indicators. Soskice, D. 1990. “Wage determination: the changing Role of Institutions in Advanced Industrialised Countries.” Oxford Review of Economic Policy. 6(4) 36-61. Van Poeck A. & A. Borghuis (2001) “ EMU And Labor Market Reform” World Economy 1327-1352.

28
Data Appendix Data Set for Regressions The main source of data is the data set kindly supplied to us by Xavier Debrun of the International Monetary Fund and used to produce Chapter 4 of the IMF's April 2003 World Economic Outlook (WEO). The IMF data, in turn, have updated through 1998 a database compiled by Steve Nickell and Luca Nunziata and covering the period 1960 to 1995 (available at the Centre for Economic Performance web page, http://cep.lse.ac.uk/). We have made several modifications and additions to the IMF data. We have: (1) added an alternative series from the OECD measuring the benefit replacement rate to complement the existing IMF series; (2) added a series from the OECD proxying the duration of unemployment benefits (based on the ratio of benefits available after the first year to benefits available in the first year of unemployment); (3) added an alternative series for union density, based on review of OECD and national data and used in our earlier research (see Baker, Glyn, Howell, and Schmitt, 2004), which implies small changes to some observations in the 1996-1998 period; (4) added two alternative series for the tax wedge, based on using a different procedure to update the Nickell and Nunziata series –the first updates the Nickell and Nunziata tax wedge based on changes in the overall tax share of GDP, the other based on changes in the sum of individual (income) tax, social security contributions (employer and employee), payroll taxes, VAT, sales taxes, excise taxes, and customs duties, all over GDP (both from OECD data); (5) added a series based on OECD data on the share of GDP spent on active labor market policies (ALMPs) in the years 1985-1998; and (6) added a series with the employment-to-population rate, based on OECD data. Index of Labour Market Reforms. The OECD’s very substantial work on Implementing the Jobs Study (1999) lists five areas of labour market reform: including unemployment and non-employment benefits (12 sub-sections including replacement rates,duration,eligibility), wage formation (6 sub-sections including bargaining decentralization, minimum wages) and EPL and working time arrangements (10 sub-sections including authorization for dismissals, constraints on part-time work). They also include Active Labour Market Policies and the Tax Wedge. We did not include the latter two areas in our analysis. ALMP does not really fall in to the heading of Labour Market Deregulation (its “active” nature reflects the need to overcome market failures rather than widening the scope for market forces). The overall tax wedge, whilst it may be important for employment, reflects so many diverse influences that it can hardly be considered as determined primarily on labour market grounds and it seems particularly arbitrary to examine it in relation to the rather few countries on the receiving end of OECD suggestions for wedge reduction. We did, however, include in our analysis two minor elements classified under the tax wedge which were targeted reductions in social insurance or taxation for low income earners as these seem so closely tied in with the benefit system and are explicitly aimed at increasing wage flexibility by “making work pay”. The importance of each of the 30 policy sub-categories was weighted following the OECD’s rating by their importance (we used the numerical version of this reported by Van Ploek and Borghijs 2001 with minor modification). The response to the OECD’s suggestions (weighted 1.0 for “sufficient action”, 0.5 for “more action needed, 0 for “no action” and -0.5 for “opposite action”) were taken from OECD’s 1999 Appendix tables. A country which had been recommended to implement every one of the 30 policies and which had fully carried them out would have an index of 1.00. Thus a low number for the index reflects either few recommendations or a low rate of compliance.

29
TABLE 1 Summary of labor-market institutions, 1998
OECD Nether- United Europe France Germany Italy Spain lands States Unemployment (1998) 9.2 11.5 8.9 11.9 15.4 4.2 4.5 Unemployment (2002) 7.0 8.8 8.6 9.0 11.3 2.8 5.8 Employment protection 1.22 1.50 1.41 1.41 1.62 1.23 0.10 Union density 29.6 10.1 24.3 37.3 18.0 20.0 13.9 Bargaining coordination 2.01 1.70 2.50 2.30 2.00 3.00 1.00 Benefits Replacement rate 45.9 58.5 35.6 43.4 63.5 70.2 28.5 Duration 0.541 0.465 0.763 0.033 0.290 0.616 0.214 Labor tax wedge 55.7 69.0 51.5 69.3 45.8 47.0 48.9 Active labor market policies 0.127 0.113 0.141 0.094 0.045 0.382 0.039 Notes: Standardized unemployment rates for 2002 from OECD, www.oecd.org; remainder of data from authors' analysis of IMF labor-market-institutions data base, with minor modifications described in Appendix. Unemployment is percent of labor force. Employment protection is an index from 0 to 2, with higher numbers indicating greater protections. Union density is the percent of employed workers who are members of unions. Bargaining coordination is an index ranging from 1 to 3, with 3 indicating the greatest degree of coordination. The benefit replacement ratio is the average first-year unemployment benefit level as a percentage of average before-tax earnings. Benefit duration is an index ranging from zero to one (calculated as a weighted-average of the ratio of the average benefit levels at the during the second, third, and fourth years of unemployment to the average benefit level during the first year of unemployment). The tax wedge is the sum, in percent terms, of the employment tax rate, the direct tax rate, and the indirect tax rate. Active labor market policies are measured as the share of GDP spent on ALMPs per percentage point of unemployment. All figures for OECD Europe are laborforce-weighted averages.
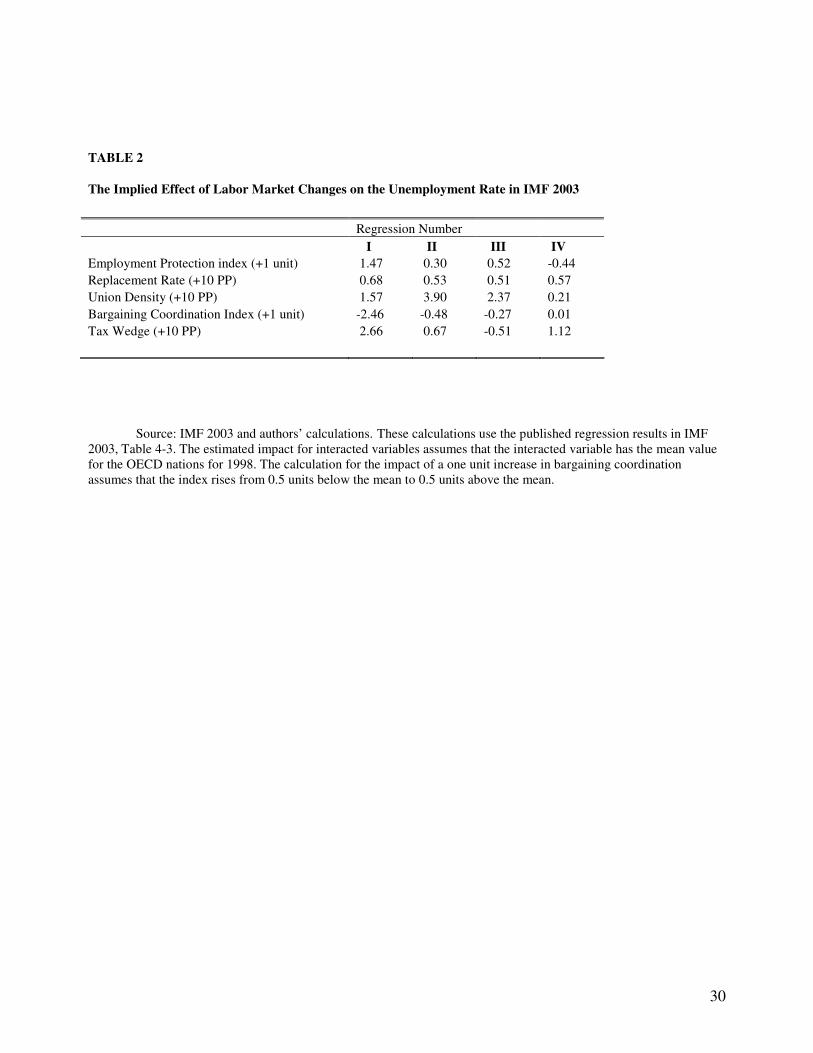
30
Source: IMF 2003 and authors’ calculations. These calculations use the published regression results in IMF 2003, Table 4-3. The estimated impact for interacted variables assumes that the interacted variable has the mean value for the OECD nations for 1998. The calculation for the impact of a one unit increase in bargaining coordination assumes that the index rises from 0.5 units below the mean to 0.5 units above the mean.
TABLE 2
The Implied Effect of Labor Market Changes on the Unemployment Rate in IMF 2003 Regression Number I II III IV Employment Protection index (+1 unit) 1.47 0.30 0.52 -0.44 Replacement Rate (+10 PP) 0.68 0.53 0.51 0.57 Union Density (+10 PP) 1.57 3.90 2.37 0.21 Bargaining Coordination Index (+1 unit) -2.46 -0.48 -0.27 0.01 Tax Wedge (+10 PP) 2.66 0.67 -0.51 1.12
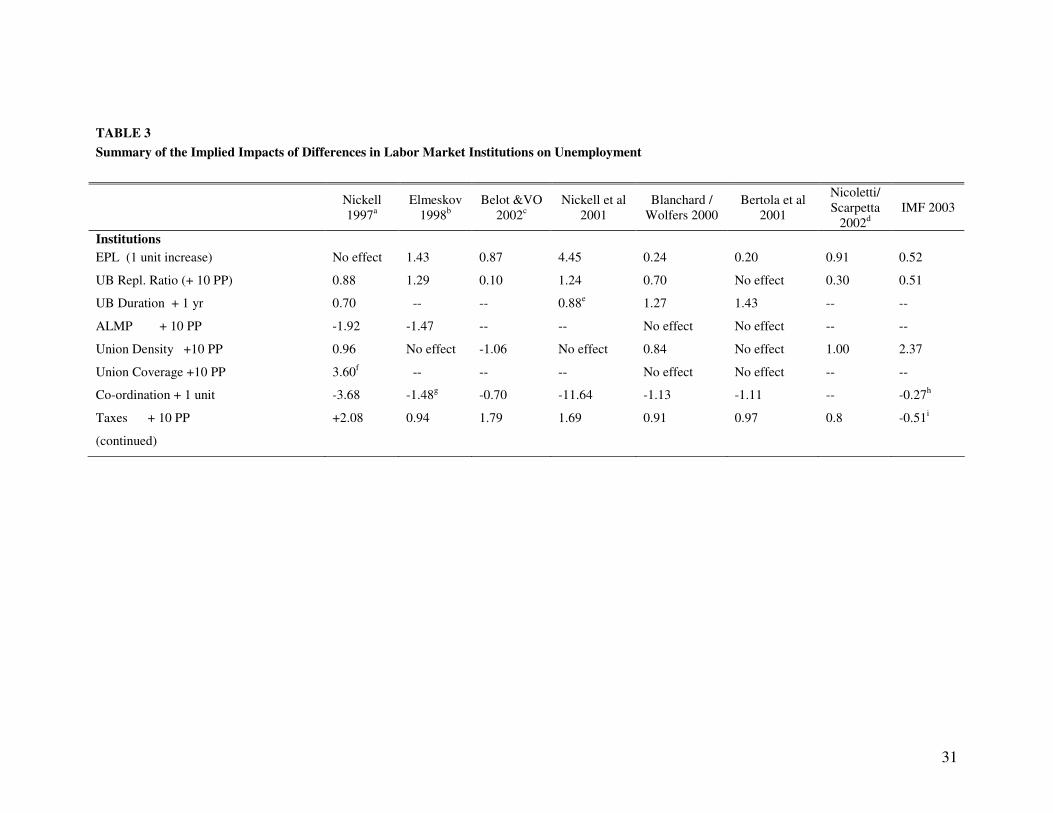
31
TABLE 3 Summary of the Implied Impacts of Differences in Labor Market Institutions on Unemployment
Nickell 1997a
Elmeskov 1998b
Belot &VO 2002c
Nickell et al 2001
Blanchard / Wolfers 2000
Bertola et al 2001
Nicoletti/ Scarpetta
2002d IMF 2003
Institutions EPL (1 unit increase) No effect 1.43 0.87 4.45 0.24 0.20 0.91 0.52
UB Repl. Ratio (+ 10 PP) 0.88 1.29 0.10 1.24 0.70 No effect 0.30 0.51
UB Duration + 1 yr 0.70 -- -- 0.88e 1.27 1.43 -- --
ALMP + 10 PP -1.92 -1.47 -- -- No effect No effect -- --
Union Density +10 PP 0.96 No effect -1.06 No effect 0.84 No effect 1.00 2.37
Union Coverage +10 PP 3.60f -- -- -- No effect No effect -- --
Co-ordination + 1 unit -3.68 -1.48g -0.70 -11.64 -1.13 -1.11 -- -0.27h
Taxes + 10 PP +2.08 0.94 1.79 1.69 0.91 0.97 0.8 -0.51i
(continued)
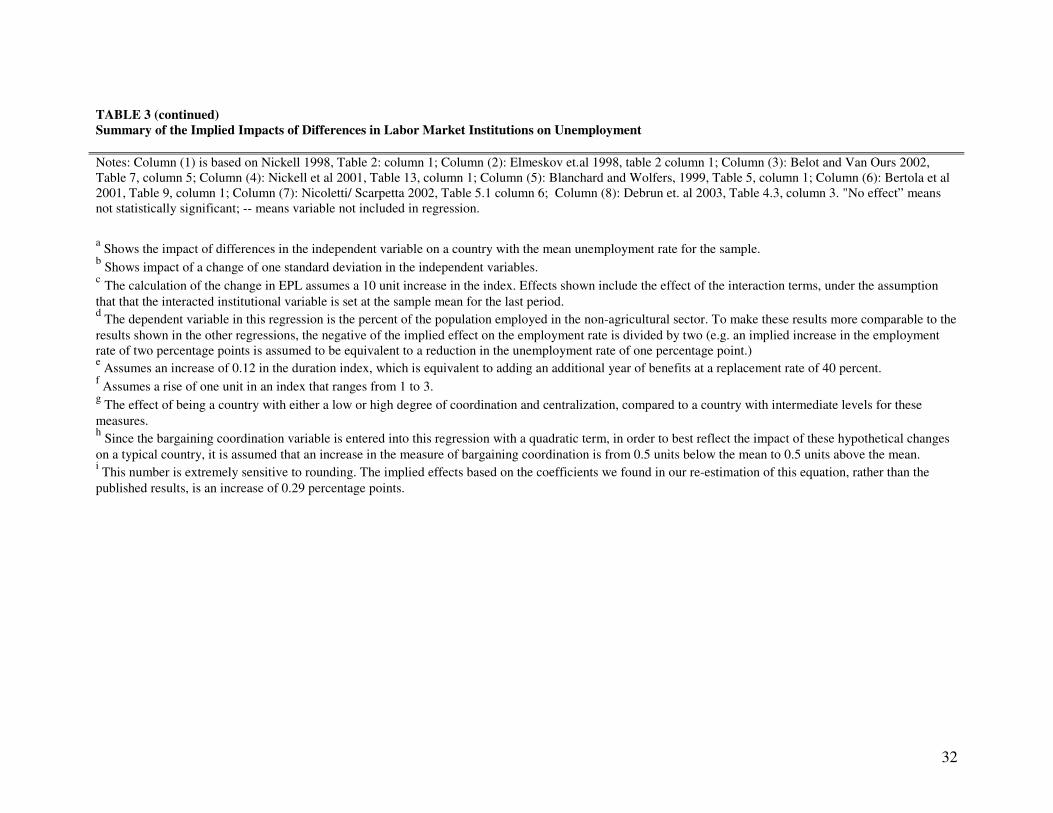
32
TABLE 3 (continued) Summary of the Implied Impacts of Differences in Labor Market Institutions on Unemployment Notes: Column (1) is based on Nickell 1998, Table 2: column 1; Column (2): Elmeskov et.al 1998, table 2 column 1; Column (3): Belot and Van Ours 2002, Table 7, column 5; Column (4): Nickell et al 2001, Table 13, column 1; Column (5): Blanchard and Wolfers, 1999, Table 5, column 1; Column (6): Bertola et al 2001, Table 9, column 1; Column (7): Nicoletti/ Scarpetta 2002, Table 5.1 column 6; Column (8): Debrun et. al 2003, Table 4.3, column 3. "No effect” means not statistically significant; -- means variable not included in regression. a Shows the impact of differences in the independent variable on a country with the mean unemployment rate for the sample. b Shows impact of a change of one standard deviation in the independent variables. c The calculation of the change in EPL assumes a 10 unit increase in the index. Effects shown include the effect of the interaction terms, under the assumption that that the interacted institutional variable is set at the sample mean for the last period. d The dependent variable in this regression is the percent of the population employed in the non-agricultural sector. To make these results more comparable to the results shown in the other regressions, the negative of the implied effect on the employment rate is divided by two (e.g. an implied increase in the employment rate of two percentage points is assumed to be equivalent to a reduction in the unemployment rate of one percentage point.) e Assumes an increase of 0.12 in the duration index, which is equivalent to adding an additional year of benefits at a replacement rate of 40 percent. f Assumes a rise of one unit in an index that ranges from 1 to 3. g The effect of being a country with either a low or high degree of coordination and centralization, compared to a country with intermediate levels for these measures. h Since the bargaining coordination variable is entered into this regression with a quadratic term, in order to best reflect the impact of these hypothetical changes on a typical country, it is assumed that an increase in the measure of bargaining coordination is from 0.5 units below the mean to 0.5 units above the mean. i This number is extremely sensitive to rounding. The implied effects based on the coefficients we found in our re-estimation of this equation, rather than the published results, is an increase of 0.29 percentage points.
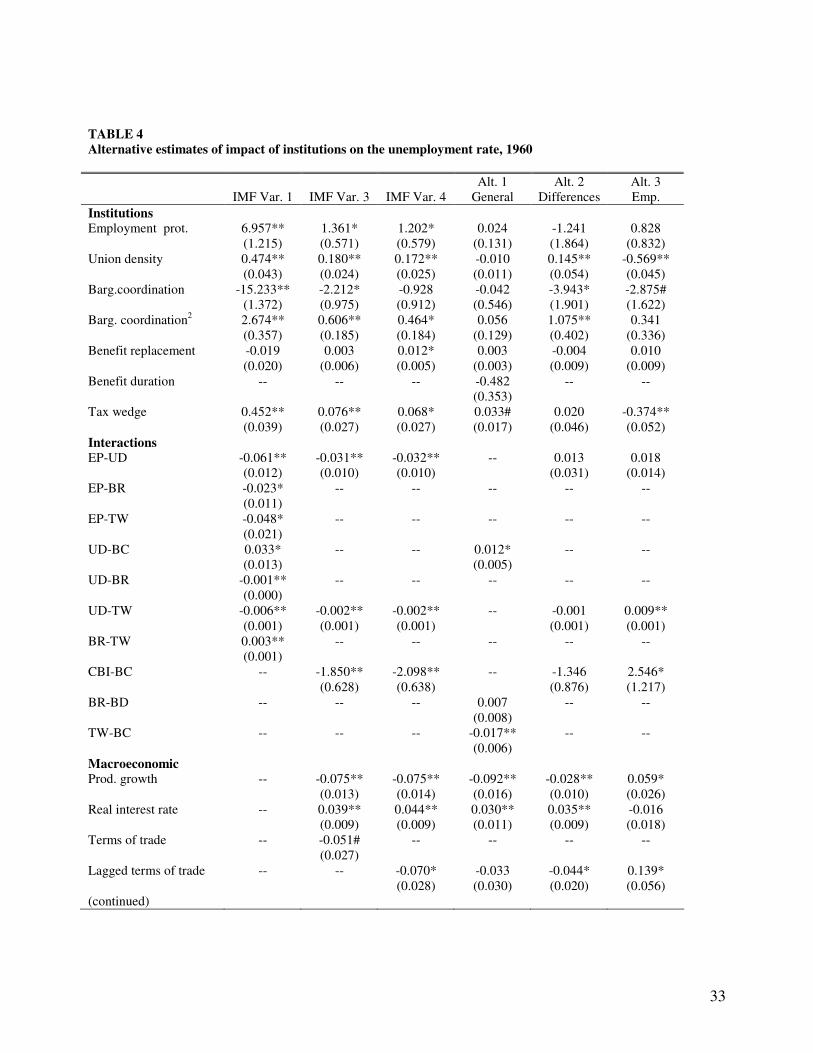
33
TABLE 4 Alternative estimates of impact of institutions on the unemployment rate, 1960 Alt. 1 Alt. 2 Alt. 3 IMF Var. 1 IMF Var. 3 IMF Var. 4 General Differences Emp. Institutions Employment prot. 6.957** 1.361* 1.202* 0.024 -1.241 0.828 (1.215) (0.571) (0.579) (0.131) (1.864) (0.832) Union density 0.474** 0.180** 0.172** -0.010 0.145** -0.569** (0.043) (0.024) (0.025) (0.011) (0.054) (0.045) Barg.coordination -15.233** -2.212* -0.928 -0.042 -3.943* -2.875# (1.372) (0.975) (0.912) (0.546) (1.901) (1.622) Barg. coordination2 2.674** 0.606** 0.464* 0.056 1.075** 0.341 (0.357) (0.185) (0.184) (0.129) (0.402) (0.336) Benefit replacement -0.019 0.003 0.012* 0.003 -0.004 0.010 (0.020) (0.006) (0.005) (0.003) (0.009) (0.009) Benefit duration -- -- -- -0.482 -- -- (0.353) Tax wedge 0.452** 0.076** 0.068* 0.033# 0.020 -0.374** (0.039) (0.027) (0.027) (0.017) (0.046) (0.052) Interactions EP-UD -0.061** -0.031** -0.032** -- 0.013 0.018 (0.012) (0.010) (0.010) (0.031) (0.014) EP-BR -0.023* -- -- -- -- -- (0.011) EP-TW -0.048* -- -- -- -- -- (0.021) UD-BC 0.033* -- -- 0.012* -- -- (0.013) (0.005) UD-BR -0.001** -- -- -- -- -- (0.000) UD-TW -0.006** -0.002** -0.002** -- -0.001 0.009** (0.001) (0.001) (0.001) (0.001) (0.001) BR-TW 0.003** -- -- -- -- -- (0.001) CBI-BC -- -1.850** -2.098** -- -1.346 2.546* (0.628) (0.638) (0.876) (1.217) BR-BD -- -- -- 0.007 -- -- (0.008) TW-BC -- -- -- -0.017** -- -- (0.006) Macroeconomic Prod. growth -- -0.075** -0.075** -0.092** -0.028** 0.059* (0.013) (0.014) (0.016) (0.010) (0.026) Real interest rate -- 0.039** 0.044** 0.030** 0.035** -0.016 (0.009) (0.009) (0.011) (0.009) (0.018) Terms of trade -- -0.051# -- -- -- -- (0.027) Lagged terms of trade -- -- -0.070* -0.033 -0.044* 0.139* (0.028) (0.030) (0.020) (0.056) (continued)
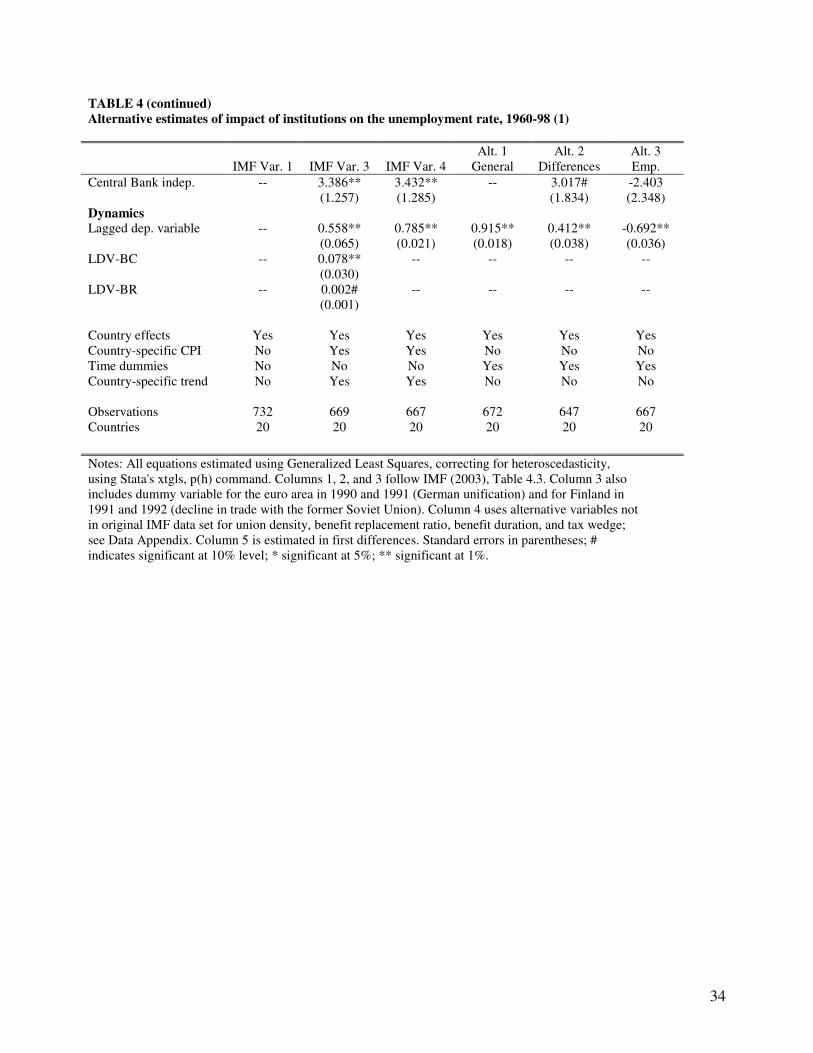
34
TABLE 4 (continued) Alternative estimates of impact of institutions on the unemployment rate, 1960-98 (1) Alt. 1 Alt. 2 Alt. 3 IMF Var. 1 IMF Var. 3 IMF Var. 4 General Differences Emp. Central Bank indep. -- 3.386** 3.432** -- 3.017# -2.403 (1.257) (1.285) (1.834) (2.348) Dynamics Lagged dep. variable -- 0.558** 0.785** 0.915** 0.412** -0.692** (0.065) (0.021) (0.018) (0.038) (0.036) LDV-BC -- 0.078** -- -- -- -- (0.030) LDV-BR -- 0.002# -- -- -- -- (0.001) Country effects Yes Yes Yes Yes Yes Yes Country-specific CPI No Yes Yes No No No Time dummies No No No Yes Yes Yes Country-specific trend No Yes Yes No No No Observations 732 669 667 672 647 667 Countries 20 20 20 20 20 20
Notes: All equations estimated using Generalized Least Squares, correcting for heteroscedasticity, using Stata's xtgls, p(h) command. Columns 1, 2, and 3 follow IMF (2003), Table 4.3. Column 3 also includes dummy variable for the euro area in 1990 and 1991 (German unification) and for Finland in 1991 and 1992 (decline in trade with the former Soviet Union). Column 4 uses alternative variables not in original IMF data set for union density, benefit replacement ratio, benefit duration, and tax wedge; see Data Appendix. Column 5 is estimated in first differences. Standard errors in parentheses; # indicates significant at 10% level; * significant at 5%; ** significant at 1%.
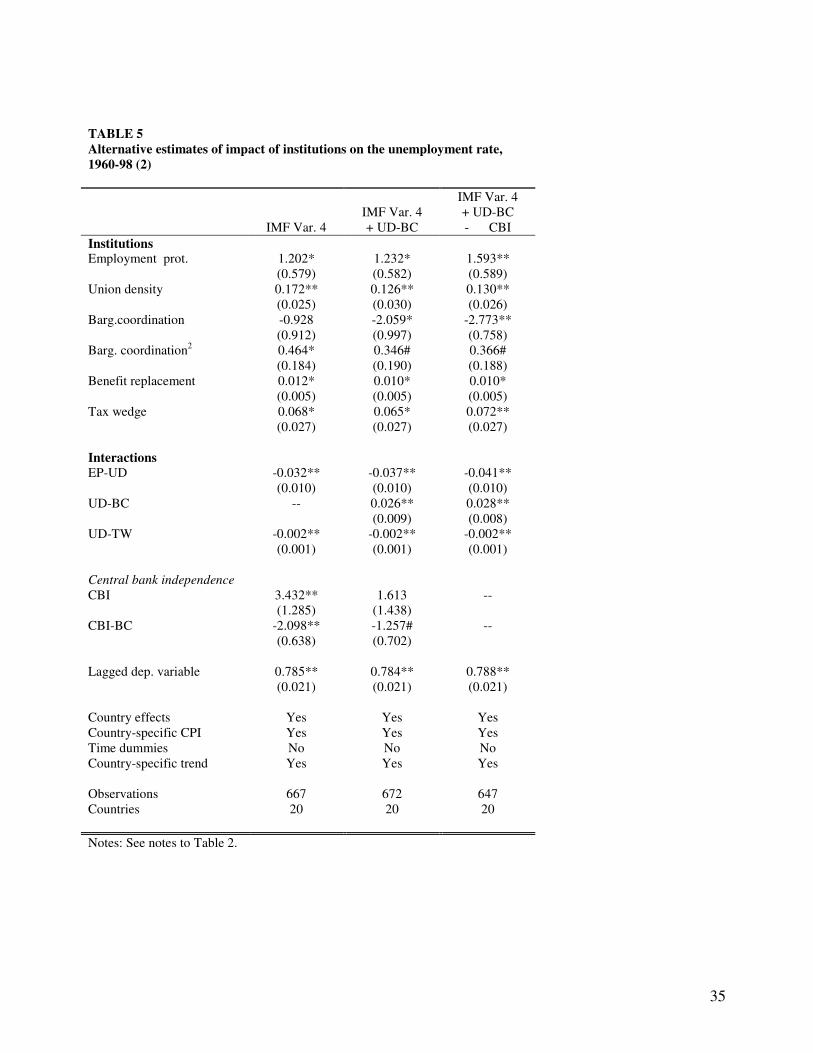
35
TABLE 5 Alternative estimates of impact of institutions on the unemployment rate, 1960-98 (2)
IMF Var. 4
IMF Var. 4 + UD-BC
IMF Var. 4 + UD-BC - CBI
Institutions Employment prot. 1.202* 1.232* 1.593** (0.579) (0.582) (0.589) Union density 0.172** 0.126** 0.130** (0.025) (0.030) (0.026) Barg.coordination -0.928 -2.059* -2.773** (0.912) (0.997) (0.758) Barg. coordination2 0.464* 0.346# 0.366# (0.184) (0.190) (0.188) Benefit replacement 0.012* 0.010* 0.010* (0.005) (0.005) (0.005) Tax wedge 0.068* 0.065* 0.072** (0.027) (0.027) (0.027) Interactions EP-UD -0.032** -0.037** -0.041** (0.010) (0.010) (0.010) UD-BC -- 0.026** 0.028** (0.009) (0.008) UD-TW -0.002** -0.002** -0.002** (0.001) (0.001) (0.001) Central bank independence CBI 3.432** 1.613 -- (1.285) (1.438) CBI-BC -2.098** -1.257# -- (0.638) (0.702) Lagged dep. variable 0.785** 0.784** 0.788** (0.021) (0.021) (0.021) Country effects Yes Yes Yes Country-specific CPI Yes Yes Yes Time dummies No No No Country-specific trend Yes Yes Yes Observations 667 672 647 Countries 20 20 20 Notes: See notes to Table 2.

36
TABLE 6 Alternative estimates of impact of institutions on the unemployment rate, 1990-98 (3) Periods
1990-94, 1995-98
1990-94, 1995-98
Employment protection -1.464 -1.957 (1.843) (2.366) Union density 0.012 0.034 (0.048) (0.052) Bargaining coordination 0.733 0.392 (1.463) (1.643) Benefit replacement 0.034 0.006 (0.056) (0.056) Tax wedge 0.041 0.003 (0.083) (0.095) Benefit duration -- -2.197 (3.430) Union coverage -- 1.821 (2.797) ALMP (instrumented) -- -.644 (1.791) Change in CPI -1.070 -1.016 (0.739) (0.760) Period dummy 1995-98 0.360 0.550 (0.508) (0.535) Observations 40 39 Countries 20 20 Notes: Variables are separate country averages over all available data for the periods 1990-94 and 1995-98. All regressions estimated using Generalized Least Squares, random effects (Stata's xtreg, re command). Standard errors in parentheses # significant at 10%; * significant at 5%; ** significant at 1%.
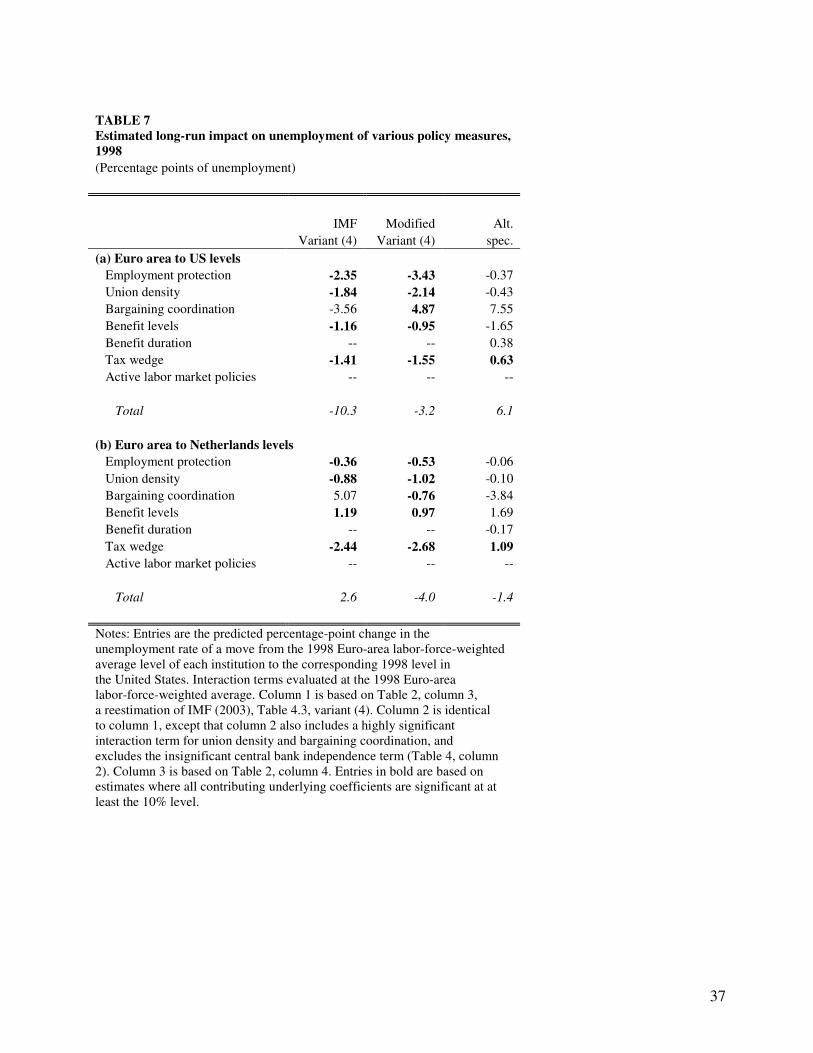
37
TABLE 7 Estimated long-run impact on unemployment of various policy measures, 1998 (Percentage points of unemployment)
IMF Modified Alt. Variant (4) Variant (4) spec. (a) Euro area to US levels Employment protection -2.35 -3.43 -0.37 Union density -1.84 -2.14 -0.43 Bargaining coordination -3.56 4.87 7.55 Benefit levels -1.16 -0.95 -1.65 Benefit duration -- -- 0.38 Tax wedge -1.41 -1.55 0.63 Active labor market policies -- -- -- Total -10.3 -3.2 6.1 (b) Euro area to Netherlands levels Employment protection -0.36 -0.53 -0.06 Union density -0.88 -1.02 -0.10 Bargaining coordination 5.07 -0.76 -3.84 Benefit levels 1.19 0.97 1.69 Benefit duration -- -- -0.17 Tax wedge -2.44 -2.68 1.09 Active labor market policies -- -- -- Total 2.6 -4.0 -1.4 Notes: Entries are the predicted percentage-point change in the unemployment rate of a move from the 1998 Euro-area labor-force-weighted average level of each institution to the corresponding 1998 level in the United States. Interaction terms evaluated at the 1998 Euro-area labor-force-weighted average. Column 1 is based on Table 2, column 3, a reestimation of IMF (2003), Table 4.3, variant (4). Column 2 is identical to column 1, except that column 2 also includes a highly significant interaction term for union density and bargaining coordination, and excludes the insignificant central bank independence term (Table 4, column 2). Column 3 is based on Table 2, column 4. Entries in bold are based on estimates where all contributing underlying coefficients are significant at at least the 10% level.

38
TABLE 8 Estimated long-run impact on unemployment of policy measures, country-specific results, 1998 (Percentage points unemployment) IMF Modified Alternative Variant (4) Variant (4) specification (a) France to US levels Employment protection -5.71 -7.76 -0.39 Union density 0.29 0.10 0.51 Bargaining coordination -1.06 4.95 7.52 Benefit levels -1.69 -1.38 -2.33 Benefit duration -- -- 0.13 Tax wedge -5.00 -5.35 -7.96 Active labor market policies -- -- -- Total -13.2 -9.4 -2.5 (b) Germany to US levels Employment protection -2.55 -3.67 -0.37 Union density -1.81 -2.45 -2.65 Bargaining coordination -4.86 5.75 8.85 Benefit levels -0.40 -0.33 -0.74 Benefit duration -- -- 1.40 Tax wedge -1.30 -1.42 -3.64 Active labor market policies -- -- -- Total -10.9 -2.1 2.9 (c) Netherlands to US levels Employment protection -2.93 -4.11 -0.31 Union density -2.00 -2.85 -2.00 Bargaining coordination -8.64 7.08 5.54 Benefit levels -2.35 -1.91 -3.79 Benefit duration -- -- -0.20 Tax wedge 1.34 1.46 3.05 Active labor market policies -- -- -- Total -14.6 -0.3 2.3 Notes: See notes to Table 5.
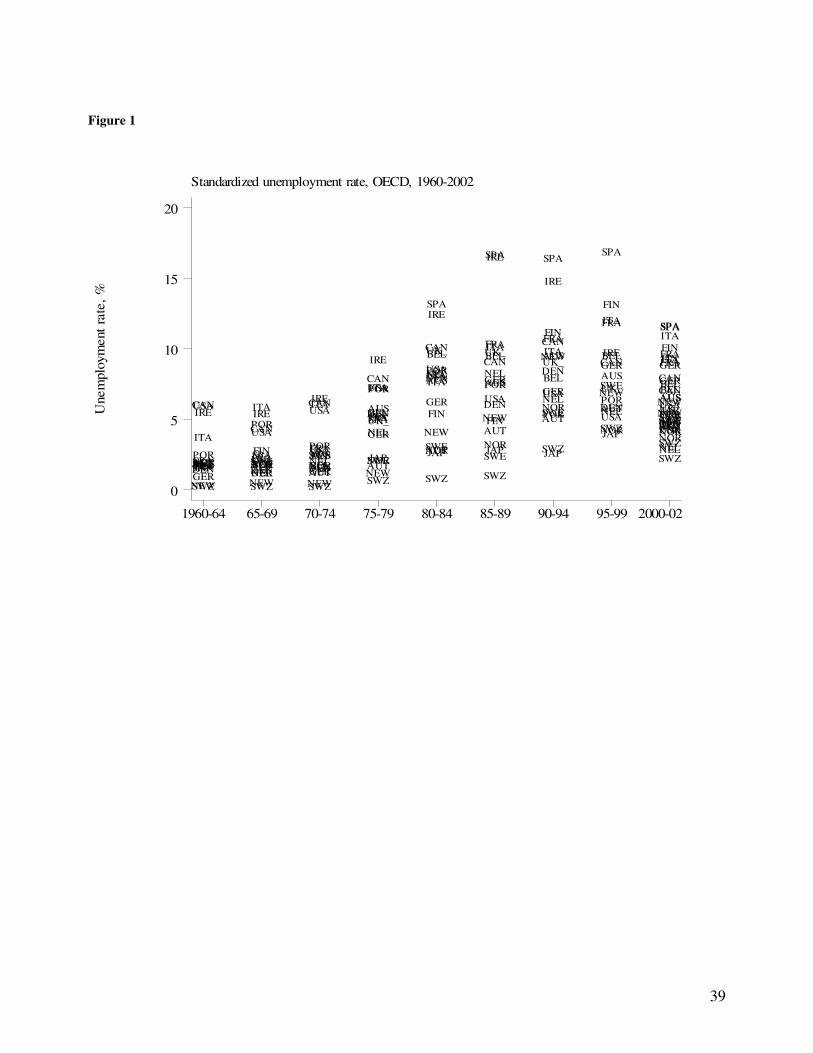
39
Figure 1
Standardized unemployment rate, OECD, 1960-2002
Une
mpl
oym
ent r
ate,
%
1960-64 65-69 70-74 75-79 80-84 85-89 90-94 95-99 2000-02
0
5
10
15
20
AUS
AUT
BELCAN
DEN
FINFRAGER
IRE
ITA
JAP
NEL
NEW
NOR
POR
SPA
SWE
SWZ
UK_USA
AUS AUSAUS
AUS
AUS AUS
AUS
AUS
AUS
AUT AUTAUT
AUTAUT
AUTAUT
AUTAUT
BEL BEL BEL
BEL
BEL BEL
BEL
BEL
BELCAN
CAN
CAN
CAN
CANCAN
CAN
CAN
CAN
DEN DEN DEN
DEN
DEN
DEN
DEN
DEN
DEN
FIN
FIN FIN
FIN FINFIN
FIN
FIN
FIN
FRAFRA
FRA
FRA
FRA
FRA FRA
FRA
FRA
GER GER GER
GER
GER
GERGER
GER
GER
IRE IREIRE
IRE
IRE
IRE
IRE
IRE
IREITA
ITA ITA
ITA ITA
ITA ITA
ITAITA
JAP JAP JAPJAP JAP JAP JAP
JAPJAP
NELNEL
NEL
NEL NEL
NELNEL
NEL
NEW NEW NEWNEW
NEWNEW
NEW
NEWNEW
NOR NOR NOR NORNOR NOR
NOR
NORNOR
POR
POR
POR
POR
PORPOR
PORPOR
POR
SPA SPA SPA
SPA
SPA
SPA SPASPA
SPA
SWE SWESWE SWE
SWESWE
SWE
SWE
SWE
SWZ SWZ SWZ SWZ SWZ SWZ
SWZ
SWZ
SWZUK_ UK_UK_
UK_
UK_ UK_UK_
UK_
UK_USA
USA
USA
USA
USA
USA USA
USAUSA
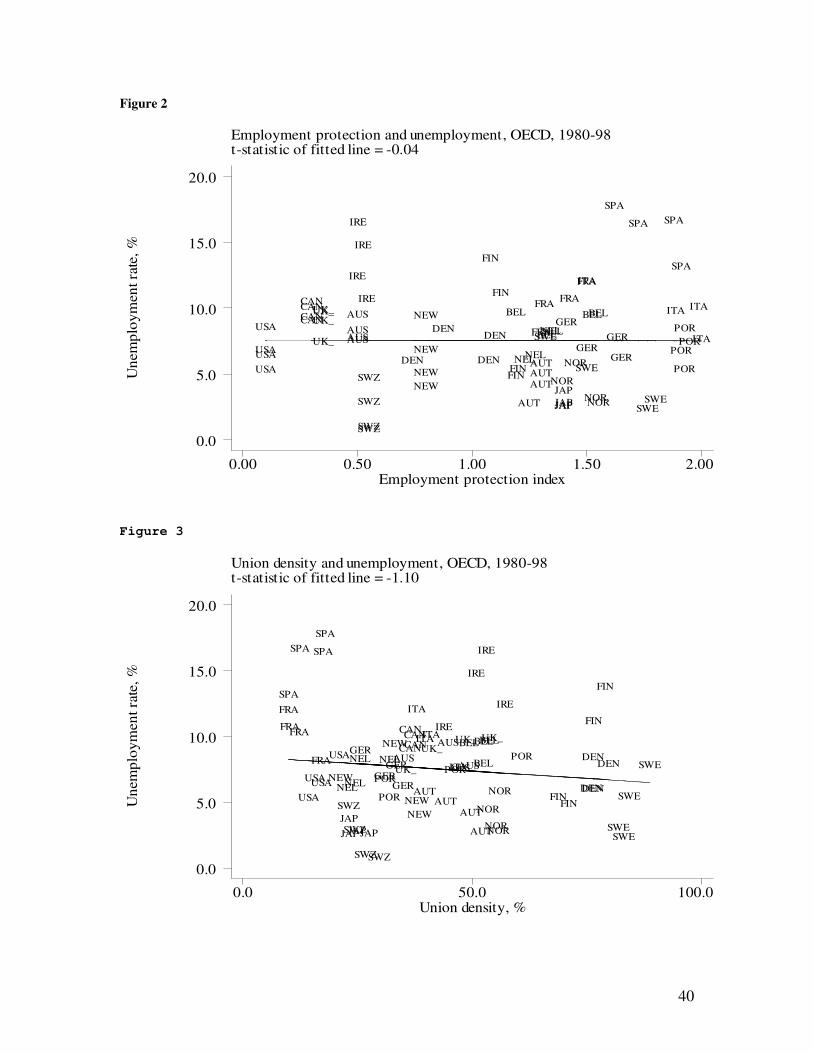
40
Figure 2
Employment protection and unemployment, OECD, 1980-98t-statistic of fitted line = -0.04
Une
mpl
oym
ent r
ate,
%
Employment protection index0.00 0.50 1.00 1.50 2.00
0.0
5.0
10.0
15.0
20.0
AUSAUS
AUS
AUS
AUT
AUTAUTAUT
BELBEL
BEL
BELCANCAN
CANCAN
DEN
DEN
DEN
DENFINFIN
FIN
FIN
FRA
FRA FRA
FRA
GER
GERGER
GER
IRE
IRE
IRE
IRE
ITA
ITAITA
ITA
JAPJAPJAPJAP
NELNEL
NELNEL
NEWNEW
NEW
NEW
NORNOR
NOR
NOR
PORPOR
POR
POR
SPA
SPASPA
SPA
SWESWE
SWE
SWE
SWZSWZ
SWZ
SWZ
UK_UK_UK_
UK_USA
USAUSA
USA
Figure 3
Union density and unemployment, OECD, 1980-98t-statistic of fitted line = -1.10
Une
mpl
oym
ent r
ate,
%
Union density, %0.0 50.0 100.0
0.0
5.0
10.0
15.0
20.0
AUSAUS
AUS
AUS
AUT
AUTAUT
AUT
BELBEL
BEL
BELCANCAN
CANCAN
DEN
DEN
DEN
DENFIN
FIN
FIN
FIN
FRA
FRAFRA
FRA
GER
GERGER
GER
IRE
IRE
IRE
IRE
ITA
ITAITA
ITA
JAPJAPJAPJAP
NELNEL
NELNEL
NEWNEW
NEW
NEW
NORNOR
NOR
NOR
PORPOR
POR
POR
SPA
SPA SPA
SPA
SWESWE
SWE
SWE
SWZSWZ
SWZ
SWZ
UK_UK_UK_
UK_USA
USAUSA
USA
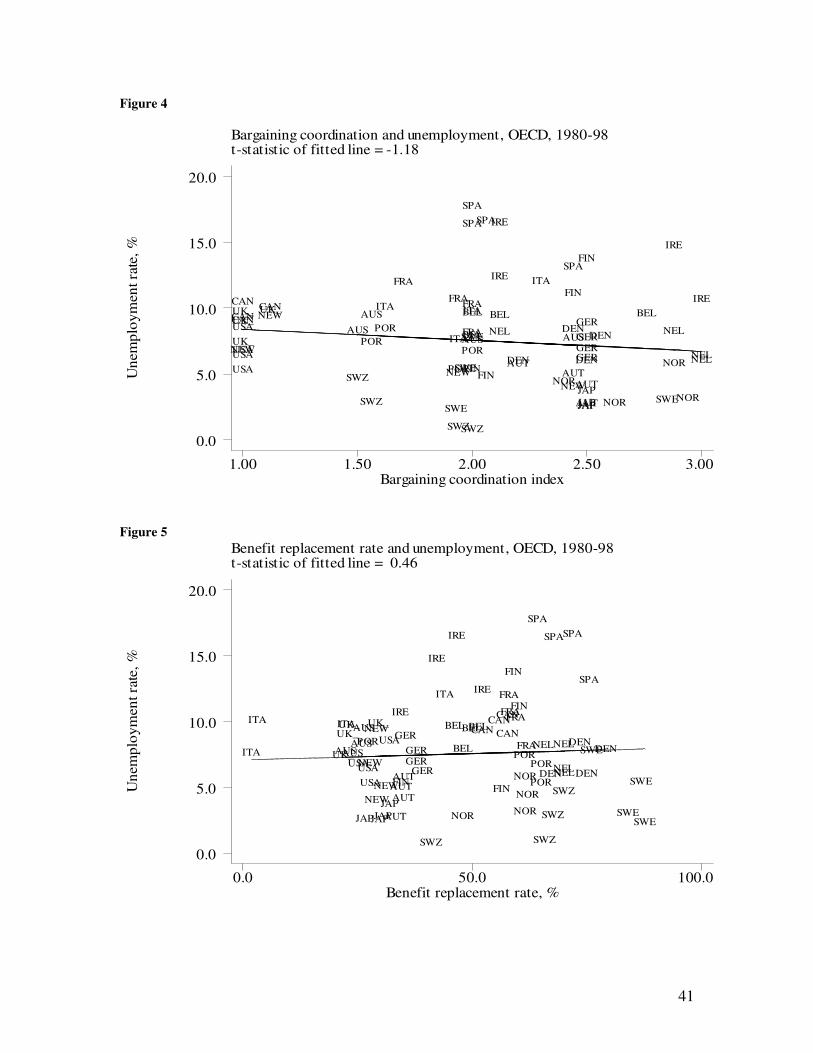
41
Figure 4
Bargaining coordination and unemployment, OECD, 1980-98t-statistic of fitted line = -1.18
Une
mpl
oym
ent r
ate,
%
Bargaining coordination index1.00 1.50 2.00 2.50 3.00
0.0
5.0
10.0
15.0
20.0
AUSAUS
AUS
AUS
AUT
AUTAUT
AUT
BELBEL
BEL
BELCANCAN
CANCAN
DEN
DEN
DEN
DENFIN
FIN
FIN
FIN
FRA
FRAFRA
FRA
GER
GERGER
GER
IRE
IRE
IRE
IRE
ITA
ITA ITA
ITA
JAPJAPJAPJAP
NEL NEL
NELNEL
NEWNEW
NEW
NEW
NOR NOR
NOR
NOR
PORPOR
POR
POR
SPA
SPASPA
SPA
SWESWE
SWE
SWE
SWZSWZ
SWZ
SWZ
UK_UK_UK_
UK_USA
USAUSA
USA
Figure 5
Benefit replacement rate and unemployment, OECD, 1980-98t-statistic of fitted line = 0.46
Une
mpl
oym
ent r
ate,
%
Benefit replacement rate, %0.0 50.0 100.0
0.0
5.0
10.0
15.0
20.0
AUSAUS
AUS
AUS
AUT
AUTAUTAUT
BELBEL
BEL
BEL CANCAN
CANCAN
DEN
DEN
DEN
DENFIN
FIN
FIN
FIN
FRA
FRAFRA
FRA
GER
GERGER
GER
IRE
IRE
IRE
IRE
ITA
ITA ITA
ITA
JAPJAPJAPJAP
NELNEL
NELNEL
NEWNEW
NEW
NEW
NOR NOR
NOR
NOR
PORPOR
POR
POR
SPA
SPASPA
SPA
SWESWE
SWE
SWE
SWZ SWZ
SWZ
SWZ
UK_UK_UK_
UK_USA
USAUSA
USA
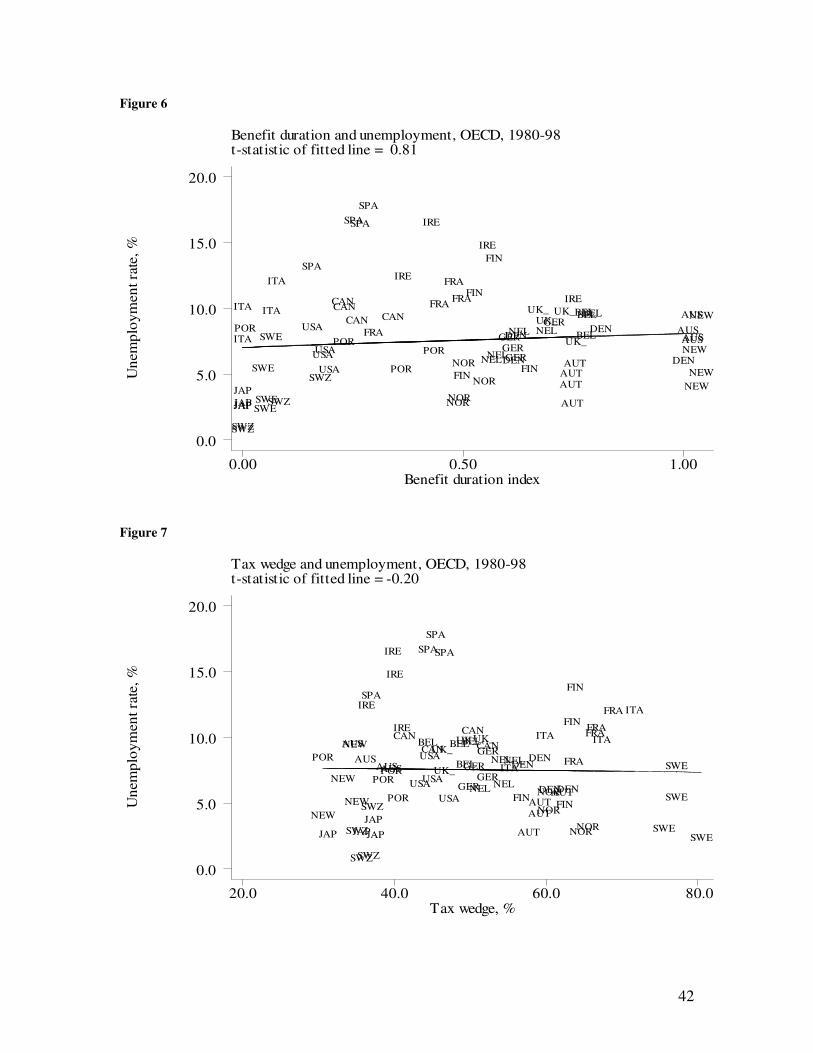
42
Figure 6
Benefit duration and unemployment, OECD, 1980-98t-statistic of fitted line = 0.81
Une
mpl
oym
ent r
ate,
%
Benefit duration index0.00 0.50 1.00
0.0
5.0
10.0
15.0
20.0
AUSAUS
AUS
AUS
AUT
AUTAUTAUT
BELBEL
BEL
BELCANCAN
CANCAN
DEN
DEN
DEN
DENFIN
FIN
FIN
FIN
FRA
FRA FRA
FRA
GER
GERGER
GER
IRE
IRE
IRE
IRE
ITA
ITA ITA
ITA
JAPJAPJAPJAP
NEL NEL
NELNEL
NEWNEW
NEW
NEW
NORNOR
NOR
NOR
PORPOR
POR
POR
SPA
SPASPA
SPA
SWESWE
SWE
SWE
SWZSWZ
SWZ
SWZ
UK_ UK_UK_
UK_USA
USAUSA
USA
Figure 7
Tax wedge and unemployment, OECD, 1980-98t-statistic of fitted line = -0.20
Une
mpl
oym
ent r
ate,
%
Tax wedge, %20.0 40.0 60.0 80.0
0.0
5.0
10.0
15.0
20.0
AUSAUS
AUS
AUS
AUT
AUTAUT
AUT
BEL BEL
BEL
BELCANCAN
CANCAN
DEN
DEN
DEN
DENFIN
FIN
FIN
FIN
FRA
FRAFRA
FRA
GER
GERGER
GER
IRE
IRE
IRE
IRE
ITA
ITA ITA
ITA
JAP JAPJAPJAP
NELNEL
NELNEL
NEWNEW
NEW
NEW
NORNOR
NOR
NOR
PORPOR
POR
POR
SPA
SPASPA
SPA
SWESWE
SWE
SWE
SWZSWZ
SWZ
SWZ
UK_UK_UK_
UK_USA
USAUSA
USA
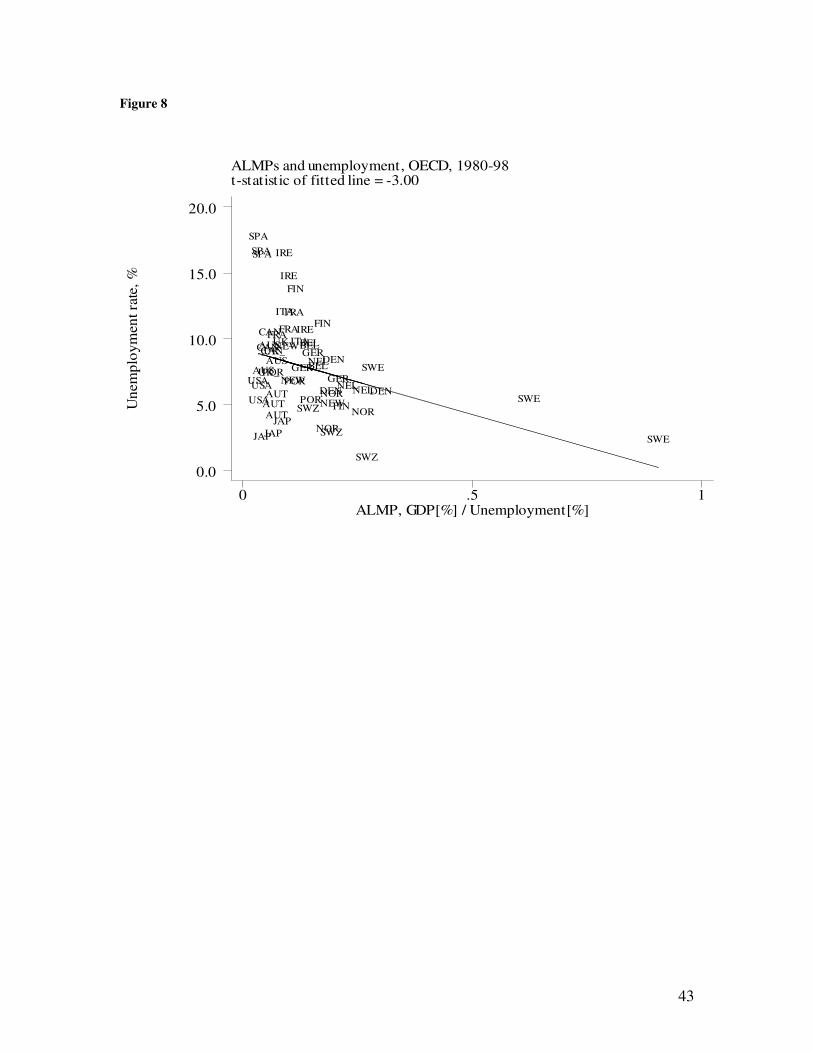
43
Figure 8
ALMPs and unemployment, OECD, 1980-98t-statistic of fitted line = -3.00
Une
mpl
oym
ent r
ate,
%
ALMP, GDP[%] / Unemployment[%]0 .5 1
0.0
5.0
10.0
15.0
20.0
AUS
AUS
AUS
AUTAUTAUT
BEL
BEL
BELCAN
CANCAN
DEN
DEN
DENFIN
FIN
FIN
FRAFRA
FRA
GERGER
GER
IRE
IRE
IREITA
ITA
JAPJAPJAP
NEL
NELNELNEW
NEW
NEW
NOR
NOR
NOR
POR
POR
POR
SPASPA
SPA
SWE
SWE
SWE
SWZ
SWZ
SWZ
UK_UK_
UK_USAUSA
USA
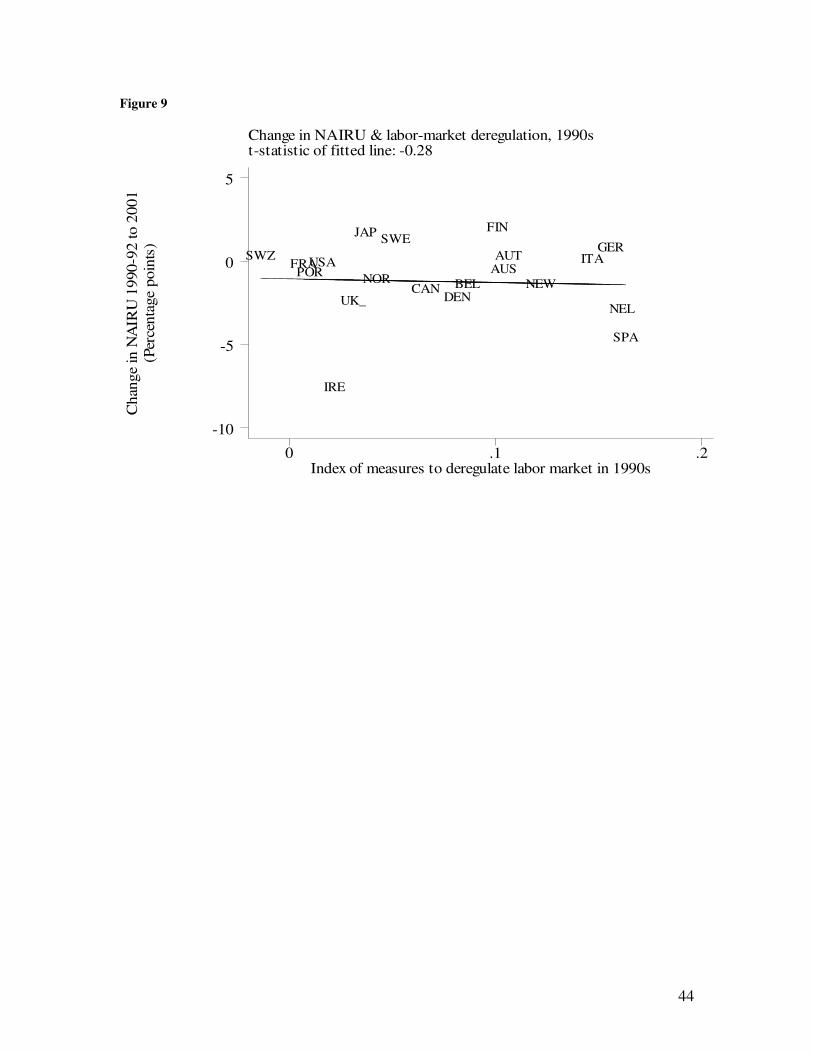
44
Figure 9
Change in NAIRU & labor-market deregulation, 1990st-statistic of fitted line: -0.28
Cha
nge
in N
AIR
U 1
990-
92 to
200
1(P
erce
ntag
e po
ints
)
Index of measures to deregulate labor market in 1990s
0 .1 .2
-10
-5
0
5
AUSAUT
BELCANDEN
FRA
FIN
GER
IRE
ITA
JAP
NEL
NEWNORPOR
SPA
SWESWZ
UK_
USA